
Abstract
Although radiolabeled somatostatin analogs have become highly prevalent in the diagnosis and treatment of somatostatin receptor subtype (sst)-positive tumors, there are relatively few options with respect to sst-positive tumor cell lines and animal models. It would be highly beneficial, particularly for therapeutic purposes, to have several clones of one human sst2-positive cell line that express a range of sst2 concentrations for evaluating the dose response and intracellular processing of radiolabeled somatostatin analogs. The human non–small cell lung cancer line A-427 was stably transfected with a hemagglutinin-tagged human sst2. Expression of the receptor was evaluated in vitro using flow cytometry, saturation binding analysis, internalization assays, and quantitative polymerase chain reaction. The receptor expression was also validated in an in vivo mouse model in biodistribution and micro–positron emission tomography (microPET) studies using the somatostatin analog octreotide (OC), which was linked to the 64Cu chelator 1,4,8,11-tetraazacyclotetradecane-1,4,8,11-tetraacetic acid (TETA), or 64Cu-TETA-OC. Stable clones were isolated, and four clones (2, 4, 5, and 7) were chosen for further examination. In vitro assays showed that clone 4 had no expression of sst2, whereas the others had various levels in the order of 7 > 2 > 5. Biodistribution studies with 64Cu-TETA-OC showed the same rank order, with tumor uptake of the clones ranging from 0.8 to 6.5% injected dose/g. These studies showed that there was a strong correlation among the in vitro assays and between the in vitro assays and the biodistribution. MicroPET confirmed significant uptake of 64Cu-TETA-OC in clone 7 and background uptake in clone 4. These studies show that clones of a human cell line can be produced expressing various levels of sst2 that should be useful for the future evaluation of radiolabeled somatostatin analogs.
OF THE FIVE HUMAN SOMATOSTATIN RECEPTOR SUBTYPES (sst1, sst2, sst3, sst4, and sst5), sst2 has been most widely targeted for the imaging of somatostatin receptor–positive tumors.1,2 sst2 has been found to be expressed in a variety of tumors, such as medullary thyroid carcinomas, small and non–small cell lung carcinomas, breast tumors, brain tumors, and in various pancreatic lesions, including gastrinomas, insulinomas, and carcinoids.3,4 Additionally, the development of somatostatin analogs that can be easily radiolabeled has furthered the ability to noninvasively image sst2-positive tumors. Currently, most sst2 imaging is accomplished using gamma scintigraphy, or single photon emission computed tomography, using various radiolabeled somatostatin analogs. In this regard, the US Food and Drug Administration has approved indium-111—diethylenetriamine pentaacetic acid–octreotide (Octreoscan) and technetium-99m-P829 (Neotect) for imaging of neuroendocrine and lung tumors, respectively. More recently, there has been an interest in labeling of somatostatin analogs with positron emitters for imaging with positron emission tomography (PET).5–7 Prior to the clinical evaluation of new radiolabeled somatostatin analogs, these analogs must be evaluated in vitro and in preclinical animal models.
In vitro evaluation of radiolabeled somatostatin analogs primarily consists of determining their sst2 affinity, internalization into cells, and efflux out of cells. Similarly, in vivo evaluation consists of uptake in sst2-positive tumors in rodent models as determined by biodistribution and/or imaging studies. To date, most of these studies have been performed in the rat pancreatic cell lines AR42J8–10 and CA20948,11–13 but some studies have used human cell lines.14–18 Although it is assumed that uptake of radiolabeled somatostatin analogs into sst2-positive cells in vitro and in vivo correlates with receptor expression, to our knowledge, this has yet to be explicitly shown. Clones of a single human cell line that express various levels of sst2 would have utility for evaluating radiolabeled analogs as potential imaging agents or the dose response of therapeutic analogs. Although the homology between human and rat somatostatin receptors is ≈95%, differences between rat and human cells with regard to intracellular radiometal trafficking may affect the retention and biodistribution of radiometals used in the somatostatin analogs. Therefore, the in vitro and in vivo accumulation and retention of radiometals from somatostatin analogs in a human cell line that expresses sst2 should more closely represent what would occur in a clinical setting than evaluation in rat cells.
In the present study, we developed a human carcinoma cell line that stably expresses various levels of sst2 and characterized it both in vitro and in vivo. In vitro analysis of sst2 expression was performed by flow cytometry, saturation binding assays, internalization assays, and quantitative polymerase chain reaction (QPCR). In vivo biodistribution and microPET analysis was conducted with the somatostatin analog 1,4,8,11-tetraazacyclotetra-decane-1,4,8,11-tetraacetic acid–octreotide (TETA-OC), labeled with 64Cu. These studies demonstrate a strong correlation between the in vitro and in vivo expression of sst2 and imply that these cells will be valuable for evaluating the dose response and intracellular metabolism of radiolabeled somatostatin analogs. Additionally, these transfected cells behave similarly to native sst2-expressing cell lines, such as AR42J, with respect to their radiolabeled somatostatin ligand-receptor interactions (binding affinity, internalization, etc.).
Materials and Methods
Cell Lines
Human non–small cell lung A-427 cells (American Type Culture Collection, Rockville, MD) were transfected with the hemagglutinin (HA)-expression plasmid, pα+12CA5-KH, 19 containing the sst2 gene, 20 using SuperFect Transfection reagent (Qiagen, Valencia, CA), according to the manufacturer's instructions. Transfected cells were selectively grown in the presence of 0.5 mg/mL G418 (Geneticin, Invitrogen, Carlsbad, CA) for 10 days, and then clones were harvested. Of the clones screened, four were chosen based on preliminary fluorescence-activated cell sorter (FACS) analysis and Scatchard binding analysis, and these were designated as A-427 clones 2, 4, 5, and 7. The clones were maintained in Earle's Minimal Essential Medium containing 0.1 mM nonessential amino acids, 1 mM sodium pyruvate, 10% (v/v) of heat-inactivated fetal bovine serum (FBS), and 0.5 mg/mL G418. The cells were cultured in a humidified incubator at 37°C with 5% CO2. All of the media components except FBS were obtained from Gibco-Invitrogen (Carlsbad, CA), with FBS from Sigma Chemical Company (St. Louis, MO).
Flow Cytometry
sst2 expression in A-427 clones was examined using flow cytometry against the HA epitope inserted into sst2. Approximately 1 × 10⁶ cells in duplicate of each stable transfectant were incubated with and without 5 μg of mouse monoclonal anti-HA antibody (Covance, Madison, WI) in 1 mL of media at 0°C. After a 1-hour incubation, the cells were washed and resuspended in 1 mL of media, to which 10 μg of fluorescein-labeled goat antimouse secondary antibody (Kirkegaard & Perry Laboratories, Gaithersburg, MD) was added for 1-hour incubation at 0°C. The cells were washed and resuspended in 1 mL of phosphate buffered saline. The fluorescence was measured using a FACS 440 flow cytometer (Becton Dickinson, San Jose, CA). The fluorochrome was excited with 300 mW at 488 nm from an argon laser, and fluorescence was detected through a 525 nm bandpass filter. Following logarithmic amplification, a minimum of 20,000 events was recorded per specimen in list mode using a personal computer (PC)-based CICERO/CYCLOPS data acquisition/analysis system (CYTOMATION, Ft. Collins, CO). Fluorescence intensity of only intact cells was assessed by gating out debris using forward light scatter signal. The results are presented as mean fluorescent units (MFU).
Radiolabeling of TETA-OC
64Cu (half-time = 12.7 hours, β+, 0.656 MeV, 17.4%; β−, 0.573 MeV, 41%) was produced on a CS-15 cyclotron at Washington University (St. Louis, MO) as previously described. 21 TETA-OC (molecular weight = 1,433 Da) was synthesized and radiolabeled with 64Cu as previously described. 22 The radiochemical purity was determined by radio-thin layer chromatography using Whatman MKC18F reversed-phase plates with 10% ammonium acetate:methanol (30:70) as the mobile phase, and the detection was performed on a BioScan Imaging Scanner (Washington, DC). The specific activities of the 64Cu-TETA-OC for the internalization assays and biodistributions were 32.8 ± 7.0 and 42.5 ± 6.6 MBq/nmol (887 ± 188 and 1,148 ± 178 Ci/mmol), respectively, and the purity of the 64Cu-TETA-OC was > 95% in all of the assays.
Saturation Binding Assay
Membrane preparations for binding assays were prepared as previously described. 23 Membrane preparations were thawed and diluted in binding buffer (50 mM Tris-HCl, pH 7.4, 5 mM MgCl2·6H2O, 0.1% bovine serum albumin (BSA), 0.5 μg/mL aprotinin, 200 μg/mL bacitracin, 10 μg/mL leupeptin, and 10 μg/mL pepstatin), and a defined amount of protein (20 μg for clones 2 and 5 and 5 μg for clone 7) was incubated for 2 hours at room temperature with 64Cu-TETA-OC (0.005–20 nM) in a total volume of 250 μL on a 96-well Multiscreen Durapore filtration plate (Millipore, Bedford, MA). After the incubation, the medium was removed with a vacuum manifold and the membranes were washed twice with 200 μL binding buffer. Twenty-five microliters of OptiPhase ‘Super-Mix’ (PerkinElmer, Boston, MA) was added to each well, and bound activity was measured with a 1450 Microbeta liquid scintillation and luminescence counter (PerkinElmer). Nonspecific binding was determined by conducting the assay in the presence of an excess (200 nM) of unlabeled TETA-OC or plain OC. Specific binding was obtained by subtraction of nonspecific binding from total binding. Maximum binding capacities (Bmax) were estimated from nonlinear curve fitting of the specific binding versus the concentration of 64Cu-TETA-OC using Prism (GraphPad, San Diego, CA) software and the one-site binding hyperbola equation provided.
Internalization Assay
A-427 stable clones were plated into four six-well plates per clone at 5 × 10⁵ cells per well. On the following day, the cells were washed with Hank's Balanced Salt Solution (HBSS), and 1 mL of internalization media (Dulbecco's Modified Eagle's Medium plus 30 mM HEPES, 2 mM L-glutamine, 1 mM sodium pyruvate, and 1% BSA) was added to each well. To three of the six wells per plate, 10 μg of [Tyr1]somatostatin-14 (Sigma) was added to act as a blocking reagent against internalization. To each well, 10 μL of 64Cu-TETA-OC was added such that the final concentration of peptide was approximately 1 nM, and the plates were incubated at 37°C for either 30, 60, 120, or 240 minutes. At each time point, the radioactive media was aspirated, and the cells were washed with cold HBSS. This was followed by an acid wash (HBSS plus 20 mM sodium acetate, pH 4.0), which was collected for the determination of surface-bound 64Cu-TETA-OC. Immediately after collection of the acid wash, 1 mL of 10 mM sodium borate/0.1% sodium dodecyl sulfate was added to the wells and allowed to incubate for 2 to 3 minutes at room temperature to facilitate cell lysis. The internalized fraction lysates were collected and, along with the surface fractions, were counted on a gamma counter. Cells were counted using a hemacytometer in a separate set of plates in which all of the steps were followed, but no radioactivity was added. The data are presented as fmol of internalized radioactivity normalized to 1 × 10⁶ cells based on the mean of three independent assays. Maximum internalizations were determined from nonlinear curve fitting of the specific internalized 64Cu-TETA-OC versus time using Prism software and the one-site binding hyperbola equation provided. The initial velocities at this concentration of radioligand were determined by linear regression of the data from 0 to 120 minutes and defined as the slope of the line for each clone.
Quantitative Polymerase Chain Reaction
The sst2 complementary deoxyribonucleic acid (cDNA) sequence (GenBank Accession No. M81830) and human gluceraldehyde-3-phosphate dehydrogenase (GAPDH) cDNA sequence (GenBank Accession No. M33197) were analyzed using the Primer3 Web interface (<http://frodo.wi.mit.edu/cgi-bin/primer3/primer3_www.cgi>). The sst2 specific primers sst2-791_Fw (5′-CAAGGTGAAGTCCTCTGGAATC-3′) and sst2-894_Rv (5′-AGAAGATGAAGACAGCCACCAC-3′) were designed to amplify a 103 base pair (bp) segment of sst2, and the control GAPDH primers GAPD-501_Fw (5′-CTTTGGTATCGTGGAAGGACTC-3′) and GAPD-633_Rv (5′-AGTAGAGGCAGGGATGATGTTC-3′) were designed to amplify a 132 bp segment of GAPDH. All primers were purchased from Operon Biotechnologies (Huntsville, AL), and both primer sets, along with the ribonucleic acid (RNA) preparations, were validated using semiquantitative reverse transcriptase polymerase chain reaction (RT-PCR) prior to QPCR. RNA was extracted using the RNeasy Kit (Qiagen, Valencia, CA), and samples were diluted to 20 ng/mL in nuclease-free H2O to ensure that expression differences were due to changes in the amount of messenger ribonucleic acid (mRNA) present per sample and not to differences in total RNA concentration. mRNA expression was monitored using the Qiagen OneStep RT-PCR Kit (Valencia, CA) using the aforementioned sst2 and GAPDH primers. The QPCRs were set up as instructed in the manufacturer's protocol using 1× SYBR Green reaction mix, 0.3 μM primers, 0.7 U of heat-labile uridine diphosphate-n-glycosylase (Roche, Indianapolis, IN) per reaction, and 100 ng of total RNA per reaction in a reaction volume of 50 μL. All reactions were set up in triplicate at 4°C in 96-well polymerase chain reaction (PCR) plates, with both primer sets being included in the same plate to ensure accuracy. The plates were sealed with optical sealing tape, and the reactions were cycled in a BioRad iCycler with a MyiQ Single Color QPCR Detection System (Hercules, CA), with data acquisition using PC-based MyiQ Optical System Software (BioRad). The reaction conditions were 50°C for 30 minutes and 95°C for 15 minutes, followed by 35 cycles of 94°C for 15 seconds, 55°C for 30 seconds, 72°C for 30 seconds, and 78°C for 15 seconds. The reactions were then subjected to melt-curve analysis to verify product purity. QPCR data were collected and plotted as MFUs versus threshold cycle (Ct). Fold changes in expression were normalized to GAPDH controls.
Biodistribution
All animal studies were performed in accordance with the Guidelines for the Care and Use of Research Animals established by the Animal Studies Committee at Washington University. Homozygous NU/NU female athymic nude mice (Charles River Laboratories, Wilmington, MA), approximately 6 to 8 weeks of age, were subcutaneously implanted on the rear flank with either A-427 clone 2, 4, 5, or 7 at 1 × 10⁷ cells per tumor mixed 1:1 with Matrigel (Becton Dickinson Biosciences, Palo Alto, CA). Approximately 3 weeks following tumor implantation (tumor weights = 144 6 35 mg), the animals (n = 3–5) were injected with ≈740 kBq (49.1 ± 26 ng) of 64Cu-TETA-OC via the tail vein, and the animals were then sacrificed 1 hour following injection. The blood, lungs, liver, kidney, spleen, pancreas, muscle, bone, and tumor were collected, weighed, and counted in a gamma counter. The percent injected dose (ID) per gram was calculated based on the corrected radioactivity for each sample compared with a standard, which was representative of the injected dose.
MicroPET Imaging
For microPET imaging of sst2 in A-427 tumor clones 4 and 7, four mice were implanted subcutaneously at 1 × 10⁷ cells per tumor mixed 1:1 with Matrigel with two tumors per animal, and the tumors were implanted on the axillary thorax. Approximately 3 weeks following implantation, the mice were injected with ≈4.5 MBq (137 ± 10.5 ng) of 64Cu-TETA-OC and 1 hour later were anesthetized with1 to 2% isoflurane, positioned supine, immobilized, and imaged. Images were obtained on a microPET-R4 scanner (Concorde Microsystems, Knoxville, TN) with an acquisition time of 10 minutes and static ordered-subset estimation maximization reconstruction. The standard uptake values (SUVs) of 64Cu-TETA-OC for tumors, liver, and kidneys were determined as previously described. 24 Briefly, encompassing regions of interest for the entire tumor, liver, or kidneys from the microPET images were measured to obtain the radioactive concentration, which was then decay corrected to the time of injection. This was then multiplied by the mouse body weight in grams and divided by the counts of the injected dose to give the normalized tissue uptake to injected dose per body weight ([counts/cc] × [weight (g)/injected dose (counts)]).
Statistical Analysis
A Student's two-tailed t-test was employed to analyze the statistical significance for all of the experimental data presented as the mean of independently performed experiments ± standard error of the mean (SEM), with p < .05 being considered significant.
Results
FACS Analysis
A-427 clones stably transfected with sst2 containing the HA epitope were analyzed by flow cytometry using an anti-HA antibody. Clone 7 showed significantly greater (p ≤ .04) sst2 than all of the other clones with a fluorescent intensity of 40.9 ± 6.5 MFU, with both clones 2 and 5 being greater than clone 4 (p = .04 and .045, respectively), with fluorescent intensities of 15.4 ± 5.7 and 1.9 ± 0.4 MFU, respectively. The sst2 expression order of the clones was shown to be 4 < 5 < 2 < 7. The results are presented in Table 1.
Fluorescence-Activated Cell Sorter and Saturation Binding Assays of Somatostatin Receptor Subtype 2 Expression in A-427 Stable Clones

FACS = fluorescence-activated cell sorter; MFU = mean fluorescent units. For FACS analysis, cells were incubated with antihemagglutinin antibody, followed by fluorescein isothiocyanate–labeled secondary antibody. The cells were sorted and counted, and the data are presented as MFU ± standard error of the mean (SEM) (n = 4). For binding analysis, Bmax values were determined for A-427 clones 2, 5, and 7, and the data are shown as fmol/mg ± SEM for two experiments, each performed in quadruplicate.
Saturation Binding Assay
Saturation binding assays were performed on membrane preparations from sst2-transfected A-427 clones 2, 4, 5, and 7. Bmax values for clone 4 could not be determined because specific binding was not observed; thus, a curve could not be fit (data not shown). The Bmax values for the other clones were 1,300 6 149 fmol/mg for clone 5, 2,755 ± 254 fmol/mg for clone 2, and 7,013 ± 2,775 fmol/mg for clone 7 (see Table 1). A representative assay is shown in Figure 1. The expression profile of the four clones based on the binding data is the same as that of the FACS analysis of sst2 expression.

Representative saturation binding assay of 64Cu-TETA-OC in A-427 stable clones 2, 5, and 7. The squares (■) represent clone 2, triangles (▴) clone 5, and circles (•) clone 7. Each point represents the mean ± standard error of measurement for quadruplicate measurements.
Internalization Assay
Internalization of 64Cu-TETA-OC was determined in the A-427 stable clones in a time-dependent assay (Figure 2). sst2-mediated internalization in clone 4 was found to never increase above background throughout the course of the assay. The amount of internalized 64Cu-TETA-OC in clone 7 was significantly greater than all of the other clones at all time points (p ≤ .001). Internalization in clone 2 was greater than that of clones 4 and 5 at all time points (p ≤ .02), whereas clone 5 also showed a statistically greater internalization than clone 4 at all time points (p ≤ .02). The amount of internalized radioactivity for clones 7, 2, and 5 at 240 minutes was 200, 64, and 9 fmol/106 cells, respectively. The internalized fraction of 64Cu-TETA-OC was at least 10-fold higher than the surface fraction for each clone at each time point, except for 30 minutes, when there was at least a 3-fold difference. The data are presented as fmol/106 cells after correcting for nonspecific binding.
Quantitative PCR
The internal control GAPDH reached the Ct for all samples, or the cycle at which fluorescence reached 10 times the mean standard deviation of the background levels in all reaction wells, at an average cycle of 25.3 ± 0.2 for all GAPDH reactions (n = 15). For sst2 amplification, the nontransfected A-427 and A-427 stable clone 4 never reached threshold throughout the course of the reactions, indicating the absence of detectable sst2 mRNA in either of the samples. However, clone 7 achieved sst2 amplification threshold at cycle 29.6 6 0.1, which was significant (p < .002) when compared with clone 2 (Ct = 31.8 ± 0.03) and clone 5 (Ct = 33.1 ± 0.1), with p < .01 between clones 2 and 5 (Table 2).
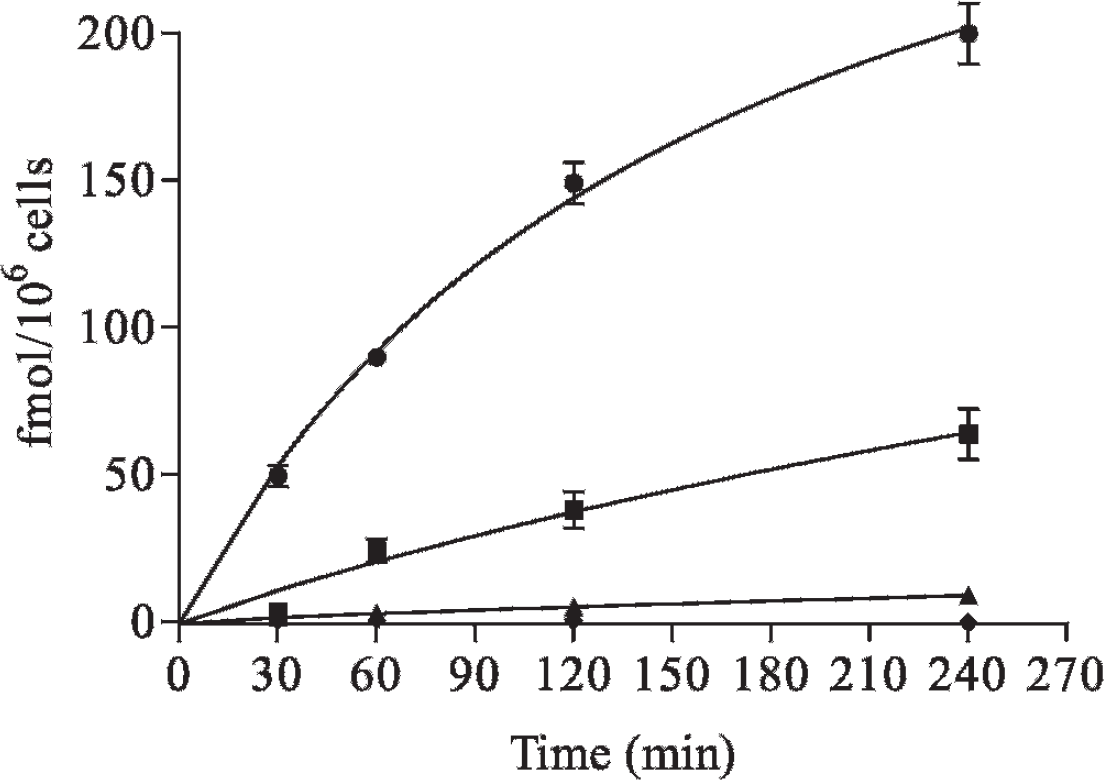
Internalization of 64Cu-TETA-OC in the A-427 stable clones. Cells were incubated with 64Cu-TETA-OC with or without an inhibitor for 30, 60, 120, and 240 minutes. The cells, after acid wash, were lysed and collected for determination of internalized radioactivity. The squares (■) represent clone 2, diamonds (♦) clone 4, triangles (▴) clone 5, and circles (•) clone 7. The data represent specific internalization from the mean of three experiments, with each being performed in triplicate, ± standard error of measurement.
Biodistribution
Uptake of 64Cu-TETA-OC in mice bearing A-427 stable tumor clones and in normal tissues is shown in Figure 3A. The blood clearance of the 64Cu-TETA-OC was rapid, with 0.5 ± 0.04 % ID/g remaining at 1 hour. Uptake of 64Cu-TETA-OC in the liver and kidneys was 2.6 ± 0.2 and 7.6 ± 0.6% ID/g, respectively. Tumor clone 7 showed a high uptake of 64Cu-TETA-OC at 6.5 ± 1.0% ID/g, which was significantly greater than both tumor clone 4 and tumor clone 5 (p < .01). Although the uptake in tumor clone 7 was roughly twice that of tumor clone 2 (3.9 ± 0.2% ID/g), they were not significantly different. The uptake for tumor clone 2 was significantly greater (p = .002) than tumor clone 5, which at 1.3 ± 0.1% ID/g was greater than tumor clone 4 (0.8 ± 0.1% ID/g, p = .006). The tumor to tissue ratios of the four tumor clones are shown in Figure 3B. The ratios show that the uptake of 64Cu-TETA-OC in tumor clones 2 and 5 is greater than one in all normal tissues, except the liver and kidney, whereas tumor clone 7 had a ratio greater than one for all of the normal tissues. These results indicate that A-427 tumor clones 2, 5, and 7 express sst2 at different levels in vivo and that these levels are detectable in biodistribution studies.
Quantitative Polymerase Chain Reaction Analysis of sst2 Messenger Ribonucleic Acid from A-427 Stable Clones

GADPH = glyceraldehyde-3-phosphate dehydrogenase; sst2 = somatostatin receptor subtype 2.
The results are presented as the cycle at which fluorescence reached threshold (Ct) ± standard error of measurement (n = 3) for nontransfected A-427 and for A-427 clones 2, 4, 5, and 7 using both GAPDH internal control and sst2 primers, as well as the normalized Ct value (ΔCt).
MicroPET Imaging
Since A-427 clone 4 showed no sst2 expression in the in vitro assays, it was used as a negative sst2-expressing tumor in the imaging model. Additionally, clone 7 showed the greatest sst2 expression of the four clones, and it was used as the representative sst2-expressing tumor in vivo. Figure 4A shows a single slice of the coronal microPET images of two mice implanted subcutaneously on the axillary thorax with A-427 tumor clone 4 (right) and tumor clone 7 (left) 1 hour after intravenous injection of 64Cu-TETA-OC. Clearance of 64Cu-TETA-OC through the kidneys was observed, as in the biodistribution. Figure 4B shows a single slice of the transaxial images of the same two mice implanted with A-427 tumor clones 4 and 7. SUVs (Figure 4C) were determined for the liver, kidneys, and tumors for the imaged mice (n = 4). The uptake of 64Cu-TETA-OC was significantly greater in tumor clone 7 than in tumor clone 4 (p = .04), indicating sst2-mediated uptake in tumor clone 7 compared with the sst2-negative tumor clone 4.
Discussion
To date, most studies for evaluating radiolabeled somatostatin analogs have been performed using rat cell lines (AR42J and CA20948) that natively express sst2. Although these cell lines have provided crucial information on various ligands for sst2 with regard to affinity, internalization, and in vivo distribution, they do not express a range of receptor concentrations, so the effect of receptor density on radiolabeled somatostatin analog uptake for imaging or therapy cannot be evaluated. In addition, since intracellular metabolism of the radiometal is critical for its utility in imaging and therapy, the rat proteins involved in radiometal transport in the AR42J and CA20948 cells may not be representative of how the radiometal is transported in human cells. Other human cells that natively express sst2 and have been used to evaluate radiolabeled somatostatin analogs include the small cell lung cancer line NCI-H69, the D341 Med medulloblastoma cells, and the GOT1 human midgut carcinoma cells.14–16 Expression of sst2 was not quantified in the GOT1 tumors, whereas the NCI-H69 and D341 cells expressed low levels (, 800 fmol/mg) of sst2.15,25,26 Kundra and colleagues and Yang and colleagues stably transfected human sst2 into the human fibroblast cell line HT1080 for the purpose of detecting gene transfer using 111In-OC in a mouse model.17,18 This study isolated different HT1080 clones that expressed different levels of human sst2, but the expression was not quantified. Human embryonic kidney cells have also been transfected with sst2 for evaluation of radiolabeled somatostatin analogs in vitro. 27 This study did not quantify the expression of sst2, and the cells have not been used in vivo as yet. Overall, only a limited number of studies have been performed using human cell lines that express human sst2 for evaluation of radiolabeled somatostatin analogs.

Biodistribution of 64Cu-TETA-OC in athymic nude mice bearing xenografts of A-427 tumor clones. The 64Cu-TETA-OC was injected into the tail vein, and the mice were sacrificed 1 hour after injection. A, The data are shown as % ID/g ± standard error of measurement for three to five mice per experiment, with each normal tissue combined as the mean of all animals (n = 13) and tumors (n = 3–5). B, The data are also presented as the tumor to tissue ratio for each A-427 tumor type.
The goal of this study was to generate and characterize clones of a single human cell line stably expressing various levels of human sst2 that could be used for future evaluation of radiolabeled somatostatin analogs. It has been previously shown that the HA epitope can be targeted with a radiolabeled anti-HA antibody for imaging of HA sst2 expression after injection of an adenovirus encoding the gene. 20 Previous studies have shown that insertion of the HA epitope into the N-terminus of sst2 did not adversely affect ligand binding to the receptor.17,19,20 The binding of a fluorescein isothiocyanate–labeled anti-HA antibody to the stably transfected clones (2, 4, 5, and 7) showed expression of the epitope-tagged sst2 (see Table 1).

Micro–positron emission tomographic images of athymic nude mice bearing axillary A-427 clone 4 (right) and clone 7 (left) tumors 1 hour after injection of 64Cu-TETA-OC. The images are a single slice from a coronal view (A) and a transaxial view (B). C, Standard uptake values (SUV) for the kidneys, liver, A-427 clone 4 tumors, and A-427 clone 7 tumors are shown. The SUV data are presented as the mean (n = 4) for each tissue ± standard error of measurement.
The variation in expression is most likely due to the random nature of genomic integration, or the chromosomal position effect 28 of the cytomegalovirus promoter–driven sst2 clones. The stable integration of the sst2 gene into the genome of the four A-427 clones was confirmed by PCR of genomic DNA for both a constitutively expressed control gene and sst2 (data not shown). This shows that genomic insertion of the sst2 gene hybrid sequence was accomplished, but the varying levels of sst2 expression, as seen with the flow cytometry data, indicate either insertion into regions with variable levels of transcription or that the higher expressing clones are due to multiple genomic insertions.
The amount of receptor for the stable transfectants as determined by the saturation binding assays (see Table 1 and Figure 1), internalization assays (Figure 2), and QPCR (see Table 2) was found to be in agreement with the flow cytometry data with regard to expression order. Clone 7 expressed the highest number of receptors, with ≈7,000 fmol/mg, which is significantly greater than the expression of sst2 reported for CA20948 cells, which express ≈135 fmol/mg.13,26 Numerous reports have given a range of sst2 expression on AR42J cells from ≈150 to ≈2,500 fmol/mg.8,10,15,26,29 As mentioned above, Kundra and colleagues and Yang and colleagues evaluated sst2 expression in human HT1080 fibroblast cells stably expressing sst2 but did not quantify the level of expression.17,18 Thus, it is difficult to compare the results obtained by these authors with the expression levels determined in this study or with the AR42J and CA20948 cells. Vaidyanathan and colleagues showed that a human cerebellar medulloblastoma cell line, D341 Med, natively express 4 × 10⁴ sst2 per cell. 15 Conversion of fmol/mg in clone 7 to receptors/cell results in the presence of approximately 2.3 × 10⁶ sst2 receptors per cell in clone 7, almost 100-fold higher. QPCR was also used to show that the level of sst2 mRNA corresponded to the expression of sst2 protein (Figure 5A). Quantitative measures of sst2 mRNA have been used as a diagnostic tool for prognosis in both pancreatic and breast cancers.30,31
Internalization of 64Cu-TETA-OC was observed in clones 2, 5, and 7 but was not observed in clone 4 throughout the course of the assay (see Figure 2). Relatively rapid internalization in clone 7 was observed, reaching 49 fmol/106 cells within 30 minutes, indicating the highest expression of sst2 of the four clones, which is consistent with the other assays. Nonlinear curve fitting showed that clones 7, 2, and 5 reached maximum internalizations of 338, 235, and 43 fmol/106 cells, respectively. The initial velocities of internalization (from 0–120 minutes) at this concentration of 64Cu-TETA-OC were 1.1, 0.3, and 0.04 fmol/106 cells/min for clones 7, 2, and 5 as determined by linear regression. The results reported here for clone 5 are similar to those reported by Lewis and colleagues, which showed a relatively slow internalization of 64Cu-TETA-OC in AR42J cells out to 120 minutes. 29
In vivo biodistribution studies (Figure 3) clearly showed uptake of 64Cu-TETA-OC in the sst2-expressing tumors generated from A-427 clones 2, 5, and 7 at 3.9, 1.3, and 6.5% ID/g, respectively. The in vitro versus the in vivo correlations of sst2 expression are shown in Figure 5. Figure 5A shows the correlations between the in vitro studies, and Figure 5B shows the correlations between the in vivo studies and the in vitro studies. There is a strong linear relationship between all of the assays performed, with the coefficients ranging from R2 = .93 to 1.00, which indicates the uniformity of the sst2 expression in both the in vitro tests and the in vivo mouse model. Lewis and colleagues showed that uptake of 64Cu-TETA-OC in severe combined immunodeficiency (SCID) mice bearing AR42J tumors was 11.2% ID/g. 13 Owing to the wide range of sst2 receptor concentrations reported on AR42J cells, it is difficult to compare the uptake of 64Cu-TETA-OC in A-427 clone 7 to the uptake in the AR42J tumors. Differences in these biodistribution studies may be due to differences between athymic nude or SCID mice. A preliminary study in our laboratory showed that the uptake of 64Cu-TETA-OC in tumor clone 7 increased from 6.5 to 9.7% ID/g when the cells were implanted in athymic nude and SCID mice, respectively. Alternatively, the lower uptake of 64Cu-TETA-OC in the A-427 clone 7 tumors compared with AR42J tumors might be due to down-regulation of sst2 in clone 7 in vivo. Taylor and colleagues showed that the NCI-H69 cells expressed about 10-fold lower sst2 when grown as xenografts in mice (12.5 fmol/mg) compared with when grown in culture (173 fmol/mg). 25
sst2-mediated uptake of 64Cu-TETA-OC is further seen in the microPET images generated from mice bearing tumors from A-427 clones 4 and 7 (Figure 4, A and B). Tumors of clone 7 are clearly visible 1 hour after administration of 64Cu-TETA-OC, with tumors of clone 4 showing background uptake. As expected, the kidneys give a strong signal owing to the excretion pathway of the 64Cu-TETA-OC, as seen in the biodistribution studies. The trends of the SUV analysis (Figure 4C) are similar to those observed in the biodistribution studies, with the kidney having the highest uptake and clone 4 having the lowest uptake, although the SUV of the liver is similar to that of tumor clone 7, whereas the biodistribution shows that the liver uptake is significantly lower than the uptake in tumor clone 7 (p < .02).
The construction of these human cells stably expressing various levels of human sst2 will allow the study of radiolabeled somatostatin analogs as potential imaging and therapeutic agents in a dose-dependent manner. Also, these lines will be more relevant than the rat cell lines for studying the intracellular processing and fate of radionuclides attached to somatostatin analogs. Wang and colleagues reported that 64Cu dissociates from TETA-OC on internalization into rat AR42J cells and that the 64Cu localizes to various parts of the cell, including the mitochondria and nucleus. 32 Although the shuttling of intracellular copper in human and rat cells has been well characterized in the cytoplasm,33,34 it has been at the level of intracellular copper necessary as a cofactor for metalloenzymes. Since the 64Cu is localizing in the nucleus, it implies that it is not being used as a cofactor in these rat cells but is being used for some as yet unknown reason. Ginj and colleagues recently demonstrated the nuclear localization of 111In from various octreotate analogs in human embryonic kidney cells stably transfected with sst2 but did not investigate nuclear localization of these analogs in AR42J cells. 27 We are currently investigating the effects of receptor concentration on the nuclear localization of 64Cu-labeled somatostatin analogs in the A-427 clones and will compare these results with those previously obtained in our laboratory with AR42J cells.

Correlations among in vitro assays and between the in vitro assay and the biodistribution study for A-427 stable clones 2, 4, 5, and 7. A, In vitro correlations between fluorescence-activated cell sorter (FACS) (mean fluorescent units [MFU]), binding analysis (fmol/mg), and quantitative polymerase chain reaction (QPCR) (ΔCt). B, In vivo correlations between FACS (MFU), binding analysis (fmol/mg), QPCR (ΔCt), and biodistribution data (% ID/g).
These studies showed that clones of a human cell line were produced that express various levels of sst2 for the evaluation of radiolabeled somatostatin analogs. The levels of protein were confirmed by FACS analysis, saturation binding assays, internalization assays, and biodistribution studies. In addition, various levels of somatostatin mRNA were observed by QPCR analysis. There was a strong correlation for sst2 expression among the in vitro assays and between the in vitro assays and the biodistribution study. Tumor-specific uptake was observed in microPET images of the highest expressing clone but not in the nonexpressing sst2 clone. The range of receptor expression of these human cell lines will allow the investigation of therapeutic and diagnostic dose-response relationships of radiolabeled sst2 ligands, both in vitro and in vivo, and will be a powerful tool for evaluating novel sst2 ligands.
Footnotes
Acknowledgments
We wish to thank Dr. Wen Ping Li and Christopher D. Sherman for radiolabeling of TETA-OC and for performing the biodistribution studies. Debbie Della Manna and Richard Kirkman are thanked for construction of the stable cell lines. We also thank Ron Chen for tumor cell implantations; Jerrel Rutlin, Lori Strong, and Dr. Richard LaForest for the microPET imaging and data analysis; and Dr. Robert VanderWaal for helpful discussions.