
Abstract
The inability to transduce cellular membranes is a limitation of current magnetic resonance imaging probes used in biologic and clinical settings. This constraint confines contrast agents to extracellular and vascular regions of the body, drastically reducing their viability for investigating processes and cycles in developmental biology. Conversely, a contrast agent with the ability to permeate cell membranes could be used in visualizing cell patterning, cell fate mapping, gene therapy, and, eventually, noninvasive cancer diagnosis. Therefore, we describe the synthesis and quantitative imaging of four contrast agents with the capability to cross cell membranes in sufficient quantity for detection. Each agent is based on the conjugation of a Gd(III) chelator with a cellular transduction moiety. Specifically, we coupled Gd(III)–diethylenetriaminepentaacetic acid DTPA and Gd(III)–1,4,7,10-tetraazacyclododecane-1,4,7,10-tetraacetic acid with an 8–amino acid polyarginine oligomer and an amphipathic stilbene molecule, 4-amino-4'-(N,N-dimethylamino)stilbene. The imaging modality that provided the best sensitivity and spatial resolution for direct detection of the contrast agents is synchrotron radiation x-ray fluorescence (SR-XRF). Unlike optical microscopy, SR-XRF provides two-dimensional images with resolution 103 better than 153Gd gamma counting, without altering the agent by organic fluorophore conjugation. The transduction efficiency of the intracellular agents was evaluated by T1 analysis and inductively coupled plasma mass spectrometry to determine the efficacy of each chelate-transporter combination.
ADVANCES IN MAGNETIC RESONANCE IMAGING (MRI) have provided a new tool for the study of developmental biologic processes, such as cell lineage and fate mapping.1,2 The ability to observe long-term developmental events in whole animals from descendants of individual precursors is producing a significant impact on the understanding of these complex processes. For example, an intact embryo can be labeled by microinjection of a stable, nontoxic magnetic resonance lineage tracer and images acquired. As a result, a complete time series of high-resolution three-dimensional MRIs can be analyzed forward or backward in time to reconstruct cell divisions and movements. A principal barrier to the development of new lineage tracers and contrast agents is the inherent inability of these complexes to cross cell membranes.3–7 On cell transduction, these agents must then produce an observable effect on the MRI signal. Ideally, the agent has adequate synthetic versatility to allow for modification with a small-molecule (nonviral) delivery vehicle that does not increase toxicity and is efficient enough to deliver a large quantity of the agent.
The development of cell-permeable peptides and small molecules has led to the identification of numerous carrier molecules. A number of reports have described delivery vehicles that direct the agent to a particular cell type, such as transferrin8–10 and folate receptor–targeted agents.11–13 Similar to receptor-mediated delivery, cationic protein transduction domains such as polyarginine14–17 and human immunodeficiency virus (HIV)-1 trans activating protein (TAT)18–20 have been extensively used as translocation vehicles to facilitate delivery of all classes of modified MRI contrast agents.
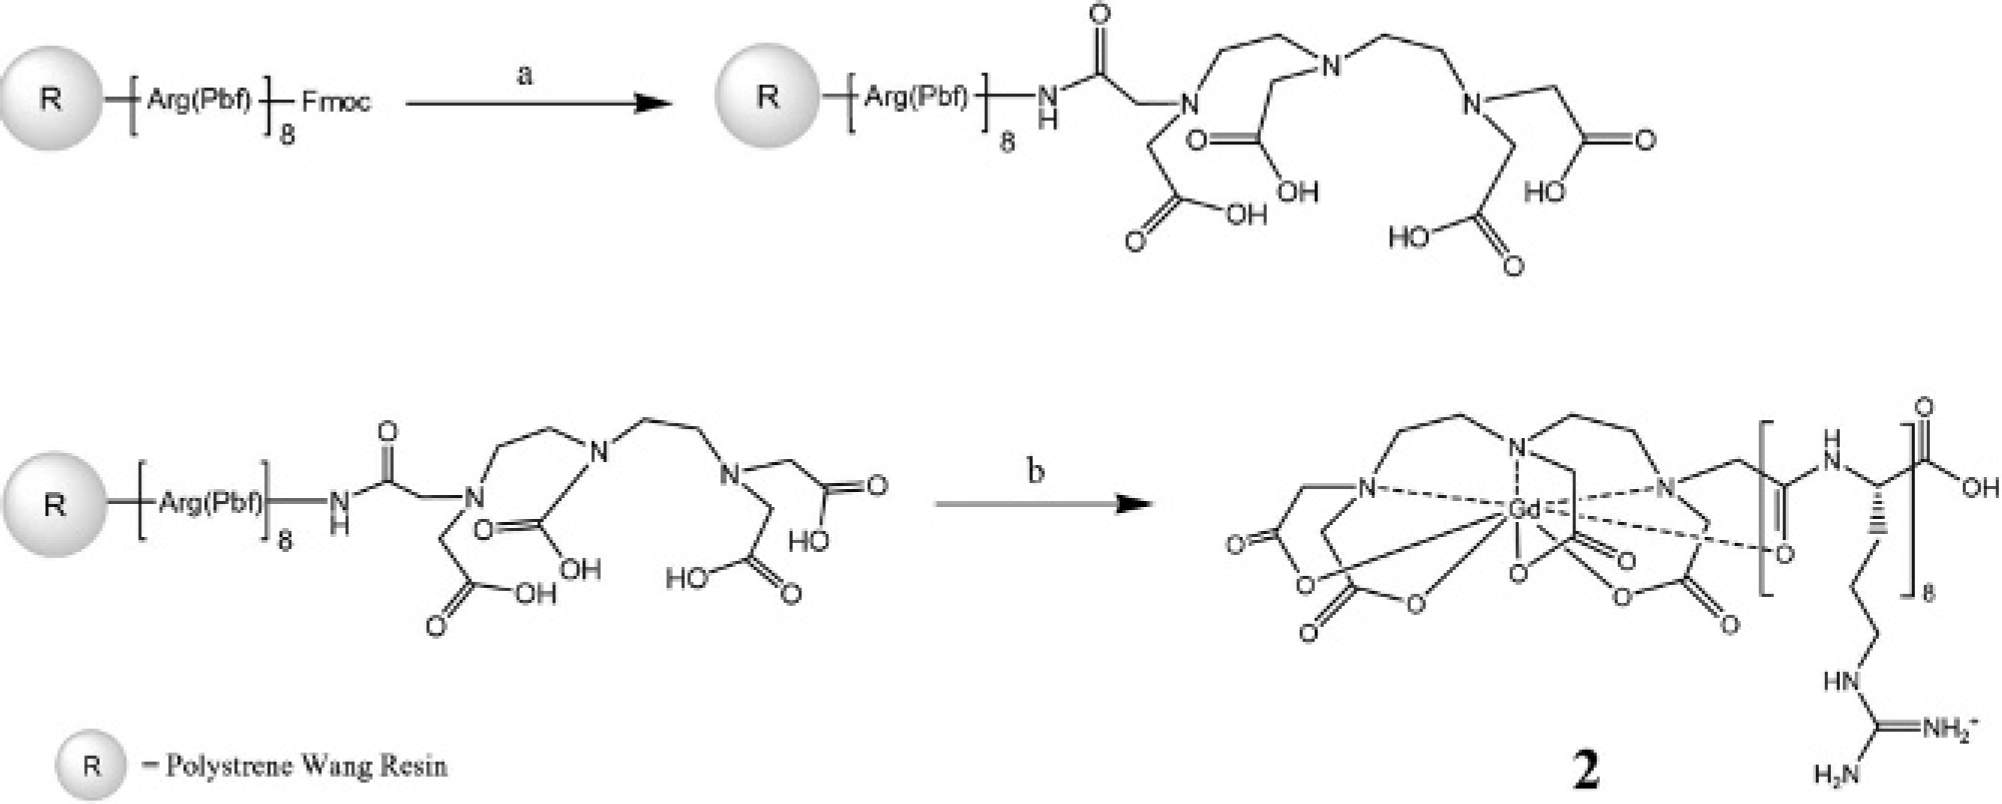
The focus of this work is twofold: the development of highly efficient and passive vehicles for the intracellular transport of MRI contrast agents and the testing of new quantitative methods for evaluating uptake. We have synthesized four cell-permeable agents and characterized the efficiency of translocation by synchrotron radiation x-ray fluorescence (SR-XRF), inductively coupled plasma mass spectrometry (ICP-MS), and MRI. We compared the cellular transduction efficiencies of two different cell-permeable vehicles with entirely different translocation properties and mechanisms. This was accomplished by conjugating a cellular transduction moiety to diethylenetriaminepentaacetic acid (DTPA) and 1,4,7,10-tetraazacyclododecane-1,4,7,10-tetraacetic acid (DOTA) (Figures 1, 2, and 3).
SR-XRF uses photoelectric absorption of incident hard x-rays to cause the ejection of K shell electrons from an atom. With high atomic weight elements, this electron vacancy creates an excited state that relaxes with emission of a photon. 21 Owing to the monochromatic x-ray beam and zone plate optics available with SR-XRF, two-dimensional images with single-cell resolution (0.3 × 0.3 μm) can be recorded. A major advantage of SR-XRF over standard fluorescence microscopy is that images are obtainable without altering the agent by attachment of an organic fluorophore. Although gamma emitters such as 153Gd and 125I and high-resolution gamma counting offer the same advantage, both techniques requires handling and preparation of radioactive compounds, and the best resolution currently obtainable is 190 × 190 μm. 22

Structures of the intracellular agents: 1, 8–amino acid polyarginine oligomer coupled to Gd(III) DOTA; 2, 8–amino acid polyarginine oligomer coupled to Gd(III) DTPA; 3, 4-amino-4′-(N,N-dimethylamino)stilbene coupled to Gd(III) p-NH2-DOTA; 4, 4-amino-4′-(N,N-dimethylamino)stilbene coupled to Gd(III) p-NH2-DTPA.
Synthesis of complex
Studies aimed at the elucidation of in vivo cellular processes and in vivo fate mapping could improve our knowledge of key biologic processes, such as immune defense mechanisms and tumorigenesis. 23 Therefore, modification of a contrast agent with a cellular transduction moiety and quantitative analysis of its translocation efficacy is a key step in the development of biologically compatible intracellular contrast agents.2,14,15,23–25
Materials and Methods
All reagents and solvents were of the highest purity attainable from Aldrich (Milwaukee, WI) and TCI America (Portland, OR) unless otherwise noted. Modified Wang resin and amino acids were purchased from Novabiochem (San Diego, CA). NIH/3T3 cells, MDCK cells, and RAW 264.7 cells were purchased from American Type Culture Collection (ATCC, Manassas, VA). Also purchased from ATCC were Dulbecco's Modified Eagle's Medium (DMEM, with 4 mM
Complexes 1 * 25 and 5 26 were synthesized following previously published procedures. Compound 7 was converted to compound 8 by following previously published procedures. 27
1H and 13C nuclear magnetic resonance (NMR) spectra were obtained on a Varian (Palo Alto, CA) Inova spectrometer at 400 and 100 MHz, respectively. Compounds were run in either CDCL3 (7.27 and 77.23 ppm used as internal references for 1H and 13C NMR spectra, respectively) or D2O (4.80 and 49.00 ppm [MeOH] used as internal references for 1H and 13C NMR spectra, respectively). Mass spectrometry samples were analyzed using electrospray ionization (ESI), single-quadrupole mass spectrometry on a Varian 1200L spectrometer. The results reported for m/z are for [M + H+]+ or [M - H+]−. Elemental analyses were performed at Desert Analytics Laboratory, Tuscon, AZ.
Analytic high-performance liquid chromatography (HPLC)–mass spectrometry (MS) was performed on a computer-controlled Varian Prostar system consisting of a 410 autosampler equipped with a 100 μL sample loop, two 210 pumps with 5 mL/min heads, a 363 fluorescence detector, a 330 photodiode array detector, and a 1200L single-quadrupole ESI-MS. All separations were executed with a 1.0 mL/min flow rate using a Waters 4.6 × 250 mm 5 μm Atlantis C18 column, with a 3.1:1 split directing one part to the MS and 3.1 parts to the series-connected light and fluorescence detectors. Mobile phases consisted of Millipore Synthesis grade water (solvent A) and HPLC-grade acetonitrile (MeCN) (solvent B). Preparative HPLC was accomplished using a Varian Prostar system. Two Prostar 210 pumps with 25 mL/min heads fed a 5 mL manual inject sample loop. Detection was performed after a 20:1 split by a two-channel Prostar 325 UV-visible detector and, on the low-flow side, an HP 1046A fluorescence detector. The mobile phases were the same as in the HPLC-MS instrument. Preparative runs were on a Waters 19 × 250 mm 10 μm Atlantis C18 column.

Synthesis of 4-isothiocyanato-4'-(N,N-dimethylamino)stilbene compound (5) and Gd(III) (4,7,1-triscarboxymethyl-6-[4-(3-{4-[2-(4-dimethylaminophenyl)vinyl]phenyl}-thioureido)benzyl]-1,4,7,10-tetraazacyclododec-1-yl)-acetic acid (complex
MRI measurements were performed on a General Electric/Bruker (Billerica, MA) Omega 400WB 9.4 T imaging spectrometer fitted with Accustar shielded gradient coils at 20°C. Spin- lattice relaxation times (T1) were measured using an inversion recovery pulse sequence. Images were acquired using a T1-weighted spin-echo pulse sequence on freshly harvested cells. ICP-MS was performed on a computer-controlled Thermo Elemental (Waltham, MA) PQ ExCell Inductively Coupled Plasma Mass Spectrometer. Cells were counted using a Bright-Line hemacytometer.
Synthesis of Gd(III)-DTPA-(Arg)8 (synthesis of 2)
Polystyrene-based Wang resin containing an Fmoc-protected arginine residue (3.0 g, 0.58 mmol/g) was swelled in CH2Cl2 for 10 minutes (×3) and washed with peptide synthesis grade dimethylformamide (DMF) (4 × 10 minutes). The resin was treated three times with a solution of 20% piperdine in DMF (10 minutes), and the deprotected resin was washed with DMF (4 × 10 minutes). In a separate vial, Fmoc-protected Pbf-arginine (2.82 g, 4.35 mmol), o-(7-azabenzotriazol-1-yl)-N,N,N′,N′-tetramethyluronium hexafluorophosphate (HATU) (1.32 g, 3.48 mmol), and N,N′-diisopropylethylamine (DIEA) (1.12 g, 8.70 mmol) were dissolved in approximately 3 mL of DMF. The resulting solution was added to the deprotected resin, and nitrogen was bubbled through the mixture for 6 to 8 hours. The peptide solution was removed from the resin, which was subsequently rinsed with DMF (4 × 10 minutes). This procedure was repeated a total of seven times to achieve the synthesis of an 8–amino acid polyarginine oligomer bound to the Wang resin.
The resin (1.0 g, 0.58 mmol/g) was deprotected with the piperdine solution and washed with DMF as described above. In a separate vial, diethylenetriamine-N,N,N′,N′,N″-pentaacetic dianhydride (0.720 g, 2.00 mmol) and DIEA (0.369 g, 2.90 mmol) were dissolved in a minimal amount of anhydrous DMF. The resulting solution was added to the deprotected resin, and nitrogen was bubbled through the mixture for 6 to 8 hours. The peptide solution was removed, and the resin was washed with DMF, CH2Cl2, and MeOH (4 × 10 minutes each). Following the methanol washes, the resin was dried under a vacuum. A solution of 95% trifluoroacetic acid (TFA), 2.5% triisopropylsilane (TIS), and 2.5% H2O (50 mL) was added to the resin, and nitrogen was bubbled through the mixture for 1 hour. The resin was filtered, and to the filtrate was added methyl tert-butyl ether (MTBE) (40 mL) to precipitate a white solid that was subsequently washed with MTBE (three times). The solid was dissolved in 30 mL of water and freeze-dried to yield white flaky crystals of the chelate-peptide conjugate DTPA-Arg8 (0.42 g 44%) with ESI-MS (m/z): 1643.02; calculated for C62H119N35O18+H+: 1642.83.
To a solution of DTPA-Arg8 (0.289 g, 0.176 mmol) in water was added Gd(OH)3 (0.0410 g, 0.176 mmol). The reaction mixture was heated to 80°C and stirred for 16 hours. The mixture was allowed to cool to room temperature, and the pH was adjusted to 11.0 with concentrated NH4OH. The resulting suspension was filtered using a 0.2 μm syringe filter and purified using preparatory HPLC with the Waters Atlantis column. An elution profile of a linearly increasing MeCN gradient from 0 to 98% over 45 minutes was used. The desired fraction (retention time 8.43 minutes by ultraviolet light at 220 nm with Gd fluorescence at Excitation λ = 274 and Emission λ = 315) was collected and freeze-dried to yield a white powder, which was found to be
Synthesis of 4-Isothiocyanato-4′-(N,N-Dimethylamino)stilbene (synthesis of 5)
To a stirring solution of 4-amino-4′-(N,N-dimethylamino)stilbene (1.00 g, 8.39 mmol) in CHCl3 (50 mL) at 0°C were added simultaneously a solution of K2CO3 (1.16 g, 8.39 mmol) in H2O (30 mL) and a solution of thiophosgene (0.640 mL, 8.39 mmol) in CHCl3 (30 mL). The reaction was allowed to warm to ambient temperature over 5 hours. The organic layer was separated, washed with H2O, dried over MgSO4, filtered through celite, and concentrated in vacuo to yield an orange solid (1.04 g, 93%). 1H NMR (CDCl3): δ = 2.99 (s, 6H), 6.70 (d, J = 8.0 Hz, 2H), 6.84 (d, J = 15.6 Hz, 1H), 7.04 (d, J = 15.6 Hz, 1H), 7.17 (d, J = 8.0 Hz, 2H), 7.41 (d, J = 8.0, 2H), 7.44 (d, J = 8.0 Hz, 2H); 13C NMR (CDCl3): δ = 40.59, 112.53, 122.83, 125.42, 126.22, 127.03, 127.99, 128.79, 130.49, 134.84, 137.71, 150.40; ESI-MS (m/z): 281.00; calc. for C17H16N2S+H+: 281.10. Analytically calculated for C17H16N2S: C, 72.82; H, 5.75; N, 9.99. Found: C, 73.12; H, 5.72; N, 9.80.
Synthesis of 2-(4-Nitrobenzyl)-1,4,7,10-Tetraazacyclododecane Tetrahydrochloride (synthesis of 7)
Using a modified literature procedure,26,27 macrocycle
Synthesis of Gadolinium (III) (4,7,1-Triscarboxymethyl-6-[4-(3-{4-[2-(4-Dimethylaminophenyl)vinyl]phenyl)-thioureido)benzyl]-1,4,7,10-Tetraazacyclododec-1-yl}-Acetic Acid (synthesis of 3)
Compound 7 (0.497 g, 0.758 mmol) was added to a stirring solution of 4-isothiocyanato-4′-(N,N-dimethylamino)stilbene (0.233 g, 0.834 mmol) in anhydrous DMF (10 mL). This solution was brought to 80°C for 12 hours. The crude mixture was concentrated to dryness and dissolved in 10 mL of H2O. GdCl3 hexahydrate (0.282 g, 0.758 mmol) was added, and the pH of the solution was adjusted to 7.0 with 1 M NaOH. This solution was allowed to stir for 12 hours, at which time the pH was adjusted to 11.0 with 1 M NaOH. The resulting yellow solution was filtered with a 0.2 μm syringe filter and freeze-dried to yield a crude yellow-brown solid. This solid was purified via a Sephadex G-25 size exclusion column in H2O. The fractions containing pure product were combined and freeze-dried to yield a light yellow solid (0.645 g, 77%). ESI-MS (m/z): 942.30 with Gd isotope pattern; calculated for C40H47GdN7O8S-H+: 942.24. Analytically calculated for C40H47GdN7O8S · Na · 2 H2O: C, 47.94; H, 5.13; N, 9.78. Found: C, 47.76; H, 4.92; N, 9.61.
Synthesis of Gd(III) {[2-({2-(Biscarboxmethylamino)-3-[4-(3-{4-[2-(4-Dimethylaminophenyl)vinyl]phenyl}-Thioureido)phenyl]propyl}-Carboxymethylamino)-ethyl]-Carboxymethylamino}-Acetic Acid (synthesis of 4)
p-Aminobenzyl DTPA (0.560 g, 1.12 mmol) was prepared via a procedure in the literature
26
and was added to a stirring solution of compound
SR-XRF Analysis
Each of the three cell lines (NIH/3T3, MDCK, and RAW 264.7) was incubated with
Synchrotron-based scanning x-ray fluorescence microscopy was carried out at the 2-ID-E beamline of the Advanced Photon Source at Argonne National Laboratory (Argonne, IL). Hard x-rays (10 keV) from an undulator source were monochromatized using a single-bounce Si >111< monochromator. The energy was selected to allow for efficient excitation of the Gd L lines and to enable the detection of the Zn K lines. A Fresnel zone plate (320 μm diameter, focal length f = 250 mm; X-radia, Concord, CA) was used to focus the monochromatic x-ray beam to a spot size of ≈0.3 × 0.3 μm2 on the specimen. The sample was raster-scanned through the beam at room temperature under a helium atmosphere. At each scan position, a full fluorescence spectrum was acquired using an energy-dispersive germanium detector (Ultra-LEGe detector, Canberra, Meriden, CT). Elemental content was determined by comparison of fitted sample spectra with NBS thin film standards 1832 and 1833 (NIST, Gaithersburg, MD) using MAPS software supplemented with fitting of fluorescence spectra at every pixel. 29
MRI and T1 Analysis
NIH/3T3 cells, MDCK cells, and RAW 264.7 cells were grown in Corning brand tissue culture flasks (75 cm2 with vent cap) and incubated in a 5% carbon dioxide incubator at 37°C. Cells were incubated with no contrast agent (incubated with corresponding media as controls) or 3.0 mM of complex
Results
SR-XRF Analysis
SR-XRF analysis was performed to determine the cellular association pattern of agents
The Zn, Fe, and Gd columns of Figures 6 and 7 show the respective elemental distributions within one chosen cell of each cell type incubated with
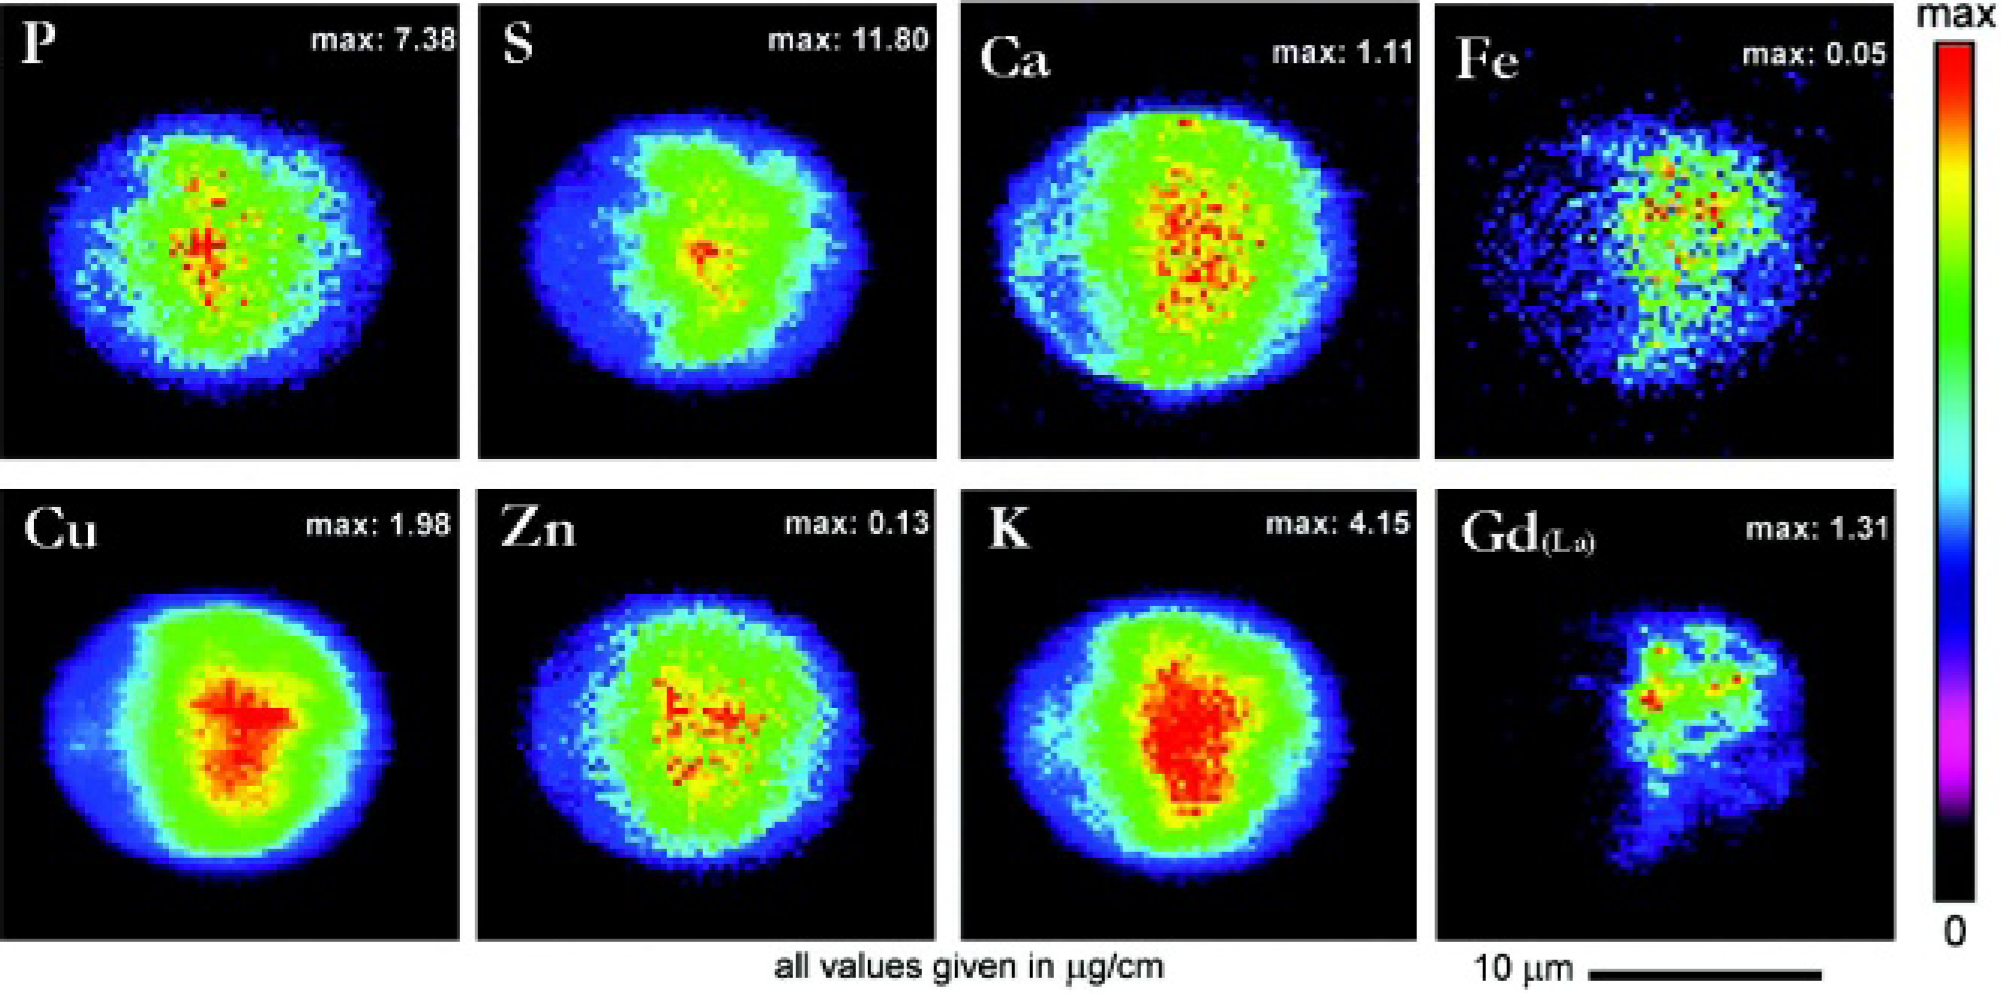
Synchrotron radiation x-ray fluorescence intensity-weighted elemental maps of an MDCK cell incubated with complex
MRI and T1 Analysis
Spin-lattice relaxation times (T1) of unlabeled cells ranged from 2.45 to 2.87 seconds, whereas the T1 values of cells incubated with
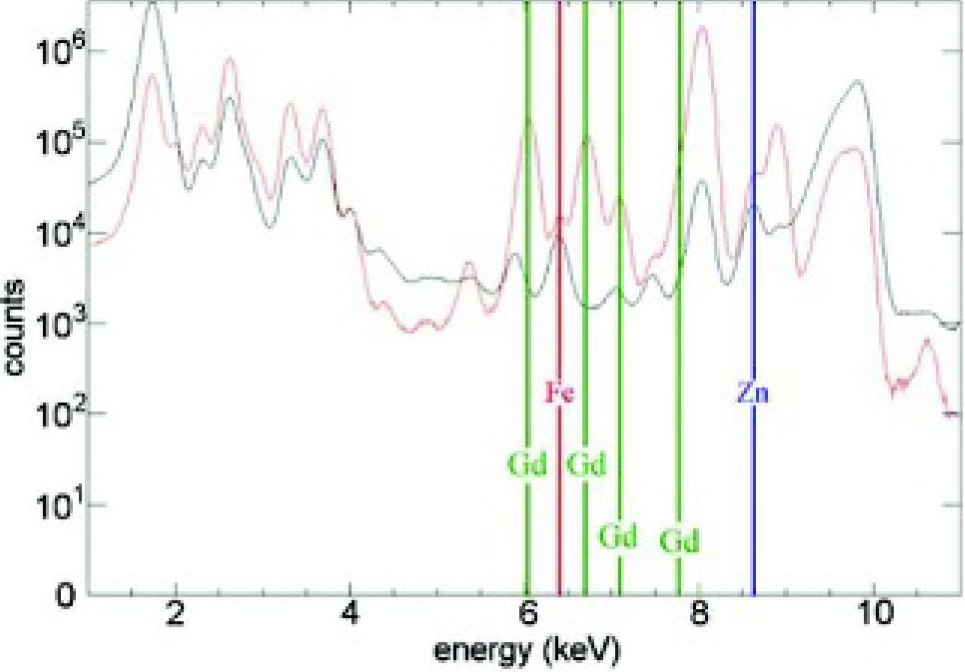
Comparison between the integrated x-ray fluorescence spectrums of all scanned pixels of an untreated NIH/3T3 cell (black spectrum) with that of an NIH/3T3 cell incubated with 3.0 mM of complex
To demonstrate the T1 differences between cell lines and their corresponding media, a sample of each cell line incubated with
Discussion
Our results indicate variable uptake of agents

A, Synchrotron radiation x-ray fluorescence–determined, background-subtracted three-element overlay maps (Zn = blue, Fe = red, and Gd = green) of one cell for each specific cell line incubated with complex
These variables represent two molecular properties that were systematically varied to determine the transduction efficiencies of a cationic polyarginine peptide (complexes
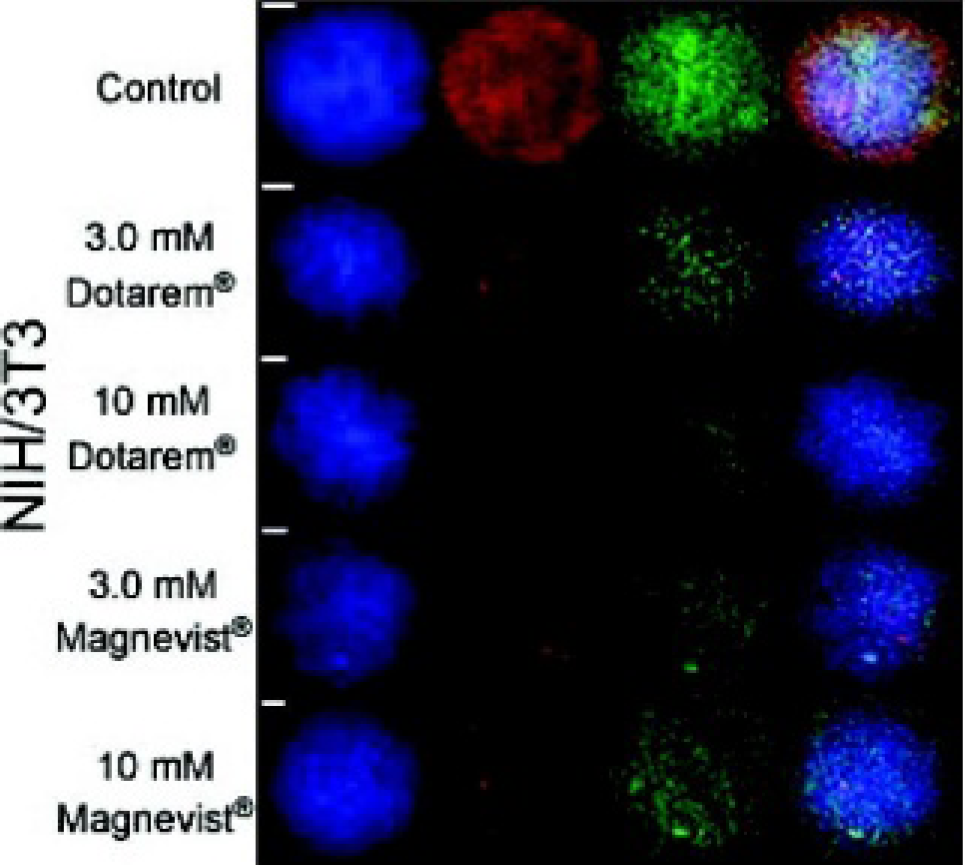
A synchrotron radiation x-ray fluorescence background-subtracted three-element overlay map (Zn = blue, Fe = red, and Gd = green) of one NIH/3T3 cell for Dotarem (Gd(III)-DOTA) or Magnevist (Gd(III)-DTPA) at 3.0 or 10 mM for 4 hours. Scale bars represent 2.0 μm. Notice that the cell boundaries are outlined in the Zn map (as in Figure 4); however, the Gd distribution shows no discernible pattern. Note that each image is scaled to its respective maximum value; therefore, the Gd distribution falsely highlights the background.
The weak fluorescence quantum yield of Gd(III) and the current inability to directly visualize its in vitro location with submicron resolution required the use of SR-XRF to validate cellular uptake of the modified agents. Currently, hard, high-brilliance SR-XRF microprobes that employ Fresnel zone plates to focus incident x-rays can achieve submicron spatial resolution on comparatively thick (eg, 10–20 μm) samples.37,38 The calculated attenuation length of similar organic material to our cells is 18.1 mm; therefore, only 0.06% of incident x-rays are absorbed by a 10 μm–thick target cell.
39
This high elemental sensitivity and spatial resolution of SR-XRF microprobes make them well suited for studying the interactions of Gd(III)-based contrast agents and single cells in vitro. By mapping individual cells, SR-XRF microprobe analyses complement bulk measurements performed by ICP-MS and MRI. Importantly, SR-XRF allows elemental mapping of agents

Average Gd concentrations determined via inductively coupled plasma mass spectrometry of the NIH/3T3, RAW 264.7, and MDCK cells incubated with
As shown in Figure 6, each scanned cell incubated with complexes
As previously stated, SR-XRF can map and quantify elemental concentrations at femtogram levels. 29 However, owing to the size of the cells (22 × 22 μm for MDCK cells), the resolution of the acquired elemental maps (raster-scanned at 0.3 × 0.3 μm with a dwell time of 1.0 s/pixel), sample focusing (≈1 h/cell), and total scan time per cell (≈2.5 h/cell) made rigorous quantification of associated Gd by this technique feasible for only a small number of samples (see Materials and Methods). As expected, the ability to sample only a small number of cells gave rise to large variances in Gd concentration within a population. Nonetheless, these large standard deviations are simply an indication that contrast agent uptake is not homogeneous within a given cell line even at a constant concentration and time. 40 This finding necessitated the sampling of a larger cell population to quantify and rank the transport efficacies.

A, T1 study of NIH/3T3, RAW 264.7, and MDCK cells incubated with 3.0 mM of
To quantitatively determine the uptake trend of complexes

T1-weighted spin-echo magnetic resonance images of RAW 264.7 cells at 9.4 T incubated with

T1-weighted spin-echo magnetic resonance image of NIH/3T3, RAW 264.7, and MDCK cells at 9.4 T. Images were obtained using a spin-echo pulse sequence with a repetition time of 300.8 milliseconds and an echo time of 15 milliseconds (field of view = 22 mm, slice thickness = 0.5 mm). All samples (2–4) were incubated with
To corroborate the quantitative cell studies and determine their utility as MRI contrast agents, complexes
In conclusion, this investigation shows the ability of a polyarginine and stilbene functionalized MRI agent set to label three cell lines effectively enough to be visualized via MRI. The data obtained from ICP-MS, T1 analyses, and acquired MRIs covalidate the transduction efficiency of
Footnotes
*
Numbers in bold refer to molecules.
Acknowledgments
We thank P. N. Venkatasubramanian and S. R. Bull for assistance with the MRI and S.E. Fraser for helpful discussions.