
Abstract
Quantifying the bone erosion in preclinical models of rheumatoid arthritis is valuable for the evaluation of drug treatments. This study introduces a three-dimensional method for bone surface roughness measurement from micro–computed tomographic data obtained from rats subjected to collagen-induced arthritis (CIA), in which the degree of bone erosion is related to the severity and the duration of the disease. In two studies of rat CIA, the surface roughness of the talus bone following 21 days of disease increased 559% and 486% from the control group. At 41 days following disease induction, the roughness of the bone surface increased 857% above baseline. The roughness of the control samples was similar from each study (less than 4% different), demonstrating the robustness of the algorithm. Treatment with methotrexate at 0.1 mg/kg daily demonstrated significant protection from bone erosion, whereas the 0.05 mg/kg daily dose was not efficacious (98% versus 22% inhibition of roughness-measured bone erosion). The main advantage of such an algorithm is demonstrated in the preclinical drug study of rat CIA with methotrexate treatment, indicating the immediate utility of this approach in drug development studies.
CHRONIC INFLAMMATORY RESPONSE associated with rheumatoid arthritis (RA) leads to debilitating joint destruction, resulting in pain and loss of joint function and stability.1,2 RA is characterized by progressive synovitis and formation of hyperplastic synovial tissue (pannus) that becomes locally invasive, destroying bone and cartilage, and most treatment regimens include radiography to establish a baseline for involved joints and bone to monitor disease progression and treatment response. 3 Typically, planar radiography is used in the clinic to stage and monitor rheumatoid arthritis in humans; however, planar x-ray radiography has important limitations—for example, difficulty in the detection of out-of-plane erosions and insensitivity to synovitis.4,5 Further, there is clinical evidence that additional radiographic deficiencies include feature obscurity or artifactual enhancement owing to improper positioning, either of which could affect disease staging in the same patient over time and scoring variability among radiologists. 6
The limitations of standard radiography for the characterization of arthritis in humans may pose insurmountable challenges in preclinical rodent studies since the anatomy is so much smaller, disease progression is accelerated, and robust, well-characterized assays are often required for monitoring drug therapy. The latter requires clinically relevant animal models and reliable quantitative analysis, which imparts added demands on the dependability of the imaging techniques. In that regard, computed tomography (CT)—although equally insensitive to synovitis—is a superior method for monitoring bone changes over traditional x-ray radiography. Barck and colleagues recently introduced a novel method to quantify cortical bone loss and periosteal new bone formation in a long-term murine collagen-induced arthritis (CIA) model. 7 This demonstrated the value of not only microCT in preclinical pharmaceutical research but also the need for the development and implementation of advanced data analysis algorithms for the robust, quantitative characterization of therapeutic intervention.
Measurement of the surface roughness of arthritic bones is a way to quantify the effects of erosive lesions, which are radiographic hallmarks of RA. 8 Clinically, the radiographic scoring of erosions (despite some methodologic variations) can be used to longitudinally monitor the progression of RA.9,10 In one such report that followed 866 RA patients, evidence of erosions by radiography increased from 32 to 70% of patients in the 3-year study period. 9 In addition to radiography, magnetic resonance imaging (MRI) and ultrasonography have been used for the detection of erosive bone lesions.11–14 MRI is sensitive for soft tissue imaging; however, x-ray CT does offer contrast advantages in the imaging of bone, and the quantification of subtle bone surface defects does require high contrast to noise, especially in preclinical rodent models. Object surface roughness is a complicated spatial feature. To the human eye, the ability to distinguish between object form versus roughness is innate; however, training a computer to make the same classifications is more challenging.
Previously, we introduced a preliminary method to measure bone surface roughness, 15 and in this article, we introduce a robust three-dimensional surface roughness algorithm that maps the surface topography from microCT data of normal and arthritic rat joints. The utility of the algorithm is demonstrated in a rat CIA model following treatment with methotrexate (MTX), an RA drug typically used in the clinic.
Methods
Algorithm Development
Surface Roughness Analysis
Generation of the Isosurface. Several techniques are available for the generation of surface models, also called meshes, from volumetric objects that have been segmented from background volume regions. The geometric technique of surface mesh generation used in this work was marching cubes. 16 The marching cubes algorithm is a standard surface generation technique whereby a voxel (a cube) is described by the eight corners of that cube. The edges of the cube that are intersected by the surface are triangulated and connected to adjacent triangulated cubes, ultimately creating an enclosed, continuous mesh that represents the surface model of the object. The derived surface models are formed by a set of small triangles on the surface, and each triangle is described by three vertices and a normal vector (indicating the direction of the triangle face).
Prior to generating the surface model, the CT data set is thresholded to segment bone from background, and this is done using the histogram of the data to identify the intensity midpoint between the soft tissue and bone peaks. Voxel averaging effects are negligible because the image contrast is strong and resolution is high. The quantification of roughness in the rat samples was performed on the isolated talus bone per our previous experiments with rat arthritis. 15 More specifically, we have found that the CIA model results in consistent damage to the talus bone; thus, for algorithm development and robust drug evaluation, we typically apply analysis only to the talus bone. The talus bone was automatically segmented from the microCT data set using a custom and unpublished segmentation algorithm also developed by us.
Analysis of the Isosurface. Using the isosurface mesh and, more specifically, the normal vectors from that surface, we devised a method to quantify the roughness of that surface that has been valuable for the characterization of bone surface erosions in arthritic disease. For any given triangle, the angles between the normal vector of that triangle and neighboring normal vectors were calculated. Specifically, a starting vector was chosen (the starting vector is random and has no influence on the result). Next, a neighborhood of adjacent triangles (vectors) is determined around the starting vector (ie, the neighborhood is a circular region across the surface of the object where the starting vector is the central vector). For the studies included herein, a circular neighborhood of radius 11 was chosen for analysis. The angle between each vector in the neighborhood is calculated with respect to the central vector, and the average angle is computed. The neighborhood size, which is discussed in depth later, is determined by the researcher and is chosen to provide a region large enough to sample the local surface. The process was repeated for every normal vector on the isosurface (ie, all vectors are tested as the central vector of a neighborhood). Having a local neighborhood measurement of mean angle values, images of roughness can be produced, which allow the visualization of the severity of the surface deviations in local regions. Further, additional postprocessing can be used with this information to create global estimates of roughness for the entire sample.
Global Roughness Analysis: Integrated Angle Roughness Method. In this study, we present only one of the postprocessing roughness indices that we have developed: integrated angle roughness (IAR). The first step is to compile the angle information in the roughness image into a histogram. It is necessary to remove the effects of object form before calculations of local roughness are undertaken. To accomplish that, the histograms from the normal (ie, nondiseased) samples are used to create a composite (average) histogram of angles. This control histogram is then used as the comparison for all samples in the study. Next, a threshold angle is defined to differentiate between angles associated with smooth and rough neighborhoods. To determine the angle threshold for the IAR analysis, the composite angle histogram is fitted to a gamma distribution function with the probability distribution of

The threshold for IAR numeric integration, TIAR, is then calculated as the mean plus 2 SD:

Only angles above the mean represent roughness; thus, the threshold, TIAR, is always set above the mean. Using the calculated threshold, all of the histogram files—normal, vehicle, and treated—for all data sets are numerically integrated for all angles greater than the threshold according to

Roughness images and angle information is performed using software created at Millennium Pharmaceuticals, Inc., (Cambridge, MA), and IAR calculations are performed using IDL (Research Systems, Inc., Boulder, CO). Statistical analysis was performed using Prism, version 4.01 (GraphPad Software, San Diego, CA). All data are presented as mean and standard error of the mean (σ M). To determine the efficacy of compound treatment, the data are presented as the percent inhibition of bone erosion according to
MicroCT Imaging
Test Phantom
The algorithm was tested on a phantom object that modeled roughness. A phantom was made from a pencil eraser. The eraser was first imaged as a smooth object and then damaged with a scalpel to emulate a rough surface (and imaged again). Further, to test the sensitivity of the algorithm, a small defect was simulated by digital deletion of surface voxels from the microCT image. Specifically, an irregularly shaped defect measuring 0.31 mm wide, 0.1 mm deep, and 0.17 mm long (maximum distances) was made by deleting 93 voxels. Therefore, in total, three phantom data sets were used for algorithm testing: smooth, rough, and digitally damaged.
Rat CIA Model
All animal experiments were conducted according to the Institutional Animal Care and Use Committee standards of Millennium Pharmaceuticals, Inc. Two-month-old female Lewis rats (Charles River, Kingston, NY) were randomized into two groups of negative controls and CIA animals (numbers are discussed below in the experiment design section). Arthritis was induced by intradermal injection of 0.3 mL (100 μL at three sites at the base of the tail) of an emulsion containing 2 mg/mL of bovine type II collagen (CII) (Elastin Products Co. Inc. Owensville, MO) in Incomplete Freund's Adjuvant (IFA) (Difco Laboratories, Detroit, MI) on day 0 at the base of the tail using a 30-gauge needle. A second injection was given on day 7. Control rats were injected with an equal amount of IFA only. The volume of both hind paws was measured using a water displacement plethysmometer (Ugo Basile Biological Research Apparatus, Italy), and the onset of arthritis was indicated by increased paw volume, which appeared on approximately day 12. Both paw volumes and body weights were measured throughout the study every 2 to 3 days (data not shown) for the duration of the disease.
MicroCT Experiments
Three separate animal experiments were performed. In the first design serial, 12 rats were randomized into two groups of negative controls (n = 4) and CIA animals (n = 8). Arthritis was induced, and 21 days after CII injection, the rats were euthanized with CO2, and the right hind ankle was excised for microCT. This study facilitated all algorithm development and image acquisition optimization. To see the sensitivity of the algorithm, we undertook two more studies in which the disease-related effects were altered either by age or by treatment.
In the second experiment, 20 rats were randomized into three groups: negative controls (n = 4), 21-day CIA animals (n = 8), and 41-day CIA animals (n = 8). Either 21 or 41 days after CIA initiation, the right hind ankles were harvested from the 21-day or 41-day groups, respectively, and submitted for microCT. The negative control group was harvested at 41 days to assess any age-related changes from 21 days. This experiment was conducted to retest the day 21 result and to assess the changes associated with appreciably longer disease duration.
A third experiment was conducted to study the effects of MTX treatment. Twenty-eight rats were randomized into four groups: negative controls (n = 4), CIA animals (n = 8), CIA animals with 0.1 mg/kg MTX (n = 8), and CIA animals with 0.05 mg/kg MTX (n = 8). MTX was administered orally each morning using a 20-gauge feeding needle, starting on day 12 and continuing to day 21. In this study, CIA was allowed to progress for 21 days, at which time, the right hind ankles were harvested and submitted for microCT. This experiment was conducted to demonstrate the value of roughness analysis in a preclinical drug treatment study.
MicroCT Parameters
MicroCT was performed on a Scanco μCT-40 (Scanco Medical AG, Zurich, Switzerland). Approximately 200 to 300 slices, with 37.6 μm slice thickness, were acquired on a 1,024 × 1,024 image matrix with a digital resolution of 36 × 36 × 37.6 μm and a 150-millisecond exposure time (at 70 kVp, 114 mA, and 1,000 projections equally spaced over 360°). The imaging parameters used in this study were held constant for phantoms and ex vivo joint specimens.
Results
The phantom sample used to demonstrate the IAR method is shown in Figure 1. Specifically, this figure contains three-dimensionally rendered views of the normal eraser (see Figure 1A), the damaged eraser (see Figure 1B), and the normal eraser with the small hole imposed by voxel deletion (see Figure 1C) (hole highlighted by the red box). The bottom three images show the roughness images of the normal eraser (see Figure 1D), the damaged eraser (see Figure 1E), and the normal eraser with the small hole (see Figure 1F). The IAR value quantifies the global surface roughness, and the measured value of the normal and damaged eraser increased from 8,848 to 67,873—an increase of 667% (despite a volume reduction of only 7.4%). Further, the sensitivity of this measurement is exemplified by the 9% change in IAR observed simply by the presence of the small surface defect (IAR value 9,641 vs the 8,848 measured for the smooth object). The defect—visible on Figure 1, C and F—measured 93 voxels; thus, the resulting volume change was a mere 0.006%.

Comparisons of three-dimensionally rendered micro–computed tomographic (microCT) images and calculated roughness images from the eraser test samples. A to C show the three-dimensionally rendered images of the microCT data sets of the original, damaged, and microdamaged erasers, respectively, and D to F show the corresponding roughness images. As indicated by the color scale, purple denotes a relatively smooth surface and is the predominant color in the normal (D) and microdamaged (F) samples. In contrast, the roughness image of an eraser damaged via a scalpel (E) has regions of light blue and green, indicating increased roughness compared with normal, and these regions of roughness match the damaged regions visible on the three-dimensionally rendered image (B). In F, note the sensitivity of the roughness algorithm to the microdamage (highlighted with a red box in C). The deletion of 93 voxels from the surface of the object—a minute fraction of the overall surface—is easily enhanced by the roughness algorithm.
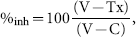
Figure 2 shows roughness images for the test study conducted on CIA. Figure 2, A and B, shows the calculated roughness images from the controls and CIA diseased talus bones, respectively. As indicated by the color bar, the bright areas on the grayscale image correspond to local roughness. Figure 2C shows the global IAR parameter used to quantify the roughness. The IAR value increased 559% (p < .0001). Additionally, Figure 2D shows an example of the histogram files used to calculate the IAR parameter. Four control talus bone traces are shown (red dots) with the calculated composite normal (blue line), and two 21-day CIA diseased samples are shown (orange and green lines). The difference between the control and two example diseased bones is apparent. The right shift in the histograms results from higher measured surface angle differences and, hence, increased surface roughness. It is evident in Figure 2D that a typical histogram file from an arthritic bone has a larger area to the right of the threshold than the controls.
Comparison of normal and day 21 collagen-induced arthritis (CIA) in the talus of a rat. The normal (sham) sample (A) has no regions that have been defined as rough. The relative degree of roughness is indicated by the color bar, and the red areas on the CIA sample (B) highlight the regions of erosion on the surface of the bone. C shows the compilation of integrated angle roughness values from this study and demonstrates a significant increase in roughness associated with the arthritic model.
Figure 3 shows the application of this algorithm for the serial characterization of progressive rat arthritis. Figure 3, A, B, and C, shows the control, 21-day, and 41-day talus bone roughness images, respectively. Figure 3D shows the resulting IAR analysis of roughness of the talus bone. After 21 days, the measured bone surface roughness was 486% increased above the normal value. At 41 days, the roughness of the bone surface progressed and demonstrated an 857% increase above baseline. Further, the IAR value increased 63% from day 21 to day 41 (10,550 ± 3,475 vs 17,240 ± 5,366). The IAR roughness values at day 21 of both experiments are only slightly different, likely owing to disease variability. Further, the control talus bones in both studies had quite similar IAR mean values of 1,870 ± 172 and 1,800 ± 136 (experiments 1 and 2, respectively) despite different harvest days (21 and 41 days).

Comparison of normal, day 21 collagen-induced arthritis (CIA), and day 41 CIA in the talus of the rat. As indicated by the color bar, the bright (white) regions on the 21-day (B) and 41-day (C) samples correspond to bone surfaces with significant erosion owing to the disease. As in Figure 2, the normal bone (A) shows no bright regions and, hence, no roughness. The associated graph (D) confirms the findings of the previous study (shown in Figure 2C) and demonstrates that the bone surface roughness in rats subjected to 41 days of disease increases significantly from the normal (sham) and 21-day groups.
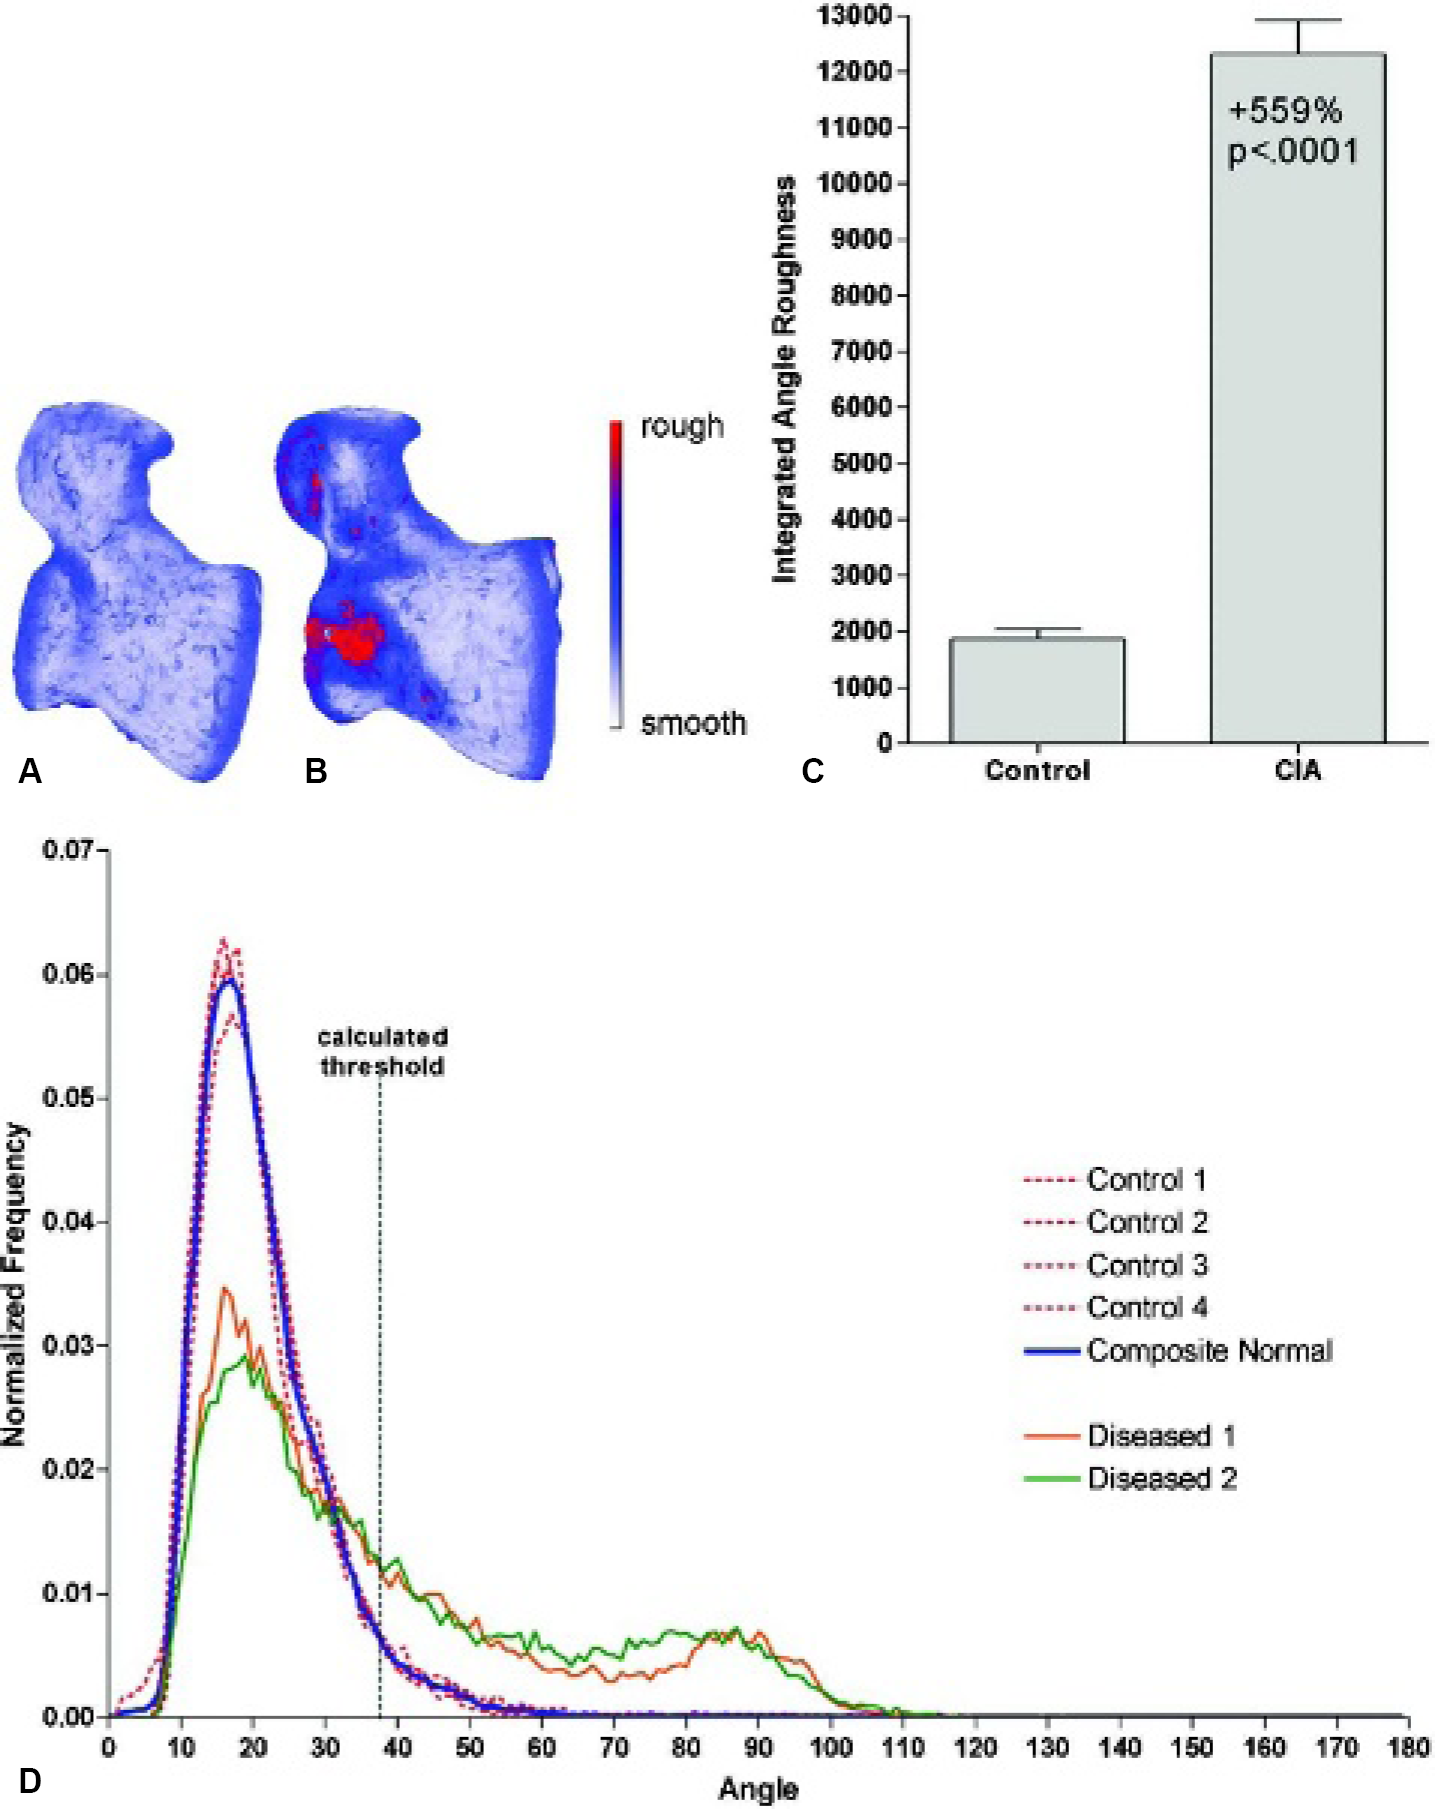
Figure 4 shows the results of roughness analysis in a study of MTX treatment in the rat CIA model. Figure 4, A to D, shows the control, vehicle, 0.1 mg/kg MTX, and 0.05 mg/kg MTX groups, respectively. Figure 4E is the IAR analysis of the samples and shows that 0.1 mg/kg MTX administered once per day is efficacious for the prevention of bone erosion in this model (inhibits erosion by 98%). Treatment with 0.05 mg/kg MTX daily was less effective, however, only inhibited bone erosion by 22%, and was not statistically different from the vehicle-treated group.
Discussion
The eroded surface of the bones in arthritic joints is a hallmark of the disease,1,2 and conventional radiography has limited ability to quantify pathology on the surface of bones.4,5 Further, it is acknowledged that bone loss is a major and, as yet, unsolved problem in RA. 17 In the preclinical research environment, the robust quantification of disease pathology and treatment response is critical to the decisions made regarding the advancement of candidate compounds. In that regard, several recent publications have demonstrated the value of data obtained from small animal imaging studies of RA and drug therapy.7,15,18–23 Imaging data also provide additional information beyond the traditional small animal arthritis assays, such as clinical scoring of joint function and measurement of paw swelling, which were also performed in this study. Paw swelling, an indication of the onset and severity of inflammatory disease, correlates weakly and variably. In the studies included in this work, the paw swelling was maximized around day 18 or 19 (increasing from 1.27 ± 0.04 mL at baseline to 2.4 ± 0.35 mL) and then regressed slightly by day 21 (to 2.2 ± 0.27 mL). The correlation coefficient (r2) between the day 21 paw volume and IAR value is 0.81 (p < .001); however, we have found that the overall correlation, measured across many studies, is lower (unpublished data). Part of this may be due to the slight reduction in swelling by day 21, but it also represents that paw volume (swelling) and bone roughness measure two distinct aspects of the same disease that arise as a result of different biologic mechanisms. In that regard, bone erosion measurements via roughness analysis provide additional information for the characterization of RA in rodent models.
Comparison of normal, day 21 collagen-induced arthritis (CIA), and day 21 CIA with methotrexate (MTX) treatment in the talus of the rat. As indicated by the color bar, purple and blue represent relatively smooth regions, whereas green and yellow correspond with surface roughness. As in previous examples, the 21-day CIA sample presents with significant roughness. C and D represent MTX-treated groups at 0.1 mg/kg and 0.05 mg/kg, respectively. The integrated angle roughness values for the study are shown in E. Both the images and the graph support the value of MTX treatment in this model for the protection of the cortical bone surface from erosion. In fact, 0.1 mg/kg MTX administered twice daily for 10 days (days 12–21 following disease induction) virtually blocks all bone erosion (98% inhibition).
For pharmaceutical research, the utility of such an algorithm is best demonstrated in drug treatment studies, as shown in this work with treatment by MTX. MTX remains the most commonly used disease-modifying antirheumatic drug worldwide 24 and continues to be used in combination with other therapies, such as etanercept,25–27 infliximab,28–30 leflunomide,31–33 and adalimumab.34,35 Figure 4 demonstrates that administration of 0.1 mg/kg MTX by oral gavage once per day is beneficial for the prevention of bone erosion as measured by our roughness algorithm in the rat CIA model of RA. A dose-dependent effect can be seen in the fact that the second dose group (0.05 mg/kg) did not provide the same benefit as the 0.1 mg/kg dose.

Demonstration of the neighborhood size impact of roughness analysis. The white circle superimposed on the image demonstrates the relative size neighborhood used for analysis—5 (A), 11 (B), 21 (C), or 41 (D) vectors in diameter. The software automatically imposes the circle at the point of the lowest measured roughness; thus, the images must be rotated differently to show the circle. Grayscale images are shown to better demonstrate that the larger neighborhood size results in a larger calculated average angle value (all images are scaled similarly).
In these analyses, the talus bone was isolated from the ankle for analysis. For one, the talus consistently presents with damage in the rat CIA model and as such is a suitable representation of the whole ankle. Further, analysis of only the talus bone of the rat ankle (as opposed to all bones) was done to be consistent with our historical experience. 15 In fact, erosions in the talus bone across animals and studies are isolated to three distinct regions of the talus bone: the dorsal aspect of the neck and head of the talus consistent with (although not yet confirmed by histology) the insertion points of the dorsal talonavicular ligament, the superior surface of the talus body that articulates with the tibia, and the medial aspect of the talar body (which in severe cases erodes through and connects with the superior surface erosion, resulting in a superomedial hole in the bone).
In our work, we focused on creating an algorithm that (1) could differentiate object form from local roughness, (2) is highly sensitive in the application of rat arthritis models, and (3) could easily be adopted by researchers for the visualization and measurement of local and global roughness. As such, all images shown in Figures 2 to 4 are direct maps of roughness, and the graphs are IAR values. Although previous algorithms have been proposed, 36 the distinctive aspects of our methods include the definition of surface vectors and orientations, the global assessment (calculation) of roughness, and the display of roughness images. Per the latter, the images shown in this article are modified isosurface maps—calculated images whereby the value of a surface element equals the measured roughness for that element. So the bone images shown are not simply three-dimensional surface meshes but rather roughness maps for that bone, allowing the researcher to locally examine regions of that bone, as evidenced by our detailed analysis of the anatomic origins of erosion on the rat talus presented above. A further distinction in this algorithm is the method of deciphering roughness from normal object form using the gamma-variate function thresholding. This is an important procedural step to increase the sensitivity of the IAR calculation. In the two CIA studies presented, the calculated threshold was 38° and 36°, and we have found in internal studies analyzed using this method that the calculated threshold is very stable and always between 36° and 38°, which further demonstrates the stability of the analysis method across studies. Other methods exist that have been applied in medical imaging applications, such as those based on fractal analysis37,38 and other surface topology techniques39,40; however, we expect easier acceptance of our algorithm and a higher adoption rate in pharmaceutical studies owing to its relative simplicity, ease of use, and visualization capabilities.
The sensitivity of the roughness analysis method becomes increasingly valuable in animal models of arthritis with more subtle bone phenotype or in studies incorporating drug treatment. In our previous publication, bone volume analysis and roughness analysis were presented as methods for quantifying disease-related bone erosion in the rat adjuvant-induced arthritis (AA) model. 15 The AA model is quite severe in relation to the CIA model, and as such, a metric such as bone volume can be used in studies of AA. The CIA model, however, demonstrates bone volume reductions on the order of 10% and is not a reliable marker of disease activity. In fact, in experiment 2, the bone volume decline in the talus bone was 11% after 21 days and 9% after 41 days. The data and images suggest that new bone growth coupled with the bone erosion may further desensitize the volumetric analysis of CIA data after 21 days of disease. Roughness analysis of the bone surface in CIA, as demonstrated in this article, gives changes on the order of 500% after 21 days of CIA in rats and 857% after 41 days, and insofar as compared with volumetric analysis, surface roughness metrics are much more sensitive and informative. Further, measuring the extent of bone erosion in preclinical models of RA may provide value for demonstrating clinical utility, in which physicians monitor bone erosions from planar radiographic scans for the diagnosis and staging of human RA.
The predecessor roughness algorithm, also created for use with microCT images of normal and arthritic rat paws, was quite different. 15 In that algorithm, roughness was based on calculations of the bone object perimeter smoothness in two and three dimensions and was inherently complicated by object orientation and anisotropy (roughness measured from alternate image planes could be quite different). Much of the directional limitation was minimized by averaging roughness calculations in the three orthogonal planes. It is important to recognize that the isosurface vertices and polygons of the current method exist in three-dimensional space and are not limited to the orthogonal slice planes that restricted the original voxel-based roughness analysis. In that regard, sample orientation during scanning is irrelevant for a three-dimensional method, thus eliminating anisotropy as a limitation. This point is not trivial for the application of this method for in vivo analysis, in which joint position would be very difficult to fix from animal to animal and day to day.
An operational parameter of special interest in the algorithm is the choice of the neighborhood. The neighborhood of surface vectors to include in the roughness analysis is user dependent and can have some effects on the result. The neighborhood is defined as the radius from the central vector. Examples of the neighborhood can be seen on Figure 1D (the blue ring visible on the mostly purple object) and Figure 5, in which the white circles depict neighborhood sizes of 5, 11, 21, and 41. It is important to clarify that all of the analysis in this article has been performed with a neighborhood size of 11. Figure 5 has been included only to aid in the discussion of the neighborhood ramifications on roughness analysis. In general, the larger the neighborhood, the more normal object form will be included in the calculation of the average angle. It is obvious in Figure 5D that the ring representing the neighborhood is large with respect to the entire object. Further, one may note that Figure 5D is brighter than the previous images (Figure 5, A-C), and the object appears rougher owing to the large neighborhood size. The IAR analysis, which is performed after the roughness image is created, is not very sensitive to the neighborhood size selection because of the calculated threshold (equation 3). At this point, we have found that using some user expertise to determine a neighborhood suitable for the anatomy (object) of interest is preferential to other arbitrary shape metric. Our applications, however, may benefit from the information obtained using a multineighborhood analysis.
We have found great utility for roughness analysis of multiple rat and mouse models of arthritis, including genetically modified (transgenic and knockout) mice, and of small animal arthritis with compound treatment (unpublished data, 2002–present). Potential applications exist outside arthritic bone characterization, such as bone pathologies (eg, osteolytic cancer).
In conclusion, quantitative image analysis, such as bone surface roughness evaluation, is important in preclinical drug development, in which analysis must provide consistent methods with minimal user intervention and robust output. In this article, surface roughness analysis has proven successful for the characterization of bone erosion in rats following CIA.