
Abstract
The shape of dose response of ionizing radiation (IR) induced cancer at low dose region, either linear non-threshold or J-shaped, has been a debate for a long time. This dose response relationship can be influenced by built-in capabilities of cells that minimize the fixation of IR-mediated DNA damage as pro-carcinogenic mutations. Key capabilities include sensing of damage, activation of cell cycle checkpoint arrests that provide time needed for repair of the damage as well as apoptosis. Here we describe computational modeling of the signaling pathways that link sensing of DNA damage and checkpoint arrest activation/apoptosis to investigate how these molecular-level interactions influence the dose response relationship for IR induced cancer. The model provides qualitatively accurate descriptions of the IR-mediated activation of cell cycle checkpoints and the apoptotic pathway, and of time-course activities and dose response of relevant regulatory proteins (e.g. p53 and p21). Linking to a two-stage clonal growth cancer model, the model described here successfully captured a monotonically increasing to a J-shaped dose response curve and identified one potential mechanism leading to the J-shape: the cell cycle checkpoint arrest time saturates with the increase of the dose.
INTRODUCTION
Ionizing radiation (IR) is a special environmental stressor and causes DNA damage that, if not adequately repaired, results in pro-carcinogenic mutations and eventually in cancer (Little, 2003). A linear no threshold (LNT) dose-response model for IR-induced cancer is assumed as a default in the absence of information to the contrary (Upton, 2002). Recent Biological Effects of Ionizing Radiation (BEIR) VII reports concluded that the risk of cancer proceeds in a linear fashion at lower doses without a threshold (BEIR, 2006). The underlying assumption that supports LNT model is that a single DNA damage is capable of inducing a tumor. However, laboratory results of IR indicate a J-shaped or hormetic dose response relationship in the low dose region (Cohen 1995; Redpath et al. 2001; Boreham et al. 2006; Sakai et al. 2006; Day et al. 2007; Mitchel 2007a, b; Tubiana et al. 2006, 2009). To investigate the conflict between the experimental observations and the LNT model is important because the difference of the regulation costs based on LNT or J-shaped model are dramatic.
Figure 1 indicates the difference between the predicted adverse responses in the low dose region based on LNT model and J-shaped model, respectively (Calabrese and Ricci, 2010). It is seen that the regulatory concept of one in a million cancer risk becomes irrelevant when the J-shaped dose response model is correct. Thus we could spend billions of dollars to establish a regulation, which could just be an overprotection. Therefore more mechanism-based dose response model for IR needs to be developed in order to explore if the fundamental biological mechanism support a J-shaped dose response relationship as indicated in the experiments.

Biphasic (hormetic) Dose-response Model for Cancer Incidence (the percent response in the controls must be non-zero). Protection is “optimized” because it is greatest at a dose range furthest away from a non-zero percentage response in the controls. The black dots identify exposure-response points that are – or should be – included in any complete analysis otherwise the empirical relationship (based on the white dots) cannot be estimated and thus the default appears to be sound when it is not.
The intent of the current manuscript is to introduce new conceptual approach to the analysis of dose-responses for IR-induced adverse health effects and to provide a preliminary example. Our concept is that computational models of biochemical signaling pathways can be developed and used to refine predictions of dose-response. For development of quantitatively accurate, predictive models it will be necessary to describe tissues consisting of multiple cell types where the different types each contribute in their own way to the overall function of the tissue. Such a model will probably need to incorporate not only cell type-specific data but also spatial information on the architecture of the tissue and on intercellular signaling. The scope of the current model is, however, more limited. Data obtained in a number of different biological systems are synthesized to describe a chimeric, “average” cell. Biochemical signaling pathways involved in sensing of DNA damage and in the activation of cell cycle checkpoint controls and the apoptotic pathway are described. As with any computational modeling effort, it is necessary to develop such initial descriptions (models) that can be iteratively refined. Our preliminary model thus defines a starting point which, with time, can evolve to a level of refinement where large amounts of detailed biological information are synthesized and a capability for robust predictions of dose- and time-response behaviors is obtained. We expect that our preliminary effort will be of interest not only to computational modelers interested in dose-response but also to radiation biologists who will (hopefully) develop the datasets needed to refine the model.
For IR-induced DNA damage, checkpoint arrest and apoptosis serve, among other things, as defensive responses. These responses lead ultimately to cell death or cell survival (Fei and El-Deiry, 2003). Both responses contribute to bystander effects (Wang et al. 2004; Azzam et al. 2000) and may also be involved in nonmonotonic dose-response (Conolly and Lutz, 2004). Moreover, checkpoint arrest and apoptosis have significant implications for cancer dose response. Checkpoint-induced delays in cell cycle increase cell generation time and thus decrease cell proliferation rate, which is an essential parameter in clonal growth models of tumor incidence (Moolgavkar and Knudson, 1981). Cell loss due to apoptosis leads to compensatory regenerative proliferation, which is a risk factor for cancer (Tan et al. 2003). The signaling networks that mediate these responses are sufficiently complex that computational models are useful (and perhaps even essential) adjuncts to laboratory studies of pathway structure and dynamic behavior (Bhalla et al. 2002; Qu et al. 2003a; Qu et al. 2003b; Novak et al. 2001).
MODEL DEVELOPMENT
A modular approach was used to construct the overall computational model linking IR-mediated DNA damage with activation of cell cycle checkpoint controls and apoptosis. Module 1 describes an empirical linkage of IR with DNA damage; Module 2 provides a molecular level description of the signaling pathways linking DNA damage with target proteins that induce checkpoint arrest and apoptosis; and Module 3 describes the molecular mechanisms of the G1/S and G2/M cell cycle checkpoint controls. Modules 2 and 3 are the main focus of this report. In future work the overall model could be extended by adding additional modules describing bystander effects and tumor incidence. Future work could also involve iterations of the current model structure and parameterization to reflect improvements in our understanding of the relevant biology.
Module 1
IR causes DNA damage, with double strand breaks (DSBs) being the most significant lesions (Criswell et al. 2003). DSB may arise through direct hits by IR or as secondary damage from reactive oxygen species (ROS) (Feinendegen et al. 1999; Feinendegen, 2002; Slupphaug et al. 2003). In Module 1 IR generates ROS and ROS cause DSB (Fig. 2). Direct formation of DSB by IR is not described. Repair of DSB is included in the model but we have not attempted to describe the detailed molecular mechanism of this process.

IR-mediated DNA damage, sensing of the damage by ATM, p53-dependent G1/S and G2/M cell cycle checkpoints and apoptosis. (and —| imply activation and repression, respectively. Note the central role of p53 in the signaling pathways. The large ovals at the bottom left and right indicate proteins and interactions in the G1/S and G2/M checkpoints, respectively.
Module 2
Module 2 is the signal transduction module. The transducer and effector phases of molecular mechanisms that are activated in response to IR are described (Fig. 2). DSB activate ataxia telangiectasia-mutated kinase (ATM) by autophosphorylation (Criswell, et al. 2003; Bakkenist and Kastan, 2003; Bartek and Lukas, 2001; Mikkelsen and Wardman, 2003). ATM plays a role in DSB repair by binding to the broken ends of the DNA strands created by DSB. DSB repair is defective in ATM-deficient cells (Yang et al. 2004). We thus assumed that the rate of DSB repair (Module 1) is proportional to the activity of phosphorylated ATM, and to the amount of DSBs.
Notwithstanding its role in DNA repair, the primary function of ATM is to phosphorylate and activate the transcription factor p53 (Adams and Carpenter, 2006) (Fig. 2). p53 is a critical mediator of cellular responses to DNA damage in IR-exposed mammalian cells (Criswell et al. 2003; Mikkelsen and Wardman, 2003; Pietenpol and Stewart, 2002; Agarwal et al. 1998). p53 signals to the G1/S checkpoint through p21 and to the G2/M checkpoint through 14-3-3σ and GADD45 (Fei and El-Deiry, 2003; Criswell et al. 2003; Taylor and Stark, 2001).
Cyclin E and its dependent kinase (Cdk2) form a heterodimer (CycE) that stimulates progression of the cell cycle from G1 to S (Fig. 2). p21 inhibits CycE, and p53 mediated transcriptional activation of p21 thereby invokes the G1/S checkpoint arrest (Taylor and Stark, 2001; Sekiguchi and Huter, 1998). The role of CycE in the G1/S transition is covered in the description of Module 3.
Cyclin B and its dependent kinase (Cdk1) form a heterodimer (CycB) that stimulates progression of the cell from G2 into mitosis (Fig. 2). 14-3-3σ anchors CycB in the cytoplasm, thereby blocking mitosis (Taylor and Stark, 2001). GADD45 dissociates the CycB heterodimer and therefore also blocks mitosis (Taylor and Stark, 2001). p53 mediated activation of 14-3-3σ and GADD45 thus invokes the G2/M checkpoint arrest. The role of CycB in the G2/M transition is covered in the description of Module 3.
p53-dependent signaling also mediates entry into the apoptotic pathway through effects on Bax and Bcl-2 (Fig. 2) (Fei and El-Deiry, 2003). Bax is pro-apoptotic and is transcriptionally activated by p53 (Levine, 1997; Chao et al. 1995; Thomas et al. 2000). Bcl-2 is anti-apoptotic and is transcriptionally repressed by p53 (Fussenegger et al. 2000). Both Bax and Bcl-2 signal to caspase 3, which are proteases at the core of the apoptotic machinery (Fussenegger et al. 2000).
In addition to this relatively simple description of the p53-dependent checkpoint arrest and apoptosis pathways, two more complex versions of Module 2 are described in the Appendix that illustrate how pathway architecture determines the robustness (Kitano, 2004) of the system. Here, robustness refers to the ability to maintain a significant level of functionality when pathway components are missing or inoperative due to mutations. Redundancy in signaling pathways can also serve to enhance the degree of biochemical response to an input such as DNA damage. These pathways include Chk2-dependent checkpoint arrest (Fig. A-1) and c-Abl – p73 dependent apoptosis (Fig. A-2) (Levrero et al. 2000).
Module 3
Module 3 describes key aspects of the molecular mechanisms of the G1/S and G2/M cell cycle checkpoints. The G1/S checkpoint controls entry into S phase, ensuring that: (1) the cell is large enough to warrant a new round of DNA synthesis, (2) any damage suffered by the DNA has been repaired, and (3) external conditions are favorable for mitotic cell division (Elledge, 1996). The G2/M checkpoint guides entry into mitosis, confirming that (1) DNA is fully replicated, (2) any new damage sustained by the DNA has been repaired, and (3) the cell is large enough to divide (Gardner and Burke, 2000). Therefore, both G1/S and G2/M are important checkpoints relevant to DNA damage.
The term “DNA damage checkpoints” is sometimes used to refer to functional points in the cell cycle where the cell monitors for the presence of DNA damage and, if damage is found, initiates a cascade of events leading to cell cycle arrest until the damage is repaired (Laiho and Latonen, 2003). Therefore, the G1/S and G2/M checkpoints in the cell cycle are DNA damage checkpoints.
Module 3 was developed to describe the G1/S and G2/M checkpoints. Our approach was based on that used by Tyson and co-workers, where checkpoints are activated by inhibitory phosphorylation of key proteins, and cell growth (i.e., the increase in cell size or cell mass with time) drives progression around the cycle (Kapuy et al. 2009; Tyson and Novak, 2001; Tyson et al. 2001). It is assumed the key reactions which drive checkpoint transitions take place in nucleus. The concentrations of the effective key regulators accumulate when cell grows and the effective concentration should equal to the product of cell mass and actual concentration of the key regulators. Our description of the G1/S checkpoint is a synthesis of information taken from literature review. The description of G2/M checkpoint control is a modified version of the model developed by Tyson et al. (2001).
The key proteins controlling the G1 to S transition in a mammalian cell cycle are the CycEs (Koepp et al. 2001; Moberg et al. 2001), which are thought to initiate DNA replication (Iliakis et al. 2003). To keep our model as simple as possible, we only considered the heterodimer – cyclin E and Cdk2. No description of the interactions between CycE monomers was included. Since Cdk is only active when associated with its cyclin partner (Koepp et al. 2001), we considered it acceptable to ignore its monomer form in this initial model of the system.
E2F, Rb, and p27 all interact with cyclin E (Sherr and Roberts, 2004; Leng et al. 1997; Russo et al. 1996). E2F is a transcription factor for cyclin E and thus promotes G1/S progression (Bartek and Lukas, 2001; Yamasaki, 2003; Ohtani, 1999). Rb is thought to regulate progression through the G1 phase of the cell cycle (Ohtani, 1999; Gala et al. 2001; Morris and Dyson, 2001) by inhibiting the activity of E2F through formation of Rb-E2F complexes (Morris and Dyson, 2001; Wells et al. 2003; Weintraub et al. 1992; Arroyo and Raychaudhuri et al. 1992).
Formation of the Rb-E2F complex not only determines the activity of cyclin E but also is regulated by CycE. That is, Rb can be phosphorylated by CycE, inhibiting Rb activity and enabling release of active E2F to promote entry into S phase (Leng et al. 1997). CycE can phosphorylate both Rb and Rb-E2F complexes in the model, as experimental observations show (Qin et al. 1992). The net effect of the CycE-Rb-E2F-CycE regulatory loop is to form a molecular switch that synergizes CycE activation when CycE levels are rising (Halaban, 1999). These are the main controlling factors for Rb (Qu et al. 2003a; Degregori, 2004) and the total Rb activity is assumed to be constant and not regulated by other factors in the model.
Activity of CycE is also stimulated by interactions between CycE and p27. CycE is inactive when complexed with p27. Ubiquitylation of p27, however, causes dissociation of the CycE-p27 complex (Akli et al. 2004; Furukawa, 2002; Lane et al. 2001). The trigger for p27 ubquitylation is phosphorylation of p27 by CycE (Sherr, 2000; Li et al. 2004). As indicated by experimental observations, CycE is assumed in the model to phosphorylate both p27 and p27-cycE complexes (Sherr, 2000; Yang et al. 2004). The result of the CycE-p27-CycE regulatory loop is the same as that of the CycE-Rb-E2F-CycE loop, i.e., to synergize CycE activation as CycE levels are rising. The relative importance of these two loops in increasing CycE levels is not clear, although most of the literature to date has focused on the loop containing Rb. P27 activity is assumed to have a zero order synthesis and a first order degradation.
Our depiction of the G2/M checkpoint is based on the antagonism of CycB and Wee1 as well as the positive feedback of CycB and Cdc25c (Tyson et al. 2001; Tyson et al. 2002; Novak et al. 2007). Entry of the cell into mitosis is promoted by CycB, which is thus the key complex of the G2/M checkpoint (Kaufmann, 1998; Bahassi et al. 2004). The mutual phosphorylation between CycB and Wee1 inhibits each other. Cdc25c activates CycB by dephosphorylation; CycB activates Cdc25c by phosphorylation. These two feedbacks induce and then synergize the switch-like behavior of CycB in the G2 to M transition. The G2 state corresponds to an inactive CycB, an inactive Cdc25c and an active Wee1 activity. The mitotic state corresponds to an active CycB, an active Cdc25c and an inactive Wee1 activity.
Mathematical Methods and Software
The mathematical model is composed of a set of ordinary differential equations (ODEs). The equations and their derivations are described in the on-line auxiliary materials. The dynamical system contains 33 ODEs and 127 parameters. When available, specific parameter values were taken from previously published sources. For example, for the equations modified based on Tyson's model of the cell cycle, we used the parameter values as published (Tyson et al. 2001). Whenever possible, the nature of the biological process was considered when assigning values to the kinetic constants. For example, rate constants for transcriptional reactions were assigned relatively small values, as transcription is a relatively slow process. When such information was not available, parameter values were assumed to generate the expected qualitative behaviors of the model. This approach to the assignment of parameter values has been used by others (Qu et al. 2003a; Qu et al. 2003b) and is reasonable for the first-generation model we have developed. A simple sensitivity study about the parameter values based on Monte Carlo simulation was conducted when comparing the simulation results with some of the experimental data during the model verification process. During the process, the parameter values are assumed to fit uniform distribution in the range of ±20% of the assigned parameter values.
To study the predictions of cell cycle behavior from the mathematical model, mathematical methods from nonlinear dynamics were applied. The results are displayed graphically, and illustrated by time course plots and phase plane plots for protein activity.
For a dynamical system with two variables x and y where dx/dt = f(x,y) and dy/dt = g(x,y), phase plane plots are used to study how x and y change relative to each other and to determine if the system has one or more steady states, i.e., f(x,y) = 0 and g(x,y) = 0. In the phase plane plot, a point on the x nullcline is identified by fixing the value of y and running the computational model to identify the corresponding steady state value of x. The entire x nullcline is developed by repeating this steady state analysis over the range of values of y that are of interest. The x nullcline is thus the set defined by f(x,y) = 0, or in other words, the set of values of x at which the system is at steady state for a range of values of y. Similarly, the y nullcline denotes steady state values of y for a range of values of x, g(x,y) = 0.
Intersections of the x and y nullclines identify steady states of the entire dynamical system. In a system with more than one steady state, each steady state is associated with a unique intersection of the nullclines. When the dynamical system has more than two state variables, the variables not represented in the 2-dimensional plot are assumed to be in a “pseudo-steady state”. That is, they change quickly with the variables of interest. In this manner, a system with more than two variables can also use phase plane plot to do analysis (Angeli et al. 2004).
MATLAB programs were developed to predict time course and draw phase plane plots (The Mathworks, Natick, MA, USA).
Data Transformation
Model predictions were qualitatively compared to experimental time course and dose response data taken from the literature. The experimental data are obtained in vitro and for specific types of IR. In order to compare model predictions with experimental data to see if the model prediction can capture the trend of experimental time course and dose response data, the experimental data were first linearly transformed and scaled. That is, the x and y coordinates of the transformed data were obtained by multiplying a constant to the x and y coordinates of the original data. For example, if the original data are represented by (X1o, Y1o), (X2o, Y2o), …(Xno, Yno) and the transformed data is represented by (X1t, Y1t), (X2t, Y2t), …(Xnt, Ynt), the original data and transformed data have the following relationship: X1 t/X1 o = X2 t/X2 o = … Xnt/Xno = a and Y1 t/Y1 o = Y2 t/Y2 o = … Ynt/Yno = b. Where, a and b are constants. In this manner, the consistency between model predictions and transformed data actually evaluates the ability of the model to qualitatively describe the time courses of protein activities and the shapes of dose response curves after exposure to IR.
RESULTS
Model Predictions Compared with Experimental Data
The model can be used to predict (simulate) post-irradiation effects of IR on protein activities. Total exposure to IR (IRD) is the product of the absorbed dose rate (IRR) and the exposure time (). Some post-irradiation experimental data for protein time courses are available, such as phosphorylated p53 and p21 in liver and confluent fibroblast cultures (Reynolds et al. 2004; Fournier et al. 2004). Qualitatively accurate simulations of phosphorylated p53 post irradiation activity and p21 post-irradiation activity were obtained for data from carbon-ion-irradiated confluent fibroblast cultures (Figs. 3 and 4, respectively; Fournier et al. 2004).

Comparison of model prediction and transformed experimental data for time course of p53p activity in carbon ion-irradiated confluent fibroblasts. Original data from Fournier et al. (2004). (Simulation condition: IRR = 0.18, t = 40 unit; Experimental condition: dose: 0.5 Gy; measuring time: 0, 1.5, 3, 6, 12, 24 hours after radiation, respectively).

Comparison of model prediction and transformed experimental data time course of p21 activity in carbon ion-irradiated confluent fibroblasts. Original data from Fournier et al. (2004). (Simulation condition: IRR = 0.5, t = 10 unit; Experimental condition: dose: 0.5 Gy; exposure duration: 0, 1.5, 3, 6, 12, 24 hours after radiation, respectively).
The model can also be used to predict the shapes of the dose response curves for protein activity versus IRR, DSB, or other upstream protein activity. Our simulation of a dose response curve for caspase 3 activity versus IRR provided a good description of transformed experimental data generated in a normal lymphoblastoid cell line by Fernet et al. (2003) (Fig. 5). Because Δt is a constant in the simulation, IRD is proportional to IRR in this case.

Comparison of model prediction and transformed experimental data for dose response curve of caspase 3 activity versus 137Cs-irradiated lymphoblastoid cells. Original data from Fernet et al. (2003) (Experimental condition: dose: 5, 10 and 20 Gy).
The parameter values used for the simulations in Figs 3, 4 and 5 were held constant while the exposure values varied for different cases.
During these comparisons, a sensitivity study for the parameter values was conducted. That is, the parameter values were first assumed to fit uniform distributions with minimum value equal to 80% and maximum value equal to 120% of the assigned values. Then Monte Carlo simulation is used to randomly draw parameter values from these uniform distributions. In 18 repetitions, the consistency between the simulation results and the experimental data are still found (Fig. A-3).
Analysis of Checkpoint Arrest with Phase Plane Plots
Phase plane plots were used to analyze predictions of checkpoint arrest following exposure to IR (Fig. 6). Phase plane comparisons of Rb and CycE nullclines in the G1/S checkpoint were developed for controls and IR-exposed conditions (Figs. 6a and 6b, respectively). As m (cell mass) increases from 0.33 to 0.39 to 0.5, the Rb nullcline moves to the left while CycE nullcline changes only for small values of Rb (Fig. 6a). At m = 0.33, the CycE and Rb nullclines intersect 3 times. These intersections define two stable steady states separated by an unstable steady state (the unstable steady state is also called a saddle point). The two stable steady states correspond to G1 and S. G1 is defined by high Rb and low CycE activities, while S is defined by low Rb and high CycE activities.

Phase plane plots of CycE and Rb nullclines in G1/S checkpoint without (a) and with (b) exposure to IR. The three panels for (a) show that, as cell mass (m) increases (0.33 § 0.39 § 0.5), the Rb nullcline moves to the left relative to the CycE nullcline and the stable steady state at low CycE disappears, triggering the switch to S phase. Under exposure to IR, the switch is activated only at higher m, thus allowing extra time for DNA repair.
As m increases from 0.33 to 0.39, the intersection of nullclines defining G1 state converges with the saddle point. As m increases to 0.5, the intersection of nullclines that defines G1 disappears and the cell switches into the S steady state. Thus, in the absence of exposure to IR, 0.39 is a critical value of m. The G1/S transition does not occur until the cell grows to this critical size. For this initial version of our model, the key point here is not the particular value of m per se, but rather the realization that as the cell increases in size a critical point is reached at which the cell switches from G1 to S.
The critical cell size associated with the transition from G1 to S increases in the presence of DNA damage under IR exposure (Fig. 6b). In this case, with IRR = 0.1, the critical value of m is 0.65. Recall that the critical value for the control case is 0.39. Activation of the G1/S checkpoint is thus evidenced by the extra time spent in G1 as the cell grows to this larger size (m = 0.65 vs. m = 0.39). This extra time provides time for DNA repair.
Phase plane plots comparing the CycB and Wee1 nullclines in the G1/S checkpoint also indicate that exposure to IR increases the critical value of m associated with the G2/M transition (Fig. 7).

Phase plane plots of CycB and Wee1 nullclines in G2/M checkpoint without (a) and with (b) exposure to IR. These plots show that larger cell mass (m) is required (0.85 vs. 0.64) for switching out of G2/M in the presence of DNA damage under exposure to IR.
Analysis of the choice of cell survival or death given various doses of IR
IR exposure and its consequent DNA damage lead ultimately to cell death or cell survival. Here, we examine the biochemical mechanism by which this decision is made at the G1/S checkpoint. As CycE and Rb have switch-like behaviors at the G1 to S transition, a comparison of the IR-induced and basal activities of CycE and Rb was used to identify how the checkpoint is activated (Fig. 8). High caspase activity, which is associated with entry into the apoptotic pathway, was used as a surrogate measure of cell death.
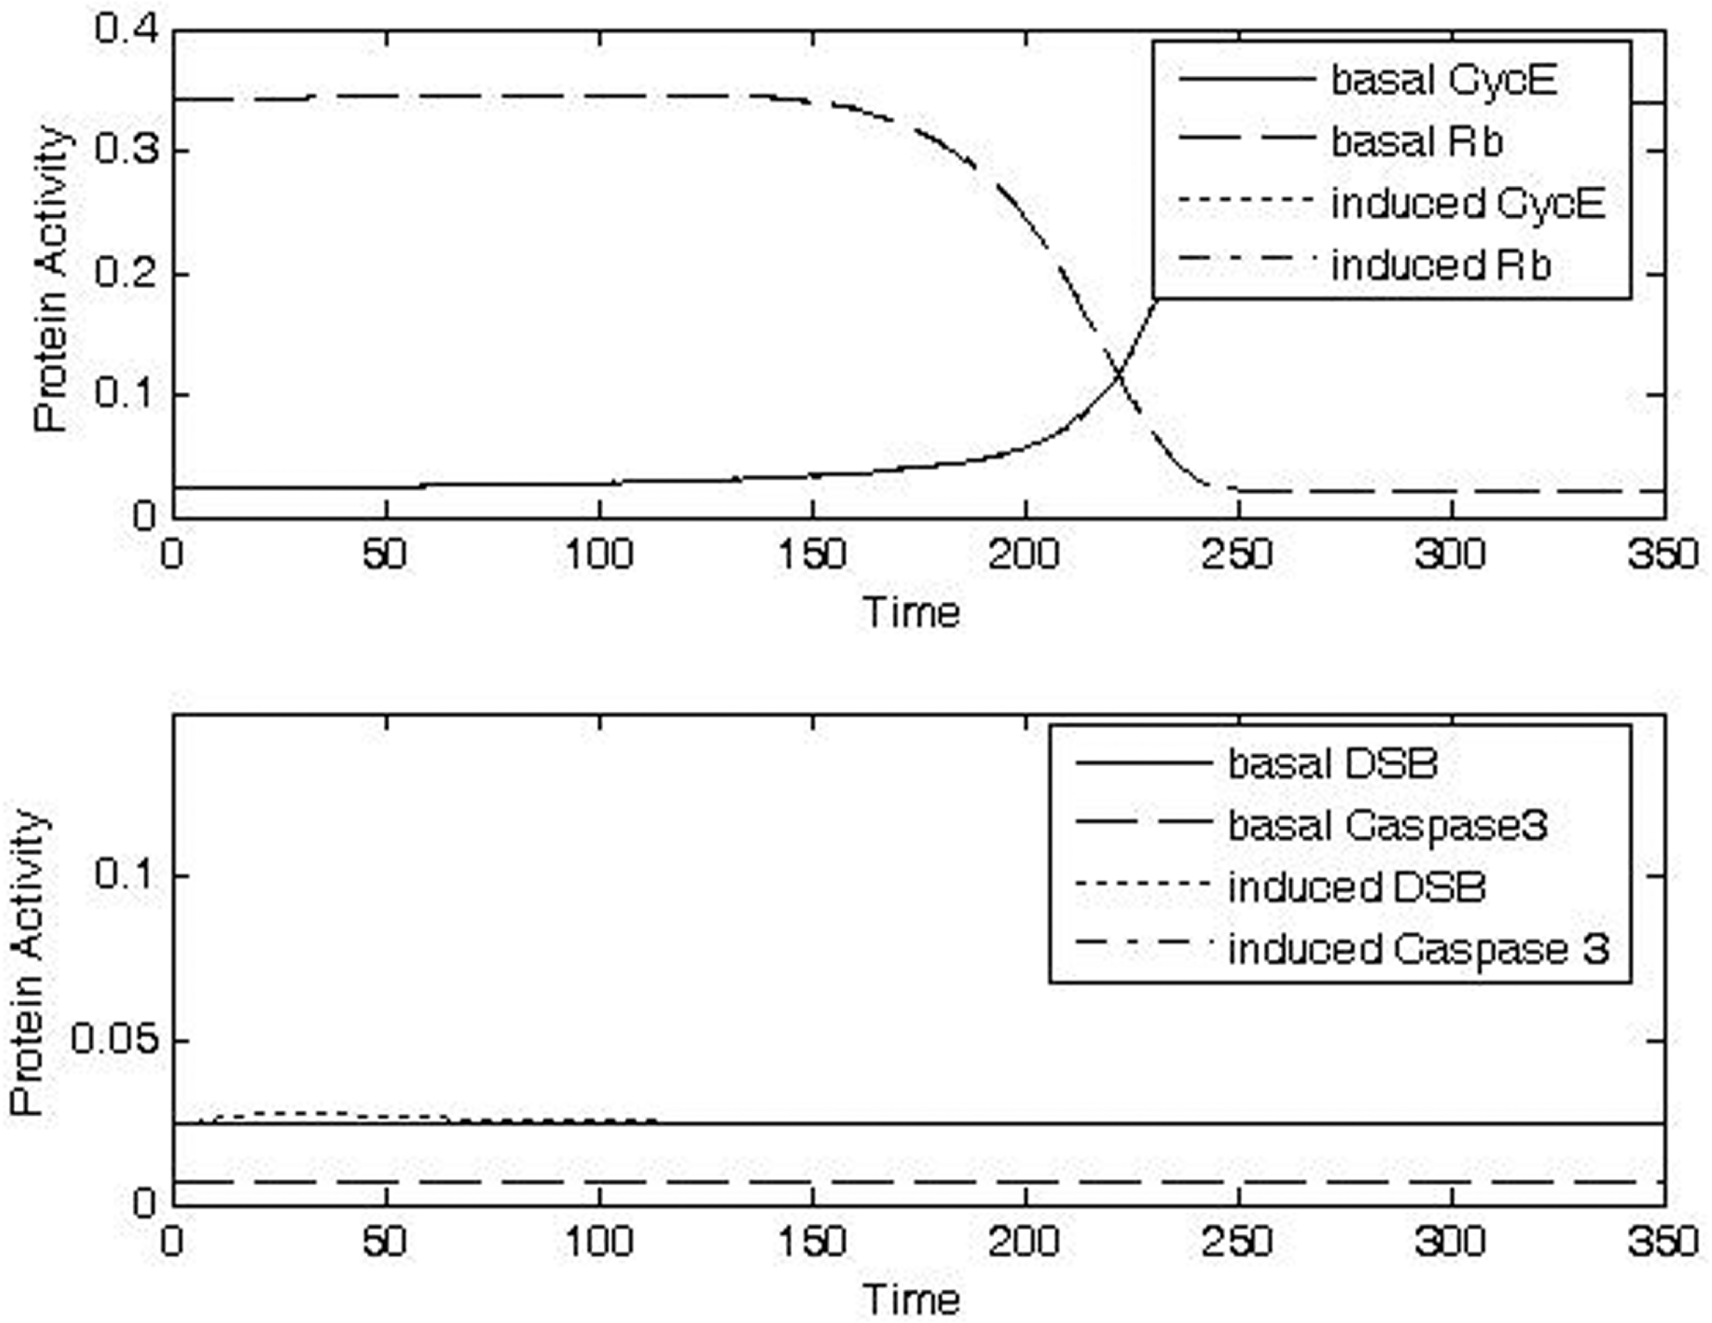
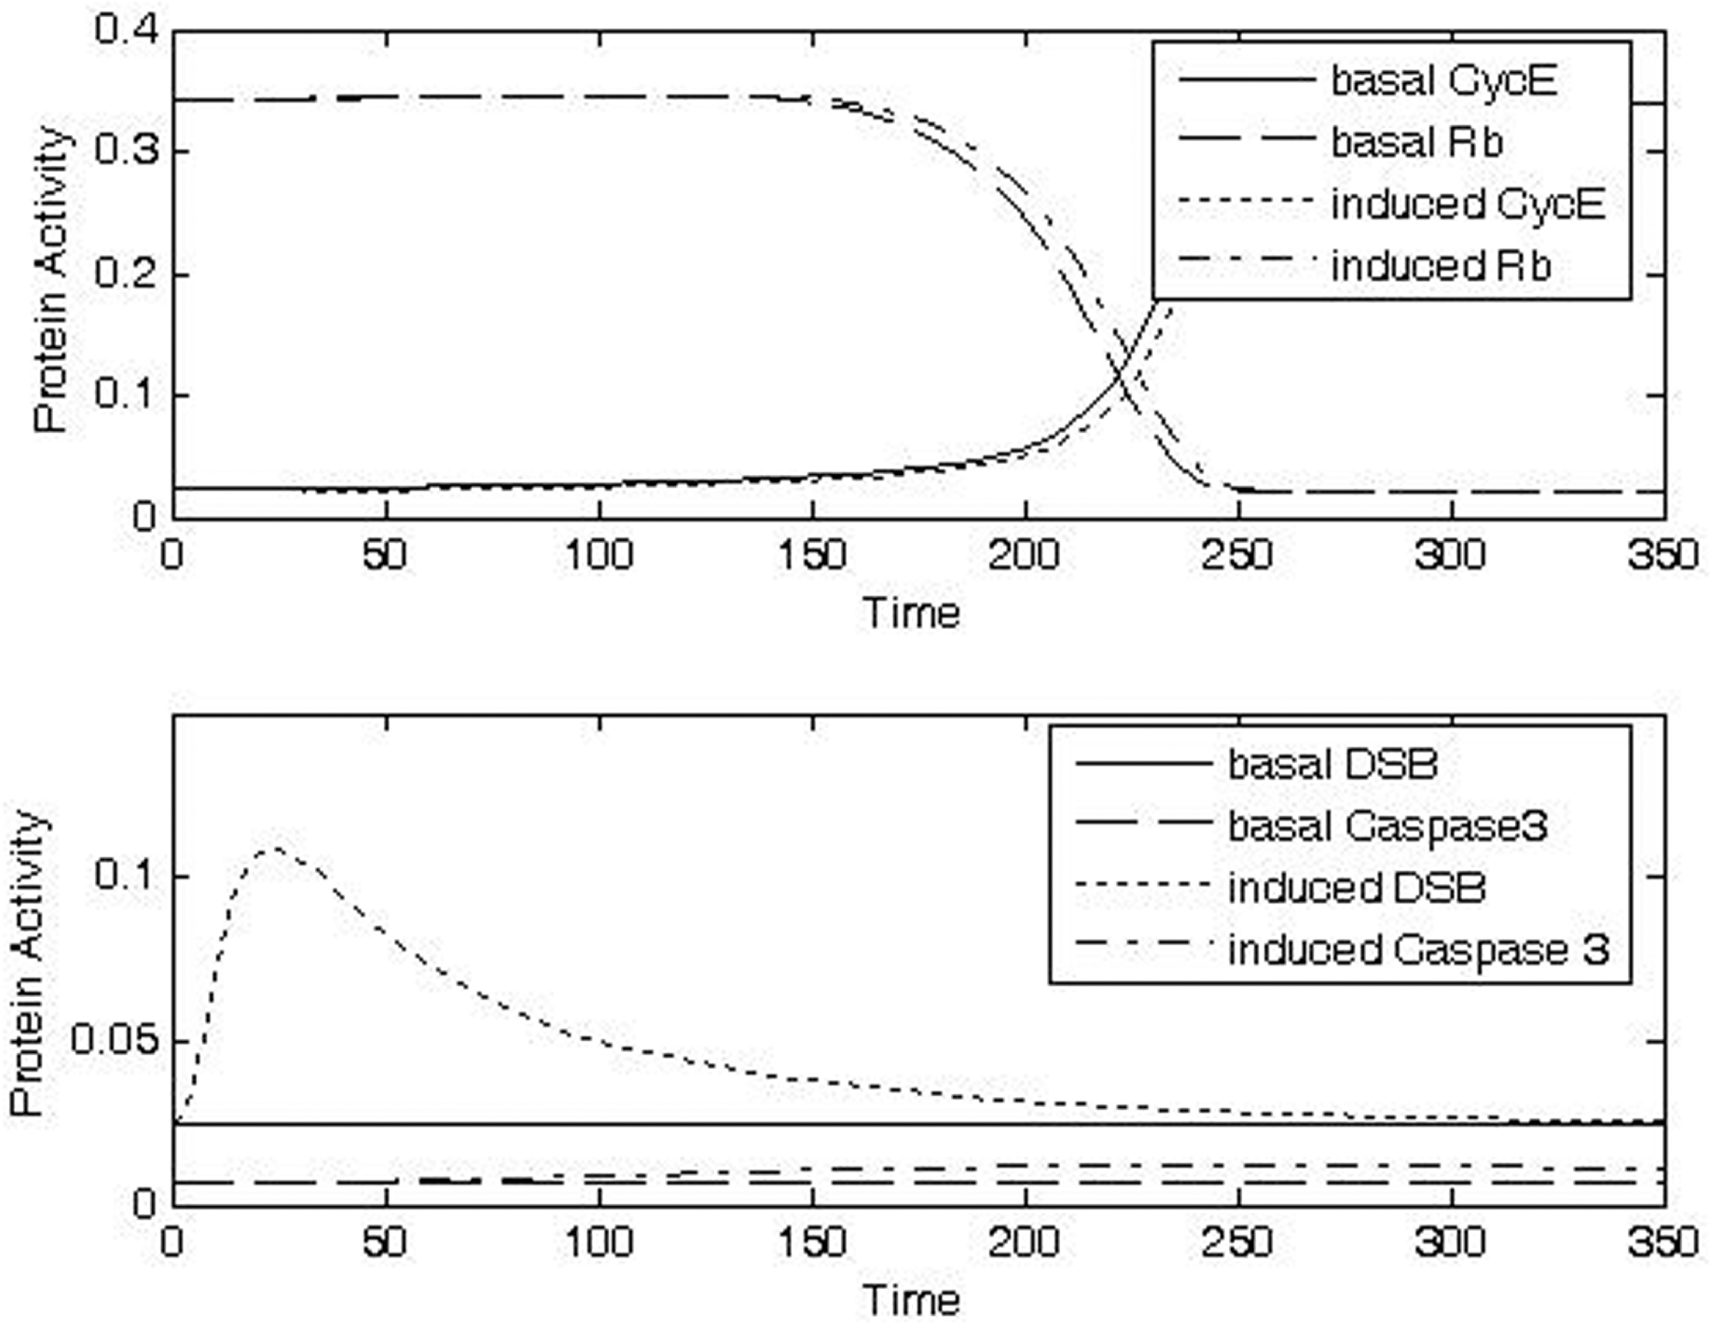
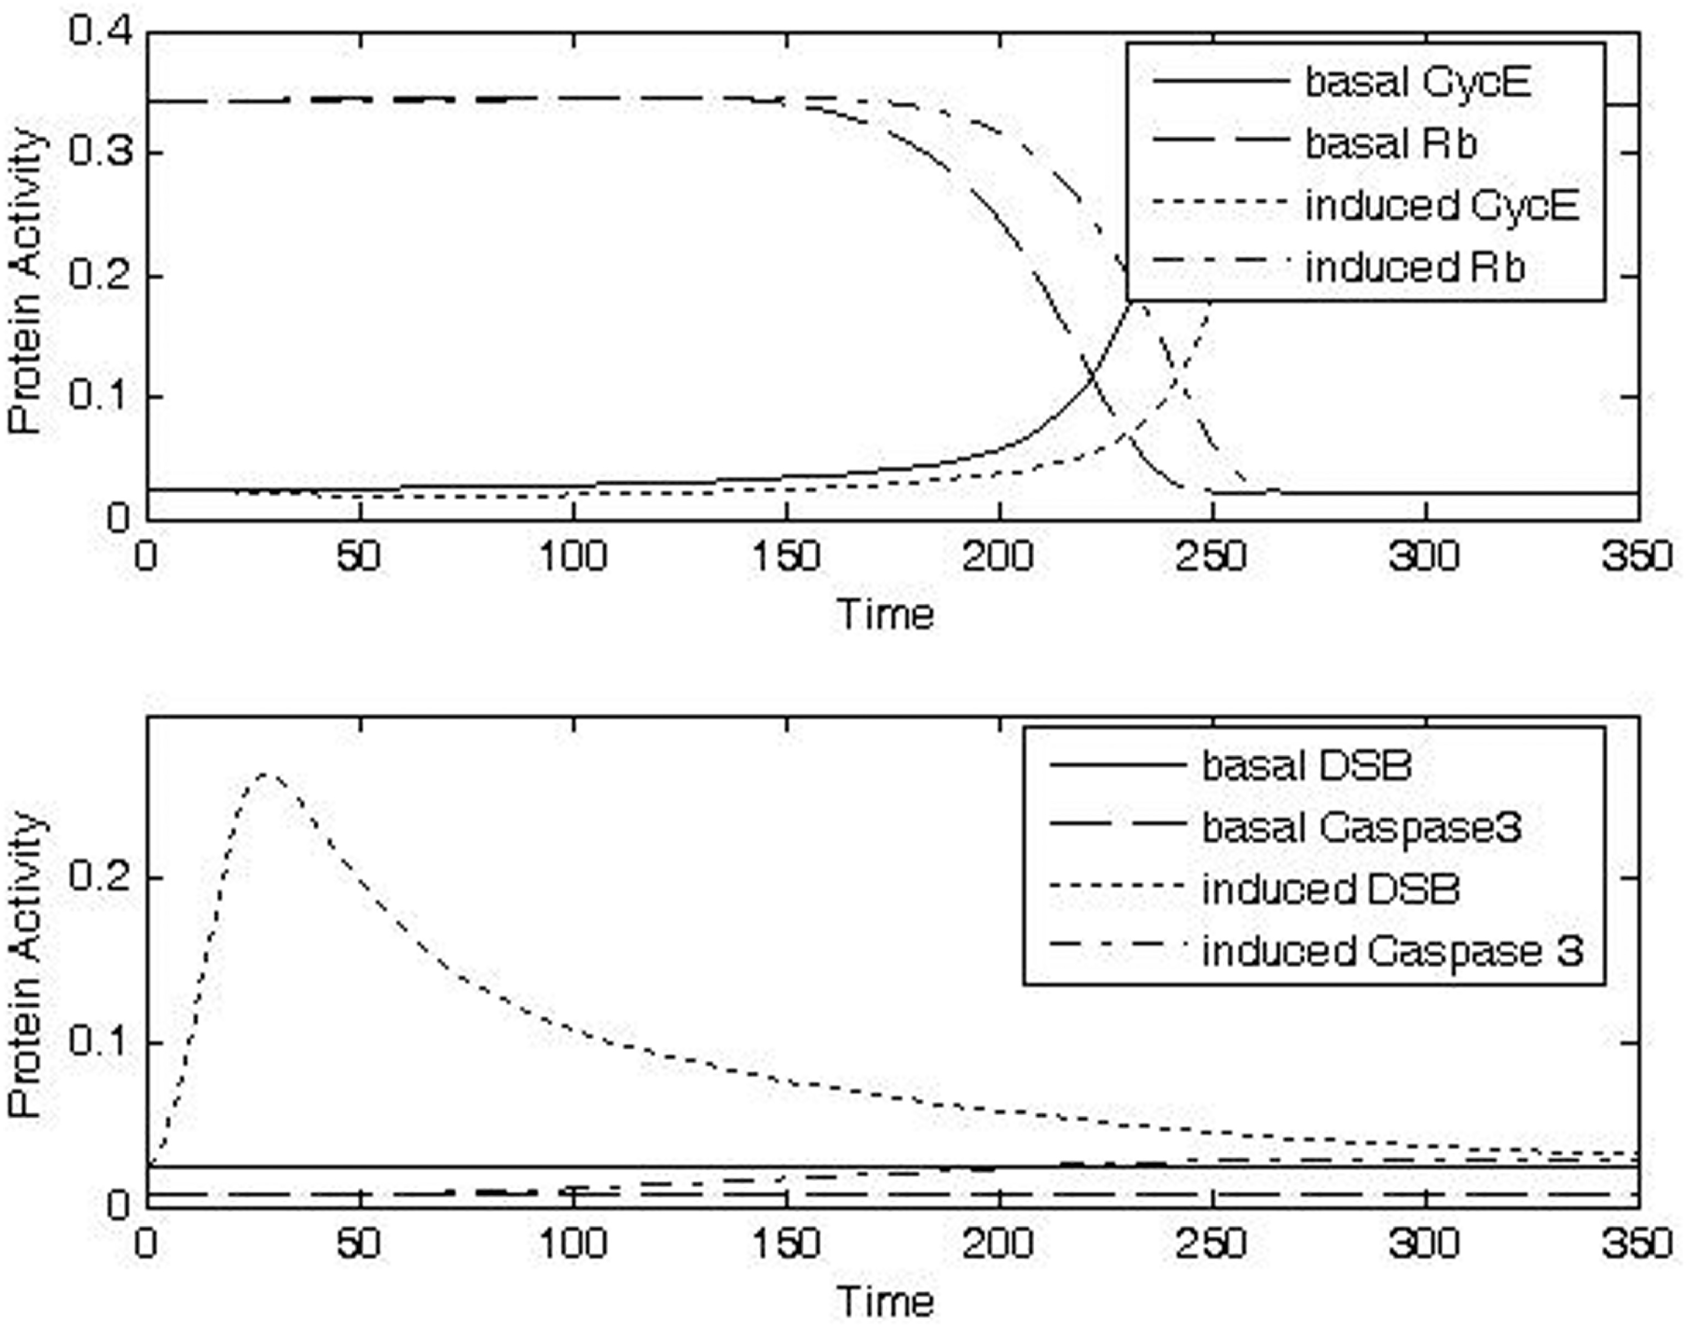
Analysis of protein activities at G1/S checkpoint for different doses of IR for CycE, Rb, DSB, caspase 3. Increasing doses of IR lead to increased levels of DSB (a-d, bottom panels), increased durations of checkpoint arrest as indicated by switching of CycE and Rb (a-d, top panels), and increased probability of apoptosis as indicated by increased levels of caspase3 (a-d, bottom panels). a) Case1: IRR = 0.01, Δt = 10; b) Case 2: IRR = 0.3, Δt = 10; c) Case 3: IRR = 0.5, Δt = 20; d) Case 4: IRR = 1, Δt = 20.
Exposure to a low dose of IR for a short duration (Case 1, IRR = 0.01, Δt = 10) was predicted to cause only small, transient changes in the amount of DSB (Fig. 8a, bottom panel), while no conspicuously visible effect was predicted for the activities of CycE and Rb (Fig. 8a, top panel) or caspase (Fig. 8a, bottom panel). These behaviors are consistent with rapid repair of a low level of DSB and with a consequent lack of significant propagation of signal to the cell cycle checkpoint.
Exposure to a higher dose of IR (Case 2, IRR = 0.3, Δt = 10) was predicted to delay the switch-like transitions in the activities of CycE and Rb (Fig. 8b, top panel), indicating arrest at the G1/S checkpoint. In this case the level of DNA damage (Fig. 8b, bottom panel) is sufficient to activate the signal transduction pathway and alter the time-course activities of the key regulatory activities at the checkpoint, providing additional time for DNA repair. This dose of IR was predicted to cause only a small increase caspase activity (Fig. 8b, bottom panel).
Exposure to a still higher dose of IR (Case 3, IRR = 0.5, Δt = 20) was predicted to trigger a correspondingly longer checkpoint arrest (Fig. 8c, top panel). The duration of the checkpoint arrest was predicted to be sufficient in this case to allow caspase activity to increase to a level associated with an apparently improved possibility of entry into the apoptotic pathway (Fig. 8c, bottom panel). With a sufficiently long checkpoint arrest, it is reasonable to think that some of the cells go into apoptosis during the arrest period; thus this prediction is consistent with data showing that cell survival is reduced in association with p53-dependent G1 arrest (Gupta et al. 1996).
At the highest dose evaluated (Case 4, IRR = 1, Δt = 20), caspase activity was predicted to increase the likelihood for apoptosis dramatically (Fig. 8d, bottom panel). An increased likelihood of apoptosis in the presence of high levels of DNA damage has been seen experimentally (Sun et al. 2005).

Dose response curve for checkpoint arrest and caspase 3 activities
The length of time spent at the G1/S checkpoint and caspase 3 activities are functions of the dose rate IRR (Fig. 9). Both the time in the G1/S checkpoint and caspase 3 activity initially increase with IR dose and then saturate.

G1/S time and caspase 3 activities as a function of IRR.
Robustness analysis
The robustness of checkpoint activation in response to DNA damage was analyzed by comparing the relative duration of checkpoint arrest when mediated only by the p53 dependent pathway (Fig. 2) with the duration resulting from the combination of p53- and Chk2-mediated signaling (Fig. A-1). The robustness of activation of the apoptotic pathway was analyzed by comparing predicted caspase 3 activity based only on p53 dependent signaling with combined signaling through p53 and p73 (Fig. A-2). A detailed description of these results is given in Appendix.
DISCUSSION
Our long-range goal is to understand how the relevant signaling pathways and adaptive capabilities of cells exposed to IR influence the shapes of dose-response curves for IR-mediated cancers. The present work, a first step towards this goal, describes an initial (i.e., 1st generation) computational model of signaling pathways linking IR-mediated DNA damage with cell cycle checkpoint arrest and apoptosis. In this model, Module 1 (Fig. 2) links IR exposure to DNA damage but does not contain detailed information about specific kinds of IR, doses and dose-rates, the production of ROS, the kinds of DNA damage produced, and the repair of the damage. While these are all important components of the IR-exposure-health effect continuum, detailed descriptions were beyond the scope of the current investigation. Our description of the G2/M checkpoint in Module 3 (Fig. 2) followed the work of Tyson et al. (2001). We therefore focused our efforts largely on the development of Module 2 (Fig. 2) and on the G1/S checkpoint component of Module 3 (Fig. 2) with the goal of producing a reasonably detailed though admittedly not comprehensive description of the pathway that senses DNA damage and transmits signals to cell cycle checkpoints and the apoptotic pathway.
Our main objective in developing the 1st-generation model was to describe the relevant biology only at the level of detail necessary to generate qualitatively accurate representations of checkpoint activation and of the choice between checkpoint activation and apoptosis. The biochemical detail in these modules, including signaling pathways and regulatory switches at the checkpoints, is sufficient for this purpose: DNA damage activates checkpoints; more severe damage leads to extended delays at checkpoints and greater probabilities that cells will apoptose. The current model does successfully reproduce measured time-courses of key proteins (e.g., p53, p21, and caspase 3, Figs. 3, 4 and 5, respectively). These are activities expected to underlie nonlinear dose-response behaviors in cells and tissues exposed to IR. However, since measured values are lacking for many of the parameters of the model (Table A-3), its predictive capabilities are best categorized as qualitative but not quantitative. Development of a quantitatively accurate version of the model would require (1) for each parameter either a data-derived value or a complete sensitivity analysis (e.g. considering the correlations between the parameter values) showing that model behaviors are not sensitive to its value and (2) additional dose-response and time course datasets for the activities of key signaling and regulatory proteins.
Our model contains less molecular-level details than others more concerned with the mechanistic details of cell cycle control and programmed cell death (e.g., Albeck et al. 2008; Chen et al. 2007; Csikasz-Nagy et al. 2009; Cui et al. 2008; Eissing et al. 2004; Han et al. 2005; Li et al. 2009; Qu et al. 2004; Zamborszky et al. 2007; Zhang et al. 2009). The recent model of apoptosis developed by Tyson and co-workers for example, (Zhang et al. 2009), contains a detailed description of the apoptotic pathway reflecting a new, more detailed understanding of the underlying signaling and regulatory motifs (e.g. BH3, cytochrome c, SMAC and XIAP, feedbacks between BH3&BCL and caspase 9 & caspase 3). Further development of the present model, where both qualitative and quantitative accuracy would be desired, are likely to incorporate the kinds of mechanistic insights being obtained by these more mechanistically advanced modeling efforts.
The data used to develop the model were obtained from a variety of test systems. Ideally, data would be obtained under uniform experimental conditions using a single biological model. At the level of the biology it describes, the computational model is thus a chimera. Much of the biology in the model is evolutionarily conserved, leading us to think that the model structure is likely to be robust across cell types and species. The chimerical nature of the model should, however, be viewed as a source of uncertainty in the evaluation of its predictions.
It is interesting to note that Albert and Othmer (2003) found that the spatial and temporal pattern of expression of the segment polarity genes in Drosophila melanogaster is determined by the topology of the gene network and by whether components are absent or present. The behavior of the network is relatively insensitive to the absolute levels of the mRNAs and proteins and the functional details of their interactions. There is thus some hope that insight into key features of the behavior of the signaling pathways and regulatory activities that coordinate DNA repair, cell cycle checkpoints and apoptosis will not require exhaustive enumeration of protein concentrations and reaction rate constants. Additional work will be required to tell whether or not this is the case.
Different versions of Module 2 incorporating parallel signaling pathways (e.g., Figs. A-1 and A-2) provided a capability for examination of robustness, an essential feature of complex biological systems (Aderem and Smith, 2004; Kitano, 2004). For example, parallel signaling was predicted to increase the duration of the delay at the G1/S checkpoint for a given exposure to IR (Fig. A-4), allowing more time for both DNA repair and for caspases activation leading to apoptosis. That is, a second protective response from the parallel signaling pathway will synergize the response from the initial pathway and makes the system more robust.
The current model is effectively a model of average behavior of cell population. In future versions the model could be extended to describe a virtual tissue, – a heterogeneous population of cells – thereby providing a capability for simultaneously describing cells in different phases of the cell cycle as well as the cell-to-cell communication involved in bystander effects (Matsumoto et al. 2004). While several models for bystander effects have been described (Brenner et al. 2001; Nikjoo and Khvostunov, 2003; Little et al. 2005), none of them contains such a level of biological detail.
Entry into the apoptotic pathway is determined by the activity of biochemical signaling pathways while necrosis is due to relatively large amounts of damage associated with generalized disruption of signaling and of cellular architecture. In developing the initial model, we were primarily interested in describing intracellular signaling pathways linking detection of DNA damage with activation of cell cycle checkpoint controls and with the apoptotic pathway. These signaling-mediated events are likely to be the important determinants of the shape of the dose-response curves at low doses. At somewhat higher doses, necrosis will become more important and a description of necrosis could be included in subsequent versions of the model.
Since our long-range goal is to understand the dose-responses for IR-mediated cancers, linkage to a multistage, clonal growth model for cancer (Moolgavkar and Knudson, 1981; Moolgavkar et al. 1988) is another desirable extension of the current model. Initial results show that the model developed here, when linked to the two-stage clonal growth cancer model, can describe either a monotonic increasing or a J-shaped dose response curve, depending on the parameter values used (Zhao and Ricci, 2010). Saturation of checkpoint arrest time, as shown in Fig. 9, is the underlying mechanism of the J-shape (Zhao and Ricci, 2010).
While the current model was motivated by an interest in the health effects of IR, its structure is relevant to other environmental stressors that generate DNA DSB, since the signaling pathways from DSB to the cell cycle and to apoptosis are presumably independent of the character of the stressor inducing the DSB. Furthermore, other protein activities and signaling pathways could be incorporated as relevant new data become available or to allow the model to address new questions. For instance, the description of DNA repair in the current version of the model is superficial. More detailed descriptions could be developed to describe, for example, the actual biochemical mechanisms of repair of DSB.
In conclusion, we have developed an initial example of a conceptual approach that can improve our ability to predict dose- and time-response curves for adverse health effects related to IR exposure. Future research leading to refinements in model structure and to laboratory measurements of key parameter values could lead to more mature models with a robust ability to predict health risks on the basis of relevant biological mechanisms. Such a model could serve to either confirm the suitability of current policy- or default-based approaches to risk assessments for IR or, potentially, to suggest that something other than low-dose linearity is more appropriate.
Footnotes
ABBREVIATIONS
ACKNOWLEDGEMENT
The authors thank Qiang Zhang for his stimulating discussion and contribution to review. The research was originally supported by grant to the CIIT Centers for Health Research (now Hamner Institutes for Health Sciences) from Department of Energy BER Grant No. DE-FG02-03ER63669. Yuchao Zhao also thanks the funding from State Key Joint Laboratory of Environment Simulation and Pollution Control (Beijing Normal University) 10Y05ESPCN and the Research Fund for the Doctoral Program of Higher Education (SRFDP) for recent support.
DISCLAIMER
This research was supported by the Office of Science (BER), U.S. Department of Energy, Grant No. DE-FG02-03ER63669 to the Hamner Institutes for Health Sciences.
This research may not necessarily reflect the views of the U.S. Environmental Protection Agency and no official endorsement should be inferred.