
Abstract
Both the linear (at low doses)-no-threshold (LNT) and the threshold models (S-shapes) dose-response lead to no benefit from low exposure. We propose three new models that allow and include, but do not require – unlike LNT and S-shaped models — this strong assumption. We also provide the means to calculate benefits associated with bi-phasic biological behaviors, when they occur and propose:
Three hormetic (phasic) models: the J-shaped, inverse J-shaped, the min-max, and Method for calculating the direct benefits associated with the J and inverse J-shaped models.
The J-shaped and min-max models for mutagens and carcinogenic agents include an experimentally justified repair stage for toxic and carcinogenic damage. We link these to stochastic transition models for cancer and show how abrupt transitions in cancer hazard rates, as functions of exposure concentrations and durations, can emerge naturally in large cell populations even when the rates of cell-level events increase smoothly (e.g., proportionally) with concentration. In this very general family of models, J-shaped dose-response curves emerge. These results are universal, i.e., independent of specific biological details represented by the stochastic transition networks. Thus, using them suggests a more complete and realistic way to assess risks at low doses or dose-rates.
INTRODUCTION
Tight public budgets, increasing competition between public and private sources of funds some of which are budgeted for regulating environmental, occupational and other forms of exposure, demand rational public budgeting. Unfortunately, regulating health hazards through default assumptions and safety factors can do more harm than good. We focus on the regulatory paradigms that rely on linear (at low doses)-no-threshold (LNT) models for mutagens and carcinogens, and threshold models (S-shapes) for non-cancer end points, no longer seems consistent with most recent experimental and theoretical work.
Regulatory standards affecting environmental and occupational health choices implicitly deny the possibility of low exposure-related benefits. We add to the discussion of a paradigm change possibly to replace: 1) the conjectural linear-at-low-doses, no-threshold cancer dose-response models (LNTs) with J-shaped models as a regulatory default; and 2) the S-shaped toxicological model with an inverse J-shaped model. This change also impacts the acceptability or tolerability of carcinogen exposure levels and the use of factors of safety, which are issues that we do not address.
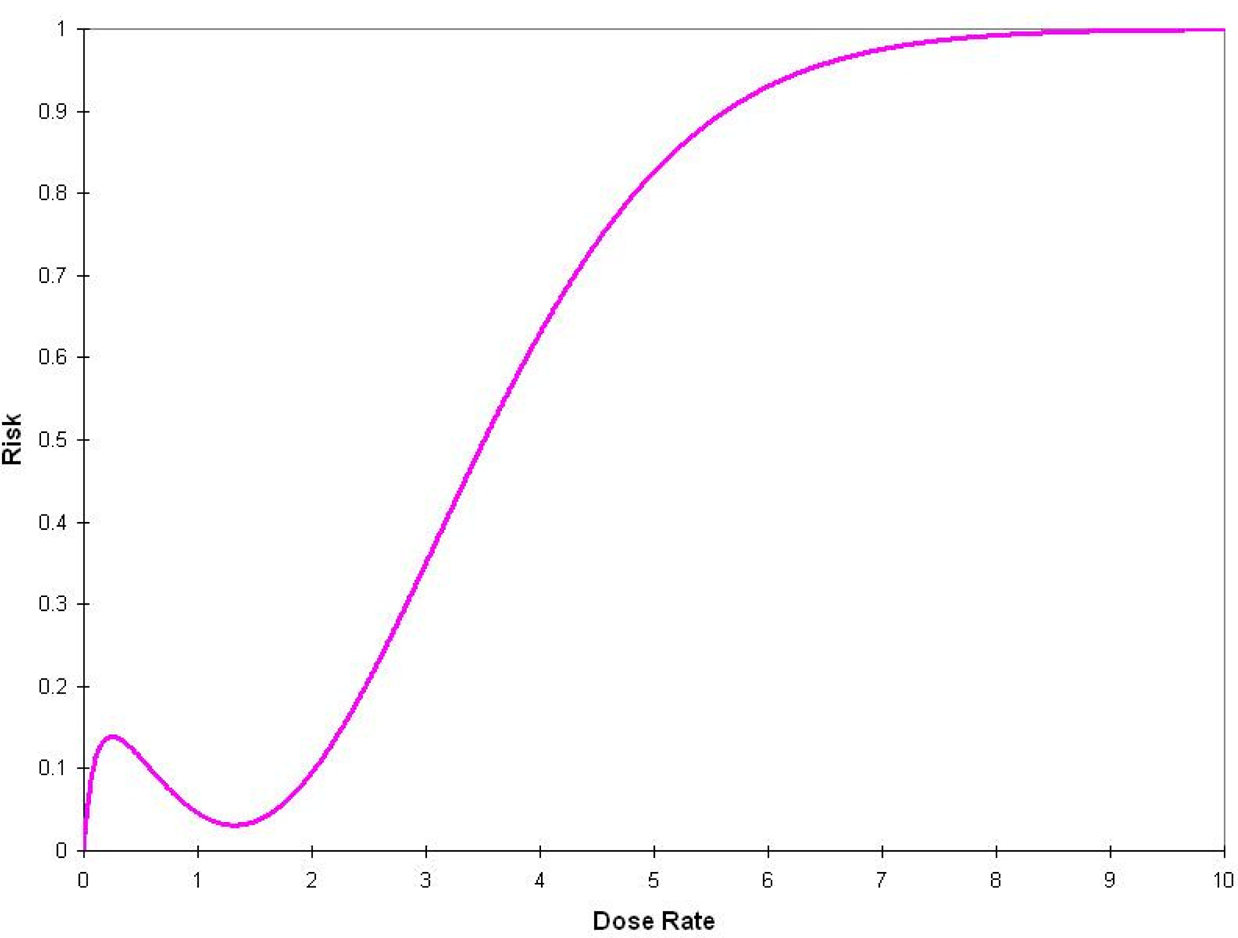
The J-shaped model depicted in Figure 1 describes low-dose reductions in the incidence of disease; its depiction is based on empirical results found in the literature.

Hypothetical example of a biphasic J-shaped dose-response model for cancer incidence (the percent response in the controls must be non-zero) and the linear at low dose no threshold (LNT) model (for both models the frequency of response cannot exceed 100%).
As an example of the policy-science debate for cancer, consider the differences between the US and the French Academies (i.e., the US National Academies of Science, the French Academy of Sciences, and the French National Academy of Medicine) regarding the effects of ionizing radiations at low doses. Although the US (BEIR VII, Phase 2, 2006) supports the LNT using low-dose linear models fit to epidemiological data, the French Academies doubt its validity, pointing to fundamental biological repair mechanisms that prevent linearity at low doses (Tubiana and Aurego, 2005). Current regulatory defaults neither resolve this ambiguity nor necessarily increase protection. Regulatory agencies take a well-traveled road: the EPA (2005) states:
…extrapolation is based on extension of a biologically based model if supported by substantial data. Otherwise, default approaches can be applied that are consistent with current understanding of mode(s) of action of the agent, including approaches that assume linearity or nonlinearity of the dose-response relationship, or both. … The linear approach is used when: (1) there is an absence of sufficient information on modes of action…
Nonetheless, the LNT has considerable regulatory force. For example, US EPA's IRIS data base (IRIS10_07), which contains toxicological and carcinogenic hazards and risks information for more than 500 substances, presents quantitative cancer risk estimates as follows:
The slope factor is the result of application of a low-dose extrapolation procedure and is presented as the risk per (mg/kg)/day. The unit risk is the quantitative estimate in terms of either risk per ug/L drinking water or risk per ug/cu.m air breathed. The third form in which risk is presented is a drinking water or air concentration providing cancer risks of 1 in 10,000, 1 in 100,000 or 1 in 1,000,000.
For the approximately 80 carcinogens, these risk numbers are estimated from linear at low dose models (linearized multistage dose-response model is the most commonly used, followed by the relative risk and Weibull models).
BIPHASIC AND OTHER BEHAVIORS
Different agents induce J- or inverse J-shaped responses in different test systems, such as rodents, cattle, rabbit, rhesus monkey. For example, alcohol, diesel exhaust particles, formaldehyde, lead, TCDD, and methyl mercury show immunological biphasic responses. Diesel exhaust particulate, resveratrol, and formaldehyde are biphasic in humans. Mercury, cadmium, and lead are biphasic in mice for plaque-forming cells. Immunological biphasic outcomes range from agglutination to wound closure and J- or inverse J-models have been observed for pharmaceuticals, from acetaminophen to xylazine. For cancer, Calabrese (2005) finds that 138 in vitro cell lines for 32 different human cancers show biphasic dose-response for 120 agents, including about 50 endogenous agonists and drugs (e.g., tamoxifen, aspirin, gangiclovir), 40 were phytochemicals (e.g., resveratrol, flavonoids, caffeine), and 10 pollutants (e.g., arsenate, arsenite, cobalt, mercury). Although the biological mechanisms for those substances differ, the shape of the dose-response invariably is J-shaped. Mechanistically, for example, priming, adaptive or preconditioning responses for mutagens, toxicants, and other agents qualitatively describe processes that generally strengthen the initial response of the biological units at eventual risk (Davies et al., 1995; Olivieri et al., 1984; Paalzow et al., 1983), and thus justify either the J- or inverse J-shaped models. They account for plastic response up to and including a ceiling (Schlichting and Smith, 2002). If the agent has agonistic or antagonistic properties for the same receptor, an inverse J-shaped dose-response may result (Jackobsen et al., 1999). Receptors for adenosine, estrogen, prostaglandin, and TNFα, for example, suggest a basic biological mechanism based on different molecular affinities; activation can result in biphasic response.
The known human carcinogen arsenic (AsIII) adversely affects DNA repair, cellular control mechanisms, and oxidative stress. However, biphasic behaviors, such as protection against oxidative stress and skin tumors, have been observed at low doses. Snow et al., (2005) studied effects of AsIII on human keratinocytes and fibroblasts at (temporally varying) doses commonly found in drinking water. They reported an inverted J-shaped function, which adds to other, similarly shaped dose-response for arsenic's effect on cell proliferation and viability, (base excision) DNA repair, and telomerase activity. Although these are protective mechanisms, they may also protect damaged cells against apoptosis, increasing cancer risk. Moreover, two recent epidemiological studies found that As in drinking water, at concentrations below 60 ppb, was inversely related with bladder and lung cancer numbers, supporting the J-shaped dose-response (Lamm et al., 2004; Mahata et al., 2004).
Fukushima et al., (2005) have studied concepts such as practical and perfect thresholds for cancer for genotoxic (e.g., diethylnitroamine, DEN, ionizing radiation) and non-genotoxic agents (e.g., α-benzene, DDT) from experimental and mechanistic evidence: non-linearity is evident, rather than the LNT. They also report that a study found that oxidative stress at low dose of DDT is significantly reduced, and appears to be linked to endogenous DNA repair mechanisms, although it increases at higher doses. Upton (2001) states:
Although the existence of … adaptive responses is no longer in doubt, it is not clear from the existing data whether the dose-response relationships for mutagenic, clastogenic, and carcinogenic effects of radiation are comparably biphasic in the low-dose domain.
J-SHAPED MODELS
It is against this backdrop that we have developed the three dose-response models we now suggest as a means to improve on the current use of regulatory defaults. For cancer, the regulatory multi-stage model (US EPA's linearized multistage model, LMS) is Model 1 in Table 1. Usually, the EPA is interested only in
Risk Models: LMS, J-Shaped, Max-Min, and Inverse J-shaped Models
The background incidence of cancer, even when d = 0 (i.e., the carcinogen of interest is not present);
The overall repair mechanism stage (induced by the carcinogen of interest) for the background cancer; and
The linear-non-threshold mechanism for the cancer induced by the carcinogen of interest.
This model has the minimum number of parameters required to include non-linearity that represents repair at low dose, compared to the LNT. Its simplicity, robustness and analytical tractability recommend it as a candidate tool for future experimental and theoretical investigations, while allowing for linearity at low doses when it exists. Our developments follow the statistical modeling of Vilenchik and Knudsen (2006), who developed a quadratic (U-shaped) dose-response model (accounting for a specific mechanism of repair of damage from IR exposure) and Bogen (1997), who developed a biologically mechanistic cytodynamic 2-stage model predicting a J-shaped response curve for radon. The complete discussion of the derivation of these three models can be found on line (to be assigned an URL) and the relationship to stochastic cell models is given later.
An example of the J-shaped model fit to the data from Ullrich et al., is given in Figure 2, with a segment of the LNT fit to the same data set. The squares are the 95% confidence bound, the expected value falling within each of these squares.

J-shaped dose-response model (estimated from data in Ullrich et al. (1976) gamma rays exposure, lung adenomas response in mice) is depicted by continuous line; the upper and lower 95% confidence limits are contained within the red squares. The LMS, model 1 in Table 1, is depicted by dashed lines (we plot the two models in the relevant region of the data and do not interpolate the LNT to the point (0, 0)).
Scott, Haque, and Di Palma (2007) have developed a model that links different cellular states to the probability of transition from one state to the other as a function of genomic damage induced by different level of exposure to ionizing radiation. They, using MCMC, identify a multi-phasic model. To account for these results we have developed the max-min (n-phasic) model, Model 3 in Table 1; Figure 3 depicts its hypothetical shape.
Hypothetical depiction of the Max-Min (n-phasic) dose-response model. The phases correspond to different biological mechanisms.
The difference between the J-shaped and the max-min model is that, although for the J-shaped model repair takes place at any dose rate, in the max-min model repair occurs only when the dose rate exceeds a specific limit.
The inverse J-shaped curve is the two-parameter model, listed as Model 4 in Table 1.
Unlike the toxicological S-shaped dose-response model, the inverse J-shape model can capture health improvements at low dose rates. Thus, the inverse J-shaped does not allow a threshold, when there is none, but allows it in our formulation, when it is experimentally demonstrated. In the instance where the inverse J-shaped model is appropriate, the use of factors of safety (Dourson and Stara, 1983; Calabrese and Baldwin, 1994) may have to be re-thought. Accordingly, for the J-shaped and inverse J-shaped models, we also suggest the following two metrics that quantify their direct benefits (Table 2) as:
Metrics for the Measurement of the Benefit of Hormesis for the J- and inverse J-Shaped Models
The maximum risk decrease (or benefit increase); and
The average risk decrease (or benefit increase).
To exemplify the J-shaped calculations, we use the results of Ullrich et al. (1976) who irradiated 15,256 mice (in seven groups) with Cesium-137 gamma radiation (450 mGy/min): the data on lung adenoma show the differences between the LMS and the J-shaped dose response models. Using the metrics in Table 2, the maximum risk reduction equals 10.8%, and the average risk reduction equals 6.3%. To exemplify the inverse J-shaped model, we use the data from Falchetti et al., (2001, Table 1, IL-2) who studied the effect of resveratrol using cytokine secretions (Figure 4 is based on resveratrol and IL-2). Using the metrics in Table 2, the maximum effect increase is estimated to equal 112%, and the average effect increase equals 69%.
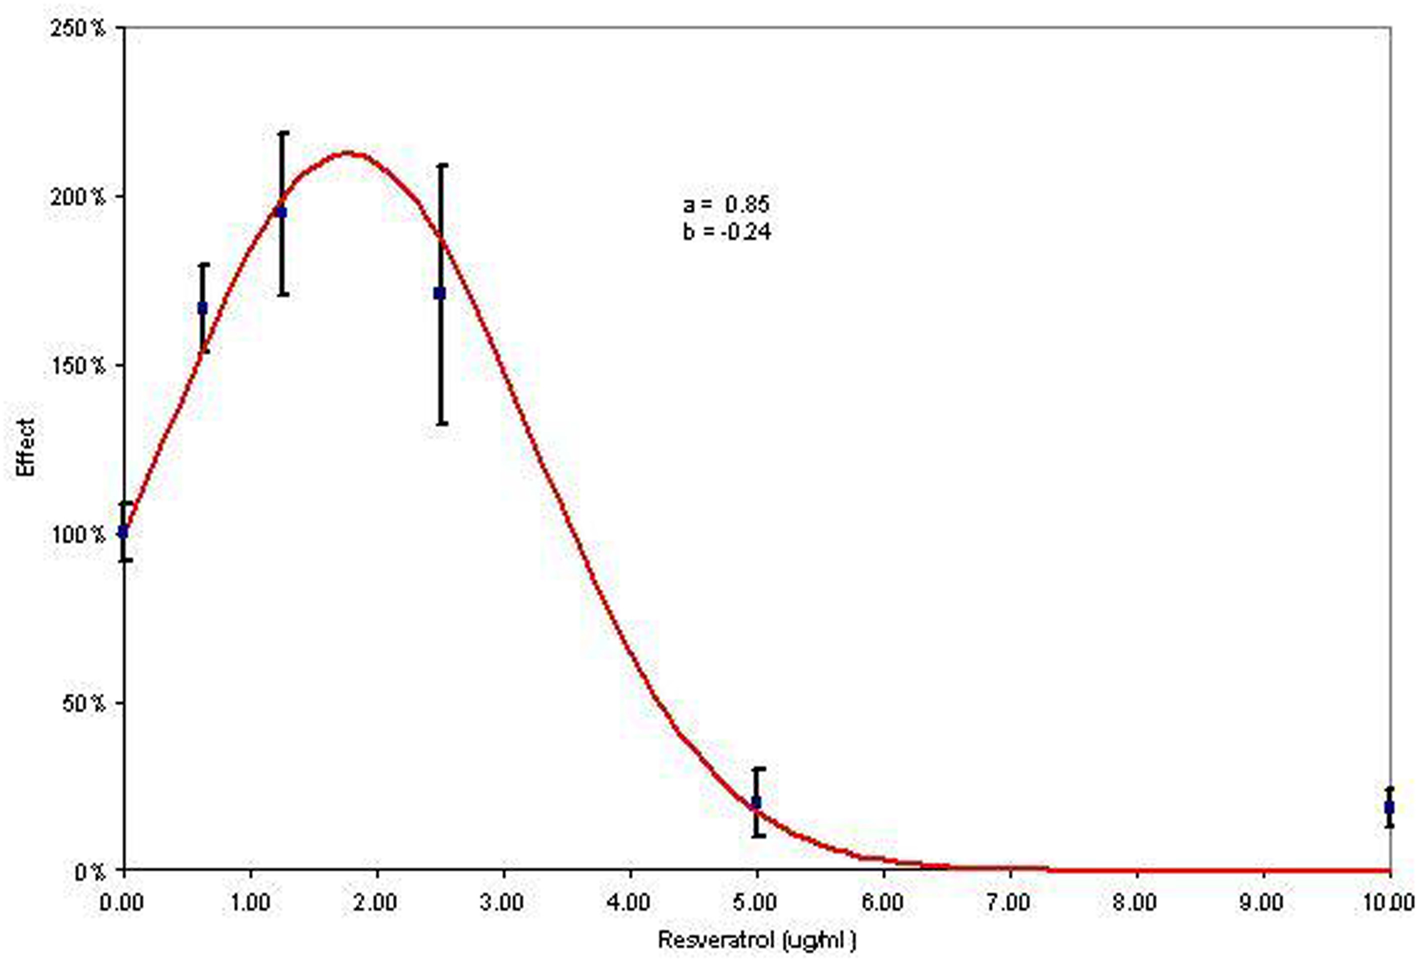
Inverse J-shaped dose response model (the response axis is not bounded by 1, although it is bounded by 0 as the percentages can be greater than 100% but cannot be less than 0%; data from Falchetti et al. (2001).
Confluence of stochastic and biphasic behaviors
Many chemical carcinogens increase tumor rates in experimental animals only in situations that also cause cytotoxicity and regenerative hyperplasia, or compensating proliferation of apparently normal cell populations in response to the toxic injury. Examples include chloroform, diesel exhaust, formaldehyde, and many others. When such compensating proliferation is a prerequisite for chemically induced carcinogenesis, traditional linearized multistage modeling may overestimate risks at low concentrations by more than five orders of magnitude (Larson et al., 1996), or predict significant risks at low concentrations even if none actually exists (Constan et al., 2002).
Carcinogenesis can be modeled as a process in which a somatic cell line gradually accumulates transformations (e.g., somatically heritable mutations or epigenetic changes) that occur randomly and independently over time. These changes may be modeled as occurring according to independent Poisson processes, with approximately equal intensities (since transformations with much greater intensities than this common minimum value are not rate limiting, and may be disregarded. Once any of the K possible transformations has occurred, assume that it is permanent and irreversible (e.g., not repaired). The altered cell line survives for a finite lifetime T. If all K distinct transformations occur before time T, then the cell line becomes malignant. A result of modern complexity science is that, for sufficiently large K, there is a “sharp transition” time such that the first malignant cell is very unlikely to be formed much sooner or much later than that time: a nearly deterministic occurrence time for the first malignant cell emerges simply as a consequence of there being many stages in this simple stochastic transition model. This result establishes a form of nearly deterministic behavior for a stochastic system describing cancer: if the sharp transition time T ∗ is smaller than the death time T, then formation of a malignant cell by time T is almost certain; otherwise, it is very unlikely. In this simple model, exposure to carcinogens can increase cancer risk either by decreasing K (in effect, by completing some transformations relatively quickly, so that they are removed from the rate-limiting set). This reduces T ∗, making formation of malignant cells prior to death of the cell line more likely. If carcinogenic exposure reduces K, the number of remaining transformations required to reach malignancy, then the lifetime probability of tumor, Pr(T ∗ < T), will increase in discrete steps (corresponding to transformations completed and no longer on the critical path) that may be insensitive to the detailed exposure pattern used to reduce K.
The link to biphasic behavior is as follows. Suppose that a normal stem cell (or somatic cell line) must successfully traverse a stochastic transition network (STN) to become malignant. Paths through the network correspond to sequences of events that transform a normal genotype to a malignant one. The network may consist of two or more stages, e.g., first with multiple possible paths leading from normal to initiated cells, and then with multiple other paths leading from initiated to malignant cells. Consider the fates of normal stem cells with finite lifetimes T entering the STN. Starting from the initial node (NORMAL), each cell progresses through the network by making stochastic transitions, eventually reaching the final node (MALIGNANT) with some probability unless it dies or differentiates first, i.e., unless elapsed time T occurs before malignancy. In this setting, any condition that shortens T (or stochastically reduces it), including exposure to a cytotoxic carcinogen, will tend to reduce the probability of successful traversal of the network, other transition rates being held equal. In contrast to K-stage models – such as the LMS – in which exposure can only hasten the transition of cells toward malignancy, exposure can now reduce the probability that a cell survives to reach malignancy. For example, if an increase in weeks of exposure decreases T, then the increase in weeks of exposure would reduce the probability of carcinogenesis for normal stem cell entering the STN. If this reduction outweighs any increase in the flux of normal stem cells entering the STN per unit time to compensate for reduced T, then the net result is a reduced risk of malignant cells. For example, if the number of cells per unit time increases homeostatically, by just enough to offset the shorter life per cell, thus maintaining cell population sizes, then the lifetime risk of cancer is reduced: a larger number of shorter-lived cells has a lower probability of successfully percolating through the STN than a smaller number of longer-lived cells. In STNs where relatively many stem cells traverse the first few nodes and relatively few penetrate much deeper into the network, physiologically costly defenses (e.g., detection and repair or apoptosis mechanisms for damaged cells) may be distributed primarily among the most frequently traversed, early nodes. In this case, exposures that reduce T, tending to keep cells in the earlier and relatively well-defended parts of the STN, may be especially likely to reduce cancer risk. Expressed in terms of a two-stage clonal expansion model, J-shaped dose-response relations can arise not only by exposures that kill initiated cells (Holt, 1997; Bogen, 2001), but also from exposures that inhibit the fluxes of normal to initiated cells, or initiated to malignant cells, or both.
CONCLUSION
The regulatory dose-response paradigm consisting of linear-non-threshold (LNT) and S-shaped models should be visited de novo. To shape the direction of the discussions and to account for the increasing evidence of by-phasic behaviors at low doses, we introduce two cancer models (the J-shaped and the max-min models) that not only fit the minimum risk consistent with detecting bi-phasic behaviors, but also account for:
The background carcinogens that are responsible for cancer even when the carcinogen of interest is not present;
The overall repair stage (induced by the carcinogen of interest) for the background cancer; and
The linear-non-threshold mechanism for the cancer induced by the carcinogen of interest.
We also introduce the inverse J-shaped model for toxicological endpoints. The advantages of our models is simplicity, ease of interpretation and need for few parameters to be estimated from experimental data. These three models are no more complicated to apply than traditional ones and include the LNTs and S-shapes traditionally used by regulatory agencies. We combine biological realism with experimental results supporting it, and thus are consistent with regulatory law that relies, for ease of application and understanding, on simple but accurate answers. We add a framework for calculating net societal benefits that would otherwise be unaccounted for by conjectural choices such as the LNTs. Finally, our proposed models are consistent with clonal (time-dependent) models, probably the ultimate step in the development of fully realistic cancer causal models.