A novel first-generation stochastic gene episilencing (STEP1) model is introduced for quantitatively characterizing the probability of in vitro epigenetically silencing (episilencing) specific tumor-suppressor-microRNA (miRNA) genes by carcinogen exposure. Although the focus is mainly on in-vitro exposure of human cells to ionizing radiation, the mathematical formulations presented are general and can be applied to other carcinogens. With the STEP1 model, a fraction fj of the surviving target cells can have their tumor-suppressor-miRNA gene of type j silenced while the remaining fraction, 1 - fj, of the surviving cells do not undergo gene episilencing. Suppressor gene episilencing is assumed to arise as a Poisson process characterized with and exponential distribution of episilencing doses with mean dj. In addition to providing mathematical functions for evaluating the single-target-gene episilencing probability, functions are also provided for the multi-target-gene episilencing probability for simultaneously silencing of multiple tumor-suppressor-miRNA genes. Functional relationships are first developed for moderate doses where adaptive responses are unlikely and are then modified for low doses where adaptation can occur. Results apply to a specific follow-up time t after carcinogen exposure that exceeds the maximum time for the occurrence of an induced episilencing event.
Throughout this paper, references to a specific microRNA (miRNA) (e.g., miR-205) are not italicized while references to the related genes (e.g., miR-205) are italicized. MiRNA-mediated RNA interference has been recognized as a novel mechanism for translational-level regulation of protein expression (Lee and Dutta 2007; Lindsay 2008; Cha et al. 2009). MiRNAs are individually encoded by their own set of genes and are an integral part of the genetic program (Chen 2005). They are evolutionary conserved small single-stranded RNAs of 21–25 nucleotides in length that are produced by the endonuclease Dicer from endogenous hairpin-shaped transcripts (Knight and Bass 2001; Gregory and Shiekhattar 2005; Kim 2005; Bartel 2009). One of the strands cleaved by Dicer is incorporated into the RNA-induced silencing complex (RISC) where it induces post-transcriptional, epigenetic silencing (episilencing) of transcripts (RNA) via binding to complimentary target mRNAs (Chen and Meister 2005; Krol and Krzyzosiak 2006; Weber et al. 2007; Flynt and Lai 2008). Protein expression is repressed or the coding message is degraded when miRNAs are bound to the 3′-untranslated regions of target miRNAs (Baek et al. 2008; Chan 2011). A single miRNA can regulate numerous target mRNAs and a group of miRNAs can regulate a single transcript in a coordinated manner (Bartel and Chen 2004; Chen and Meister 2005; Lewis et al. 2005). Proteins expressed from genes targeted by a particular miRNA tend to be hubs and bottlenecks in the protein interactions (Hsu et al. 2008).
The post-transcriptional regulation of gene expression via RNA interference was initially identified in Caenorhabditis elegans (Fire et al. 1998). Hundreds of miRNA genes have been found in the human genome and are responsible for numerous processes that include the control of cell proliferation, apoptosis, tumor formation, immune functions, and an organism's developmental timing (Garzon et al. 2006; Kim and Nam 2006; Wu et al. 2007; Lindsay 2008; Stefani and Slack 2008; Williams 2008). The miRNAs are also involved in the progression of tumorigenesis from benign to malignant tumors and their regulation depends on a stage of oncogenesis (Cha et al. 2009).
A recent study by Tellez et al. (2011) revealed that the epithelial-to-mesenchymal transition (EMT) and stem-cell-like properties are associated with epigenetic silencing (episilencing) of specific tumor-suppressor-miRNA genes (miR-205, miR-200b, and miR-200c) during chemical-carcinogen-induced neoplastic transformation of human bronchial epithelial cells (HBEC) repeatedly exposed in vitro. Interestingly, repeated exposures over weeks apparently led to episilencing of most of the target miRNA genes among different cells but some residual miRNA expression remained as was also the case in studies by others using normal human fibroblast and gamma rays (Simone et al. 2009). The study of Simone et al. focused on expression of tumor-suppressor miRNAs let-7a and let-7b. The indicated observations can be explained on the basis of a hypothesized fraction f of target cells that are susceptible to episilencing of the target miRNA gene and resistant fraction 1- f of cells that do not undergo episilencing of the indicated gene. This might be expected especially if intercellular signaling (e.g., cell community stress response) is involved in the silencing process in which case some cells may be beyond the signaling range.
The activation of the EMT process has recently been implicated as an important step in the metastasis of lung and other tumors (Islam et al. 1996; Tellez et al. 2011). The process is characterized by changes in several molecular pathways and networks and it appears that the loss of E-cad-herin expression is a critical step that drives this development process in human lung and other cancers (Tellez et al. 2011). The miR-200 family and miR-205 are key determinants of the epithelial phenotype via targeting ZEB1 and ZEB2, which has been interpreted to demonstrate that miRNAs can indirectly regulate E-cadherin expression (Gregory et al. 2008; Park et al. 2008; Tellez et al. 2011). ZEB1 and ZEB2 are EMT-inducing transcription factors (Tellez et al. 2011). Presently there are no published mathematical models that allow for quantitatively evaluating the carcinogen-induced episilencing probability for tumor-suppressor-miRNA genes such as miR-200b, miR-200c, miR-205, let-7a, and let-7b or for oncogenic miRNA genes.
The focus of this paper is on introducing a mathematical model for charactering carcinogen-induced episilencing of tumor-suppressor-miRNA genes in vitro. Model-related mathematical functions and parameters are presented which facilitate characterizing the in vitro episilencing probability per surviving target cell and the average episilencing events per surviving target cell. Initial modeling focuses on moderate doses of carcinogen where adaptive responses are considered unlikely. Results obtained are then modified to allow for low-dose adaptive responses. The modeling results obtained for gene episilencing by moderate doses are used to draw inference about the shape of the dose-response curve for neoplastic transformation in vitro as it relates to carcinogen exposure in circumstances where adaptive responses are presumed not to occur. The modeling framework for moderate doses is outlined in the Methods section and modified in the Discussion section to allow for adaptive responses after low carcinogen doses. Some discussion of the time distribution of tumor-suppressor-miRNA gene episilencing is also provided but the distribution is not formally modeled.
METHODS
A target cell with a specified tumor-suppressor-miRNA gene of type j (e.g., miR-200b or miR-200c or miR-205 or let-7a or let-7b) is counted as being at risk to be episilenced with probability fj (which represents the expected fraction of cells that may undergo episilencing). The remaining fraction, 1 - fj, of cells is treated as not undergoing episilencing of the target gene of interest irrespective of the carcinogen dose. The episilencing of a specific miRNA gene as a result of single or repeated exposure in vitro to a carcinogen is assumed to arise as a realization of a Poisson process which occurs at random timeτs with distribution g(τs) (not modeled). The miRNA gene of interest is therefore modeled as active (producing additional miRNA) or silenced (not producing additional miRNA) at fixed follow-up time t, which is presumed to be long enough for all episilencing events to have occurred.
The MiRNA type of interest is assumed to be produced at a constant rate by a given cell while the miRNA gene is activated. When the miRNA gene is episilenced at timeτs, production of new miRNA is assumed to cease for that cell but not for other cells for which their miRNA gene is still active. For this stochastic episilencing process, the follow-up-time t related probability density evaluated with the carcinogen dose x as the independent variable is exponentially distributed with mean episilencing dose given as dj = 1/αj. The product αjx (or ratio x/dj) gives the average number of episilencing events per cell among the fraction fj of cells that make up the at-risk subpopulation for follow-up time t. At-risk (fraction fj) and not-at-risk (fraction 1-fj) cells are presently assumed equally sensitive to cell killing, so that cell killing is not modeled. Rather, the episilencing probability per surviving cell is modeled. This relates to what is observed experimentally (i.e., episilenced genes among surviving cells). The temporal pattern of changes in miRNA molecules is not modeled and results presented relate to a fixed follow-up time t as already indicated. Temporal changes will be addressed in future research. This includes modeling the distribution of times to miRNA gene episilencing.
The probability per surviving cell of a carcinogen-induced episilencing of a specified tumor-suppressor-miRNA gene of type j (i.e., single-target episilencing probability) is given by the exponential function ψj (x) = fj[1 - exp(-x/ dj)]. The product fj[1 - exp(-x/ dj)] represents the joint probability of a surviving cell being in the at-risk group (probability, fj) and also having its target miRNA gene episilenced (probability, [1 - exp(-x/ dj)]), given exposure to a dose x of carcinogen and fixed follow-up time t. The probability 1-exp(-x/ dj) was derived based on exp(-x/ dj) being the probability per surviving cell that gene episilencing does not occur (i.e., the probability for zero episilencing events when the mean is αjx = x/ dj). The expected distribution of the number of gene episilencing events at follow-up time t per cell when the average is x/dj can be generated using the Poisson probability mass function. The mean number of episilencing events per cell can be less than or greater than 1, depending on the dose of carcinogen. At present, the specific silencing events are not identified but could include gene promoter hypermethylation and/or specific his-tone modifications.
All miRNA genes that have been linked to epigenetic regulation are closely associated with CpG islands (Saito et al. 2006; Brueckner et al. 2007; Lujambio et al. 2007; Weber et al. 2007). While most of CpG-rich retroelement and repeat sequences are strongly methylated, most gene-associated CpG islands are not methylated in normal human cells. The pattern changes during tumorigenesis as tumor cells acquire altered methylation profiles. Tumor-specific methylation patterns are characterized by both hypermetylation and hypomethylation. These alterations bring about stable changes in gene expression and are thus functionally equivalent to classical genetic mutations (Weber et al. 2007). However, because of the observation that epigenetically silenced tumor-suppressor genes can be activated while in a fully methylated state, methylation of miRNA genes should not be interpreted as a mechanism for permanent episilencing (Pruitt et al. 2006; Weber et al. 2007). Whether or not high-level-stress-related intercellular signaling is important for this form of miRNA gene activation is unknown. We will investigate this possibility in our future research.
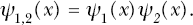
The probability for simultaneous episilencing of multiple tumor-suppressor-miRNA genes of types 1, 2, …, n (i.e., multitarget episilencing probability) by follow-up time t is evaluated as the product ψ1(x)ψ2(x)…ψn (x), which is indicated by ψ1,2,…, n (x). Subtracting ψ1,2,…, n (x) from 1 yields the complimentary survival function S1,2,…, n (x). The related multitarget episilencing hazardH1,2,…, n (x) is equal to “−1” times ln[S1,2,…, n (x)]. Taking the derivative of ψ1,2,…, n (x) with respect to the dose x gives the associated probability density function Θ1,2,…, n (x), which is useful for modeling other effects (EMT, occurrence of stem-like cells, neoplastic transformation) that are related to the simultaneous episilencing of an at-risk set of tumor-suppressor-miRNA genes. This additional modeling will be addressed in future research.
The modeling framework introduced in this section characterized the main features of the first generation stochastic gene episilencing (STEP1) model as it relates to moderate doses where adaptive responses are unlikely. The results presented also apply to low doses when adaptive responses do not occur (e.g., are inhibited). The STEP1 model which focuses on tumor-suppressor-miRNA genes is discussed in more detail in the Results section. As with most if not all first generation models, the STEP1 model has deficiencies that are discussed below which limit the dose range over which it may apply.
RESULTS
STEP1 Model Attributable Risk and Related Functions
The average number of carcinogen-induced episilencing events per cell for a tumor-suppressor-miRNA gene of type j and follow-up time t when cells are exposed in vitro to a non-adaptive-response-invoking dose x of carcinogen is given under the STEP1 model by the single-target gene episilencing hazard (representing the cumulative hazard for target-gene silencing):
Equation 1 is assumed to be valid for both low and moderate doses when adaptive responses do not occur (e.g., are inhibited) but not necessarily for high doses based on reasons provided in the Discussion section. The dose x can be defined in a variety of ways (e.g., exposure time, number of repeated exposures, concentration-time product for a chemical carcinogen). For radiation exposure, the dose can be energy deposited in the target cell population divided by the mass of cells (i.e., the absorbed dose) and therefore can have units such as milligray (mGy), gray (Gy), etc. Throughout this paper the representation involving the parameter dj will be mainly used (an unconventional approach) as this facilitates derivation of the analytical solutions that are presented, related to the probability density functions for carcinogen-induced episilencing of a given tumor-suppressor-miRNA gene. The related single-target episilencing probability per surviving cell for the miRNA gene of type j among the types at risk is given as a function of Hj(x) by the following follow-up time t related equation:
Equation 2 does not include spontaneous episilencing events and therefore represents the attributable episilencing risk. Multiplying ψj(x) by the number c(x) of surviving cells at follow-up time t gives the expected number of surviving episilenced cells (those cells with the target gene silenced) associated with the dose x. This number can be presumed to have a binomial distribution with mean c(x)ψj(x) and variance c(x)ψj(x)(1-ψj(x)). The related single-target episilencing probability density function for the at-risk fraction fj of cells is given by the following not-normalized equation:
For simultaneous silencing of two different target tumor-suppressor-miRNA genes (indicated by subscripts 1 and 2), the corresponding equation for the two-target-episilencing probability per surviving cell (an attributable risk) after exposure to a dose x of carcinogen is given as follows:
The corresponding two-target episilencing hazard is given by the following:
The corresponding not-normalized, two-target episilencing probability density is given by the following:
where,
For simultaneously silencing any n (> 2) multiple targets of tumor-suppressor miRNAs (different genes), the corresponding multitarget episilencing probability per surviving cell (an attributable risk) is given by the following equation:
The corresponding multitarget episilencing hazard is given by the following:
The corresponding equation for the not-normalized, multitarget episilencing probability density can be obtained using the following iterative equations (9b form):
or
For example, for n = 3 (e.g., for simultaneous silencing of miR-200b, miR-200c, and miR-205), one gets the following solution:
where,
The normalization factor for Equation 10a is f1f2f3. One can also calculate the expected fold change in the expressed tumor-suppressor miRNAs of type j at follow-up time t as a result of carcinogen exposure using the STEP1 model. Assuming the expressed miRNA of interest at fixed follow-up time t is proportional to the number of surviving cells with a functional miRNA gene, the expected fold change in the expressed miRNA can be calculated as follows:
Here Nj is the average tumor-suppressor miRNA count (number per cell) for unexposed (control) cells for the type of interest which may be on the order of several thousands per cell (Allawi et al. 2004). However, for this calculation, Nj is present in both the numerator and denominator and cancels out. In vivo research results suggest that Nj can be strongly influenced by the cellular environment (Kuchen et al. 2010); however, with the STEP1 model these influences affect both the numerator and denominator in Equation 11 and therefore cancel out.
Application of the STEP1 Model to Episilencing of Specific miRNA Genes
Here the initial focus is on the tumor-suppressor-miRNA genes let-7a and let-7b for which there is some information that allows estimating STEP1 model parameters for in vitro gamma-ray exposure of normal human fibroblast to moderate radiation doses. Data of Simone et al. (2009) indicated about a 60% reduction in let-7a expression after in vitro exposure of normal human fibroblast to a gamma-ray dose of 1 Gy and about a 70% reduction after a dose of 3 Gy with no additional reduction after a dose of 5 Gy. The data implicates a value for f1 of about 0.7 and a value of parameter α1 of about -ln[(0.4-0.3)/0.7]/1 Gy ≅ 2/Gy (based on equation 11). The corresponding estimate for dj is 0.5 Gy. For a dose of 10 Gy, the fold-change data were inconsistent with the STEP1 model in that only mild episilencing of let-7a (about a 25% reduction in expression) was implicated suggesting that the model's reliability may be limited to doses much less than 10 Gy. This would be expected if cell survival curves were similar for the at-risk (fraction fj) and not-at-risk (fraction 1-fj) cells for low and moderate doses but diverged after a massive dose such as 10 Gy (10,000 mGy) with the cells at risk to episilencing being more sensitive. A dose of 10 Gy would be expected to be highly cytotoxic invoking strong intercellular signaling that may alter miRNA gene episilencing profiles. The high-dose issue will be addressed in future research. Results presented here are restricted to the range 0 to 5 Gy and it is initially assumed that radiation adaptive responses do not occur at low doses. An approach to address radiation adaptive responses at low doses is presented in the Discussion section which allows for relaxing the indicated assumption.
Figure 1 shows the simulated episilencing hazard (H1 (x) = 2x) for let-7a for in vitro exposure of normal human fibroblasts to gamma rays based on the above parameter values. As indicated, the results were derived assuming adaptive responses did not occur after low doses. Figure 2 shows the corresponding calculated single-target episilencing probability (ψ1(x) = 1-exp(−2x)) for Let-7a. The study of Simone et al. (2009) demonstrated a somewhat similar dose-response profile for let-7a and let-7b expression as a function of the gamma-ray dose. Assuming the same parameters assigned to α1 and f1 for let-7a also apply to let-7b, i.e., α1 = α2 = 2/Gy and f1 = f1 = 0.7, then the calculation of the joint probability of episilencing both tumor-suppressor-miRNA genes is according to Equation 4. Results obtained are also presented in Figure 2.
Estimated episilencing hazard for the let-7a for normal human fibroblast exposed in vitro to gamma rays based on data presented in Simone et al. (2009) and on the STEP1 model. Adaptive responses were assumed not to occur at low doses.
Open circles: estimated single-target (let-7a gene) episilencing probability (attributable risk) based on data of Simone et al. (2009) for in vitro gamma-ray exposure of normal human fibroblast and on STEP1 model (f1 = 0.7, α1 = 2/Gy). Open squares: corresponding results for the two-target (let-7a and let-7b genes) episilencing probability (attributable risk) based on data of Simone et al. (2009) and the STEP1 model (f1 = f2 = 0.7 and α1 = α2 = 2/Gy). Data points indicate doses where calculations were carried out. Adaptive responses were assumed not to occur at low doses.
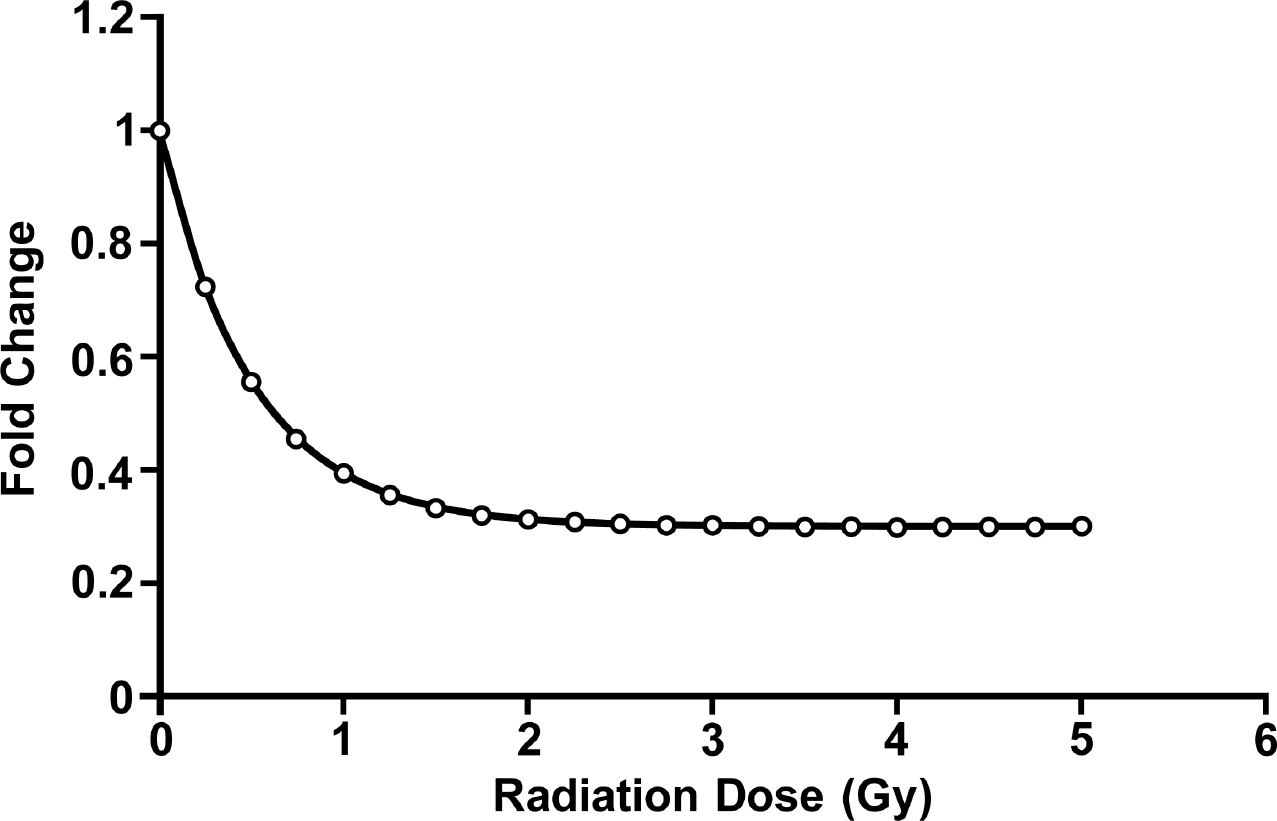
Figure 3 shows the simulated fold changes for let-7a expression based on Equation 11 and the indicated model parameter assignments. The results are consistent with data of Simone et al. (2009) in that there is a calculated 60% reduction in let-7a expression after a dose of 1 Gy and a 70% reduction after a dose of 3 Gy with no additional reduction after a dose of 5 Gy. Note the gradient of responses even though gene episilencing is modeled as either occurring or not occurring at the individual cell level. Thus, experimental data for fold changes in gene expression cannot inform as to whether the underlying biology at the cellular level is stochastic (gene active or episilenced in a given cell) or deterministic (varying degrees of gene episilencing in a given cell). Similar dose-response curve shapes (although more dramatic, possibly due to repeated exposures being used) were reported by Tellez et al. (2011) for miR-200b and miR-200c expression for chronic in vitro combined exposure of HBEC to the smoking-related carcinogens methylnitrosourea (MNU) and benzo(a)pyrene-diol-eposide (BPDE). The data are suggestive of a value of f1 of about 0.9, suggesting that about 10% of the HBEC did not undergo episilencing events for the miR-200b and miR-200c genes.
STEP1 model-based simulated fold change (reduction) in expressed let-7a after in vitro exposure of normal human fibroblast to gamma rays based on the Equation 11 (f1 = 0.7, α1 = 2/Gy). Data points indicate doses, where calculations were carried out. Adaptive responses were assumed not to occur at low doses.
The STEP1 model along with an added assumption about multiple miRNA gene participation in transformation can also be used to compare the findings of Damiani et al. (2008) related to MNU/BPDE-induced neoplastic transformation of HBEC in vitro and the findings of Tellez et al. (2011) for the same cells and carcinogens related to the miRNA gene episilencing. Tellez et al. (2011) investigated the occurrences of EMT and stem-like cells using in vitro neoplastic transformation assay previously established (Damiani et al. 2008) as well as two already transformed cell lines (HBEC1 from a smoker without lung cancer; HBEC2 from a smoker with lung cancer). Tellez et al. (2011) found that a four-week MNU/BPDE exposure of immortalized HBECs induced a persistent, irreversible, and multifaceted de-differentiation process marked by EMT and the emergence of stem-cell-like properties. EMT occurrence was epigenetically driven, initially by chromatin remodeling through H3H27me3 enrichment and later by ensuing DNA methylation to maintain silencing of tumor-suppressor-miRNA genes (miR-200b, miR-200c, and miR-205), which are implicated in the de-differentiation program in HBEC and also in primary lung tumors. Expression of the miRNAs regulating EMT (i.e., miR-200b, miR-200c, miR-205) was significantly reduced at 4 weeks and also in the transformed HBEC1 and HBEC2 cells.
Assuming that simultaneous episilencing of miR-200b, miR-200c, and miR-205 are necessary and sufficient for initiating the EMT (emt) program with probability Ωemt and subsequent stem-like-cell (stem) emergence with probability Ωstem, and subsequent neoplastic transformation (trans) with probability Ωtrans would implicate cubic dose-response curves for the hazard functions Hemt(x), Hstem(x), and Htrans(x) for the respective effects at low to moderate doses. Evidence for a cubic dose-response for Htrans(x) for the induced transformation of HBECs is presented in the Discussion section.
DISCUSSION
Predicting the Shapes of Dose-Response Relationships for Specific Stochastic Biological Effects Based on the STEP1 Model
The STEP1 model was applied as indicated above to the moderate dose radiation data of Simone et al. (2009). Because the model was consistent with the data for moderate radiation doses, it can be used to make predictions about the expected effects of tumor-suppressor miRNA episilencing by such doses of a carcinogen and also by low doses when adaptive responses do not occur. It can be stated with some confidence that for any stochastic (characterized by a defined probability) biological effect which is caused by the episilencing of any one among a set of tumor-suppressor-miRNA genes that the hazard function for that effect would be expected to be a linear function of the carcinogen dose for the range of doses considered with a slope that increases as the number of miRNAs in the at-risk set increases. Where episilencing of two specific tumor-suppressor-miRNA genes is causal (i.e., both necessary and sufficient) for the effect, then the hazard function for that effect would be expected to be a quadratic function of carcinogen dose for the range of doses considered.
Where the episilencing of three specific tumor-suppressor-miRNA genes is causal for the effect, then the hazard function for that effect would be expected to be a cubic function of carcinogen dose for the range of doses considered. Where episilencing of n (>3) specific tumor-suppressor-miRNA genes is causal for the effect, then the hazard function for that effect would be expected to be proportional to xn for the range of doses considered. These predictions apply to low doses only in circumstances where adaptive responses do not occur.
For dose-response data for which there is no evidence for an adaptive response, a plausible value of n can be evaluated by plotting the hazard function (adjusted for spontaneous effects) for the effect of interest vs. x, then vs. x2, then vs. x3, etc. and conduct separate linear regressions (with zero intercept) against these different variables (x, x2, x3, …). The results yielding the highest correlation (adjusted) would be a plausible value of the integer n for xn. This has been done to obtain Figure 4 for the neoplastic transformation hazard Htrans (x) for HBEC1 cells after repeated in vitro exposures to the carcinogenic mixture MNU/BPDE, based on data reported by Damiani et al. (2008). The data did not show any evidence of an adaptive response occurring. The independent variable x was the number of weeks of carcinogen exposure (Figure 5). Thus x = weeks, x2 = weeks2, etc. For n = 1, R2 (adjusted) = 0.41; for n = 2, R2 (adjusted) = 0.48; for n = 3, R2 (adjusted) = 0.49; for n = 4, R2 (adjusted) = 0.42; for n = 5, R2(adjusted) = 0.33. As reflected in Figure 3, n = 3 is considered a plausible choice for these data (n = 2 and 4 are also plausible) and is consistent with simultaneous episilencing of miR-200b, miR-200c, and miR-205 (i.e., three target genes) as being possibly causal for the subsequent neoplastic transformation of HBEC1 cells as was implicated by the study of Tellez et al. (2011). Thus, the notion that simultaneous episilencing of miR-200b, miR-200c, and miR-205 are possibly causal for entering the neoplastic transformation pathway seems plausible but more definitive research is needed before a firm conclusion can be made.
Search results for finding a plausible value for the slope n for the neoplastic transformation hazard Htrans(x) = axn (parameter a) for MNU/BPDE exposed HBEC1 cells in vitro based on data from Damiani et al. (2008). The vertical axis gives values of the adjusted correlation coefficient when experimental data (presented in Figure 5) for Htrans(x) was regressed against x, x2, x3, x4, and x5, where x is the number of weeks of exposure to the carcinogenic mixture.
In vitro neoplastic transformation hazard for MNU/BPDE exposed human bronchial epithelial cells (HBEC1) for normal cells derived from a smoker without lung cancer. The data are based on Damiani et al. (2008) with the transformation hazard calculated as -ln(1-transformation frequency). The smooth curve is based on the hazard function equation Htrans = 3.3times10−6x3, where x is the number of weeks of exposure to the carcinogenic mixture. These results suggest the episilencing of 3 target miRNAs (possibly miR-200b, miR-200c, and miR-205) as possibly being causal for neoplastic transformation. Adaptive responses were assumed not to occur.
Relative Importance of Tumor-Suppressor-Gene Episilencing and Mutations
Mutation induction is known to be important for neoplastic transformation and for cancer induction by moderate and high doses of carcinogens. For exposure to carcinogens at the low end of the known carcinogenic dose range, miRNA episilencing is orders of magnitude more likely than mutation induction. This finding is based on the assumption that the hazard functions (adjusted for spontaneous effects) for both gene episilencing and mutation induction by gamma rays is linear-non-threshold with the slope for episilencing being > 1 (Figure 1) and for mutation induction being orders of magnitude smaller for mammalian cells when the dose is in Gy (Grosovsky and Little 1985).
Possible Impact of Differential Cell Survival at High Doses
The STEP1 model at present does not directly address cell survival. This is because it was assumed that cells at risk to episilencing and those not at risk are equally sensitive to being killed. This assumption allows the modeling to be focused on the episilencing probability per surviving cell. The experimental researcher reports miRNA expression fold-change data for surviving cells so there is no need to model cell survival so long as all target cells are presumed equally sensitive. Future research will address the possibility of different survival curves for cells that are sensitive and those that are resistant to miRNA silencing.
Occurrence of Adaptive Responses at Low Doses
There is hard evidence that the miRNA expression response to radiation exposure is quite different for high and low radiation doses (Cha et al. 2009), possibly related to different biological signaling pathways being involved after low and high doses. There is growing evidence that low but not high doses of low-linear-energy (LET) transfer radiation such as X and gamma rays stimulate adaptive-response signaling pathways (e.g., DNA repair and protective apoptosis that selectively eliminates aberrant cells) (Scott et al. 2009). For in vivo exposure of mammals, low doses of low-LET radiation can also stimulate anticancer immunity while high doses are immunosuppressive (Sakai et al. 2003; Liu 2007) which can lead to a hormetic dose-response relationship for cancer induction.
MiRNAs play an important role in regulation of DNA repair, apoptosis, and immune functions (Chen 2005; Lindsay 2008; Crosby et al. 2009). For example, Lindsay (2008) points out that recent publications have provided compelling evidence that a variety of miRNAs are involved in the regulation of immunity, including the development and differentiation of B and T cells, proliferation of monocytes and neutrophils, antibody switching and the release of inflammatory mediators. Since low-dose radiation stimulates anti-cancer immunity (an adaptive response) and high doses are immunosuppressive, differential episilencing of immune-system-related, tumor-suppressor-miRNA genes are hypothesized. Our future research will investigate this possibility.
Cha et al. (2009) looked at the expression of miRNAs isolated from IM9 human B lymphocytes exposed in culture to low (50 mGy) and high (10,000 mGy) gamma-ray doses. The 50 mGy dose caused decreased expression (an apparent adaptive response) of the following 13 miRNAs whose expression did not decrease after the high radiation dose: hsa-let-7f-2, hsa-miR-19a, hsa-miR-106b, hsa-miR-376a, hsa-miR-16-1, hsa-miR-23a, hsa-miR-18, hsa-23b, hsa-miR-155, hsa-miR-106a, hsa-miR-17-5p, hsa-miR-21, and hsa-miR-20. In contrast, the 10,000 mGy dose increased expression of the following 5 miRNAs that were not increased by the low dose: hsa-miR-324-3p, hsa-miR-238, hsa-miR-187, hsa-miR-99b, and hsa-miR-236. These results suggest that the responses to the low dose (50 mGy) may be a mild-stress response involving intercellular communications that relate to an adaptive response. The next section presents an approach to addressing adaptive responses.
Approach to Addressing Adaptive Responses at Low Doses
The STEP1 model as formulated above does not address tumor-suppressor-miRNA gene changes related to an adaptive responses after a low dose of carcinogen. A more complex modeling scheme is needed to account for adaptive responses. In addition to use of the probability ψj(x) (attributable risk), a benefit function, B(x), should also be used (Scott 2011a). B(x) represents the probability of occurrence of an adaptive response. Such responses are considered to be epigenetically regulated cell-community-wide (epicellcom) responses that involve intercellular and intracellular communications (Scott 2011b). However, in addition to B(x), a second probability is also needed, namely the probability that a specific benefit of interest will occur by follow-up time t, given that an adaptive response has been mounted. This second probably has been represented by what is called the protection factor (PROFAC). For a tumor-suppressor-miRNA gene of type j that is episilenced at follow-up timeτs, a benefit would be its epigenetic activation (epiactivation) by follow-up time t <τs + τa, where τa is the random post silencing time to epiactivation (i.e., reactivation). In such cases, PROFACj can be used to represent the conditional probability of miRNA gene epiactivation by follow-up time t, given that an adaptive response has been mounted as a result of exposure to a dose x of carcinogen. The product B(x) PROFACj would then represent the joint probability of a mounted adaptive response and epiactivation of the indicated silent miRNA gene by follow-up time t. The distribution of the joint times τs+τa can be obtained by convoluting g(τs) and q(τs) where g(τa) and q(τa) are the related distribution functions (probability densities) for τs and τa, respectively (Scott 2011b). This will be addressed in future research. Because the miRNA gene silencing and subsequent reactivation are stochastic events at the individual cell level, g(τs) and q(τa) are continuous functions of time.
B(x) takes on values > 0 only over the dose range (hormetic zone) where adaptive responses occur. For this range, rather than focusing only on the risk function ψj(x), the focus should instead be on the corresponding probability Pj(x) of spontaneous or induced tumor-suppressor gene episilencing where
The parameter Hj,0 accounts for spontaneous episilencing. The product on the right hand side gives the episilencing probability when spontaneous occurrences and an adaptive response are both accounted for. When Hj,0 = 0 (no spontaneous occurrences) and B(x) = 0 (no benefit), then Pj(x) = ψj(x) (the attributable episilencing risk). Because B(x) is expected to have an inverted U-shape (Scott 2011a), the dose-response curve for the indicated product is expected to be hormetic.
At low doses where Hj(x) ≪ Hj0 and B(x) > 0, the following approximation applies:
In this case the relative risk, RR(x), for episilencing tumor-suppressor-miRNA gene j is given by the following:
A similar relationship as used in Equation 14 has been used for deriving a benefit function for the prevention of lung cancer by residential radon exposure (Scott 2011a). The impacts of B(x) and PROFACj on the shape of the dose-response curve for tumor-suppressor-miRNA gene episilencing will be investigated in detail in our future research. Where adaptive-response data are available, point estimates of B(x) can be obtained (Scott 2011a). Our future research will also explore how benefit functions for effects such as tumor-suppressor gene activation, DNA repair induction, and anticancer immunity induction contribute to the benefit function for lung cancer suppression.
The present study has focused on the shape of the dose-response curve for the attributable risk, ψj(x), for episilencing of tumor-suppressor-miRNA genes under circumstances where adaptive responses do not occur. While results presented for low (Pj(x) applies) and moderate (Pj(x) or ψj(x) applies) doses are expected to be reliable, the results may not be reliable for high doses. For high doses, differential cell killing as well as reactivation of episilenced miRNA genes (possibly via a novel mechanism [Pruitt et al. 2006; Weber et al. 2007]) may be important and this will be addressed in future research.
DIFFERENTIAL EFFECTS OF LOW- AND HIGH-LET RADIATIONS ON MiRNA EPISILENCING
Research by Aypar et al. (2011) focused on epigenetic alterations after low and high-LET irradiations. GM1011 cells were irradiated with low-LET X-rays and high-LET iron (Fe) ions and evaluated for DNA damage, cell survival and chromosomal instability. Analysis of DNA methylation showed predominantly hypomethylation. The researchers demonstrated that miRNA expression levels can be altered after X-ray irradiation and that these miRNA are involved in chromatin remodeling and DNA methylation, as was the case in the studies of Tellez et al. (2011) using chemical carcinogens (MNU/BPDE combination) that in contrast elevated the DNA methylation levels. A higher incidence of epigenetic changes was observed after exposure to X-rays than for exposure to Fe ions, even though the Fe ions elicited more chromosomal damage and cell killing.
The distinction was apparent for the miRNA analyses where only three miRNAs involved in two major pathways were altered after high-LET irradiation while six miRNAs involved in five major pathways were altered after low-LET irradiation. Based on these findings, dj and αj are expected to be LET-dependent. PROFAC and B(x) may also be LET-dependent since adaptive responses are usually more likely after low doses of low-LET radiation than after low doses of high-LET radiation.
Possibly the differential occurrence of adaptive responses after low- and high-LET radiation relates to the different miRNA signaling pathways that are associated with the two radiation types. For radon exposure, both low and high-LET radiations are involved and a pronounced adaptive response (radiation hormesis) has been demonstrated for low-level radon, related to suppressing sporadic lung cancer in humans (Scott 2011a; Thompson 2011). Such results suggest that under circumstances of combined exposure to low doses of both low- and high-LET radiation, protective miRNA signaling pathways associated with low-LET radiation may predominate over possibly deleterious pathways associated with high-LET radiation.
CONCLUSIONS
The following conclusions are based on the STEP1 model applications presented:
For exposure to carcinogens at the low end of the known carcinogenic dose range, episilencing of tumor-suppressor-miRNA genes appears much more likely causative for entering the neoplastic transformation pathway than mutation induction.
When the stochastic biological effect of interest after moderate doses is caused by episilencing of any single miRNA gene among an at-risk set of miRNA genes, then the hazard function for the biological effect would be expected to be a linear function of the carcinogen dose, with the slope of the line increasing as the number of miRNA genes in the at-risk set increases. Thus, the magnitude of the slope may be a useful measure of the size of the at-risk set of miRNA genes.
When the stochastic biological effect of interest after moderate doses is caused by the simultaneous episilencing of n tumor-suppressor-miRNA genes, then the hazard function for the biological effect would be expected to be proportional to the carcinogen dose x raised to the nth power (i.e., xn). For MNU/BPDE-induced neoplastic transformation of HBEC, simultaneous episilencing of the three tumor-suppressor-miRNA genes (miR-200, miR-200b, and miR-205) may be causal for entering the pathway to neoplastic transformation but this needs additional investigation as is being done at our Institute.
Tumor-suppressor-miRNA gene activation after low doses of a carcinogen may be the result of an epicellcom response (i.e., adaptive response). In such cases, the fold-change dose-response curve for the miRNA expression may have a hormetic shape (increasing at low doses where gene activation occurs and decreasing at high doses where gene episilencing occurs).
Footnotes
ACKNOWLEDGEMENTS
This research was supported by the Office of Science (BER), U.S. Department of Energy, Grant No. DE-FG02-09ER64783. This paper is being dedicated to the memory of a long-time colleague and friend, Pat Marx, who during her life strongly supported the research that led to the preparation of this work. I am grateful to Dr. Marty Jacobson and the two journal reviewers for helpful review comments and to Steve Belinsky for providing related publications from his group.
References
1.
AllawiHTDahlbergJEOlsonSLundEOlsonMMaW-PTakovaTNeriBP, and LyamichevVI. 2004. Quantitation of microRNAs using a modified invader assay. RNA10:1153–1161
2.
AyparUMorganWF, and BaulchJE. 2011. Radiation-induced epigenetic alterations after low and high LET irradiations. Mutat Res707(1–2):24–33
3.
BaekDVillénJShinCCamargoFDGygiSP, and BartelDP. 2008. The impact of miRNAs on protein output. Nature445:64–71
4.
BartelDP and ChenCZ. 2004. Micromanagers of gene expression: the potentially widespread influence of metazoan microRNAs. Nat Rev Genet5:396–400
5.
BartelDP. 2009. MicroRNAs: target recognition and regulator functions. Cell136:215–233
6.
BruecknerBStresemannCKunerRMundCMuschTMeisterMSultmannH, and LykoF. 2007. The human let-7a-3 locus contains an epigenetically silenced microRNA in human cancer cells. Cancer Res67:1419–1423
7.
ChaHJSeongKMBaeSJungJHKimCSYangK-HJinY-W, and AnS. 2009. Identification of specific microRNAs responding to low and high dose γ-irradiation in the human lymphoblast line IM9. Oncology Reports22:863–868
8.
ChanWC. 2011. Modeling equilibrium of miRNA expression. Frontiers in Genetics 2, Article35,:1–3. doi: 10.3389/fgene.2011.00035
9.
ChenCZ. 2005. MicroRNAs as oncogens and tumor suppressors. New Eng J Med353(17):1768–1771
10.
ChenPY and MeisterG. 2005. MiroRNA-guided posttranscriptional gene regulation. Biol Chem386:1205–1218
11.
CrosbyMEKulshreshthaRIvanMGlazerPM. 2009. MicroRNA regulation of DNA repair gene expression in hypoxic stress. Cancer Res69(3):1221–1229
12.
DamianiLAYinglingCMLengSRomoPENakamuraJ, and BelinskySA. 2008. Carcinogen-induced gene promoter hypermethylation is mediated by DMNT1 and causal for transformation of immortalized bronchial epithelial cells. Cancer Res68(21):9005–9014
13.
FireAXuSAMontgomeryMKKostasSADriverSE, and MelloCC. 1998. Potent and specific genetic interference by double stranded RNA in Caenorhabdigtis elegans. Nature391:806–811
14.
FlyntAS and LaiEC. 2008. Biological principals of microRNA-mediated regulation: shared themes amid diversity. Nat Rev Genet9:831–842
15.
GarzonRFabbriMCimminoACalinGA, and CroceCM. 2006. MicroRNA expression and function in cancer. Trends Mol Med12:580–587
16.
GregoryRI and ShiekhattarR. 2005. MicoRNA biogenesis and cancer. Cancer Res65:3509–3512
17.
GregoryPABertAGPatersonELBarrySCTsykinAFarshidGVadasMAKhew-GoodallY, and GoodallGJ. 2008. The miR-200 family and miR-205 regulate epithelial to mesenchymal transition by targeting ZEB1 and SIP1. Nat Cel Biol10:593–601
18.
GrosovskyAJ and LittleJB. 1985. Evidence for linear response for the induction of mutations in human cells by x-ray exposures below 10 rads. Proc Natl Acad Sci USA82(7):2092–2095
19.
HsuC-WJuanHF, and HuangHC. 2008. Characterization of microRNA-regulated protein-protein interaction network. Proteomics8:1975–1979
20.
IslamSCareyTEWoldGTWheelockMJ, and JohnsonKR. 1996. Expression of N-cadherin by human squamous carcinoma cells induces a scattered fibroblastic phenotype with disrupted cell-cell adhesion. J Cell Biol135:1643–1654
KimVN and NamJW. 2006. Genomics of microRNA. Trends Genet22:165–173
23.
KnightSW and BassBL. 2001. A role for the RNase II enzyme DCR-1 in RNA interference and germ line development in Caenorhabditis elegans. Science293:2269–2271
24.
KrolJ and KrzyzosiakWJ. 2006. Structure analysis of microRNA precursors. Methods Mol Biol342:19–32
25.
KuchenSReschWYamaneAKuoNLiZChakrabortyTWeiLLaurenceAYasudaTPengSHu-LiJLuKDuboisWKitamuraYCharlesNSunH-WMuljoSSchwartzbergPLPaulWEO'SheaJRajewskyK, and CasellasR. 2010. Regulaton of microRNA expression and abundance during lymphopoiesis. Immunity32:828–839
26.
LeeYS and DuttaA. 2007. The tumor suppressor microRNA let-7 represses the HMGA2 oncogene. Genes and Development21(9):1025–1030
27.
LewisBPBurgeCB, and BartelDP. 2005. Conserved seed pairing, often flanked by adenosines, indicates that thousands of human genes are microRNA targets. Cell120:15–20
28.
LindsayM. 2008. MicroRNAs and the immune response. Trends in Immunology29(7):343–351
29.
LiuS-Z. 2007. Cancer control related to stimulation of immunity by low-dose radiation. Dose-Response5:39–47
30.
LujambioARoperoSBallestarEFragaMFCerratoCSetienFCasadoSSuarez-GauthierASanchez-CespedesMGittASpiteriIDasPPCaldasCMiskaE, and EstellerM. 2007. Genetic unmasking of an epigenetically silenced microRNA in human cancer cells. Cancer Res67:1424–1429
31.
ParkSMGaurAGLengyelE, and PeterME. 2008. The miR-200 family determines the epithelial phenotype of cancer cells by targeting the E-cadherin repressors ZEB1 and ZEB2. Genes Dev22(7):894–907
32.
PruittKZinnRIOhmJEMcGarveyKMKangSHWarkinsDNHermanJG, and BaylinSB. 2006. Inhibition of SIRT1 reactivates silenced cancer genes without loss of promoter DNA hypermethylation. PLoS Genet2:e40
33.
SaitoYLiangGEggerGFriedmanJMChaungJCCoetzeeGA, and JonesPA. 2006. Specific activation of microRNA-127 with downregulation of the proto-oncogene BCL6 by chromatin-modifying drugs in human cancer cells. Cancer Cell9L435–443
34.
SakaiKHoshiYNomuraTOdaTIwasakiTFujitaKYamadaT, and TanookaH. 2003. Suppression of carcinogenic process in mice by chronic low dose rate gamma-irradiation. Int J Low Radiat1(1):142–146
35.
ScottBRBelinskySALengSLinYWilderJA, and DamianiLA. 2009. Radiation stimulated epigenetic reprogramming of adaptive-response genes in the lung: an evolutionary gift for mounting adaptive protection against lung cancer. Dose-Response7 (2): 104–131
ScottBR. 2011b. Modeling DNA double-strand break repair kinetics as an epiregulated cell-community-wide (epicellcom) response to radiation stress. Dose-Response (in press).
StefaniG and SlackFJ. 2008. Small non-coding RNAs in animal development. Nat Rev Mol Cell Biol9:219–230
40.
TellezCSDanielEJKieuDBernauerAMThomasCLDamianiLATessemaMLengS, and BelinskySA. 2011. EMT and stem cell-like properties associated with miR-205 and miR-200 epigenetic silencing are early manifestations during carcinogen-induced transformation of human lung epithelial cells. Cancer Res71(8):3087–3097
41.
ThompsonRE. 2011. Epidemiological evidence for possible radiation hormesis from radon exposure: A case-control study conducted in Worcester, Ma. Dose-Response9(1):59–75
42.
WeberBStresemannCBruecknerB, and LykoR. 2007. Mtehylation of human microRNA genes in normal and neoplastic cells. Cell Cycle6(9):1001–1005
43.
WilliamsAE. 2008. Functional aspects of animal microRNAs. Cell Mol Life Sci65:545–562
44.
WuWSumMZouGM, and ChenJ. 2007. MicroRNA and cancer: Current status and prospective. Int J Cancer120:953–960