
Abstract
Tumor angiogenesis, the growth of new blood vessels into tumors, facilitates tumor growth and thus represents an attractive therapeutic target. Numerous experimental angiogenesis inhibitors have been characterised and subsequently trialled in patients. Some of these agents have failed to show any substantial activity in patients. In contrast, others have been more successful, but even these provide only a few months extra patient survival. Recent work has focused on understanding the effects of anti-angiogenic agents on tumor biology and has revealed a number of new findings that may help to explain the limited efficacy of angiogenesis inhibitors. Herein, I review the evidence that hormetic dose-responses (i.e. bell-shaped and U-shaped dose-response curves) are often observed with anti-angiogenic agents. Agents reported to exhibit these types of dose-response include: 5-fluorouracil, ATN-161, bortezomib, cisplatin, endostatin, enterostatin, integrin inhibitors, interferon-α, plasminogen activator-1 (PAI-1), rapamycin, rosiglitazone, statins, thrombospondin-1, TGF-α1 and TGF-α3. Hormesis may also be relevant for drugs that target the vascular endothelial growth factor (VEGF) signalling pathway and for metronomic chemotherapy. Here I argue that hormetic dose-responses present a challenge for the clinical translation of several anti-angiogenic agents and discuss how these problems might be circumvented.
1. INTRODUCTION TO ANTI-ANGIOGENIC THERAPY
1.1 The concept of tumor angiogenesis and anti-angiogenic therapy
The growth of tumors is dependent on an adequate supply of oxygen and nutrients, which are supplied to the tumor by blood vessels. Extensive evidence shows that tumor progression is dependent on tumor angiogenesis i.e. the growth of new blood vessels into tumors. It was the late Judah Folkman who first pioneered the idea that: (a) tumor angiogenesis drives aggressive tumor growth, and (b) inhibition of tumor angiogenesis should be an effective way to block tumor growth (Folkman 1971). In support of this idea, a great deal of pre-clinical work has shown that angiogenesis inhibitors can suppress tumor growth and this has driven the clinical translation of angiogenesis inhibitors (Kerbel and Folkman 2002; Folkman 2007).
Folkman also proposed that anti-angiogenic therapy should have a number of advantages over conventional chemotherapy. Firstly, since angiogenesis occurs in most tumor types, anti-angiogenic therapy should be an effective treatment strategy for most cancers. Secondly, since angiogenesis inhibitors target the genetically stable tumor vasculature, therapy resistance should be minimal. Thirdly, since the adult vasculature is mostly quiescent (angiogenesis is a rare process in the healthy adult body) toxic side-effects of anti-angiogenic therapies should be minimal. Although this logic appeared to be apparently sound, evidence is accumulating to suggest that (a) anti-angiogenic therapy may only be effective against certain types of cancer, (b) anti-angiogenic drugs can have toxic side effects, and (c) acquired resistance to angiogenesis inhibitors can occur (Kamba and McDonald 2007; Bergers and Hanahan 2008; Hutson et al. 2008; Shojaei and Ferrara 2008; Blowers and Hall 2009; Ebos et al. 2009b; Eikesdal and Kalluri 2009).
1.2 Molecular players in the angiogenic switch
Tumor angiogenesis is considered to be regulated by an “angiogenic switch” that relies on a change in the local concentrations of pro-angiogenic and anti-angiogenic mediators in the tumor microenvironment in favour of tumor angiogenesis (Hanahan and Folkman 1996). Vascular endothelial growth factor (VEGF), a pro-angiogenic growth factor expressed by virtually all solid cancers, is considered to be the principal growth factor via which tumors induce angiogenesis. VEGF is released from tumor cells and tumor stromal cells and binds to two cognate VEGF receptors, VEGF receptor 1 (VEGFR1) and VEGF receptor 2 (VEGFR2), which are expressed on local vascular endothelial cells (Olsson et al. 2006). Signalling through these receptors drives the process of angiogenesis, which involves dissolution of the vascular basement membrane, endothelial cell proliferation, endothelial cell migration and formation of new blood vessels that grow into the tumor (Carmeliet 2000). The VEGF signalling system appears to be a highly ‘druggable’ target and potent inhibitors of the VEGF signalling pathway have been developed (Ferrara et al. 2004; Ferrara and Kerbel 2005; Ellis and Hicklin 2008; Kerbel 2008).
The process of angiogenesis involves the coordinated regulation of many aspects of cell behaviour. For example, in order for endothelial cells to migrate and form new blood vessels, changes in the actin cytoskeleton and alterations in cell adhesion must occur. The involvement of these processes in angiogenesis has spurred the development of other types of angiogenesis inhibitors, including inhibitors of cell adhesion (Hood and Cheresh 2002; Tucker 2003). Moreover, numerous endogenous proteins that exhibit angiogenesis inhibitory activity have been characterised, including endostatin and angiostatin. Coordinated down-regulation of these molecules is believed to be necessary for initiation of angiogenesis. These endogenous angiogenesis inhibitors have therefore also been utilised as potential therapeutic agents (Clamp and Jayson 2005; Folkman 2006).
1.3. Clinical translation of anti-angiogenic therapy
Although numerous angiogenesis inhibitors have been characterised only a handful of these agents have yielded promising results in patients. For example, a number of agents reported to successfully suppress angiogenesis and tumor growth in tumor-bearing mice have not shown equivalent results in patients. These include integrin inhibitors (e.g. cilengitide) and naturally occurring angiogenesis inhibitors (e.g. endostatin). As a consequence, these agents have yet to be licensed for use in patients.
The most successful anti-angiogenic agents trialled in patients thus far are drugs that target the VEGF signalling pathway. At the time of writing, three agents in this class have been licensed for the treatment of cancer patients: bevacizumab, sunitinib and sorafenib. Bevacizumab is a humanised monoclonal antibody that binds VEGF and prevents its binding to cognate VEGF receptors, whilst sunitinib and sorafenib are small molecule drugs that potently inhibit the tyrosine kinase activity of several receptors, including VEGFR1, VEGFR2, PDGFR and KIT receptor (Folkman 2007; Ellis and Hicklin 2008). Sunitinib monotherapy has been reported to extend progression free survival and overall survival in patients with metastatic renal cancer (Motzer et al. 2007; Motzer et al. 2009), whilst bevacizumab can extend progression–free survival in several cancers, including metastatic colorectal, lung and breast cancers when used in combination with chemotherapy (Hurwitz et al. 2004; Sandler et al. 2006; Miller et al. 2007). However, benefits in overall survival afforded by bevacizumab are reported as being insignificant in several trials (Escudier et al. 2007; Miller et al. 2007; Saltz et al. 2008), whilst other trials show that overall survival can, at best, only be extended by a few months (Hurwitz et al. 2004; Sandler et al. 2006). In summary, experience in the clinic with the VEGF pathway inhibitors shows that, (a) whilst some patients respond to these agents, others do not, (b) certain cancers appear more sensitive to these agents than others, (c) although some cancers can respond to these drugs when administered as monotherapy (e.g. sunitinib in renal cancer), in most cases these agents must be combined with other drugs to be effective (e.g. bevacizumab in colorectal cancer), and (d) although patients can respond initially to therapy, the development of resistance is a problem. The mechanisms which underlie these observations are poorly understood (Ebos et al. 2009b).
1.4 Resistance and host response to anti-angiogenic therapy
Recent work from many groups has focused on understanding the effects of angiogenesis inhibitors on tumor biology. This work has begun to reveal why tumors can be refractory or acquire resistance to anti-angiogenic agents. Some of these findings are briefly discussed below.
As well as expressing VEGF, tumors can express other pro-angiogenic growth factors, such as fibroblast growth factor 2 (FGF2) or placental growth factor (Fujimoto et al. 1995; Relf et al. 1997; Smith et al. 1999; Parr et al. 2005) that could theoretically substitute for VEGF and result in angiogenesis even when VEGF-signalling is blocked. It has been suggested that the presence of these alternative factors in anti-angiogenic-therapy naïve tumors might cause tumors to be refractory to VEGF inhibition or that up-regulation of these factors during the course of therapy could lead to acquired resistance to VEGF pathway inhibition (Casanovas et al. 2005; Kerbel 2005; Bergers and Hanahan 2008).
Apart from changes in growth factor expression, other aspects of the tumor microenvironment may be important for resistance. For example, resistance to VEGF-pathway inhibitors has been linked with tumor recruitment of endothelial progenitor cells, myeloid cells or fibroblasts. These cells may render tumors insensitive to anti-angiogenic therapy, either by directly incorporating into the vasculature or by secreting factors that promote endothelial or tumor cell survival (Rafii et al. 2002; Orimo et al. 2005; Bertolini et al. 2006; De Palma and Naldini 2006; Murdoch et al. 2008; Shojaei and Ferrara 2008; Crawford et al. 2009).
Angiogenesis may not be the only mechanism via which tumors acquire a vasculature. In particular, a number of tumors have been shown to access a blood supply by hijacking existing local blood vessels (Pezzella et al. 1997; Holash et al. 1999; Rubenstein et al. 2000; Leenders et al. 2004). In this scenario, tumor cells grow along existing blood vessels, or remodel local existing blood vessels as they invade. The mechanisms that mediate this ‘vascular co-option’ process are largely unknown, but it is likely that this type of tumor vascularisation may be insensitive to conventional anti-angiogenic agents or may provide an escape mechanism from antiangiogenic therapy.
Arguably, the most surprising observations regarding the effects of anti-angiogenic agents are the recently published data showing that, whilst VEGF pathway inhibitors can suppress tumor growth, they may also actually promote invasive tumor growth and distant tumor metastasis in mice (Ebos et al. 2009a; Paez-Ribes et al. 2009). Clearly, if such effects are also observed in humans, this could be a mechanism that could seriously compromise the ability of anti-angiogenic therapy to extend patient survival and could explain the rapid progression of disease that is sometimes observed after cessation of anti-angiogenic therapy in cancer patients (Ebos et al. 2009b).
Anti-angiogenic agents also face another problem that has, thus far, received little emphasis in the literature. Molecules with anti-angiogenic activity often appear to exhibit hormesis i.e. bell-shaped or U-shaped dose-response curves. The remainder of this review will discuss the evidence for hormesis in angiogenesis and its possible relevance for antiangiogenic therapy in human cancer patients.
2. HORMESIS AND ANGIOGENESIS
2.1 Dose-response models
The fundamental nature of the dose-response to drugs is generally considered to be sigmoidal (Fig. 1a). At low concentrations, drugs are assumed to have no significant biological effect, until a threshold is met whereby inhibition proceeds in a linear fashion until saturation is achieved. This concept of the dose-response, known as the threshold model, has dominated the field of pharmacology and medicine for most of the 20th century (Calabrese 2009). During this period of time, cancer patients have been routinely treated with chemotherapy drugs at the maximum tolerated dose. According to the threshold dose-response model, this should maximise the chance of eradicating all tumor cells and yield the best therapeutic index (Korn et al. 2001; Fox et al. 2002).
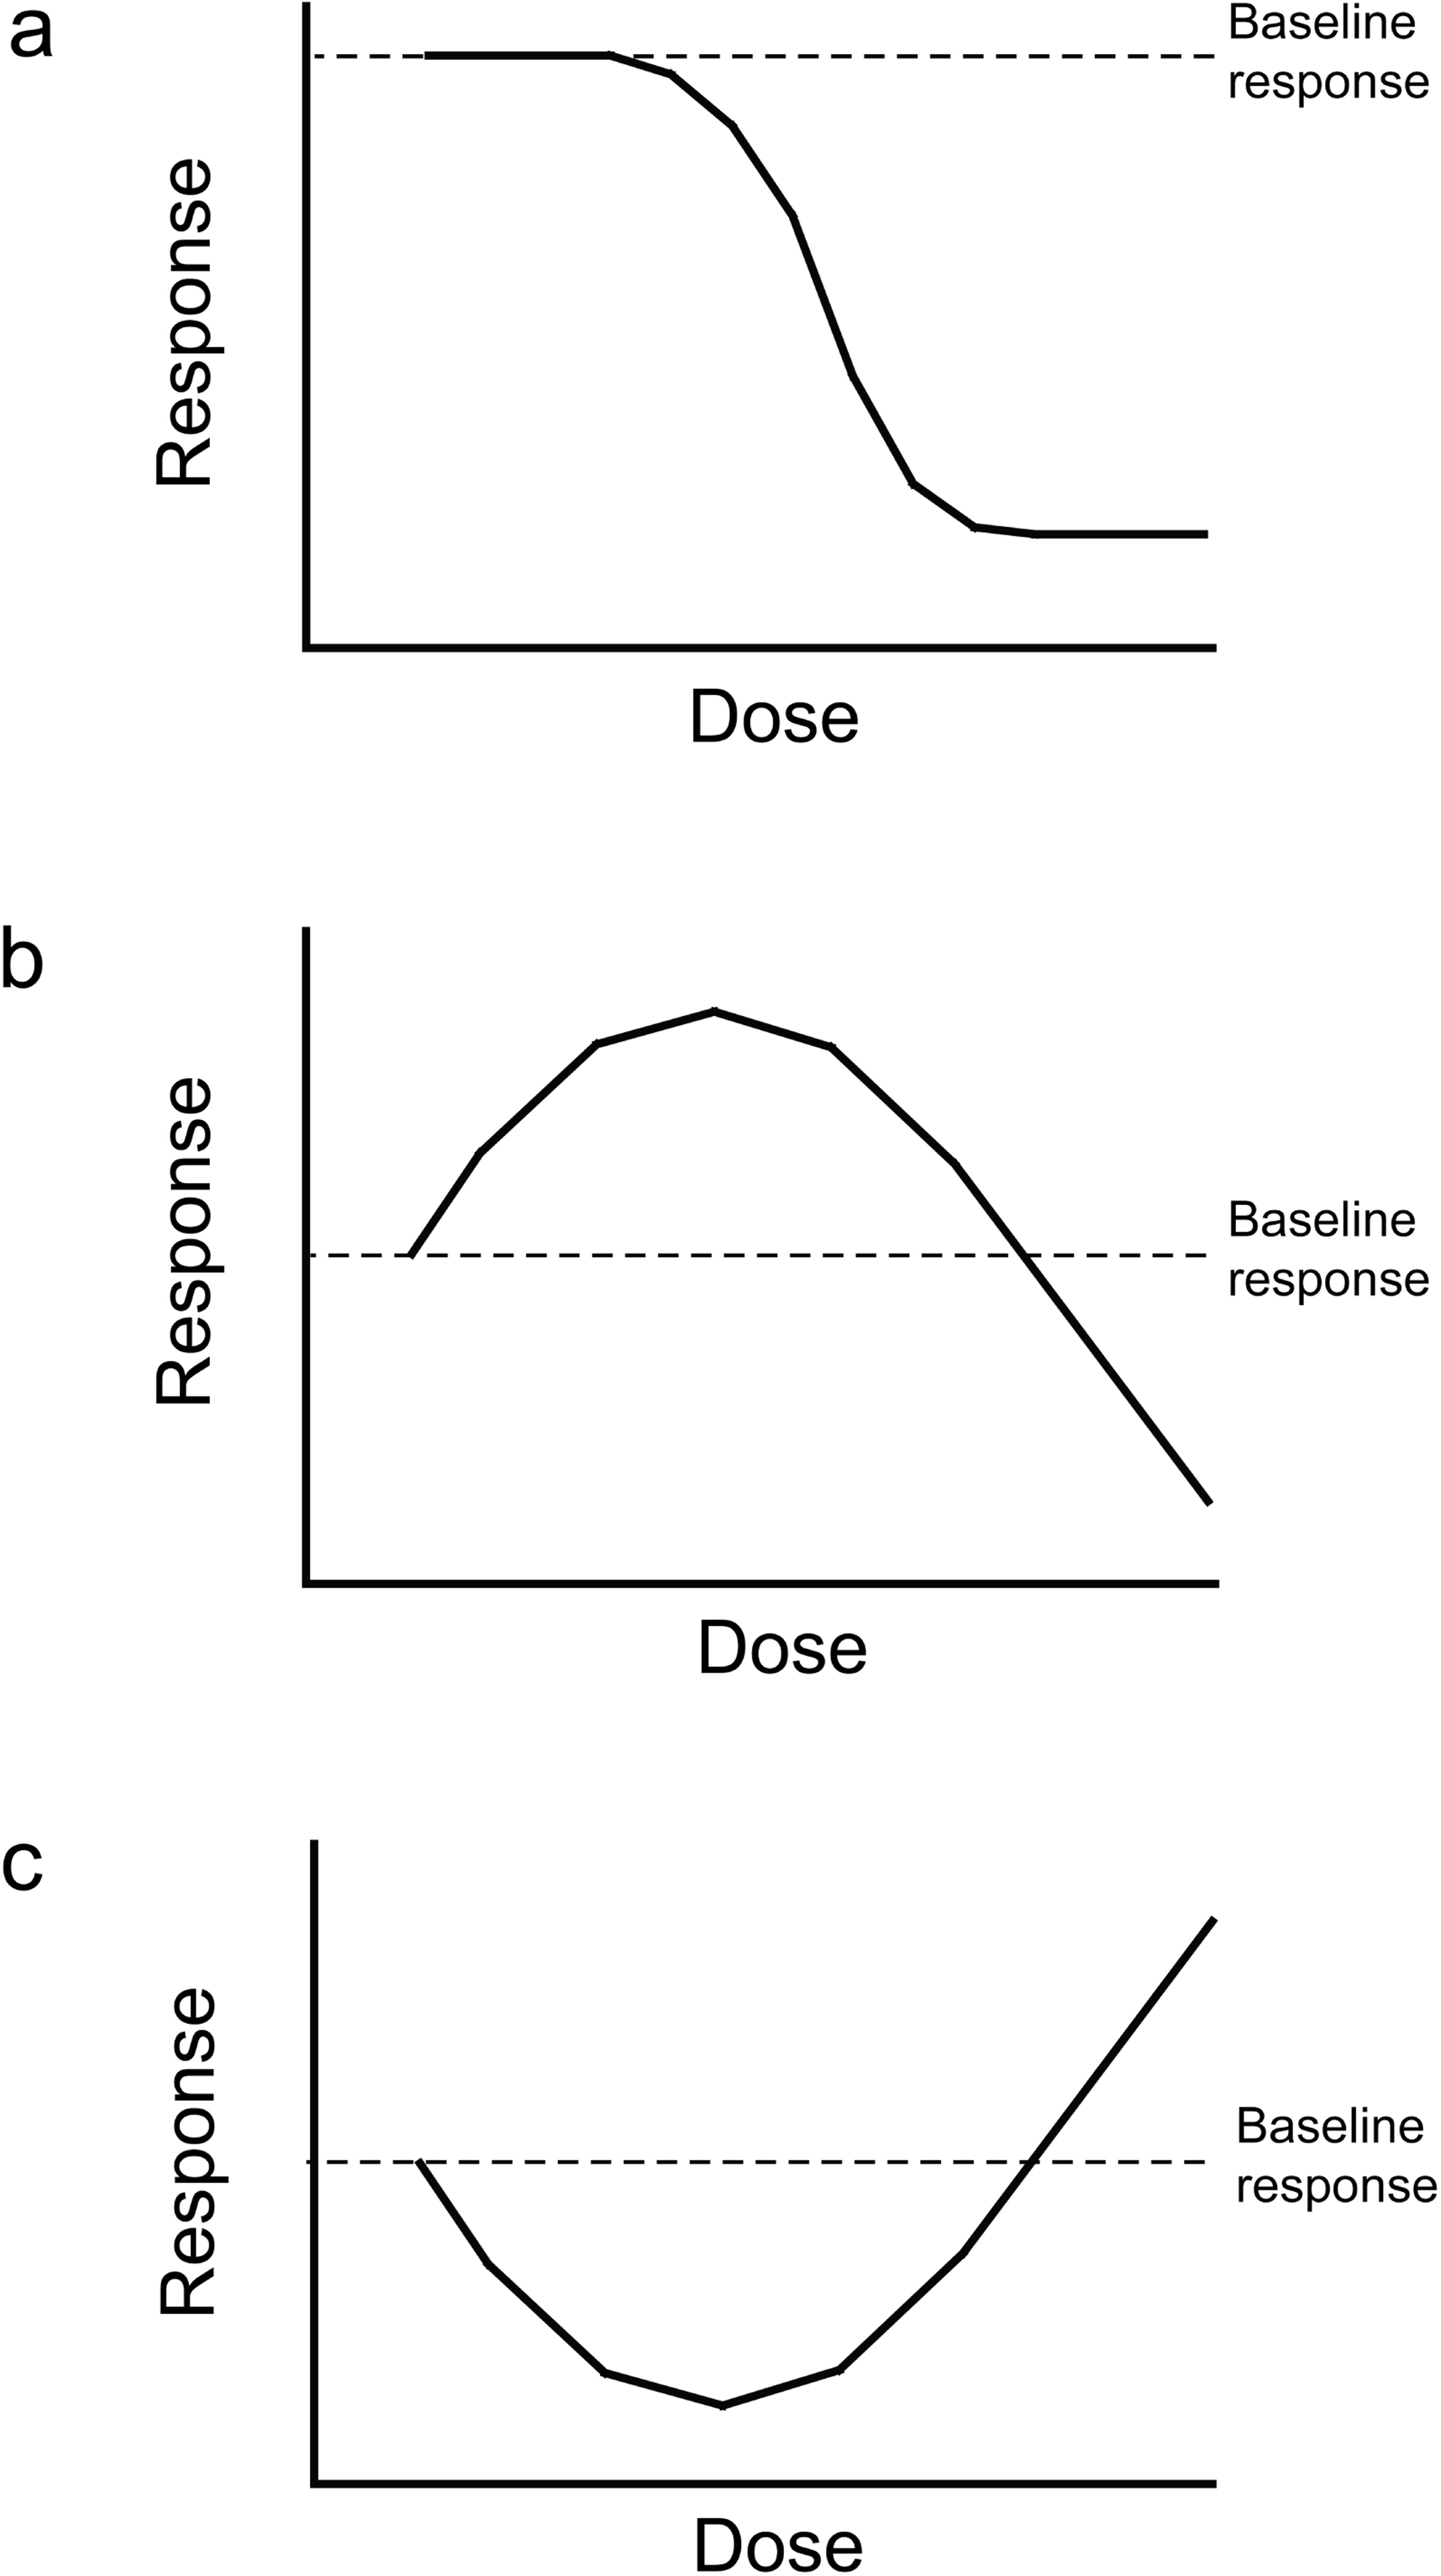
Generic appearance of the threshold, bell-shaped and U/J-shaped dose response curves. (a) A threshold dose-response, where low concentrations of an agent exert no effect until a threshold is reached. At this threshold concentration, inhibition occurs linearly in a dose-dependent fashion, until saturation is achieved. (b) A bell-shaped dose-response, where an agent exerts a stimulatory effect at low doses, which is diminished at higher doses. At higher doses, an inhibitory effect may be observed. (c) A U-shaped or J-shaped dose-response, where inhibition is observed only when the agent is present at low concentrations. At higher concentrations, this inhibitory effect is lost and a stimulatory effect may even be observed.
However, extensive evidence suggests that the threshold dose-response model may be an inadequate model to explain the pharmacodynamics of many anti-cancer compounds. Instead, the dose-response to many drugs may be preferentially modelled using ‘hormetic’ or ‘biphasic’ dose-response models (Calabrese and Baldwin 2003; Calabrese et al. 2006b; Calabrese et al. 2008). Hormesis can manifest in several forms: bell-shaped, U-shaped or J-shaped dose-response curves. A bell-shaped dose-response is characterized by low-dose stimulation, followed by loss of this effect at higher doses (Fig. 1b). An agent displaying a bell-shaped dose-response may often show inhibitory activity at higher doses (Fig. 1b). In a U-shaped dose-response, low concentrations of drug have an inhibitory effect that is lost at higher concentrations (Fig 1c). Sometimes, an agent displaying a U-shaped dose-response may even have a stimulatory effect at higher doses, which is referred to as a J-shaped dose-response (Fig. 1c) (Calabrese 2005; Calabrese et al. 2006a).
2.2 Bell-shaped and U-shaped dose-responses in angiogenesis
The literature contains several reports of molecules that can stimulate angiogenesis at low concentrations, whilst inhibiting angiogenesis at higher doses, i.e. a bell-shaped dose-response. These molecules include: bortezomib (Veschini et al. 2007), HMG-CoA reductase inhibitors (Urbich et al. 2002; Weis et al. 2002), plasminogen activator-1 (PAI-1) (Devy et al. 2002), RGD-mimetic integrin inhibitors (Reynolds et al. 2009; Weis et al. 2009), TGF-β1 (Pepper et al. 1993; Lebrin et al. 2005) and TGF-β3 (Goumans et al. 2002). Several reports of molecules that only inhibit angiogenesis at low doses can also be found, i.e. a U-shaped dose-response curve. These include endostatin (Celik et al. 2005; Tjin Tham Sjin et al. 2006), integrin inhibitor ATN-161 (Donate et al. 2008), interferon-α (Slaton et al. 1999) the mTOR inhibitor rapamycin (Humar et al. 2002; Bruns et al. 2004), the PPARγ ligand rosiglitazone (Panigrahy et al. 2002) and the satiety peptide enterostatin (Park et al. 2008). Finally, thrombospondin-1 has been reported to exhibit both a bell-shaped dose-response (Motegi et al. 2002; Motegi et al. 2008) and a U-shaped dose-response (Tolsma et al. 1993; Miao et al. 2001).
Unfortunately, there is insufficient space here to discuss the implications of all these papers, so here I will focus specifically on RGD-mimetic integrin inhibitors and thrombospondin-1 as examples of compounds that can give rise to a bell-shaped dose-response, whilst endostatin, ATN-161 and thrombospondin-1 will be used as examples of agents that display U-shaped dose-responses. Finally, I will review the evidence that hormesis has relevance for VEGF pathway inhibitors and for a form of anti-angiogenic therapy known as metronomic chemotherapy.
3. RGD-MIMETIC INTEGRIN INHIBITORS
3.1 Anti-angiogenic therapy via targeting of αvβ3- and αvβ5-integrin
Integrins are cell adhesion molecules that regulate diverse cellular functions during the process of angiogenesis and tumor progression, including cell migration, cell proliferation and cell survival (Hood and Cheresh 2002; Hynes et al. 2002). The integrins αvβ3 and αvβ5 can be expressed both by tumor cells and tumor endothelial cells (Varner and Cheresh 1996). Drugs that inhibit integrin function may be able to block tumor growth in at least two ways: by targeting the function of integrins in tumor cells directly and by inhibiting tumor angiogenesis (Brooks et al. 1994a; Brooks et al. 1994b; Brooks et al. 1995; Varner and Cheresh 1996; Hodivala-Dilke et al. 2003; Tucker 2003). The αvβ3 and αvβ5 integrins mediate cell adhesion by binding to an arginine-glycine-aspartate (RGD) sequence that is present in various extracellular matrix molecules (Ruoslahti and Pierschbacher 1987). Ligand competitive inhibitors, or ‘RGD-mimetic integrin inhibitors,’ have been designed to block this interaction. Existing αvβ3/αvβ5–integrin inhibitors include the RGD–mimetic cyclic peptide, cilengitide (EMD 121974) (Dechantsreiter et al. 1999; Nisato et al. 2003) and RGD–mimetic small molecules such as S 36578 (Perron-Sierra et al. 2002; Maubant et al. 2006). Cilengitide is currently in phase 1 and 2 clinical trials for cancer therapy. Initial trials of cilengitide in human cancer demonstrated that the drug was well-tolerated, but that it offered little significant clinical benefit in the majority of patients (Eskens et al. 2003; Friess et al. 2006; Hariharan et al. 2007). However, some glioma patients respond to cilengitide when it is administered at high doses (Nabors et al. 2007) or when it is combined with radiation therapy and temozolimide (Stupp 2007).
3.2 Pre-clinical evidence for a bell-shaped dose-response to RGD-mimetic integrin inhibitors
Within a few hours after administration of an integrin inhibitor bolus to mice, plasma concentrations of inhibitor fall rapidly from micromolar to nanomolar levels (Reynolds et al. 2009). We therefore investigated whether nanomolar doses of integrin inhibitors could have different effects on tumor growth and angiogenesis as compared to micromolar doses of integrin inhibitors. Surprisingly, we found that low (nanomolar) concentrations of RGD–mimetic αvβ3/αvβ5–inhibitors could actually stimulate angiogenesis within in vitro models and stimulate tumor growth and angiogenesis in subcutaneous tumor grafts in mice. We found clear evidence that the dose-response to these agents is bell-shaped, with low (nanomolar) concentrations of αvβ3/αvβ5–inhibitors stimulating angiogenesis, whilst high (micromolar) concentrations of αvβ3/αvβ5–inhibitors inhibited angiogenesis (Reynolds et al. 2009).
Although these observations were at first surprising to us, we found previously published work suggesting that low concentrations of RGD peptides might be able to activate integrins or promote cell migration (Aznavoorian et al. 1990; Legler et al. 2001; Hynes 2002; Weis et al. 2009). Endothelial cell migration is an essential component of angiogenesis. Moreover, the intracellular recycling of various cell surface molecules, such as integrins and growth factor receptors, is a vital process during cell migration (Bretscher 1996; Jones et al. 2006; Caswell and Norman 2008). We showed that nanomolar concentrations of αvβ3/αvβ5–integrin inhibitors promoted the recycling of both αvβ3–integrin and VEGFR2. Importantly, when we inhibited this recycling, the ability of αvβ3/αvβ5–inhibitors to promote angiogenesis was ablated (Reynolds et al. 2009). In concordance with our observations, a second study showed that cilengitide can promote tumor cell invasion within in vitro models (Caswell et al. 2008). Combined, these data suggest that integrin inhibitors may sometimes be able to promote tumor progression.
3.3 Relevance of the bell-shaped dose-response for the clinical translation of integrin inhibitors
How do these findings assist in our understanding of how to apply RGD-mimetic integrin inhibitors in the clinic? The data suggest that whilst high concentrations of integrin inhibitors may provide a therapeutic effect, low concentrations may be detrimental and promote angiogenesis and tumor growth. At the time of writing, there is debate as to whether low concentrations of cilengitide will have the same effect in human tumors (Reynolds and Hodivala-Dilke 2009; Weis et al. 2009; Weller et al. 2009).
Importantly, in current trials of cilengitide, the drug is being administered at high doses or in combination with other therapies (Weller et al. 2009). Conceivably, this type of administration may circumvent the deleterious side effects that we and others have reported with cilengitide. Of interest, we found that the tumor growth promoting effect of integrin inhibitors was ablated if mice were co-administered a VEGFR2 function-blocking antibody (Reynolds et al. 2009). This suggests that it may be reasonable to test the combination of VEGF inhibitors with integrin inhibitors in clinical trials. In support of this, Strieth and co-workers demonstrated that the combination of anti-integrin and anti-VEGF therapy was highly effective in suppressing tumor growth in A-Mel-3 melanoma tumors grown subcutaneously in Syrian golden hamsters (Strieth et al. 2006). Interestingly, a trial combining VEGF-inhibition with integrin inhibition is being planned for glioma patients (Elizabeth Gerstner, personal communication). In this trial, VEGF pathway inhibition will be achieved using cediranib, a small molecule tyrosine kinase inhibitor that inhibits VEGFR2 (Wedge et al. 2005), and the integrin inhibitor to be used is cilengitide. It is hoped that this combination will show activity in cancer patients.
4. ENDOSTATIN
4.1 Pre-clinical evidence for a U-shaped dose-response to endostatin
Endostatin is an endogenously expressed 20 kDa proteolytic fragment derived from the C-terminus of type XVIII collagen. Endostatin can inhibit endothelial cell proliferation and migration in vitro and treatment of mice with endostatin can inhibit tumor growth in mice by suppression of tumor angiogenesis (Boehm et al. 1997; O'Reilly et al. 1997; Folkman 2006). Phase 1 and 2 studies of endostatin in patients showed that treatment with endostatin is associated with minimal toxicity but, thus far, impressive therapeutic effects have not been reported (Eder et al. 2002; Kulke et al. 2006). Trials of endostatin in the USA were terminated at the phase 2 stage. Here I discuss the evidence for a U-shaped dose-response to endostatin and its relevance for the clinical translation of endostatin as an anti-cancer agent.
Two reports demonstrated that endostatin exhibits a U-shaped dose-response curve with respect to inhibition of tumor growth (Celik et al. 2005; Tjin Tham Sjin et al. 2006). Both papers showed that the growth of human pancreatic cancer cell lines in mice is inhibited by low doses of endostatin, but that the therapeutic efficacy of endostatin is lost once the dose is increased. Celik found that, in BxPC-3 tumor-bearing mice, the maximally effective dose was 100 mg/kg/day endostatin, where circulating endostatin levels were 9.14 ± 4.67 ng/ml. For AsPC-1 tumor-bearing mice, the maximally effective dose was slightly higher at 500 mg/kg/day (circulating endostatin levels were 62.2 ± 22.9 ng/ml). For both tumor types, an increase in dosage to 1000 mg/kg/day resulted in elevated circulating endostatin levels in excess of 100 ng/ml and was correlated with reduced therapeutic efficacy of endostatin. In addition Tjin Tham Sijn et al., found that, for BxPC-3 tumor-bearing mice, the optimal circulating concentration of endostatin to achieve anti-tumor effects was between 126–175 ng/ml, but that therapeutic efficacy was lost at higher endostatin dosages, where circulating concentrations were increased to 580 ng/ml (Tjin Tham Sjin et al. 2006). These data suggest that endostatin displays maximal anti-tumor effects only when circulating concentrations are within a low dose range.
4.2 Clinical relevance of the U-shaped dose-response to endostatin
The observation of a U-shaped dose-response curve for the antitumor efficacy of endostatin may explain some clinical observations with this agent. Davis and co-workers examined angiogenesis markers, i.e. tumor microvessel density and endothelial cell apoptosis, in tumor biopsies obtained from patients before and after endostatin therapy in a phase 1 trial (Davis et al. 2004). Although this was a retrospective study which only incorporated data from 17 patients, the authors were able to conclude that the anti-angiogenic activity of endostatin was more pronounced in patients treated with an endostatin dose of around 250 mg/m2, whereas anti-angiogenic activity tended to be less apparent in patients treated with lower or higher doses of endostatin (Davis et al. 2004). Moreover, a study that used PET scanning to measure tumor blood flow also showed that there may be a U-shaped relationship between endostatin dose and inhibition of angiogenesis in patients (Herbst et al. 2002). These studies suggest that the anti-angiogenic activity of endostatin in humans may indeed be U-shaped.
Another curious clinical observation that might be explained by the U-shaped dose-response to endostatin comes from numerous studies that have correlated elevated levels of endostatin with a poorer prognosis. For example, renal cancer patients who showed an increase in circulating levels of endostatin after nephrectomy had a significantly poorer prognosis than patients without such an increase (Feldman et al. 2002). In fact, when Clamp and Jayson reviewed 14 studies that examined the relationship between circulating endostatin and prognosis, they found that whilst 5/14 studies demonstrated no relationship, a staggering 8/14 studies correlated raised serum endostatin with a poorer prognosis, whilst only one study correlated raised serum endostatin levels with a better prognosis (Clamp and Jayson 2005). Given that endostatin is anti-angiogenic, it is puzzling to see that elevated endostatin levels are associated with a poorer prognosis. However, one possible explanation is that the anti-angiogenic and anti-tumor effect of endostatin is U- or J-shaped. Under those circumstances, elevated serum endostatin levels would not be beneficial and only serum endostatin levels within an appropriate low dose therapeutic window would confer a better prognosis. Collectively, these findings provide clinical evidence that the anti-angiogenic activity of endostatin in patients is U-shaped.
Importantly, a phase 1 trial of endostatin was designed without prior knowledge of this U-shaped dose-response curve and adopted the usual method of dose-escalation in order to determine toxicity and efficacy (Eder et al. 2002). In a subsequent phase 2 trial, endostatin was typically dosed at levels that resulted in circulating concentrations of endostatin exceeding 100 ng/ml (Kulke et al. 2006). Importantly, significant antitumor effects were rarely observed in these trials. Based on the data I have discussed herein, it is intriguing to speculate that the lack of efficacy observed with endostatin may have occurred because patients received a dose of endostatin that was, in many cases, too high to be beneficial.
4.3 Clinical challenges associated with the U-shaped dose-response to endostatin
How could these observations guide future attempts to use endostatin as an anti-angiogenic agent? The U-shaped dose-response to endostatin suggests that the efficacy of endostatin therapy is likely dependant on baseline circulating endostatin levels. Circulating levels of endogenous endostatin in healthy subjects vary between individuals and lie in the range 10–50 ng/ml in serum and 40–100 ng/ml in plasma. Moreover, circulating levels of endostatin in cancer patients can increase above baseline levels by two-fold or more (Feldman et al. 2000; Feldman et al. 2002; Ohlund et al. 2008). It would therefore be extremely important to measure base-line circulating endostatin levels before and during therapy to establish the optimal dose of endostatin to be administered. A patient with low, sub-therapeutic levels of circulating endostatin might benefit from endostatin therapy if this shifts their circulating levels into the therapeutically active low dose range (Fig. 2a). However, a patient with higher circulating levels of endostatin may not benefit from endostatin therapy if this shifts their circulating endostatin concentration to a higher level, that is beyond the therapeutically active low-dose range (Fig. 2b). Moreover, if the patient demonstrates circulating endostatin levels that far exceed the therapeutic range, the U-shaped dose-response curve suggests that it may in fact be more desirable to suppress circulating levels of endostatin in these patients rather than augment it by administration of endostatin (Fig. 2c).

Clinical relevance of the U-shaped dose-response to endostatin. This figure illustrates the potential relevance of the U-shaped dose-response for anti-angiogenic therapy with endostatin. (a) A patient with baseline low levels of circulating endostatin (black dot) might benefit from endostatin therapy if this shifts the circulating endostatin levels into the therapeutically active low dose window (white dot). (b) A patient with baseline mid-range circulating levels of endostatin (black dot) might not benefit from endostatin therapy if the administration of endostatin shifts the circulating plasma concentration to a higher level (white dot) that is beyond the therapeutic window. (c) A patient with very high baseline circulating endostatin levels (black dot) might actually benefit from measures designed to reduce circulating levels of endostatin (white dot).
The existence of a U-shaped curve also suggests that continuous infusion of endostatin at a constant dose might be more effective than administration of the drug as a bolus. Interestingly, it has been shown that continuous delivery of endostatin to mice using osmotic minipumps is more effective in inhibiting pancreatic tumor growth than daily bolus injections (Kisker et al. 2001; Capillo et al. 2003). Although the reasoning for this is unknown, an attractive explanation for this finding is that whilst bolus administration of endostatin results in exposure of the tumor to a broad range of endostatin concentrations, continuous infusion may maintain circulating endostatin levels within a low dose range that is therapeutically active.
5. THE INTEGRIN INHIBITOR ATN-161
5.1 Pre-clinical evidence for the U-shaped dose-response to ATN-161
ATN-161 is an integrin inhibitor based on an amino acid sequence (PHSRN) found within the ‘synergy region’ of the integrin ligand fibronectin. However, in the ATN-161 peptide, the naturally occurring arginine is replaced with a cysteine i.e. PHSCN. The compound shows anti-tumor and anti-angiogenic activity in vivo (Livant et al. 2000; Stoeltzing et al. 2003; Khalili et al. 2006). In a more recent study, the antiangiogenic activity of ATN-161 in vivo was shown to be U-shaped with maximal anti-angiogenic activity observed when mice were administered the drug at 1 or 5 mg/kg/day, with loss of activity at ≥ 10 mg/kg/day doses and beyond (Donate et al. 2008). There is no published mechanistic data to explain why a U-shaped dose-response curve is observed with ATN-161.
The finding that the integrin inhibitor ATN-161 exhibits a U-shaped dose-response curve is particularly interesting, since this would appear to contradict findings that RGD-mimetic integrin inhibitors, such as cilengitide, exhibit the opposite shape of curve i.e. a bell-shaped dose-response curve (Reynolds et al. 2009). However, it is important to note that ATN-161 and cilengitide differ, both in terms of the types of integrin they bind to and the mechanism via which they inhibit the integrins. Firstly, whilst cilengitide is a relatively selective inhibitor of αvβ3-integrin and αvβ5-integrin (Dechantsreiter et al. 1999; Perron-Sierra et al. 2002), ATN-161 interacts instead with αvβ3-integrin and α5β1-integrin (Donate et al. 2008). Secondly, cilengitide inhibits cell adhesion by competing for binding of the integrin to the RGD-sequence contained in many natural integrin ligands, including fibronectin and vitronectin. In contrast, the ATN-161 peptide is not an RGD-competitive compound and is proposed to inhibit integrin activation by forming a disulphide bridge with a key cysteine residue involved in conformational activation of the integrin (Donate et al. 2008). The existence of these differences may account, at least in part, for the radically different dose-response curves observed with cilengitide and ATN-161.
5.2 Clinical relevance of the ATN-161 U-shaped dose-response
Testing of ATN-161 in a phase 1 trial showed that this compound has anti-tumor activity in patients (Cianfrocca et al. 2006). As Donate and colleagues point out, the presence of a U-shaped dose-response curve presents a significant challenge for effective dosing with ATN-161 in phase 2 trials that are ongoing (Donate et al. 2008). However, the timely discovery of the U-shaped dose-response curve means that this can be accounted for in the design of phase 2 trials, an advantage that was not afforded to endostatin.
6. THROMBOSPONDIN-1
6.1. Evidence that thrombospondin-1 exhibits bell-shaped and U-shaped dose-responses
The thrombospondins are a family of high molecular weight (420–520 kDa) extracellular matrix glycoproteins (Zhang and Lawler 2007). The anti-angiogenic activity of thrombospondin-1 (TSP-1) may occur via several mechanisms, including inhibition of endothelial cell migration, induction of endothelial cell apoptosis and altered regulation of growth factors, cytokines, nitric oxide and proteases that regulate the process of angiogenesis (Zhang and Lawler 2007). However, TSP-1 has also been associated with pro-angiogenic effects (Taraboletti et al. 2000). Two recent papers illustrate that the response of endothelial cells to TSP-1 is bell-shaped. Whilst TSP-1 concentrations of ≥ 50 g/ml and above inhibited endothelial cell migration, concentrations in the range 0.1–10 g/ml TSP-1 resulted in enhanced endothelial cell migration (Motegi et al. 2002; Motegi et al. 2008). Importantly, the expression of TSP-1 in human tumors is very heterogeneous, with concentrations ranging from 17.4 to 23,400 g of TSP-1 per gram of cytosol protein reported in human breast carcinoma (Pratt et al. 1989). As Motegi and colleagues point out (Motegi et al. 2008), pathological examination of human tumors has lead to conflicting reports relating TSP-1 expression to tumor angiogenesis and patient prognosis. Whilst some reports demonstrate that TSP-1 expression is correlated with angiogenesis inhibition and a better prognosis (Yao et al. 2000; Mehta et al. 2001; Kishi et al. 2003; Macluskey et al. 2006) other studies report that TSP-1 expression is correlated with increased angiogenesis and a poorer prognosis (Kasper et al. 2001; Straume and Akslen 2001). The finding that TSP-1 exhibits a bell-shaped curve with respect to angiogenesis inhibition provides a possible explanation for these apparently conflicting findings (Motegi et al. 2008).
In contrast, other studies have shown that the angiogenic response to TSP-1 is U-shaped. Tolsma and colleagues showed that although TSP-1 can inhibit FGF2-stimulated angiogenesis in vivo, the response to TSP-1 in vitro within an FGF2-stimulated endothelial cell migration assay was markedly U-shaped (Tolsma et al. 1993). Likewise, another study showed that whilst TSP-1 could inhibit tumor growth in vivo, FGF2-stimulated endothelial cell migration was U-shaped with respect to TSP-1 concentration (Miao et al. 2001). However, this may be a property that is unique to the intact TSP-1 molecule and might not be displayed by sub-fragments of TSP-1, because a peptide corresponding to a 50/70 kDa central portion of TSP-1 inhibited endothelial migration to FGF2 without showing a U-shaped dose-response (Tolsma et al. 1993). This 50/70 kDa peptide corresponded to a region containing the TSP-1 type 1 and TSP-1 type 2 repeats of the molecule.
6.2 Clinical relevance for anti-angiogenic therapy with thrombospondin-1
The bell-shaped and U-shaped dose-responses to TSP-1 may have consequences for anti-angiogenic therapy. Recombinant TSP-1 and peptide fragments of TSP-1 have been shown to inhibit tumor growth and angiogenesis in pre-clinical models. The active peptide fragments are based on sequences contained in the TSP-1 type 1 repeat region located in the middle portion of TSP-1 and include the peptides denoted 3TSR and ABT-510 (Zhang and Lawler 2007). In particular, ABT-510 is being tested in clinical trials, but to date has shown little activity when administered as a single agent in phase 2 trials (Ebbinghaus et al. 2007; Zhang and Lawler 2007; Baker et al. 2008). Given that both bell-shaped and U-shaped dose-responses have been observed with TSP-1, it will be important to test the angiogenic response to these peptides at a broad range of concentrations to elucidate whether these peptides can also elicit similar effects.
Interestingly, it has been shown that continuous delivery of 3TSR to mice using osmotic minipumps is more effective in inhibiting tumor growth than daily bolus injections (Zhang et al. 2007). Although the reasoning for this is unknown, a possible explanation for this finding is that whilst bolus administration of 3TSR results in exposure of the tumor to both angiogenesis promoting and inhibiting concentrations, continuous infusion may maintain plasma 3TSR levels at a concentration that is exclusively in the angiogenesis-inhibitory zone.
7. THE POTENTIAL RELEVANCE OF BELL-SHAPED AND U-SHAPED RESPONSES FOR VEGF-MEDIATED VASCULARIZATION AND THERAPEUTIC INHIBITION OF THE VEGF PATHWAY
VEGF plays a key role in both developmental vascularization and tumor angiogenesis. Moreover, as already mentioned, the most successful anti-angiogenic agents applied thus far in the clinic are the VEGF pathway inhibitors, such as the VEGF-neutralising antibody, bevacizumab, or the VEGF receptor tyrosine kinase inhibitor, sunitinib. To the best of this author's knowledge, there is currently little published evidence to show that VEGF pathway inhibitors exhibit a bell-shaped, U-shaped or J-shaped dose-response. However, here I will discuss some anecdotal observations that may point to the relevance of hormesis for the process of VEGF-mediated vascularization and agents that target the VEGF pathway.
7.1 Developmental angiogenesis
Studies in mice in which VEGF has been genetically deleted or over-expressed suggest that, during embryonic development, the dose of VEGF required for development of a normal vasculature may be bell-shaped. Deletion of both alleles of the VEGF gene results in embryonic lethality due to severe vascular defects (Ferrara et al. 1996) illustrating the essential function of VEGF for the development of the embryonic vasculature. Moreover, surprisingly, deletion of just one VEGF allele in mice also results in embryonic lethality due to vascular defects (Carmeliet et al. 1996). This is highly unusual, as deletion of one allele rarely gives rise to such a severe phenotype. Moreover, over-expression of VEGF in mice at a level that is 2–3 fold that of normal levels also results in embryonic lethality due to vascular defects (Miquerol et al. 2000). Combined, these data suggest that VEGF levels need to be tightly controlled for normal vascular patterning during embryonic development. Too little VEGF or too much VEGF results in failure to form a functional vasculature. In a sense then, VEGF expression during development exhibits a bell-shaped curve with respect to successful formation of a functional vasculature (Fig 3a).

Hormetic dose-response relationships for VEGF-induced vascularization and VEGF pathway inhibition. (a) Studies examining the relationship between the expression level of VEGF and the development of a functional vasculature in mice suggest the existence of a bell-shaped dose-response curve. Low expression of VEGF is insufficient to induce the formation of a functional vasculature, whilst over-expression of VEGF induces the formation of a dysfunctional vasculature. (b) The concept of vascular normalization may be depicted in the form of a bell-shaped dose-response curve. Low doses of inhibitor may be insufficient to normalise the vasculature, whilst higher doses of inhibitor may lead to excessive destruction of the vasculature and loss of vascular normalization. (c) A trade-off between maximising therapeutic effects and minimising adverse effects can be depicted with a U-shaped curve. Inhibition of tumor growth is assumed to correlate with increasing drug dose exposure (blue line). However, adverse effects are also assumed to correlate with increasing dose exposure (red line). According to this model, the optimal dose is found at the base of the U-shaped curve (marked by the black circle). In contrast, lower or higher doses (marked by white circles) are less optimal.
7.2. Vascular normalization
The tumor vasculature is chaotic and dysfunctional (Jain 2001; Jain 2005). This may be a direct consequence of excessive production of VEGF in the tumor microenvironment, as suggested by the bell-shaped dose-response to VEGF observed in studies of the effect of VEGF dosage on vascular development (see Section 7.1). Based on this assumption, it might be assumed that administering a low dose of VEGF pathway inhibitor could potentially improve tumor vascularization and actually promote tumor growth. However, no evidence for such a phenomenon has so far been presented.
In fact, improvements in tumor vascularization have been suggested as a desirable consequence of VEGF pathway inhibition. Rakesh Jain and co-workers have demonstrated that VEGF inhibition can, at least transiently, improve the quality of the tumor vasculature (so-called ‘vascular normalization’) that in turn may lead to improved drug penetration into tumors (Jain 2001; Jain 2005). This may explain why the combination of bevacizumab with chemotherapy can be more beneficial than chemotherapy alone (Hurwitz et al. 2004; Sandler et al. 2006; Miller et al. 2007). However, Jain has also pointed out that continued repetitive administration of anti-angiogenic therapy may result in over-destruction of the vasculature, with resulting reduced vascular function, which would actually impede the efficacy of co-administered therapy (Jain 2005). Theoretically therefore, to achieve successful vascular normalization, a low dose of VEGF pathway inhibitor might be more effective than a higher dose. In a sense then, the inhibition of VEGF signalling with respect to vascular normalization may exhibit a bell-shaped relationship (Fig 3b).
7.3 A U-shaped curve could be relevant for the optimal dosing of VEGF pathway inhibitors
Administration of VEGF-signalling inhibitors has been linked to several undesirable side effects. Therapy-associated toxicities observed in patients include hypertension, fatigue, proteinuria, thromboembolic events, bleeding, cardiac toxicity, lymphopenia, neutropenia, woundhealing complications and gastrointestinal perforations (Hutson et al. 2008; Blowers and Hall 2009). Moreover, recent data obtained in mice suggest that inhibitors of the VEGF pathway may induce damage to the vessels of normal organs (Kamba and McDonald 2007) and promote increased tumor invasion and increased tumor metastasis (Ebos et al. 2009a; Ebos et al. 2009b; Paez-Ribes et al. 2009). In general, the efficacy of VEGF-targeted therapy is considered to increase with the dose administered, therefore VEGF pathway inhibitors are generally administered at the maximum tolerated dose. However, if the above listed adverse side effects are assumed to increase in severity with increasing dose of drug, then it may be preferable to administer lower doses. Therefore, the most suitable dose of VEGF-targeted agent may be a trade-off between using a dose that is sufficient to achieve anti-tumor efficacy, without inducing undesirable side effects. Therefore, a U-shaped curve might be relevant to the optimal dosing of VEGF-targeted therapy (Fig 3c).
Is there evidence to suggest that lower doses of VEGF-targeted agents are more successful in the clinic than higher doses? One phase 2 study of bevacuzimab observed that response rates, progression free survival and overall survival were all more favourable in metastatic colorectal cancer patients treated with a lower dose of bevacizumab than patients treated with a higher dose (Kabbinavar et al. 2003). If a lower dose of bevacizumab is more effective than a higher dose, then this might suggest the existence of a U-shaped dose-response curve. However, a subsequently published phase 2 study in patients with non small cell lung cancer showed that a greater benefit was observed in patients treated with a higher dose of bevacizumab compared to a lower dose of bevacizumab (Johnson et al. 2004). A recently published meta-analysis that examined the relationship between drug exposure and outcomes in patients treated with sunitinib found that increased exposure to sunitinib is associated with improved clinical outcomes, but also some increased risk of adverse effects (Houk et al. 2009). Importantly, the standard dose of sunitinib is 50 mg per day, but dose reductions were required in approximately 30% of renal cancer patients treated with sunitinib in order to manage the significant toxicities of this agent (Motzer et al. 2007). On balance then, the available clinical data suggest that although the maximal therapeutic benefit of VEGF-targeted therapy is probably correlated with a higher dose exposure, it may sometimes be advantageous to use lower doses in some patients.
7.4 Consequences for potential stimulation of tumor growth by low doses of VEGF pathway inhibitors
As alluded to earlier, it has been reported that several molecules displaying anti-angiogenic activity at high doses may actually be able to stimulate angiogenesis at lower doses (see Section 2.2). There is currently no published data demonstrating that low doses of VEGF pathway inhibitors can stimulate angiogenesis or tumor growth. However, if subsequent work shows that low doses of VEGF pathway inhibitors can promote tumor growth, what would be the consequences for therapy with these agents? Tyrosine kinase inhibitors (TKIs) designed to inhibit VEGF receptor signalling (e.g. sunitinib) are often administered in a discontinuous fashion to patients. For example, sunitinib is commonly administered in a 6 week cycle, where the patient takes the drug every day for 4 weeks, followed by a 2 week drug-free period (Motzer et al. 2007; Burstein et al. 2008). It has been reported that rapid resumption of tumor growth can occur in patients during the 2 week drug-free period in the clinic (Burstein et al. 2008). It is likely that this break in therapy is also accompanied by a gradual drop in circulating concentrations of sunitinib. If these low concentrations can promote tumor growth, then this could potentially stimulate tumor re-growth during the break period. Importantly, it is known that rapid vascular regrowth can occur in mouse tumor models upon withdrawal of a TKI (Mancuso et al. 2006). It is possible that this vascular regrowth is just a consequence of removing the inhibitor. However, if low doses of TKIs can indeed promote tumor angiogenesis, then this could fuel rapid resumption of tumor growth during the break period. Therefore, the effect of low TKI doses on angiogenesis needs to be addressed. In the case that low doses of TKIs can promote angiogenesis, then the dosing regimen for such TKIs may need to be reviewed.
8. EVIDENCE FOR HORMESIS IN METRONOMIC CHEMOTHERAPY
Conventional therapeutic strategies for cancer have been dominated by the use of cytotoxic agents, which are typically DNA damaging agents (e.g. cisplatin), anti-metabolites (e.g. 5-fluorouracil) or microtubule disrupting agents (e.g. paclitaxel) that are designed to kill rapidly dividing cancer cells. These drugs are also toxic to other cell types and can lead to unpleasant side effects, such as myelosuppression, fatigue and nausea, and must be administered at a dose that avoids life-threatening toxicity. For this reason, they are typically administered once per week for several weeks at the maximum tolerated dose, followed by a break of several days or weeks, before resumption of therapy.
In a landmark study, Browder and colleagues showed that daily low dose administration of the chemotherapy agent cyclophosphamide results in inhibition of tumor growth due to anti-angiogenic effects (Browder et al. 2000). Similar studies showed that other chemotherapeutic agents, including vinblastine and paclitaxel, can also inhibit tumor growth due to anti-angiogenic effects when administered frequently at low doses (Klement et al. 2000; Klement et al. 2002). This approach, known as metronomic chemotherapy, has shown promising results in clinical trials (Kerbel and Kamen 2004; Emmenegger and Kerbel 2007). The approach also has the advantage that toxicities associated with higher doses of chemotherapy are avoided.
Interestingly, two papers from Albertsson and co-workers suggest that some chemotherapy agents might actually promote angiogenesis at low doses. These authors found that although continuous low dose administration of cyclophosphamide or paclitaxel was anti-angiogenic, continuous low-dose administration of 5-fluorouracil or cisplatin could sometimes promote VEGF-A mediated angiogenesis, an effect that was not observed when 5-fluorouracil or cisplatin compounds were administered at higher doses (Albertsson et al. 2008; Albertsson et al. 2009). The angiogenic response to 5-fluorouracil or cisplatin may therefore be bell-shaped. It is important to note that these experiments were performed using a rat mesentery assay of angiogenesis and effects on tumor growth and tumor angiogenesis were not examined. However, these findings do suggest that not all chemotherapy drugs may be suitable for metronomic chemotherapy in patients.
9. FUTURE DIRECTIONS
I have reviewed some of the data demonstrating that hormesis is relevant for angiogenesis and anti-angiogenic therapy. It is clear that whilst hormesis appears frequently in the angiogenesis literature, it is a poorly understood phenomenon that creates certain challenges for effective anti-angiogenic therapy. In the following section, I will summarise how the problem of hormesis might be approached in the future.
9.1 Selection of anti-angiogenic agents at the research and development stage
There is great interest in the development of novel, anti-angiogenic agents (Folkman 2007). The knowledge that anti-angiogenic agents can display hormetic properties has implications for the selection of suitable anti-angiogenic agents at the research and development stage, prior to entry into the clinic. Potential novel anti-angiogenic agents should therefore be screened in suitable assays at a wide range of doses to examine for the existence of hormetic properties. Agents that display dramatic hormetic properties could then be excluded from clinical development, in preference for agents that display little or no hormesis. Alarmingly, a recent study that examined the dose-response to a library of anticancer agents in a high throughput assay format demonstrated that more potent compounds (i.e. compounds with a lower IC50) were also more likely to exhibit stimulatory effects on cell growth when present at lower concentrations (Nascarella and Calabrese 2009). Since compounds are often selected on the basis that they have a low IC50, this highlights the need to screen compounds for activity at a broader range of concentrations.
9.2 Implications for VEGF-targeted therapies
In this article I have postulated that hormesis may be relevant to the biology of VEGF and VEGF pathway inhibitors. However, at the time of writing, no single study has convincingly demonstrated hormetic responses to VEGF pathway inhibitors. In contrast, hormesis has been demonstrated convincingly for a number of angiogenesis inhibitors that have yet to be approved for therapeutic use in humans. Given the pitfalls associated with using agents that exhibit hormesis as therapeutic agents, it is tempting to speculate that the success of VEGF pathway inhibitors can be attributed, at least in part, to a lack of hormesis. That said, the survival benefit afforded by VEGF pathway inhibitors is still only measured in terms of months (Ebos et al. 2009b). I have discussed here how U-shaped and bell-shaped biology may be relevant for VEGF pathway inhibitors, but this is mostly speculation. Future studies may reveal whether hormesis is relevant for therapeutic inhibition of VEGF signalling and whether it is necessary to account for these effects in order to achieve a greater therapeutic index with these agents.
9.3 Dosing of anti-angiogenic agents
Anti-angiogenic agents are generally administered to patients as a bolus dose, either orally or intravenously. Importantly, repeated administration of a bolus results in fluctuating circulating concentrations of the agent due to drug metabolism (Fig 4a). For an agent that exhibits a hormetic dose-response, bolus dosing may not be an optimal method of drug administration. In the case of agents with a bell-shaped dose-response curve, although administration of a bolus dose can result transiently in a therapeutically active high concentration of drug shortly after administration, there will also be a period of time where the circulating levels of drug fall to a concentration range which is pro-angiogenic (Fig 4b). In the case of agents with a U-shaped or J-shaped dose-response curve, the drug concentration may be ineffective or even pro-angiogenic shortly after administration, with drug concentrations that have an antiangiogenic activity only being achieved at later time points (Fig 4c). This suggests that, in order to be most effective, such agents should be delivered in a way that either (a) maintains the circulating level of drug at a high concentration (in the case of agents with a bell-shaped dose response, Fig 4b) or (b) maintains the level of drug at a low concentration (in the case of agents with a U-shaped or J-shaped dose-response, Fig 4c).

Consequences of hormesis for administration of drugs as a bolus. (a) Repeated administration of a drug as a bolus results in fluctuating circulating concentrations of drug. (b) For an agent that exhibits a bell-shaped dose-response, this results transiently in a therapeutically active high concentration of drug shortly after administration (black shading), followed later by a period of time where the circulating levels of drug fall to a concentration range which may be detrimental, e.g. proangiogenic (red shading). This suggests that, in order to be most effective, agents that exhibit a bell-shaped response should ideally be delivered continuously at a high dose (grey dashed line). (c) For an agent that exhibits a U-shaped or J-shaped dose-response curve, the drug concentration may be ineffective or detrimental, e.g. pro-angiogenic, shortly after administration (red shading), with drug concentrations that are therapeutically active only being achieved at later time points (black shading). This suggests that, in order to be most effective, agents that exhibit a U-shaped or J-shaped dose-response should ideally be maintained at a constant level in the circulation (grey dashed line).
Interestingly, studies performed in pre-clinical models may provide support for this idea. There are numerous studies conducted in mice which show that maintaining a constant circulating dose of angiogenesis inhibitor (via continuous infusion of the agent) is more effective than administering the agent as a bolus, which results in fluctuating circulating concentrations (Morishita et al. 1995; Drixler et al. 2000; Kisker et al. 2001; Capillo et al. 2003; Kumar et al. 2007; Zhang et al. 2007). Importantly, several of the agents used in these studies, including endostatin (Kisker et al. 2001) and TSP-1 (Zhang et al. 2007), have been shown to exhibit bell- or U-shaped dose-response curves. This presents a possible explanation for the increased efficacy achieved when a constant circulating concentration is maintained i.e. it avoids exposure of the subject to low and high doses which may have potentially deleterious side-effects. There may, of course, be other explanations as to why administration of a constant dose level is more effective. Firstly, blood vessels may be fundamentally more sensitive to angiogenesis inhibitors when administered at a constant dose, due to some aspect of vascular biology that is not completely understood. For example, tumor blood vessels have been reported to rapidly re-grow upon withdrawal of anti-angiogenic therapy (Mancuso et al. 2006). It may be that by maintaining a constant dose of anti-angiogenic agent, such vascular re-growth is suppressed. Secondly, since angiogenesis inhibitors can have a short half-life in vivo, administration of the agent continuously might, in some cases, achieve a larger area under the curve (AUC) than bolus dosing. Since there is evidence for a positive correlation between AUC and anti-tumor efficacy for at least one type of anti-angiogenic agent (Houk et al. 2009), this may be another explanation for the greater efficacy observed when circulating concentrations are maintained at a constant dose level.
To the best of this author's knowledge, no clinical trial has ever compared administration of an anti-angiogenic agent as a bolus with administration of the same agent as a continuous infusion. Given the predominant observation that continuous dosing is more effective than bolus dosing in pre-clinical models, these different methods of dosing anti-angiogenic therapy should be compared in an appropriately designed clinical trial.
9.4 Using biomarkers to determine the optimal dose
Traditionally, anti-cancer agents are administered at the maximum tolerated dose in order to achieve maximum cancer cell kill. However, agents that display a U-shaped dose-response curve, such as endostatin or ATN-161, need to be administered at an optimal dose that is well below the maximum tolerated dose. This is challenging, but might be assisted by using a surrogate biomarker for anti-tumor efficacy. The existence of circulating endothelial cells is well documented and it has been suggested that these cells may represent a surrogate marker for the efficacy of anti-angiogenic therapy in humans (Bertolini et al. 2006; Strijbos et al. 2008). Encouragingly, Celik and colleagues demonstrated that a therapeutically active dose of endostatin in mice was correlated with a reduction in the numbers of circulating endothelial cells (Celik et al. 2005). Likewise, a therapeutically active dose of ATN-161 in mice was also correlated with a reduction in circulating endothelial cells (Donate et al. 2008). Therefore, measurement of circulating endothelial cells in patients might represent a suitable surrogate biomarker for effective dosing of agents displaying a U-shaped curve.
9.5 Combining anti-angiogenic agents with other therapeutic modalities
I have described how it is necessary to deliver the biologically active dose in order to achieve a therapeutic response with an agent that exhibits hormesis. However, the pitfalls associated with an agent that displays hormesis might also be overcome by administering the agent in combination with a second drug. In this case, the second drug would be selected on the basis that it counteracts the hormetic effects of the hormetic agent. In support of this, our recent work showed that the hormetic effects of an integrin inhibitor could be ablated by combination with a VEGF receptor inhibitor (Reynolds et al. 2009). Another study also showed that the combination of an integrin inhibitor with a VEGF receptor inhibitor gave rise to synergistic anti-tumor activity (Strieth et al. 2006). Importantly, the VEGF-inhibitor bevacizumab has shown efficacy when used in combination with chemotherapy, demonstrating that antiangiogenic agents can be effectively combined with other agents in the clinic. Research identifying the mechanisms of hormesis in angiogenesis may give rise to other rational strategies to combine anti-angiogenic therapies with other therapeutic modalities.
9.6 Molecular mechanisms of hormesis in angiogenesis
An area that has been largely unexplored is the understanding of how hormesis influences blood vessel formation at the molecular level. Whilst many studies report that anti-angiogenic agents have hormetic properties, few address the underlying biochemical mechanisms. Firstly, it is possible that binding of an anti-angiogenic agent to one receptor may mediate different outcomes at different doses by acting solely through that receptor. This may be especially true for integrins, which appear to play both a negative and positive role in angiogenesis (Hodivala-Dilke et al. 2003). In support of this, we showed that integrin inhibitors can elicit both pro- and anti-angiogenic effects by acting through the same integrin (Reynolds et al. 2009). Secondly, an anti-angiogenic agent may bind to two or more receptors, with one receptor mediating pro-angiogenic effects and the other mediating anti-angiogenic effects. This may be the case for certain growth factors, such as the TGF-β family of growth factors (Goumans et al. 2002). Thirdly, anti-angiogenic proteins, such as endostatin or thrombospondin, may contain both pro-angiogenic and anti-angiogenic sequences (Karagiannis and Popel 2007) and the balance of activity mediated by these different sequences may mediate the phenomenon of hormesis. These molecular mechanisms may have consequences for the control of blood vessel formation and the application of angiogenesis inhibitors in the clinic.
10. CONCLUSION
In conclusion, hormesis is relevant for angiogenesis and for therapeutic angiogenesis inhibition. The existence of hormesis presents a significant challenge for anti-angiogenic therapy. Continuing research into this phenomenon may lead to new insights, both for our understanding of the basic mechanisms of angiogenesis and for the application of antiangiogenic therapy in cancer patients.
Footnotes
ACKNOWLEDGMENTS
For their critical comments on the manuscript, I would like to thank Jack Lawler, Giannoula Klement, Michael Rogers and the anonymous referees. For research funding I would like to thank Breakthrough Breast Cancer.