
Abstract
Apoptosis induced in non-hit bystander cells is an important biological mechanism which operates after exposure to low doses of low-LET radiation. This process was implemented into a deterministic multistage model for in vitro neoplastic transformation: the State-Vector Model (SVM). The new model is tested on two data sets that show a reduction of the transformation frequency below the spontaneous level after exposure of the human hybrid cell line CGL1 to low doses of γ-radiation. Stronger protective effects are visible in the data for delayed plating while the data for immediate plating show more of an LNT-like dose-response curve. It is shown that the model can describe both data sets. The calculation of the time-dependent numerical solution of the model also allows to obtain information about the time-dependence of the protective apoptosis-mediated process after low dose exposures. These findings are compared with experimental observations after high dose exposures.
INTRODUCTION
Extensive efforts have been devoted to apply biomathematical models to investigate biological effects of ionizing radiation (Little 1995; Luebeck et al. 1999; Brenner et al. 2001; Nikjoo and Khvostunov 2003; Scott 2004; Schöllnberger et al. 2004, 2005, 2006). Such studies can be especially valuable in areas where it is still unclear which biological effects are the rate limiting mechanisms. Low dose exposure conditions represent such an area. Mathematical models allow to include different effects such as cellular defense mechanisms (Feinendegen and Pollycove 2001) and bystander effects which can be detrimental (Sawant et al. 2001; Morgan 2003a, 2003b; Belyakov et al. 2005) and protective (Barcellos-Hoff and Brooks 2001; Iyer and Lehnert 2002; Belyakov et al. 2005; Jürgensmeier et al. 1994a). The most recent reviews of bystander effects and related topics are by Barcellos-Hoff and Costes (2006), Chaudhry (2006), Brooks (2005), Mothersill and Seymour (2005, 2006) and Prise et al. (2005). These effects can be regulated during model simulations and data fitting. When the models are tested on data sets it is possible to gain an understanding which mechanisms might operate in the cells and between them to produce the data at hand. Ideally, the models can be used to predict new effects and, for low dose exposures, the form of dose-response relationships.
Recent years brought fascinating discoveries in this field such as adaptive responses measured by a single low dose of low-LET radiations that induce neoplastic transformation frequencies significantly below those induced spontaneously (Azzam et al. 1996; Redpath and Antoniono 1998; Redpath et al. 2001, 2003). The cell culture study by Azzam et al. (1996) was the first to show this in vitro effect of low doses of γ-radiation up to 100 mGy, a dose approximately 100 times larger than the yearly dose from environmental background low-LET radiation in the U.S. A dose of 100 mGy caused a statistically significant lower neoplastic transformation frequency per surviving cell (TFSC) than the spontaneous TFSC at 0 dose (Azzam et al. 1996). On the other hand manifold studies showed detrimental bystander effects (Nagasawa and Little 1999, 2002; Zhou et al. 2000; Morgan 2003a, 2003b). Such supralinear behavior typically means that the actual dose-response curve at low doses lies above a linear extrapolation from a higher dose to the origin. This paper describes how a protective apoptosis-mediated process (Jürgensmeier et al. 1994a, 1994b, Bauer 1996, Bauer 2000, Portess et al. 2007) is included into a biomathematical model for in vitro neoplastic transformation. The latter is an important biological endpoint that has been extensively investigated to assess the biological effects after radiation exposures (Little 1985, Hall and Hei 1985, Miller et al. 1979, 1995). The model is then tested on an important and representative data set (Redpath et al. 2001) that shows protective effects against neoplastic transformation after exposure of the nontumorigenic HeLa × skin fibroblast cell line CGL1 to low doses of γ-radiation.
The terms “detrimental” and “protective” as used in the current study refer to the endpoints analyzed here and not necessarily to carcinogenesis in humans. When we refer to protective effects seen in the transformation studies of Redpath et al. (2001), the limitations of in vitro cell transformation measurements need to be borne in mind when interpreting data for the purposes of radiological protection criteria (Mill et al. 1998). While it has been stated that the data for neoplastic transformation have uncertain implications for the question of the LNT model (NCRP 2001), other researchers point out the importance of this endpoint. Dr. R.E.J. Mitchel (personal communication) argues that if a cell in vivo is “near transformation” for whatever reason and would eventually develop into a cancer, and if radiation protects against and slows/reverses that process as demonstrated by Mitchel et al. (1999, 2002, 2003, 2004) and Mitchel (2006, 2007), that this would be critically important. With respect to bystander effects it is noted that when we here refer to detrimental aspects of this effect, it should be remembered that it is not yet clear whether at low doses bystander effects are predominately detrimental or protective with respect to cancer induction in humans (Belyakov et al. 2005).
MATERIALS AND METHODS
The Model
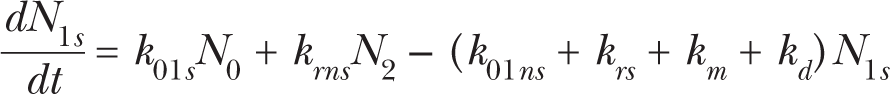
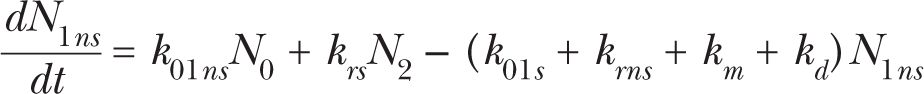
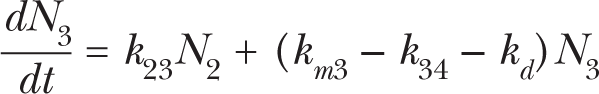
Fig. 1 shows a conceptual view of the State-Vector Model (SVM) (Crawford-Brown and Hofmann 1990). Differential equations can be derived from this scheme and are given in equations (1)–(6). A state vector denotes the fraction of cells in each of the states at time t:

Pictorial representation of the State-Vector Model. Cells in state 0 represent normal cells. The rate constants of DSB formation in specific transcriptionally active areas of the genome and in other inactive domains of DNA are denoted as k 01s and k 01ns , respectively. k 23 denotes the rate constant of DSB interaction and k 34 is the rate constant of damage fixation. State 4 cells are initiated and can be eliminated by a dose-rate independent protective apoptosis-mediated bystander effect (kap , dashed arrow) in addition to the dose-rate dependent pathway for necrotic cell killing (kd ). The mitotic rate constant is denoted as km (cell divisions per day). A fraction F of the initiated cells cycles at an elevated mitotic rate (kmp ). The rate constants for repair of DSBs in transcriptionally active and inactive DNA are represented by krs and krns , respectively. Cell-cycle associated postreplication repair (rate constant km ) is possible for cells in states 1s, 1ns, and 2.

Here, Ni (t) is the number of cells in state i at time t. It is NT (t) = N 0(t) + N 1s (t) + N 1ns (t) + N 2(t) + N 3(t) + N 4(t).


The rate constants kij (unit of time−1) denote transitions from state i to state j. The model describes a series of background (endogenous) and radiation induced events in the formation of in vitro neoplastic transformation. State 0 cells represent normal CGL1 cells. Cells in states 1s and 1ns contain a double strand break (DSB) in transcriptionally active and inactive DNA, respectively. The rate constants of DSB formation contain a background component (subscript b) that describes the formation of DSBs by endogenous influences and a radiation-induced component (subscript r): k 01s = k 01sb + k 01sr × DR and k 01ns = k 01nsb + k 01nsr × DR. Here, DR denotes the dose rate. Cells in state 2 contain both types of DSBs. The DSB repair pathways include a cell cycle independent contribution and a cell cycle associated contribution. Quiescent cells in state 1s can undergo repair with rate constant krs. Quiescent state 1ns cells can be repaired with rate constant krns. In the SVM DSB repair with a rate governed by the mitotic rate constant km is allowed for cells in states 1s, 1ns and 2 (Fig. 1). It is emphasized that despite its relation to km this repair mechanism is not active during mitosis but correlates with it, i.e. the higher the mitotic rate the higher the number of cells undergoing postreplication repair. All three repair mechanisms (krs, krns , and the cell cycle associated postreplication repair) represent homologous recombination (HR) and non-homologous end-joining (NHEJ). Each cell cycle associated repair produces two undamaged cells in state 0 (refer to eq. (1)).
The two DSBs in state 2 cells can interact with each other with rate constant k 23 (k 23 = k 23r × (DRb + DR)) and form chromosome aberrations such as translocations. Here, DRb denotes the dose rate from environmental background radiation. It was assumed that DRb = 1 mGy/yr. State 4 cells are said to be initiated and can no longer be repaired. The genomic damage is made permanent when state 3 cells undergo mitosis with rate constant k m3 = (1 – P 4) × km. Rate constant k 34 = P 4 × km. Here, P 4 denotes the probability per cell division that a state 3 cell develops into an unrepairable state 4 cell (Crawford-Brown and Hofmann 1990: P 4 = 5.10−4). A fraction F of the initiated cells can acquire a growth advantage (often referred to as “promotion”) after contact inhibition has been lost for these cells. They divide with an enhanced mitotic rate constant kmp = kmmult × km (Fleishman et al., submitted). This fraction can be calculated as the probability that 4, 5 or 6 dead cells are surrounding an initiated cell. It is assumed that then contact inhibition is lost (Crawford-Brown and Hofmann 1990). Cells in states 0, 1s, 1ns, 2, 3 and 4 can die with rate constant kd (kd = kdb + kdr × DR).
Many values of rate constants and parameters in the SVM can be taken from the literature such as krs = 80 day−1 (Mebust et al. 2002) and krns = 3.12 day−1 (Crawford-Brown and Hofmann 1990). Experimental evidence supports the use of a larger rate constant for the DSB repair in transcriptionally active DNA, compared to the repair in inactive DNA (Sak and Stuschke 1998, Broome et al. 1999). For CGL1 cells km = 1.2 day−1 (Mendonca et al. 1989; corresponding to a doubling time of 20 hours during exposure, the one day holding period and exponential growth), km = 0.026 day−1 during confluent growth with kdb = 0. This value for km is based on an analysis of the growth curve for CGL1 cells given in Mendonca et al. (1989). Based on earlier findings (Crawford-Brown and Hofmann 1990), the approximation k 01s = 0 is used and k 23r = 1 Gy−1. After approximately 10 days the cultures become confluent (Mendonca et al. 1989). For immediate plating the simulation ends at 25 + ET days where ET is the exposure time at the different doses (delayed plating: 26 days + ET). Survival data revealed that up to 1 Gy no significant cell killing occurred (personal communication Dr. J. Leslie Redpath). Therefore, kdr = 0. In all model fits and simulations of the Redpath et al. (2001) data F = 1 was used because the fraction of cells that has lost contact inhibition is 1, i.e. in all CGL1 cells there is no contact inhibition: they do not respond to contact inhibition signals and continue to divide (Stanbridge and Wilkinson 1978). Other cell lines, including C3H 10T1/2 cells, show contact inhibition when they enter plateau phase. Because no fraction of the CGL1 cells cycle at an elevated mitotic rate, kmmult was set to 1.
The data
The data by Redpath et al. (2001) show the TFSC versus absorbed dose in CGL1 cells irradiated with γ-rays (1 mGy to 1 Gy; the low doses were delivered at DR = 3.3 mGy/min). The data for delayed plating show a stronger protective effect (a reduction of the TFSC below the control level) than the data for immediate plating (Redpath et al. 2001). To fit these data we calculate for each dose

with tend = time point at the end of the experiment.
Apoptosis-mediated protective bystander effects
A series of well designed experiments (Höfler et al. 1993, Jürgensmeier et al. 1994a, 1994b, Langer et al. 1996, Eckert and Bauer 1998, Dormann and Bauer 1998, Dormann et al. 1999, Heigold et al. 2002; reviewed by Bauer 1996, 2000) showed that apoptosis can be induced in transformed cells via neighboring healthy cells. In an experimental tissue culture system the addition of exogenous TGF-β is required for maximal intercellular induction of apoptosis, but transformed cell-derived TGF-β is sufficient for induction of intercellular signaling (Bauer 2000). Two main pathways for the intercellular signaling between non-transformed and transformed fibroblasts have been identified: the hypochlorous acid/hydroxyl radical pathway (Fig. 2) and the NO/peroxynitrite pathway (Bauer 2000). Transformed cells release TGF-β and generate superoxide anions (O •− 2). TGF-β causes the release of peroxidase (a haem enzyme that catalyses the reduction of hydrogen peroxide) from normal cells. Superoxide anions from transformed cells spontaneously dismutate and form hydrogen peroxide (H2O2). The latter is used by the peroxidase together with chloride ions, which are present abundantly in biological fluids, to form hypochlorous acid (HOCl). HOCl interacts with superoxide anions to form hydroxyl radicals (•OH), which act as the ultimate apoptosis inducer. Because the range of action of O •− 2 is very small, the interaction of O •− 2 with HOCl is limited to the vicinity of the transformed cells and thus biases the selective apoptosis induction toward transformed cells only (Bauer 2000). The NO/peroxynitrite pathway is less complicated and is also depicted in Fig. 2.
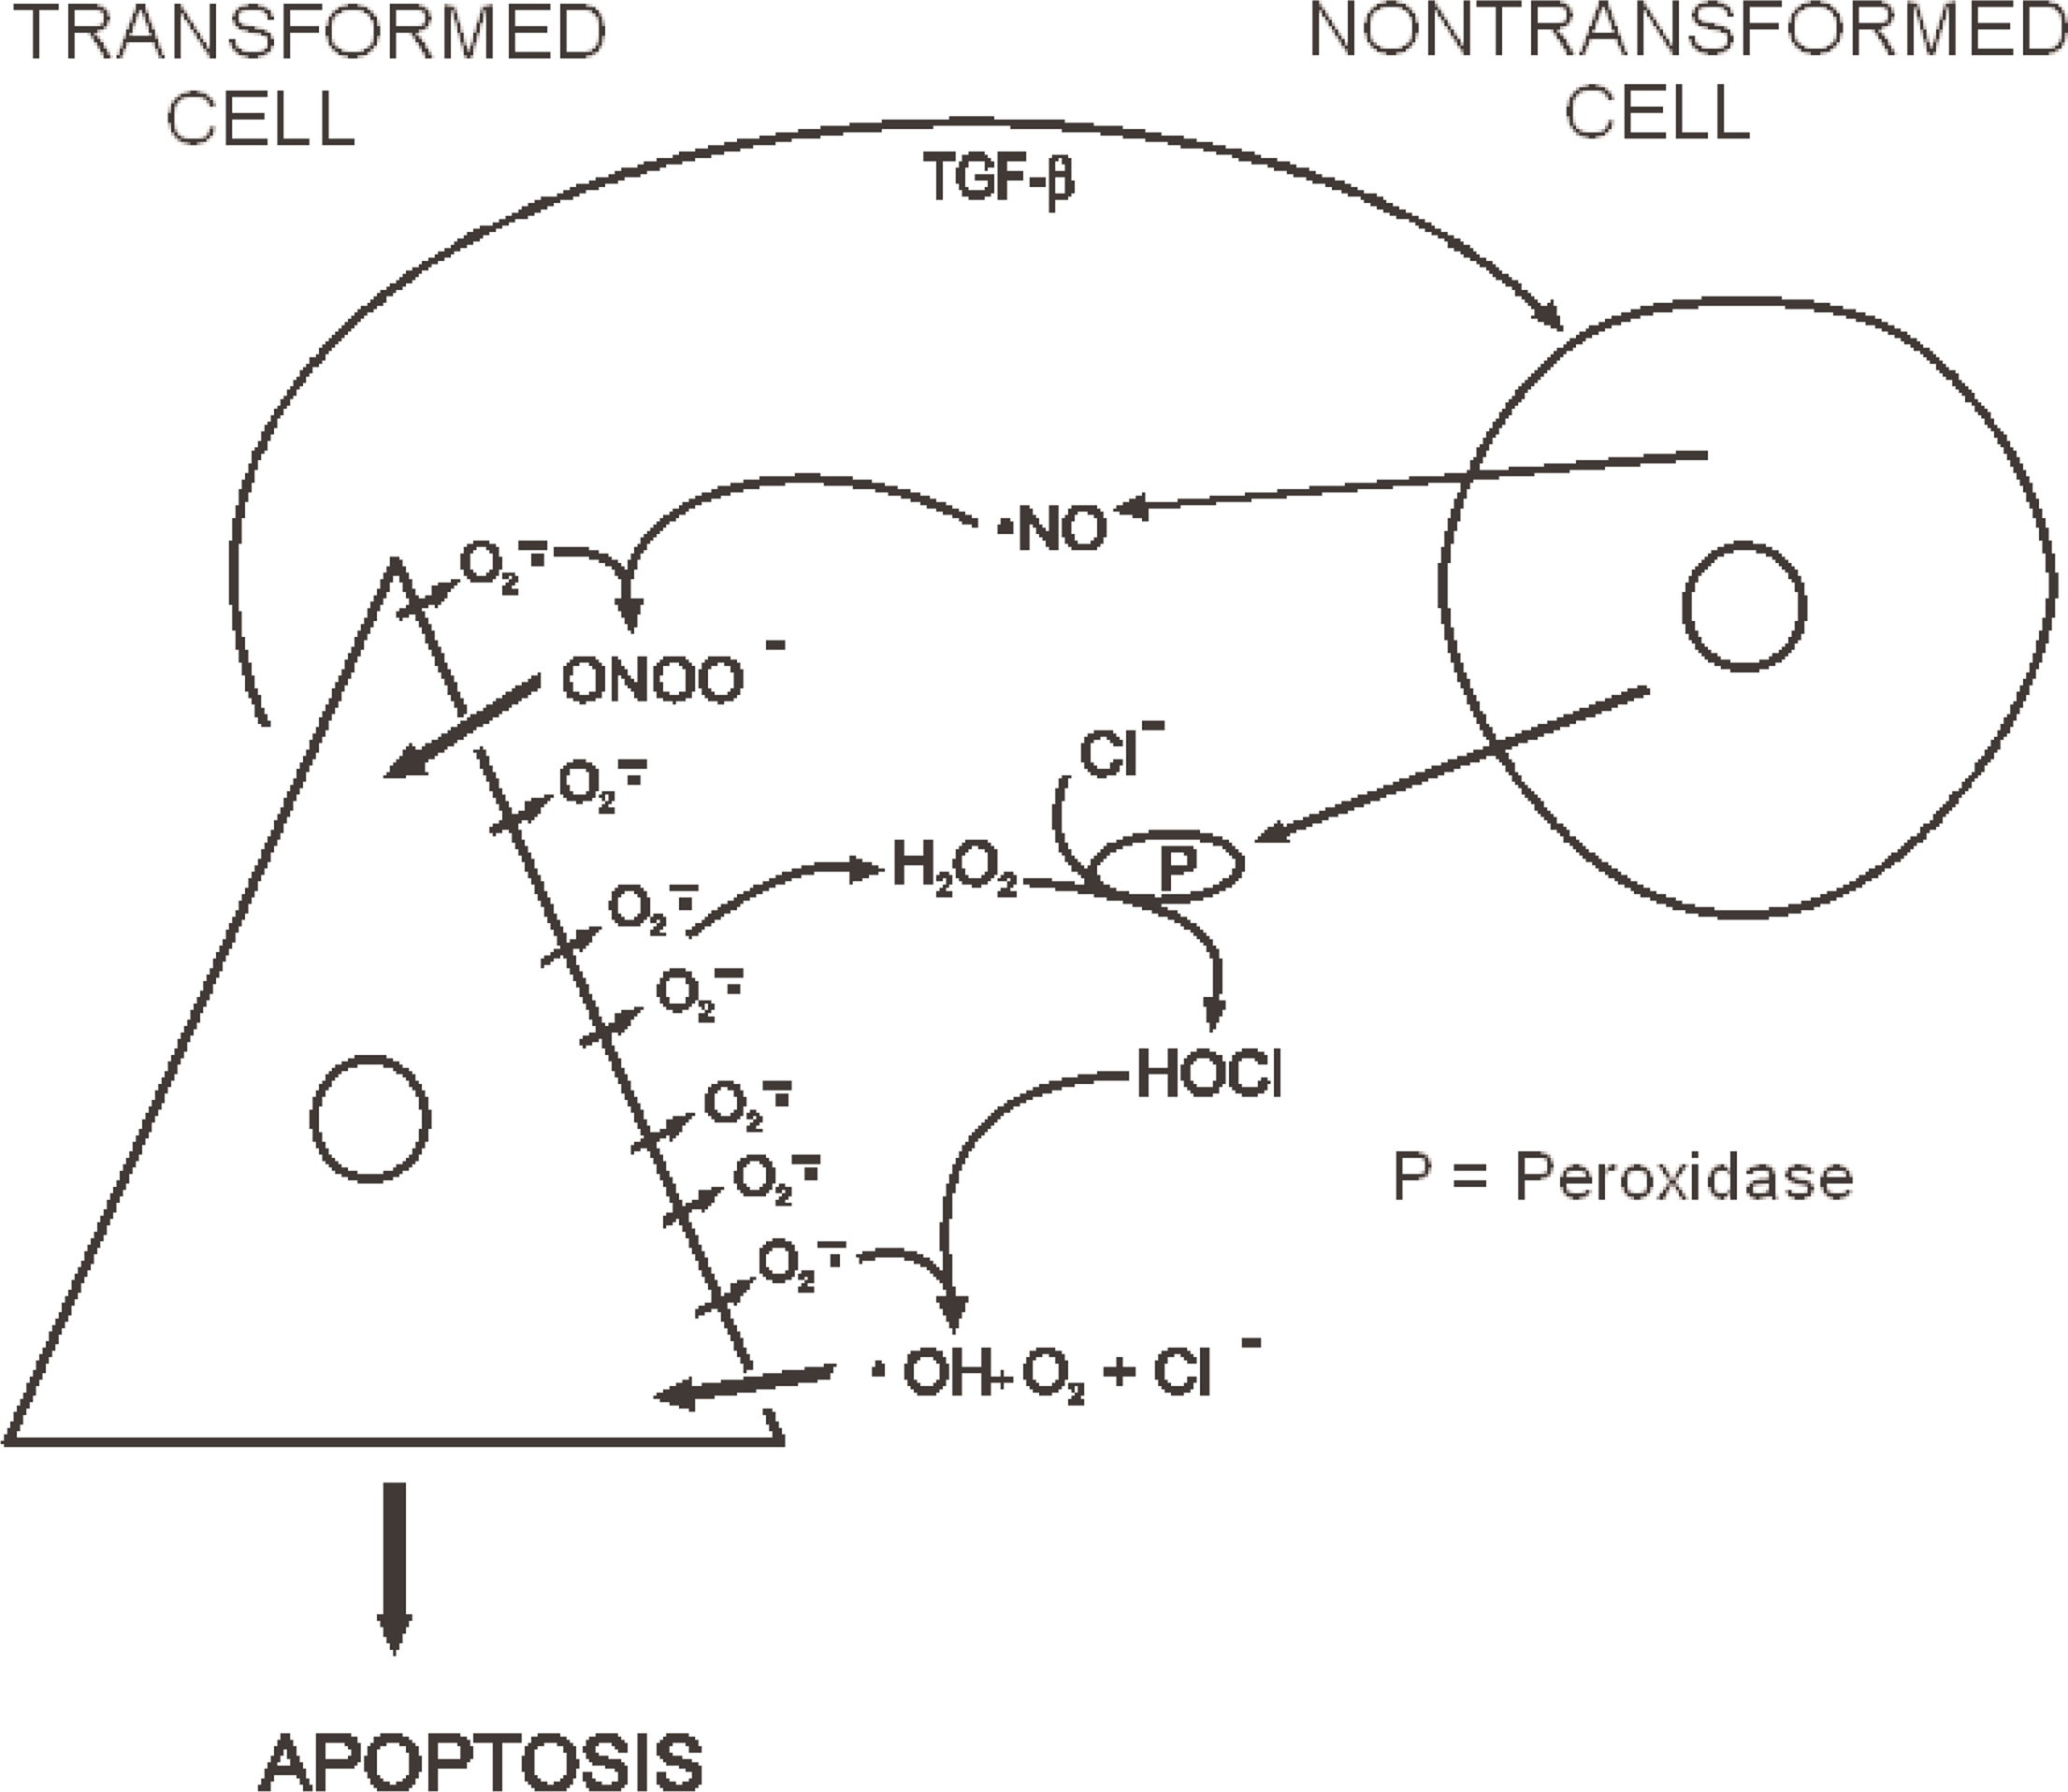
HOCl/hydroxyl radical and NO/peroxynitrite pathways as described by Bauer (2000). Refer to Materials and Methods section for details. Figure kindly provided by Dr. G. Bauer.
Experimental evidence also indicates that protective apoptosis-mediated [termed PAM by Scott et al. (2003)] effects can be induced by low-dose low- and high-LET radiation in non-hit bystander cells, whereby neoplastically transformed mammalian cells are eliminated by their non-transformed neighboring cells via intercellular, TGF-β mediated, induction of apoptosis (Portess et al. 2007). For brevity, the PAM process is here referred to as PAM. Evidence that bystander induced cell death can occur by apoptosis has been presented (Mothersill and Seymour 1997) and has been deepened over the years (Lyng et al. 2000, 2002a, 2002b, 2006; Maguire et al. 2005, Konopacka and Rzeszowska-Wolny 2006). A notable new development started with the use of microbeam irradiation of individual cells within explant outgrowth under in vivo-like conditions (Belyakov et al. 2002, 2003, 2005). These experiments further established apoptosis as a protective bystander-induced mechanism together with cell differentiation. Scott et al. (2003, 2004) and Scott (2004) have extensively reviewed aspects of apoptosis as a protective bystander effect.
To fit the data, a protective apoptosis mediated bystander effect was built into the model via rate constant kap (Fig. 1). The parameter kap governs the rate of commitment of initiated cells in state 4 to bystander-induced apoptosis. The unit for kap is time−1. The following assumptions are made with respect to the occurrence of this bystander effect (Schöllnberger et al., submitted):
PAM is effective at low doses only—no effect at doses ≥ 200 mGy
PAM can eliminate cells in state 4 (initiated)
kap = 0 at D = 0
PAM is activated by a dose of 1 mGy of low-LET radiation (based on the data by Azzam et al. (1996) and Redpath et al. (2001), (2003)) but becomes effective only after the exposure (Portess et al. 2007).
PAM is activated for various times after irradiation.
The Redpath et al. (2001) data show the transition between protection and detriment between 100 and 300 mGy (Fig. 3). Therefore, PAM was switched off (i.e. kap = 0) in the model fits at doses ≥ 200 mGy. Rate constant kap is currently modeled as dose-rate independent analogous to Scott et al. (2003) and Scott (2004).

TFSC versus dose for CGL1 cells irradiated with γ-radiation (Redpath et al. 2001). Error bars represent 95% confidence intervals. Panel A: control and high dose data for immediate and delayed plating and fit of the SVM without the protective apoptosis-mediated bystander effect (fit1). Panel B: data for immediate plating and SVM fit showing the three different contributions (– – – direct, …. bystander, —— total (fit2)). The direct contribution stems from a forward simulation of the model without PAM with parameter values from fit1. The contribution of the bystanders was calculated as the difference between the forward simulation and fit2. Panel C: data for delayed plating and SVM fit showing the three different contributions (– – – direct, …. bystander, —— total (fit3)). The inserts show the low-dose range with the x-axis units in Gy.
The model equations were numerically solved with a stiff solver (“ode15s”∗) of the Matlab® software package for the different phases of the irradiation experiments: exposure, one day holding period (for delayed plating data), exponential and confluent growth. The length of exposure times for the different doses and the different growth phases can be calculated based on information given in Redpath et al. (2001) and Mendonca et al. 1989. Data fitting was done with a grid search algorithm that allows searching the parameter space at a global level. Fine tuning was performed with the Nelder-Mead Simplex algorithm (Nelder and Mead 1965). The relative error,
RESULTS
At first, the model without PAM was fitted to the joint data for immediate and delayed plating at control and high doses (fit1, Fig. 3A). This joint fit allowed for more data points. The free parameters of fit1 included a background transformation rate f 4(0) within in the initial state vector: [1 – f 4(0), 0, 0, 0, 0, f 4(0)]. This means that prior to irradiation a fraction f 4(0) is already initiated. The values allowed for f 4(0) in the grid search ranged from 10−5 to 10−4. In addition, a damping factor (e −Λ decrD ) was applied to krs, krns , and the cell cycle associated repair (Schöllnberger et al., submitted).
A forward simulation of the full data set for immediate plating with parameter estimates from fit1 as fixed input was performed. This gave the “direct” contribution (Fig. 3B). Then the model with PAM was fitted to the data (fit2, “total” contribution). The data for delayed plating were analyzed analogously (fit3, Fig. 3C). In fit2 and fit3 three free parameters were applied: kap , the time point for the activation of PAM, denoted as tap_on , and the time point for the deactivation of PAM, tap_off. The best estimated values for the free parameters together with the relative errors are given in Table 1. The data for immediate plating show a lower protective effect than the data for delayed plating (Redpath et al. 2001). This is reflected in the fact that fit2 exhibits a shallower U-shape than fit3 and a smaller initial drop from 0 to 1 mGy (inserts in Figs. 3B and 3C). The best estimated value for PAM duration (tap_off – tap_on = 2.2 days) in fit2 is accordingly smaller than in fit3 with similar values for kap.
Best Estimates, Relative Errors and Variances for Model Fits of the Redpath et al. (2001) data.
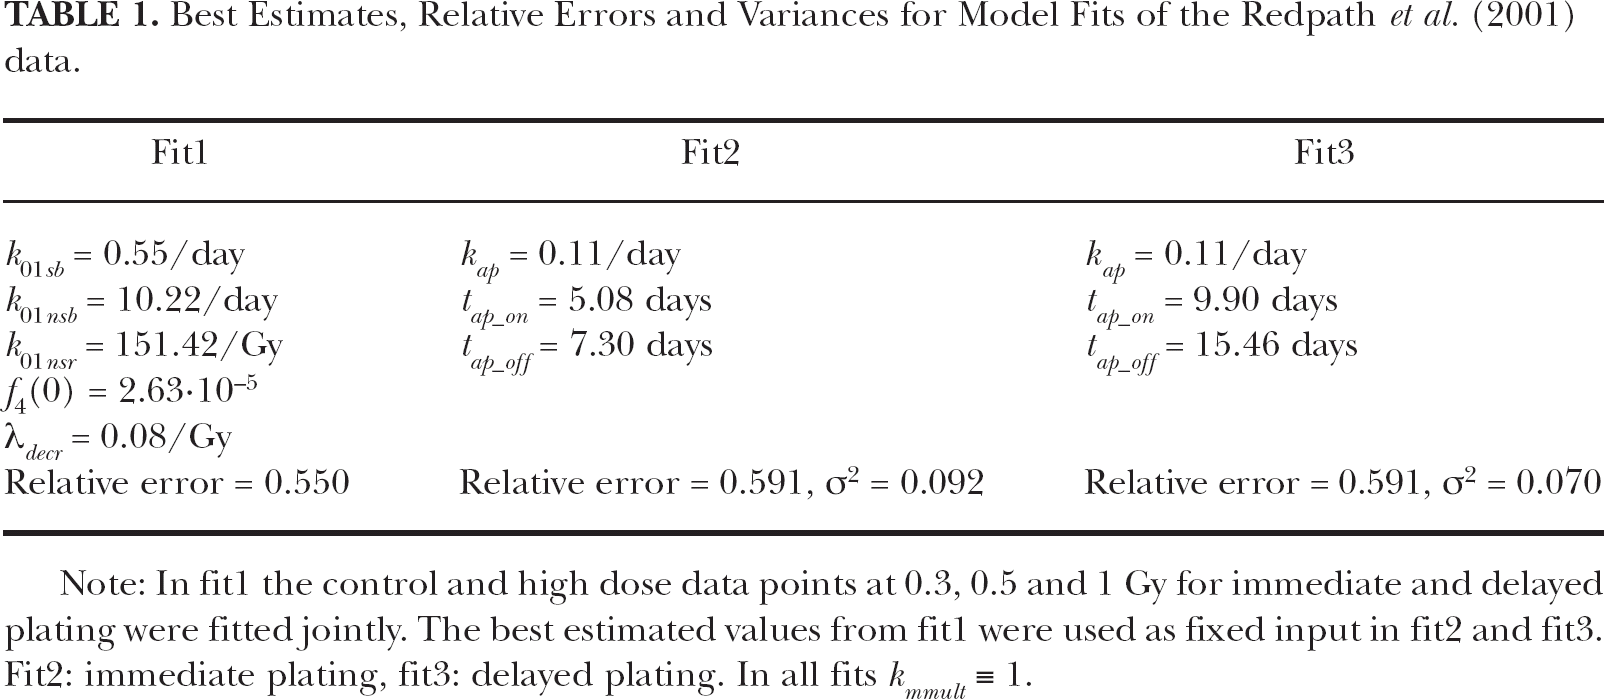
Note: In fit1 the control and high dose data points at 0.3, 0.5 and 1 Gy for immediate and delayed plating were fitted jointly. The best estimated values from fit1 were used as fixed input in fit2 and fit3. Fit2: immediate plating, fit3: delayed plating. In all fits kmmult ≡ 1.
DISCUSSION AND CONCLUSIONS
The SVM is biologically motivated as recently pointed out (Schöllnberger et al., submitted). It describes an important process in the formation of neoplastic transformation: chromosome aberrations, specifically, translocations and inversions (page 556 in Friedberg 1985). The repair pathways represent DSB repair in quiescent cells (krs and krns ) and cell cycle associated repair related to mitotic rate constant km. Despite its relation to km , the cell cycle associated repair does not occur during mitosis but represents a postreplication repair pathway. After the interaction of the two types of DSBs (which forms state 3 cells) the damage is made permanent when state 3 cells divide. Cells may resume cell cycle progression in the presence of unrepaired damage, a process called adaptation (Friedberg et al. 2006). In yeast is has been shown that such adaptation enhances survival, but at a price. Chromosome loss and translocations are elevated in the surviving clones (Galgoczy and Toczyski 2001). This is simulated in the SVM in a simplified way by applying a constant probability per cell division that a state 3 cell develops into an unrepairable mutated cell (state 4; refer to Materials and Methods section). The concept of unrepairable initiated cells is firmly established (Moolgavkar and Knudson 1981, Trosko et al. 1990). For the simulation of in vitro neoplastic transformation, the SVM then describes the clonal expansion of a fraction F of the initiated cells that have a decreased gap junctional intercellular communication (Trosko and Ruch 1998). For the fit of the Redpath et al. (2001) data F = 1 is used because the CGL1 cells show a lack of density-dependent inhibition of division (Stanbridge and Wilkinson 1978). The conclusions reached in the current study assume that the biological concepts and related model assumptions are valid.
Previous low dose studies with the SVM (Schöllnberger et al. 1999, 2002) focused on explaining a form of induced radio-resistance that might be visible in a plateau in the dose-response curve for neoplastic transformation of C3H 10T1/2 cells irradiated with acute doses of X-rays (Miller et al. 1979). Another data set applied by Schöllnberger et al. (1999) exhibits a plateau for chromosome aberrations induced by acute γ-irradiation of rat hepatocytes (Eckl et al. 1993). The plateaus were explained with radiologically inducible DSB repair and radical scavenging. Eckl et al. (1993) also pre-irradiated the cells with low doses. That led to reduced detrimental effects of the acute irradiations visible in lower dose-response curves for chromosome aberrations. We explained this more classical adaptive response with elevated background rates for repair and scavenging caused by the 2.5 mGy prime irradiation (Schöllnberger et al. 1999). In another study (Schöllnberger et al. 2002) the SVM was fitted to U-shaped data by Azzam (1994). This data set shows a U-shaped dose-response for neoplastic transformation in C3H 10T1/2 cells irradiated with γ-rays (0.1 – 5 Gy) at low dose rate (2.4 mGy/min). Together with another set of data (Azzam et al. 1996), this data set was explained by the model with radiologically enhanced repair rates and increased radical scavenging capacities of the irradiated cells (Schöllnberger et al. 2002).
The current study investigates whether a U-shaped dose response curve for neoplastic transformation can be explained with bystander-induced apoptosis. This follows earlier studies by Scott et al. (2003) and Scott (2004) and has recently been proposed by Portess et al. (2007). Clearly, the model can be successfully fitted to the data (Fig. 3). Both, the data for immediate and delayed plating can be explained. The SVM solution reflects the time dependence of Ni (t) (i = 0, 1s, 1ns, 2, 3, 4) in the formation of neoplastic transformation. Therefore, it can be used to estimate by data fitting the onset and cessation of PAM in addition to its rate kap. The current study predicts that in the cell culture experiments for delayed plating of Redpath et al. (2001) bystander-induced apoptosis is switched on at approximately 10 days postirradiation and that it ceases around day 15 (fit3, Table 1). This should be tested in an experiment.
The value found for the time span that PAM is activated, tap_off – tap_on , is approximately 5 days (fit3). This relatively long time is reflected in the scientific literature. Jamali and Trott (1996) report a two week induction of apoptosis after a 1 Gy X-irradiation at 0.5 Gy/min. Mendonca et al. (1999) showed that after a 7 Gy high dose X-irradiation apoptosis is switched on in CGL1 cells approximately 9 days postirradiation and switched off around day 15 to 18. The best estimated values of fit3 reflect these results. In another study only one free parameter, kap , was used (Schöllnberger et al., submitted). There, it was assumed that PAM is activated immediately after the exposure ended and that it is deactivated at the end of exponential growth, i.e. tap_off ≡ 11 days + ET. The best estimated value for kap was 0.054/day for delayed plating with a relative error of 0.642 (Schöllnberger et al., submitted). In fit3 kap = 0.11/day with an approximate 5 day time of PAM induction. This shows that kap and the time of PAM induction are inversely related to each other: a shorter time of PAM induction can compensate for a larger value of kap and vice versa. When two free parameters, kap and tap_off , were applied, the best estimated values were 0.025/day and 23.67 days, respectively (Schöllnberger et al., submitted). That confirms the inverse relation of kap and PAM induction. It is worth to mention that in fit2 and fit3 very large 95% confidence intervals for the free parameters were found.
The question emerges whether the presented model fits with three free parameters represent descriptions of the data that are statistically significantly better than those fits with only one or two free parameters. The F-test can be used to decide this. This test allows to decide with a chosen confidence whether the variances of two samples from different populations are statistically significantly different. One calculates F = σ
2
1/σ
2
2 where σ
2 is the variance of the ith sample (here: model fit). For the model fits presented here, the variance is
The presented model for the protective apoptosis-mediated bystander effect bears similarities to the approach by (Scott 2004) who also applied PAM to fit the Redpath et al. (2001) data and another U-shaped data set for mutation frequencies (Scott et al. 2004). Both groups currently model PAM as dose-rate independent. A dose rate dependence has been found for apoptosis induction (Boreham et al. 2000) but not for the dose rate of 3.3 mGy/min used by Redpath et al. (2001).
While the current model explains the U-shaped dose-response curve in the Redpath et al. (2001) data with an apoptosis-mediated protective bystander effect, other mechanisms such as upregulation of DNA repair and radical scavenging and cell killing of a transformation sensitive subcomponent of the overall cell population could also contribute to the observed protective effects in a dose-dependent way (Azzam et al. 1996, Redpath et al. 2001, Pant et al. 2003, Ko et al. 2004). The data by Redpath et al. (2001) and Azzam et al. (1996) are not in contradiction to other in vitro data for neoplastic transformation that do not show a U-shaped dose response at low doses. This has to do with the different dose rates applied, different experimental protocols including delayed plating and the fact that many of these other studies have a lowest dose that is too high to reveal any possible protective effects. For example, the lowest dose in the X-ray data by Mill et al. (1998) is at 250 mGy while Redpath et al. (2003) and Ko et al. (2004) found the transition between protection and detriment from X-ray exposures at lower doses. This has been discussed in more detail by Schöllnberger et al. (2002) and Schöllnberger et al. (submitted).
While we have stated that it is not yet decided whether at low doses bystander effects are predominately detrimental or protective with respect to cancer induction in humans, we do, however, tend to agree with other researchers who have stated that bystander effects are positive cellular manifestations of multicellular damage responses and that they are evidence of the extracellular signaling that results from such multicellular programs that attempt to re-establish homeostasis and eliminate abnormal cells (Barcellos-Hoff and Brooks 2001, Barcellos-Hoff and Costes 2006). Mothersill and Seymour (2006) argue that cell communication via signaling pathways is coordinating the radiation response at low doses and that bystander effects are beneficial at some level of organization that supersedes the individual cell. They also pose the fascinating suggestion that genomic instability may represent part of the mechanism by which adaptation to altered environmental conditions is achieved at the population level (Mothersill and Seymour 2006).
Summarizing, it can be said:
A protective apoptosis-mediated bystander effect could at least in part be responsible for protective effects of low doses of γ-radiation.
Our findings for the onset and cessation of bystander-induced apoptosis after low doses of γ-radiation are in accordance to reported experimental results for higher doses of low-LET radiation.
New experiments are needed to investigate the time dependence of apoptosis induction and cessation at low doses < 200 mGy.
Future modeling studies should include other low dose data of Dr. Redpath's group published in the recent years.
The PAM process should be generalized so that possible dose-rate dependencies and other biological details of its induction can be described.
The importance of adaptive responses with respect to a reduction of transformation and mutation frequencies below the background neoplastic transformation and mutation frequencies after a single low dose irradiation is emphasized.
The current predominant notion of bystander effects as detrimental needs to be extended to also include its protective features.
Footnotes
ACKNOWLEDGMENTS
The first author wishes to thank Dr. Werner Hofmann, University of Salzburg, and Dr. Douglas J. Crawford-Brown, UNC Chapel Hill, for their continued scientific support and for their human leadership over the years. Fruitful discussions with Dr. Stefan Kopecky, Institute for Reference Materials and Measurements, Dr. Ronald E.J. Mitchel, Atomic Energy of Canada Limited, and Dr. J. Leslie Redpath, University of California at Irvine, are also gratefully acknowledged. We also thank the reviewers for their valuable criticism. This work was supported by the Austrian Science Fund FWF (project P18055-N02).
∗
Solutions of stiff differential equations can change on a time scale that is very short compared to the interval of integration, but the solution of interest changes on a much longer time scale.