
Abstract
Objective
Animal-vehicle collisions are a significant public health concern in the United States. The annual economic cost currently exceeds $1 billion from injuries and property damage. A recent study by the Centers for Disease Control and Prevention evaluated nonfatal injuries from animal-vehicle collisions, but information on fatal animal-vehicle collisions is limited. This study evaluates risk factors associated with fatal animal-vehicle collisions.
Methods
This study evaluates characteristics of fatal animal-vehicle collisions in the United States from 1995–2004 by using the Fatality Accident Reporting System database of the National Highway Traffic Safety Administration.
Results
An average of 165 deaths occurred each year during this 10-year time period. Most deaths occurred in rural areas, during the fall months, on straight roads, and in clear weather, and an increasing trend for deaths was noted over this time period.
Conclusion
The number of fatal animal-vehicle collisions is increasing. Various methods to reduce such collisions are described, with fencing appearing to be the most effective. The use of personal restraints such as seat belts in passenger vehicles and helmets for motorcycle and all-terrain-vehicle riders may decrease fatalities during a collision.
Introduction
Vehicle collisions with large animals continue to affect the driving public in the United States and other parts of the world. Although studies have examined the factors associated with collisions and have suggested prevention methods, collisions continue to negatively affect personal safety, property, and wildlife.
In 2000, an estimated 6.1 million light-vehicle collisions on US roads were reported to police. Of these, approximately 247 000 reported collisions (4.0%) involved a motor vehicle hitting an animal on the roadway, according to the General Estimates System of the National Highway Traffic Safety Administration (NHTSA). 1 The majority of these collisions did not cause injury that required treatment. The Centers for Disease Control and Prevention (CDC) 2 estimated for the years 2001–2002 that 26 647 motor vehicle occupants per year were involved in roadway collisions from encounters with animals (predominantly deer) and required treatment for nonfatal injuries in US emergency departments. The NHTSA Fatality Analysis Reporting System (FARS) recorded an average of 187 fatal collisions involving animals for the years 2002–2004, an increase of 48% over the average of 126 for the years 1995–1997. These estimates include deaths from a direct motor vehicle collision or from a crash in which a driver tried to avoid an animal and ran the vehicle off the road. 1 Similar figures are available from Europe, where an estimated 507 000 annual collisions with large animals cause 300 human fatalities and 30 000 injuries. 3
It appears most vehicle collisions with large animals involve deer.1,2,4,5 Risk for collision varies according to the time of day, season, and road location (rural vs nonrural). Previous smaller studies found that most deer-vehicle collisions happen between dusk and dawn, with an estimated 70% to 90% of animal-vehicle collisions occurring in dark conditions. Almost two thirds of the animal collisions occur between June and November. Most deer-vehicle collisions occur in October and November during mating season. The majority of animal collisions (90%) occur in rural areas on roads with speed limits of 55 mph or higher. 5 –7
It is important to try to characterize the individuals affected and the risk factors (human, vehicle, road, and environmental conditions) surrounding vehicle collisions with large animals in order to develop prevention strategies that will decrease morbidity, mortality, and associated cost. Although the CDC has recently conducted a nationwide study on nonfatal animal-vehicle collisions, analysis of fatal injuries related to animal-vehicle collisions nationally is more limited.
This study looks at data from the NHTSA FARS database to better describe circumstances surrounding fatal animal-vehicle collisions and reviews current collision-prevention efforts.
Methods
This analysis was conducted with the NHTSA FARS data for all fatal vehicle collisions in the United States.
8
The FARS data were downloaded in SAS format by accessing the FARS file transfer protocol site (
Data for this study were obtained for the 10-year period 1995–2004. The dependent variable measure (“animal”) is categorized as “yes” or “no.” “Yes” indicates collisions where either the first harmful event or the most harmful event for the incident is an animal. “No” indicates all other incidents and is categorized as “nonanimal.” An example of the animal being the first harmful event and the most harmful event might be hitting the animal with an impact severe enough to kill at least 1 person in the vehicle. An example of the animal being the first harmful event but not the most harmful event might be hitting the animal, swerving the vehicle, and going off the road and hitting a telephone pole.
Descriptive statistics were calculated for the collisions, vehicles, drivers, and fatalities. The level of significance and the odds ratios (ORs) for animal-to-nonanimal collisions are provided. Mantel-Haenszel chi-square method was used to determine the significance of the associations, and Mantel-Haenszel estimation was used to calculate case-control ORs for the variables where the Mantel-Haenszel chi-square was significant. Because the dependent variable is binary (animal or nonanimal), the linear probability model has serious shortcomings. Consequently, the Mantel-Haenszel chi-square and the Mantel-Haenszel logit method to obtain case-control ORs have been used to determine significance and strength of associations. The odds of an outcome are the ratio of the expected number of times that the outcome will occur to the expected number of times that it will not occur. We determined the odds of the outcome of animal-related collisions to the odds of the outcome of nonanimal-related collisions. All the variables reported (unless indicated otherwise) are significant at the .01 level.
Results
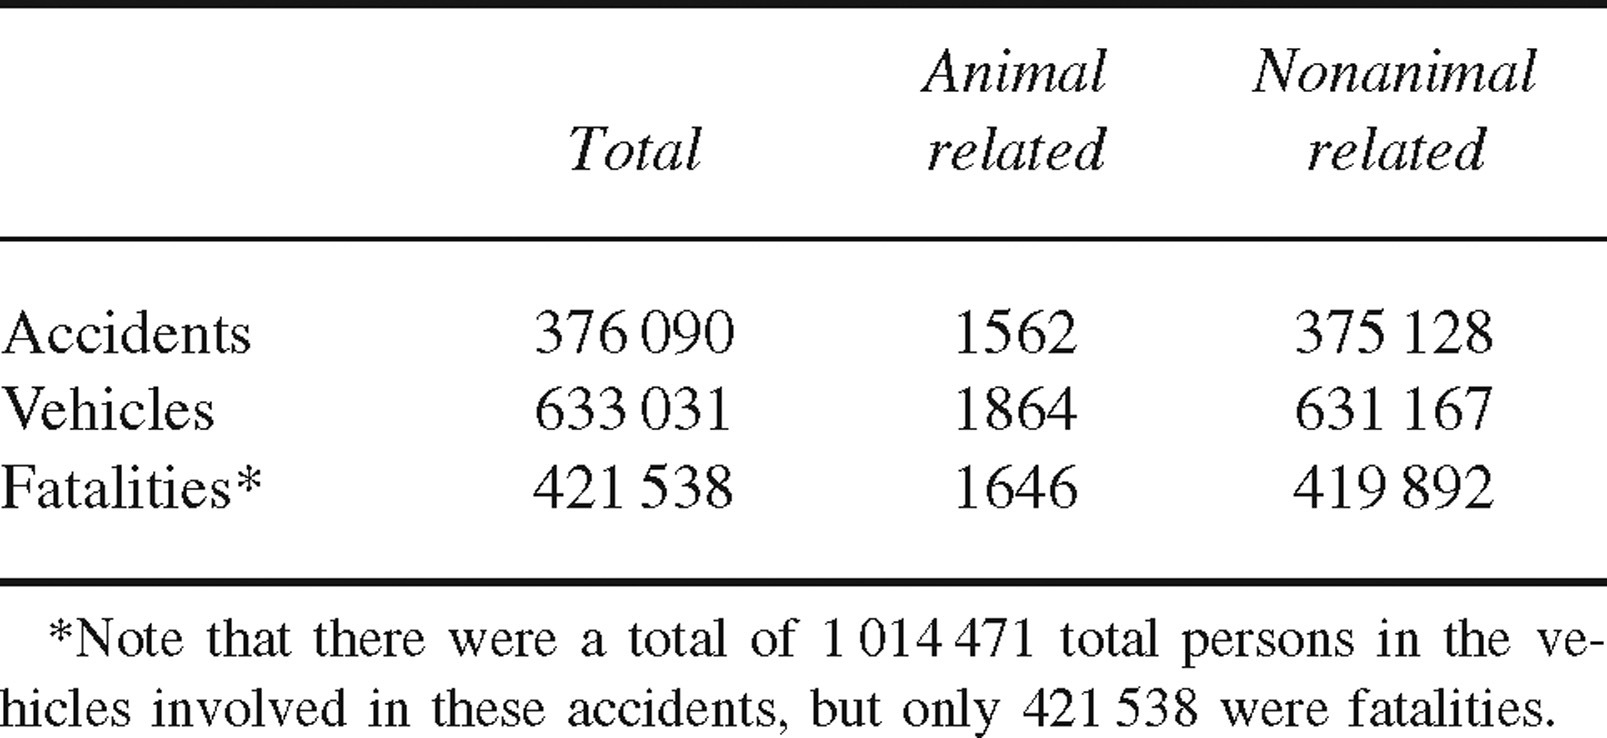
This report provides comparison information for animal-and nonanimal-related events. Information for collisions, vehicles, drivers, and fatalities is reported. Table 1 shows the number of collisions, vehicles, and fatalities from the FARS data for the years 1995–2004. All these collisions involved at least 1 fatality. (A fatal collision is defined as “A police-reported crash involving a motor vehicle in transport on a trafficway in which at least 1 person dies within 30 days of the crash.”) 8 During the 10-year period, 1646 persons died from the fatal collisions that were animal-related events.
Summary data for fatal collisions: 1995–2004
Fatal Collisions
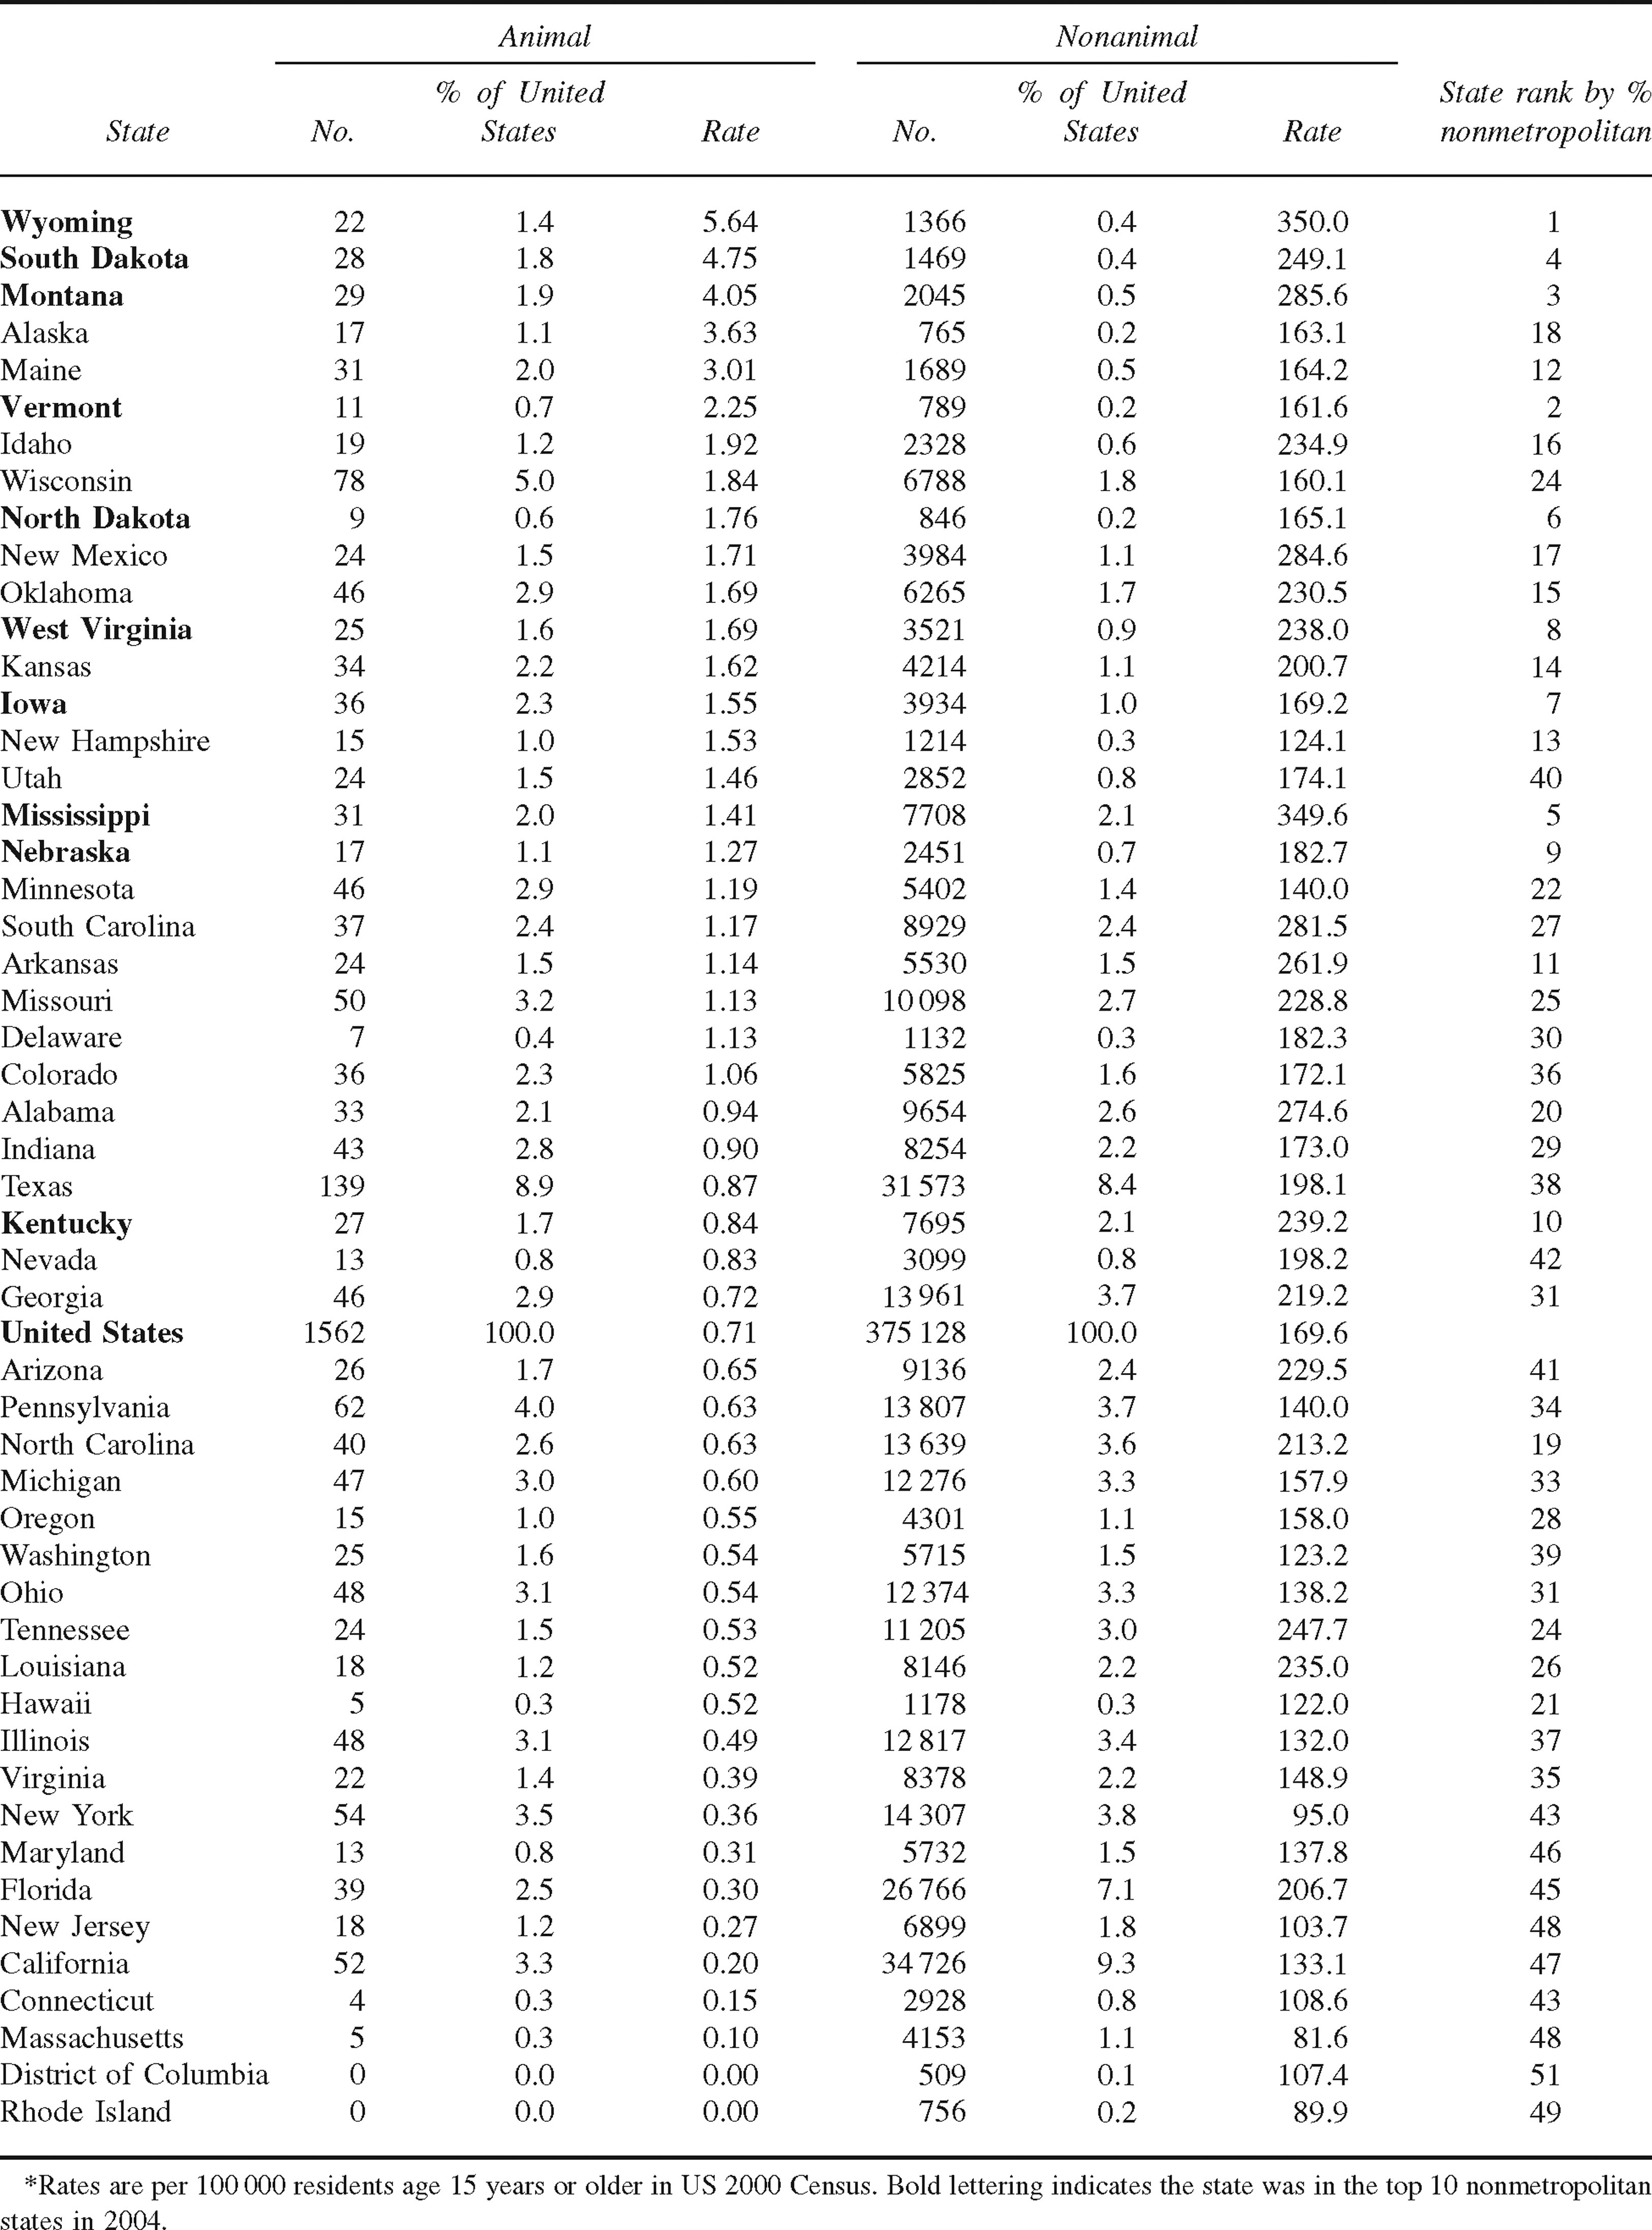
Although the number of fatal collisions per year for nonanimal-related events remained fairly stable over the 10-year period (the increase from 1995–2004 was 2.5%), the number of fatal collisions for animal-related events rose more markedly (the increase from 1995–2004 was 78%) (see Figure 1). Although one fourth of all fatal animal collisions in the United States occurred in Texas, Wisconsin, Pennsylvania, New York, and California, the states with the highest fatality rates were Wyoming, South Dakota, Montana, Alaska, Maine, Vermont, Idaho, Wisconsin, North Dakota, and New Mexico (see Table 2). 9
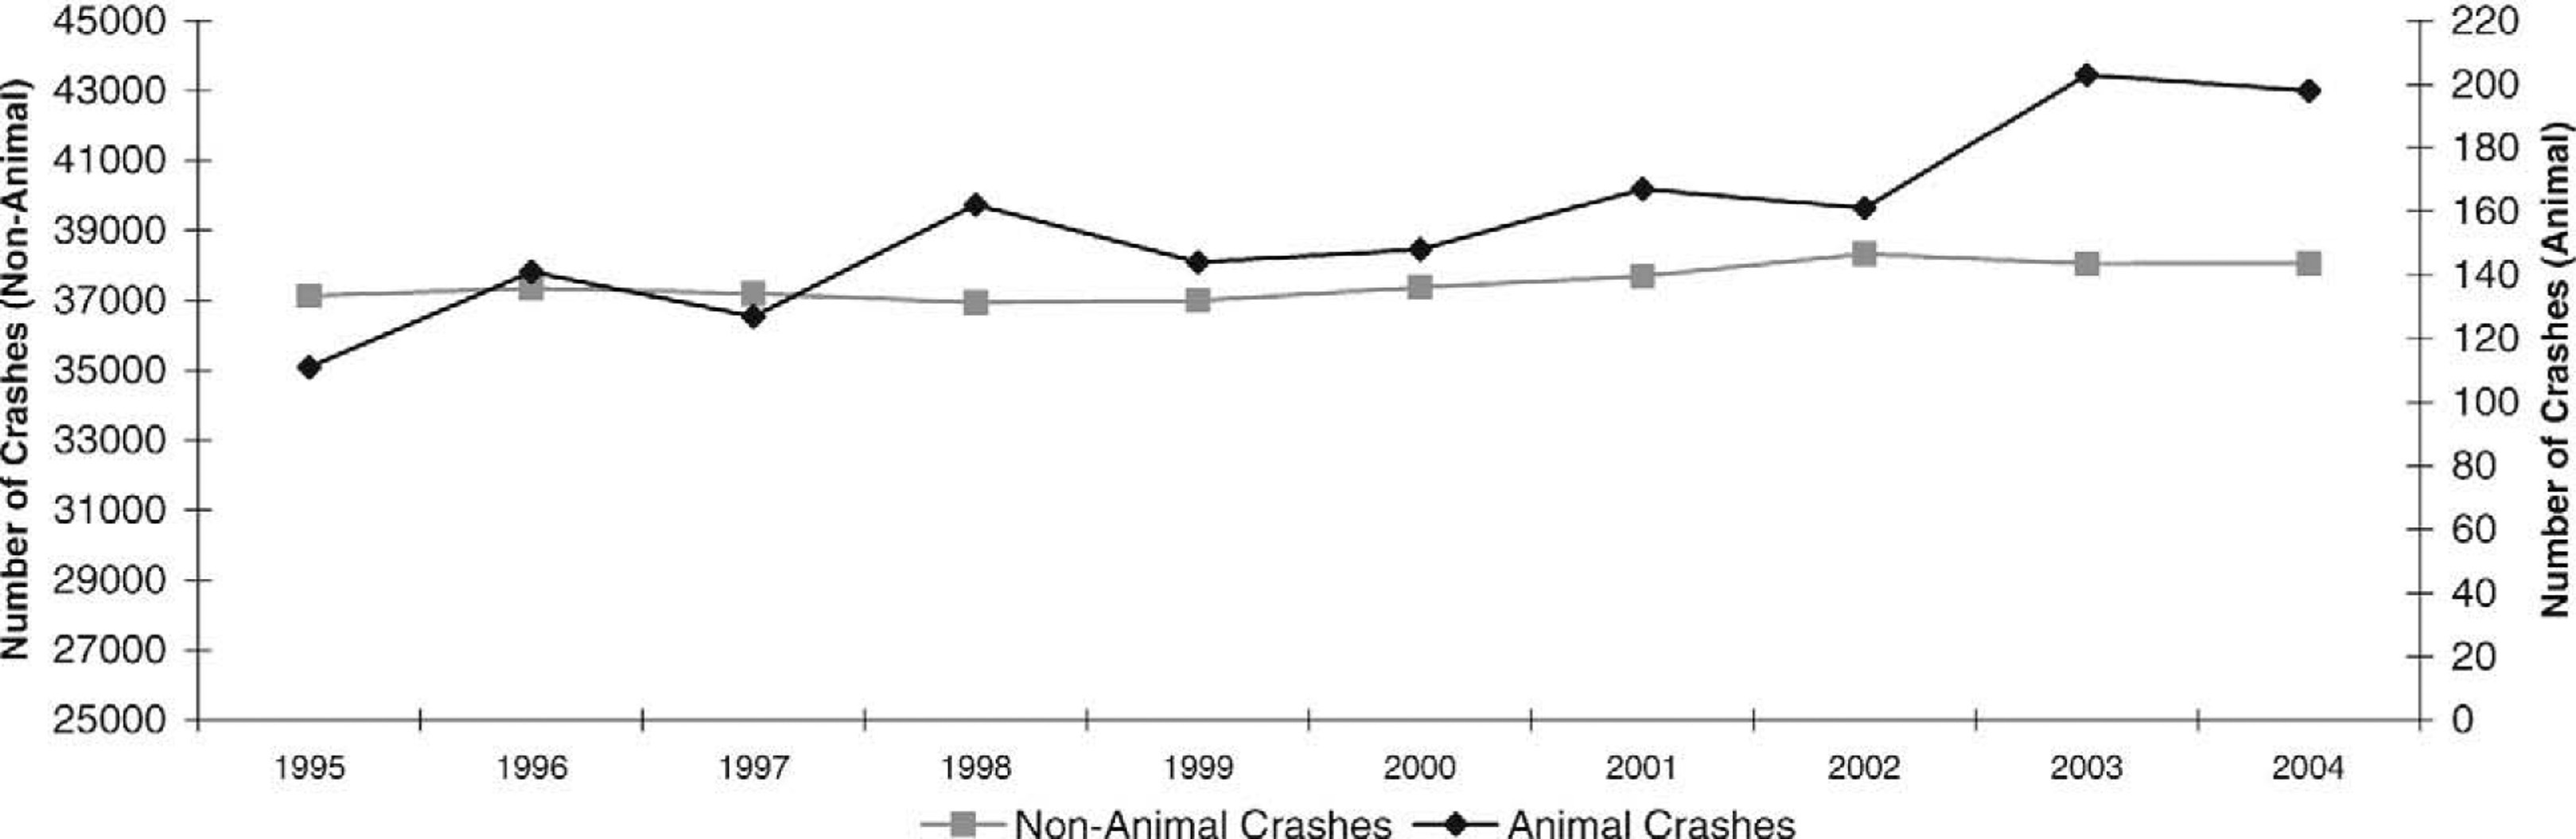
Number of fatal collisions by year of occurrence: 1995–2004.
Number and percentage of total collisions involving fatalities by state: 1995–2004*
The hours of occurrence (Figure 2) and the months of occurrence (Figure 3) were different for these 2 types of collisions. Seventy-five percent of the animal-related collisions occurred between 6:00
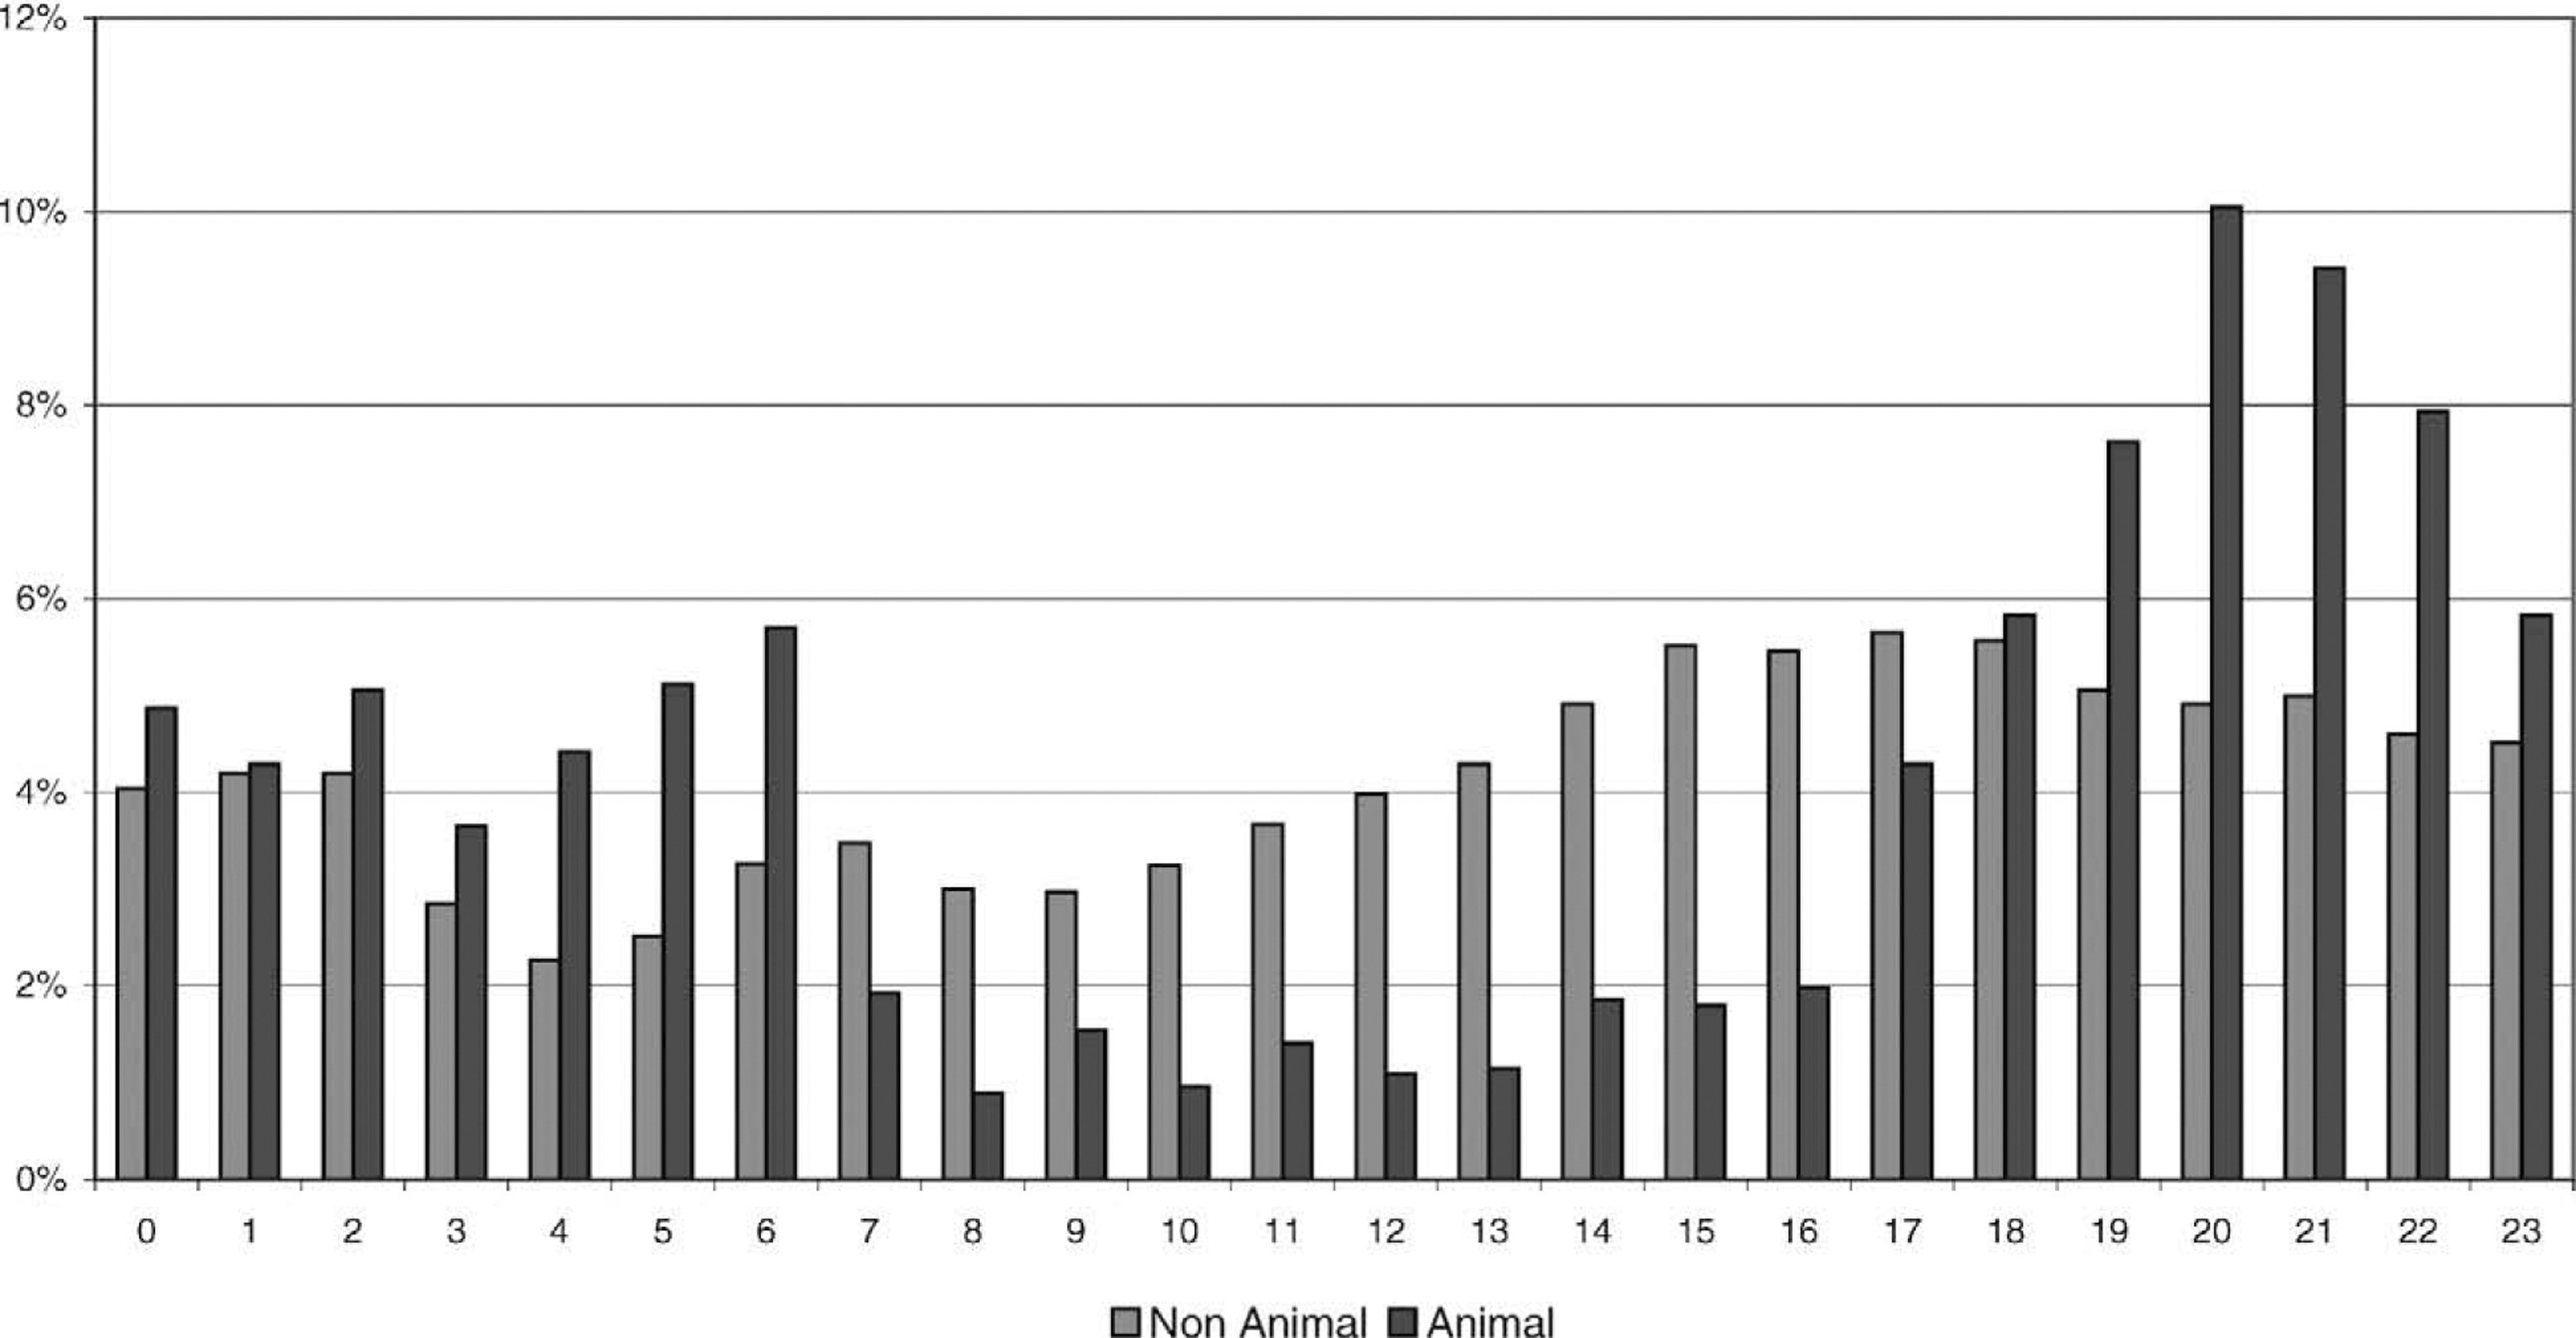
Percentage of fatal vehicle collisions by hour of occurrence: 1995–2004.
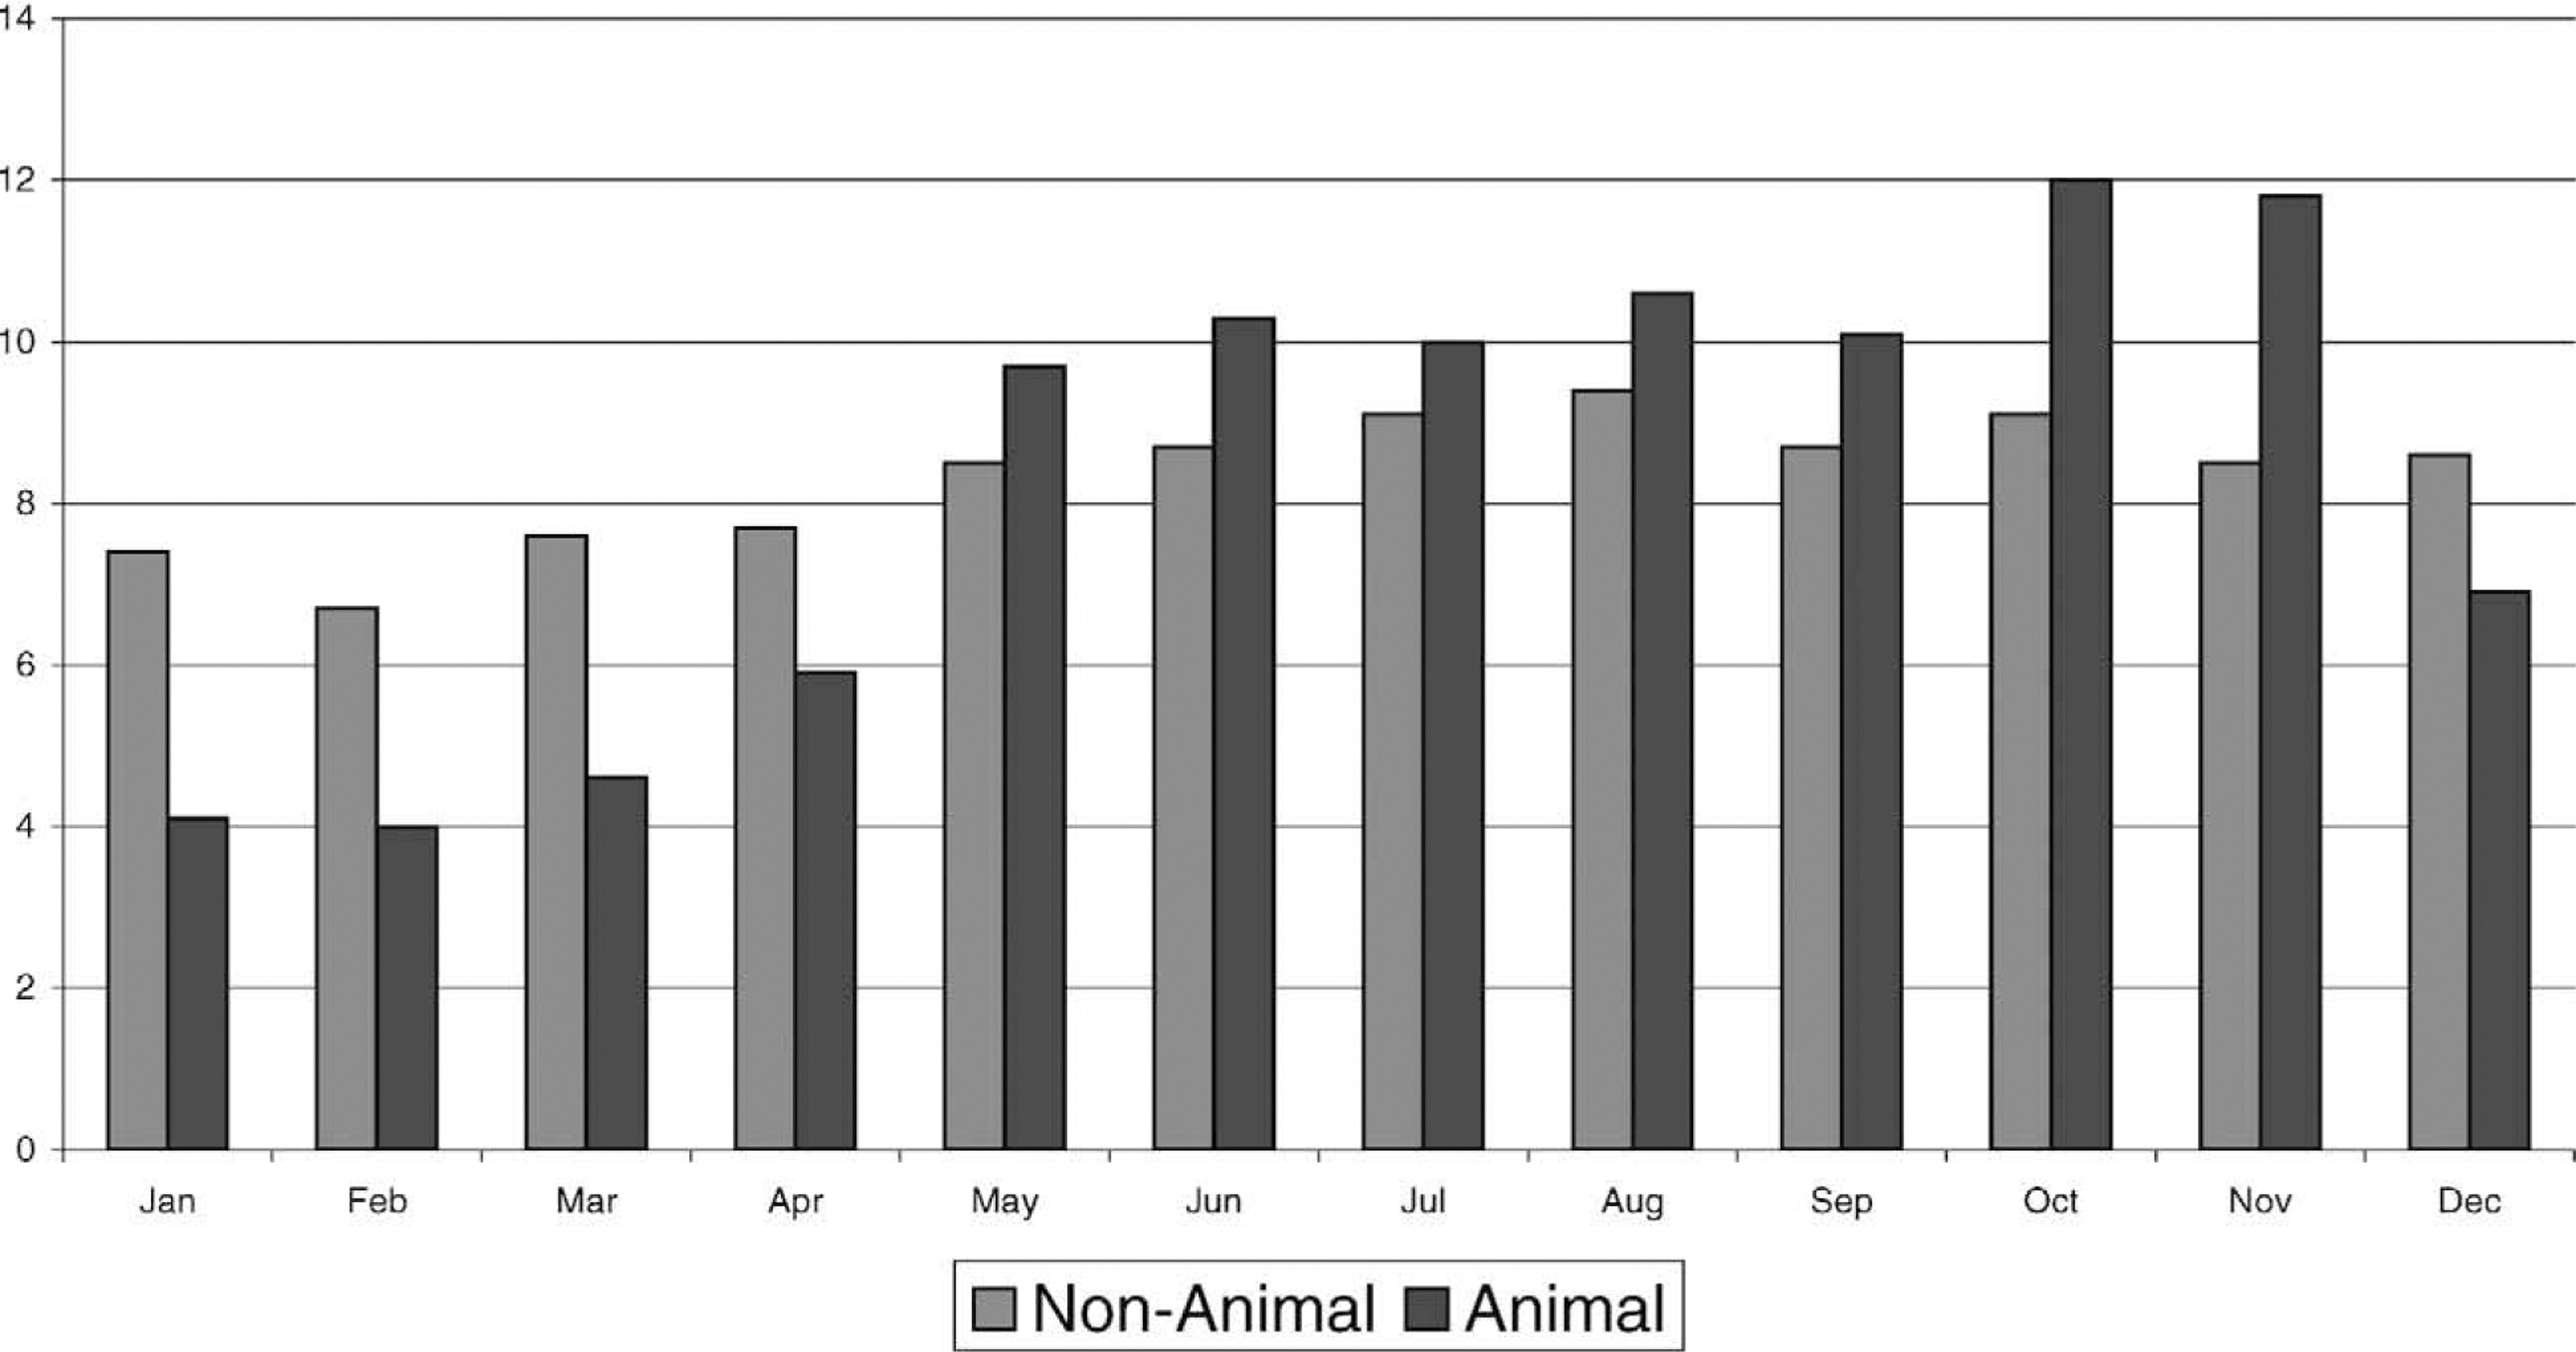
Number of fatal collisions by month of occurrence: 1995–2004.
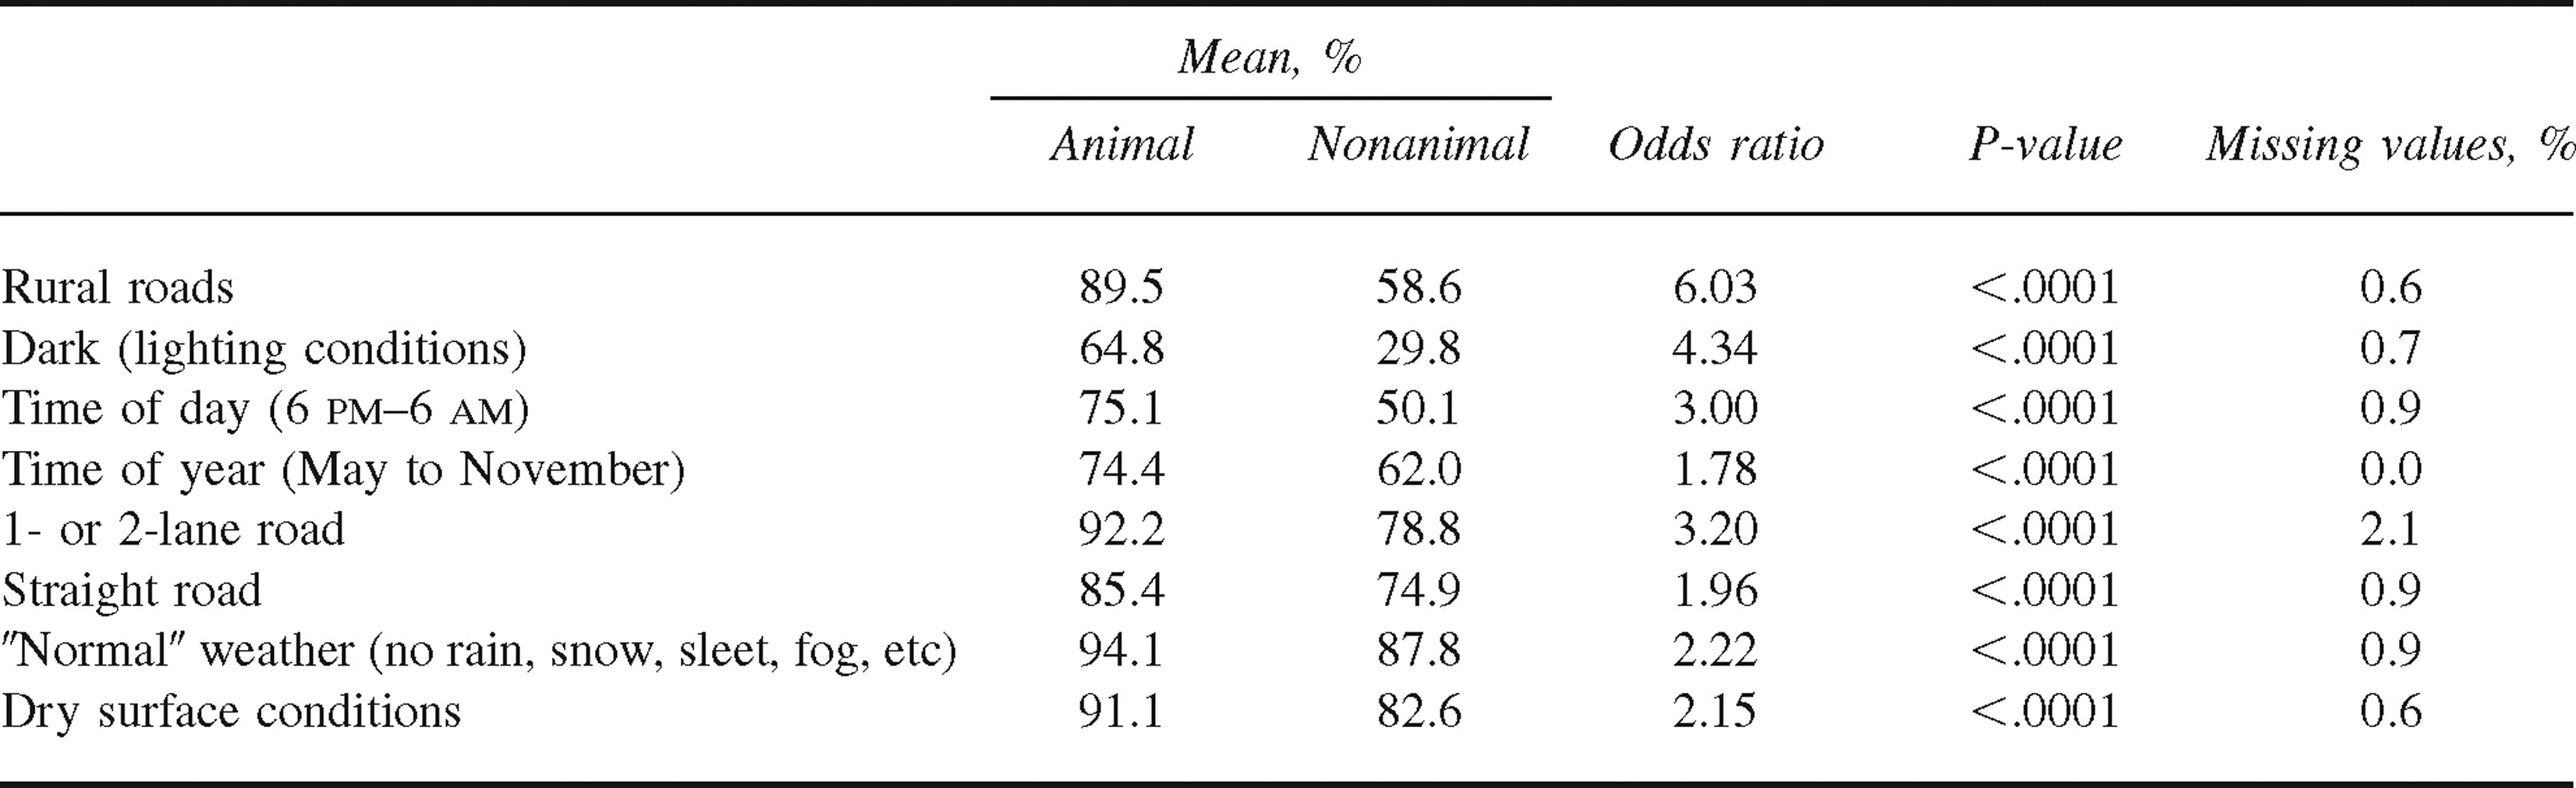
Comparison of environmental factors in fatal animal vs nonanimal collisions: 1995–2004
Fifty-eight percent of the animal-related events had an animal as the most harmful event, followed by vehicle overturn (17%) and contact with another vehicle in transport (11%). (The high percentage of animals as the most harmful event is an obvious result of the fact that the first harmful event or the most harmful event being an animal defines the animal-related event. A motor vehicle in transport was defined as “A motor vehicle in motion on the trafficway or contact with any other motor vehicle on the roadway, including stalled, disabled, or abandoned vehicles.”) 8 For the nonanimal-related events, the most harmful event was contact with another vehicle in transport (40%), followed by vehicle overturn (19%) and pedestrian (13%).
The animal-related events (85%) were more likely to occur on straight roads than were the nonanimal-related events (75%). The animal-related events were also much more likely to be on 1- or 2-lane roads (92% vs 79%) and on rural roads (90% vs 59%). The surface conditions of the roads were more likely to be dry for the animal-related events (91% vs 83%). The weather was also more likely to be described as “normal” (as opposed to rain, snow, sleet, fog, etc) for the animal-related events (94% vs 88%). In summary, the most important distinctions for road and environmental conditions between animal-related collisions and nonanimal-related collisions were rural roads (OR = 6.03), darkness (OR = 4.34), 1- or 2-lane road (OR = 3.2), between 6:00
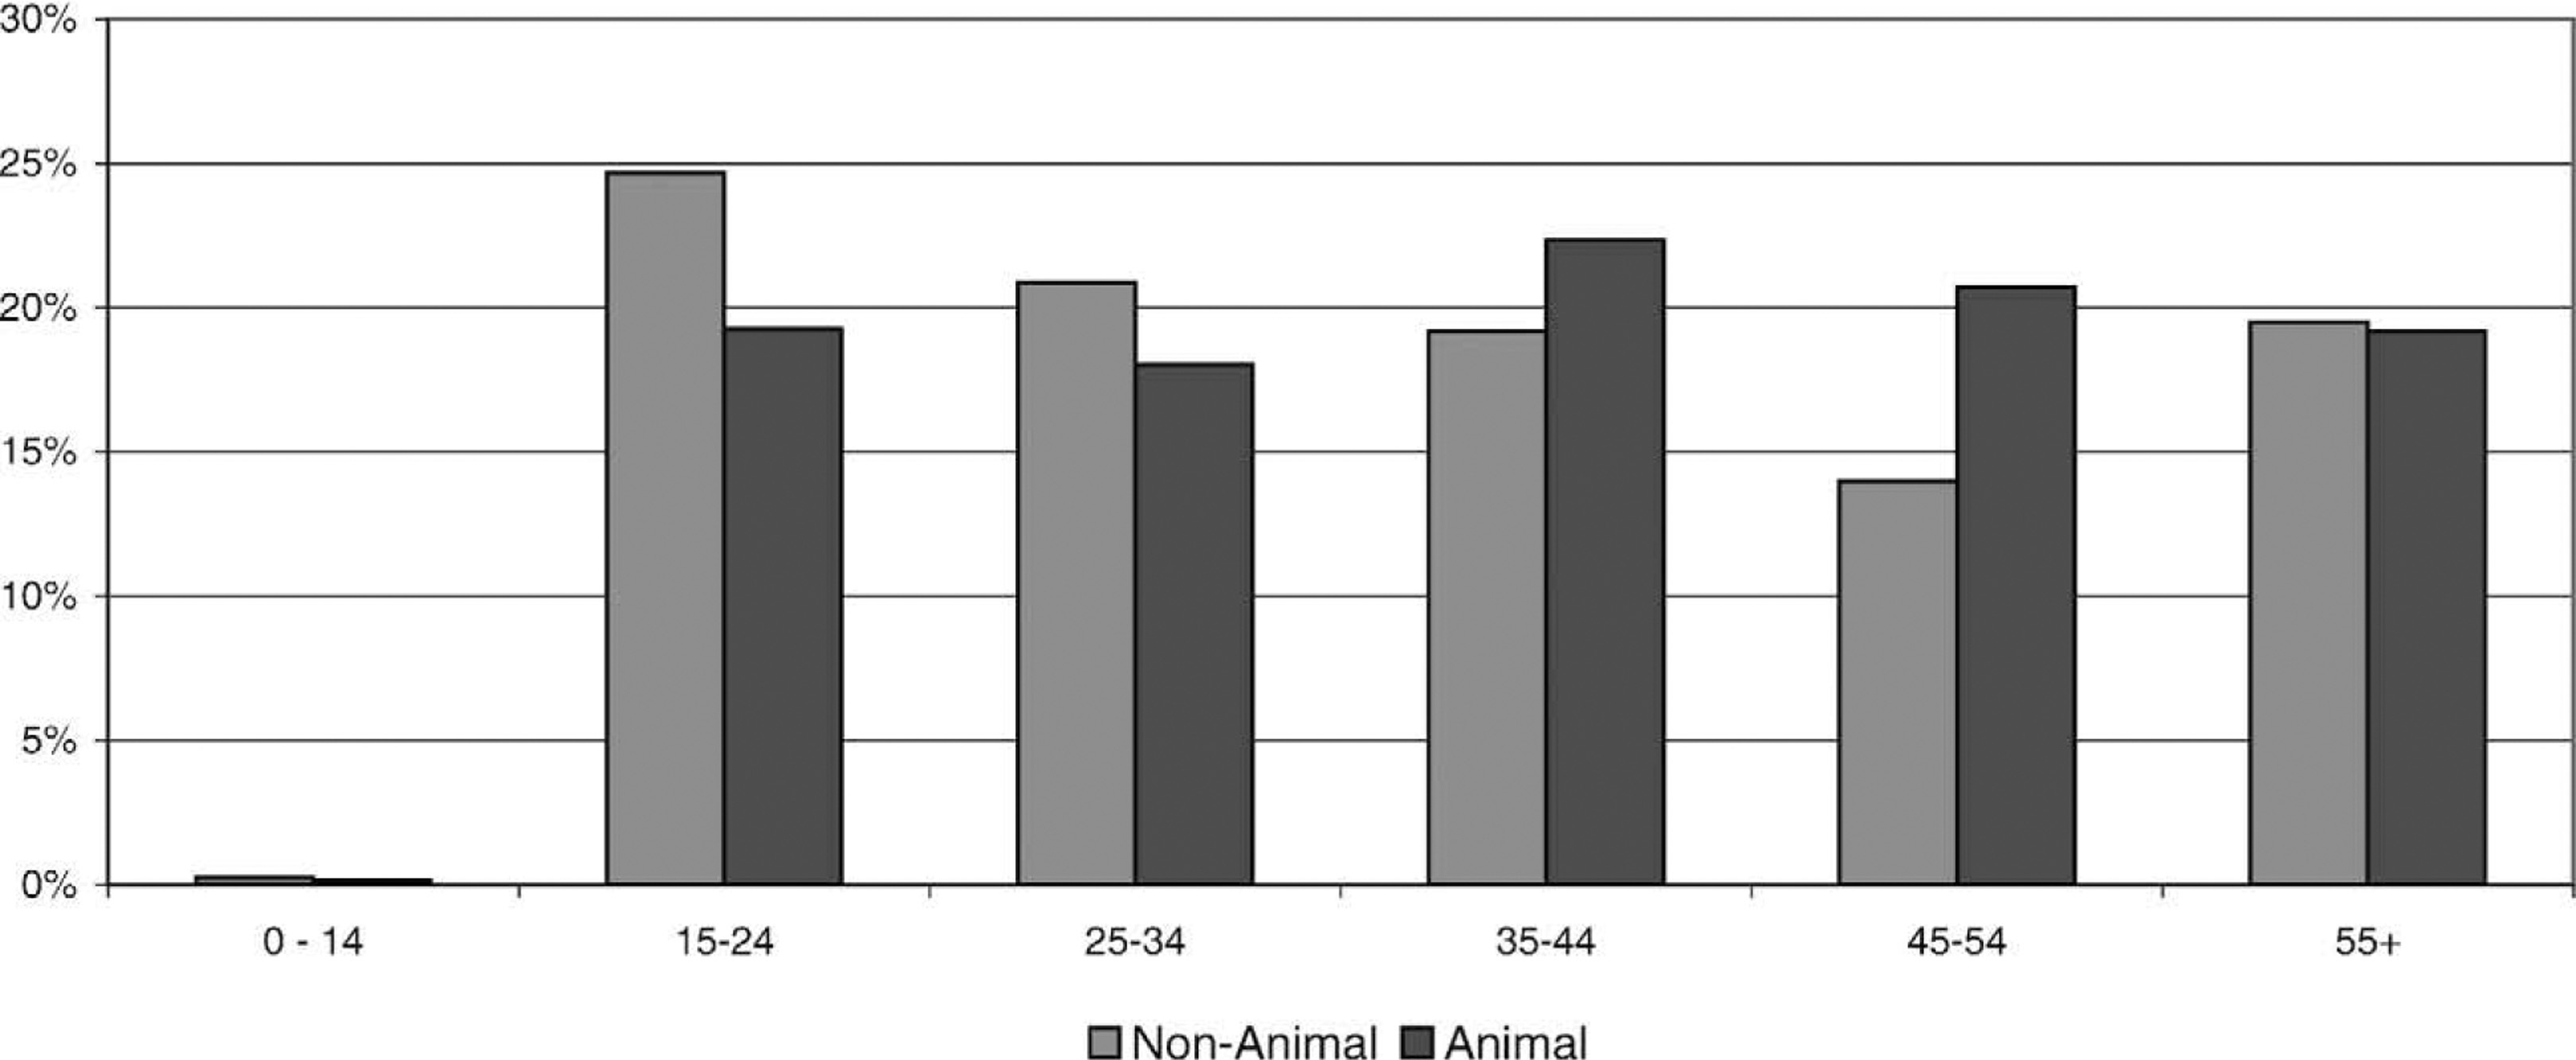
Fatality Victims
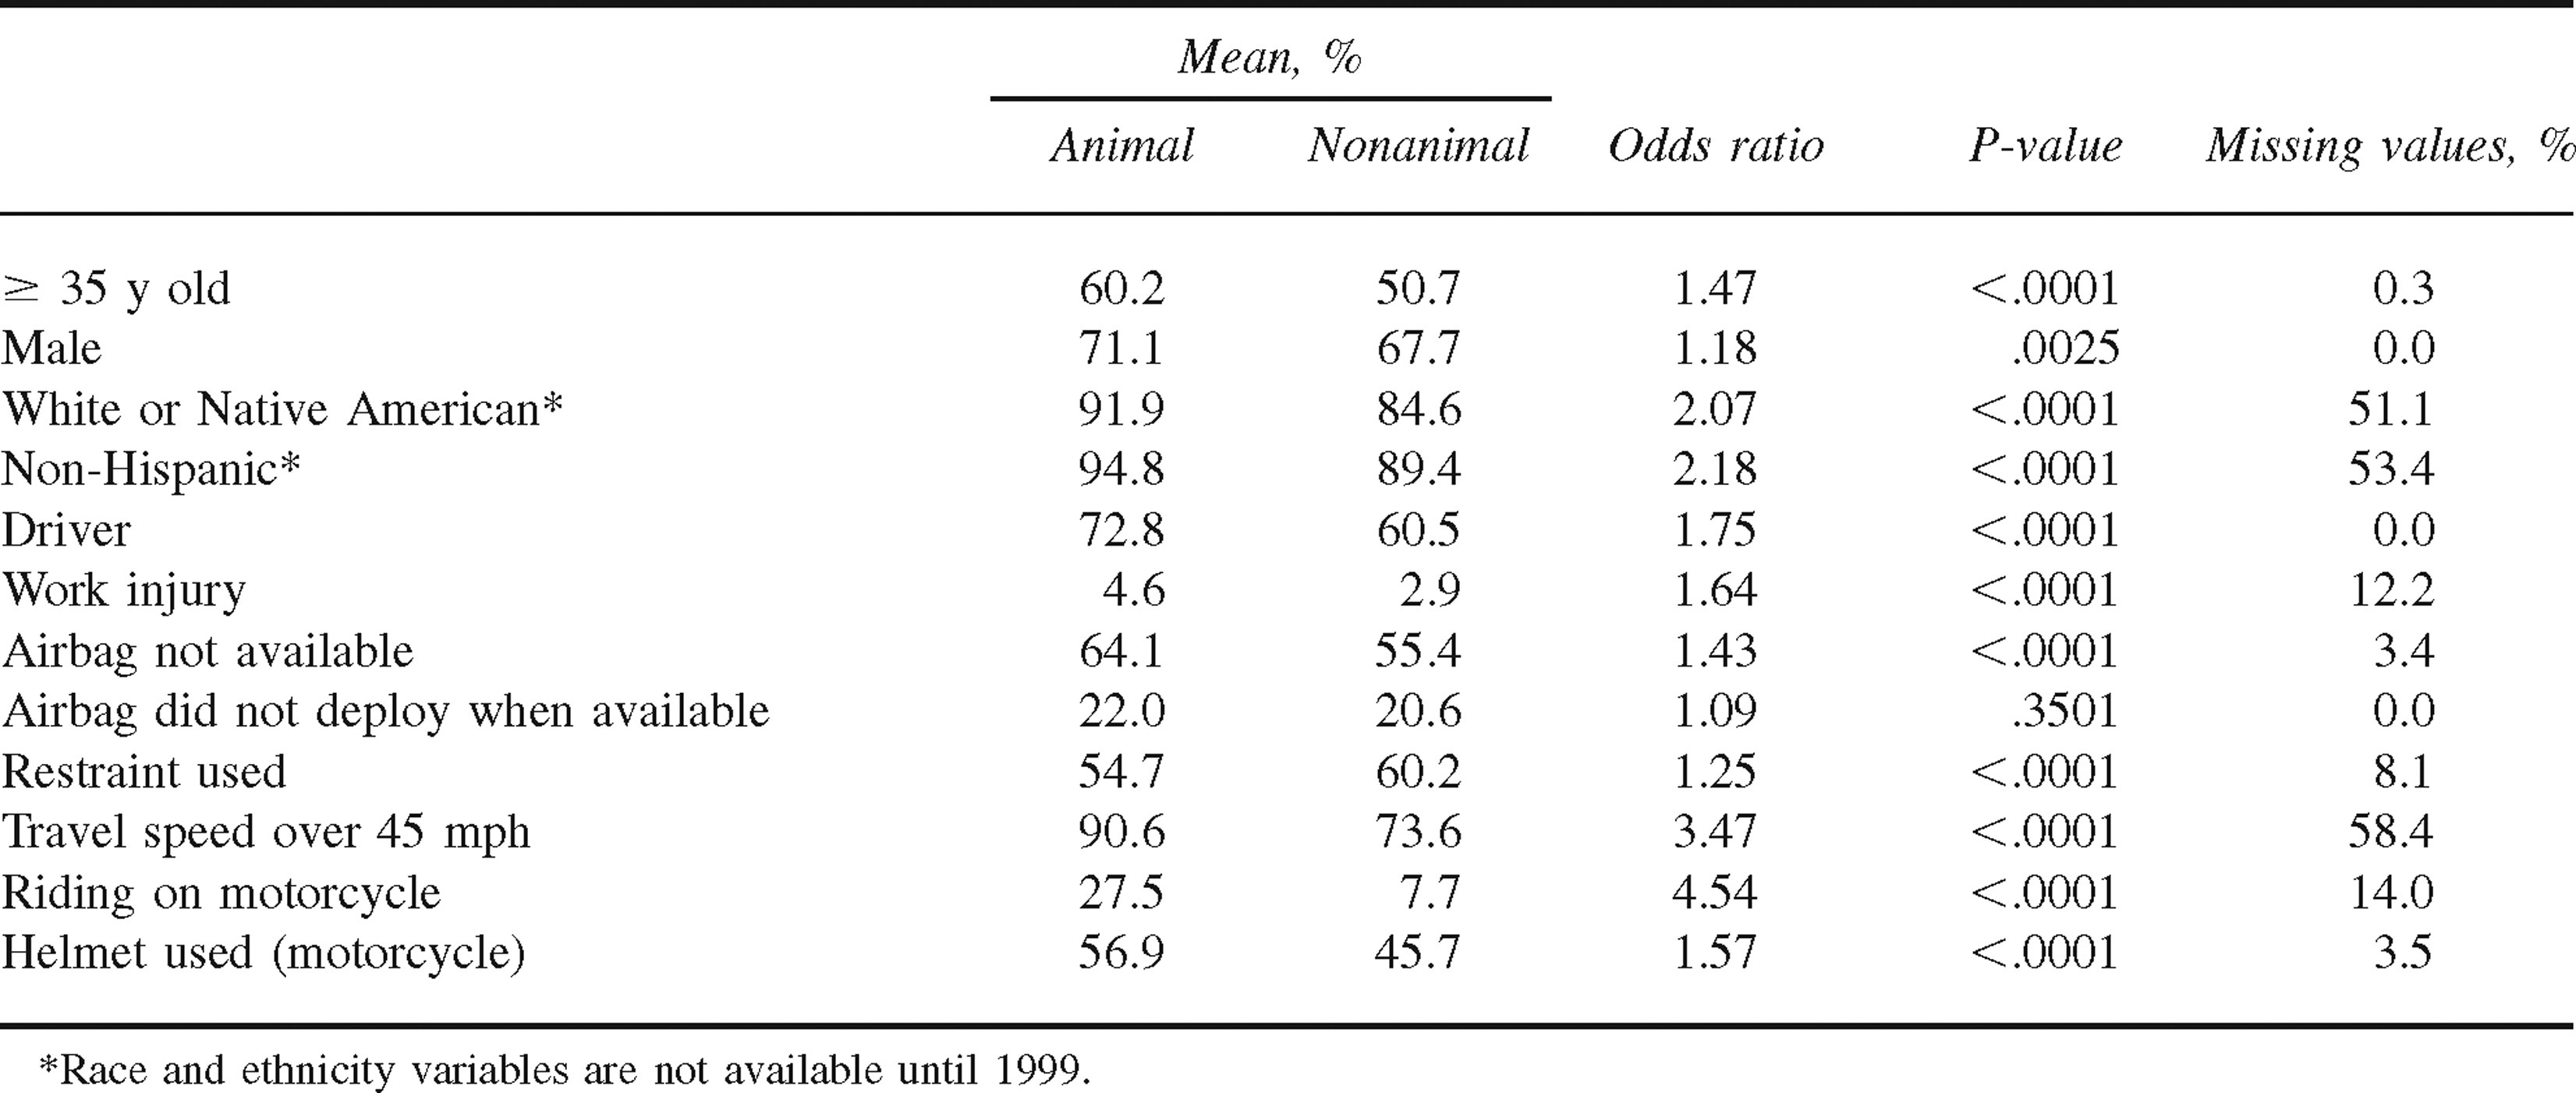
The demographic profile was fairly similar for the 2 groups (animal-related vs nonanimal-related collisions) (Table 4). The fatality victims in the animal-related events were more likely than those in the nonanimal-related events to be males (71% vs 68%), white (88% vs 83%), or Native American (3.4% vs 1.8%). The nonanimal-related fatality victims were more likely to be black (13% vs 7%) or Hispanic (10.6% vs 5.2%). (The variables of race and ethnicity are not included in the datasets before 1999.) The age for the animal-related fatality victims was more likely than the age for the nonanimal-related fatality victims to range from 36 to 55 years (41% vs 27%). The age for the nonanimal-related fatality victims was more likely to range from 0 to 25 years (33% vs 24%) or be over 55 years (23% vs 19%). When age is treated as a dichotomous variable (greater than or equal to 35 years), it is significant at the .01 level (P < .0001), with the animal-related victims being more likely to be over 35 years old. The percentage of drivers vs passengers or other persons fatally injured was higher for the animal-related fatalities (73% vs 60%). The animal-related events were more likely to be work related (4.6% vs 2.9%). Lap and shoulder belts or other appropriate restraints were used properly only 55% of the time by the fatality victims in the animal-related events and 60% of the time by the fatality victims in the nonanimal-related events. Air bags were more likely to be available for the animal-related collisions (64% vs 55%), but there was no difference (P = .35) in the likelihood of deployment when air bags were available. The animal-related fatality victims were more likely to be on a motorcycle (28% vs 8%). If the victim was on a motorcycle, it was more likely that the animal-related fatality victim was properly using a helmet (57% vs 46%). The travel speed of the vehicle for animal-related fatality victims was more likely to be 45 mph or greater (91% vs 74%). In summary, the most important distinctions between the fatality victims for the animal-related collisions vs the nonanimal-related collisions were that they were more likely to be on a motorcycle (OR = 4.54), traveling at a speed greater than 45 mph (OR = 3.47), non-Hispanic (OR = 2.18), and white or Native American (OR = 2.07).
Demographic comparison of fatality victims in animal vs nonanimal collisions: 1995–2004
Drivers
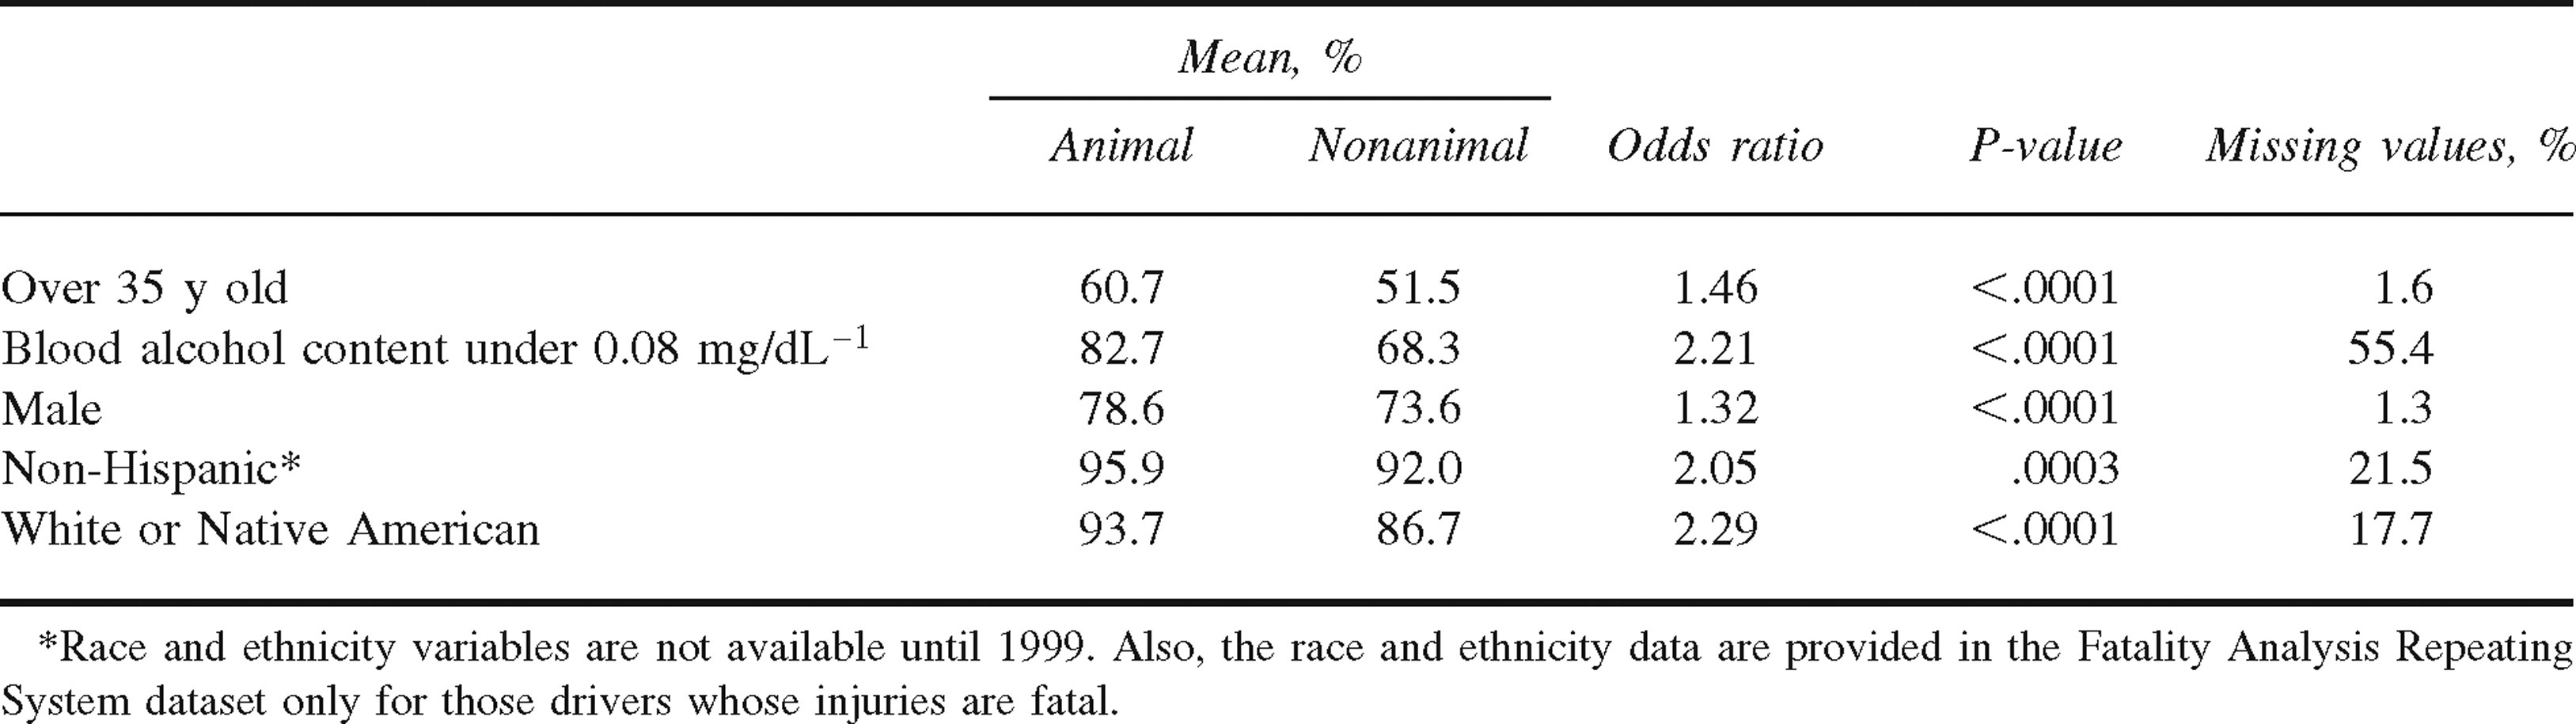
The drivers in collisions for animal-related events vs nonanimal-related events were more likely to be male (79% vs 74%), white or Native American (94% vs 87%), non-Hispanic (96% vs 92%), and over 35 years of age (61% vs 52%) (Table 5). (Race and ethnicity are available only from 1999–2004 and only for those with fatal injuries.) The drivers were also less likely to have been drinking (83% vs 68% blood alcohol content <0.08 mg·dL−1). The age for the drivers is shown in Figure 4. In summary, the most important distinctions between the drivers in fatal events for the animal-related collisions vs nonanimal-related collisions were that they were more likely to be white or Native American (OR = 2.29), not drinking (OR = 2.21), and non-Hispanic (OR = 2.05).
Demographic comparison of drivers in fatal animal vs nonanimal collisions: 1995–2004
Age distribution of drivers in fatal collisions: 1995–2004.
Vehicles
When the travel speed was reported, the vehicles in the animal-related events were more likely to have been traveling over 45 mph (89% vs 65%) (Table 6). When the travel speed was compared with the speed limit, 24% of the vehicles in the animal-related events were traveling above the speed limit compared with 31% of the vehicles in the nonanimal-related events. The vehicles in the animal-related events were more likely (80%) than the vehicles in the nonanimal-related events (52%) to have an initial impact of “CLOCK 12” (ie, a straight, “head-on” type of impact).
Comparison of vehicular factors in fatal animal vs nonanimal collisions: 1995–2004
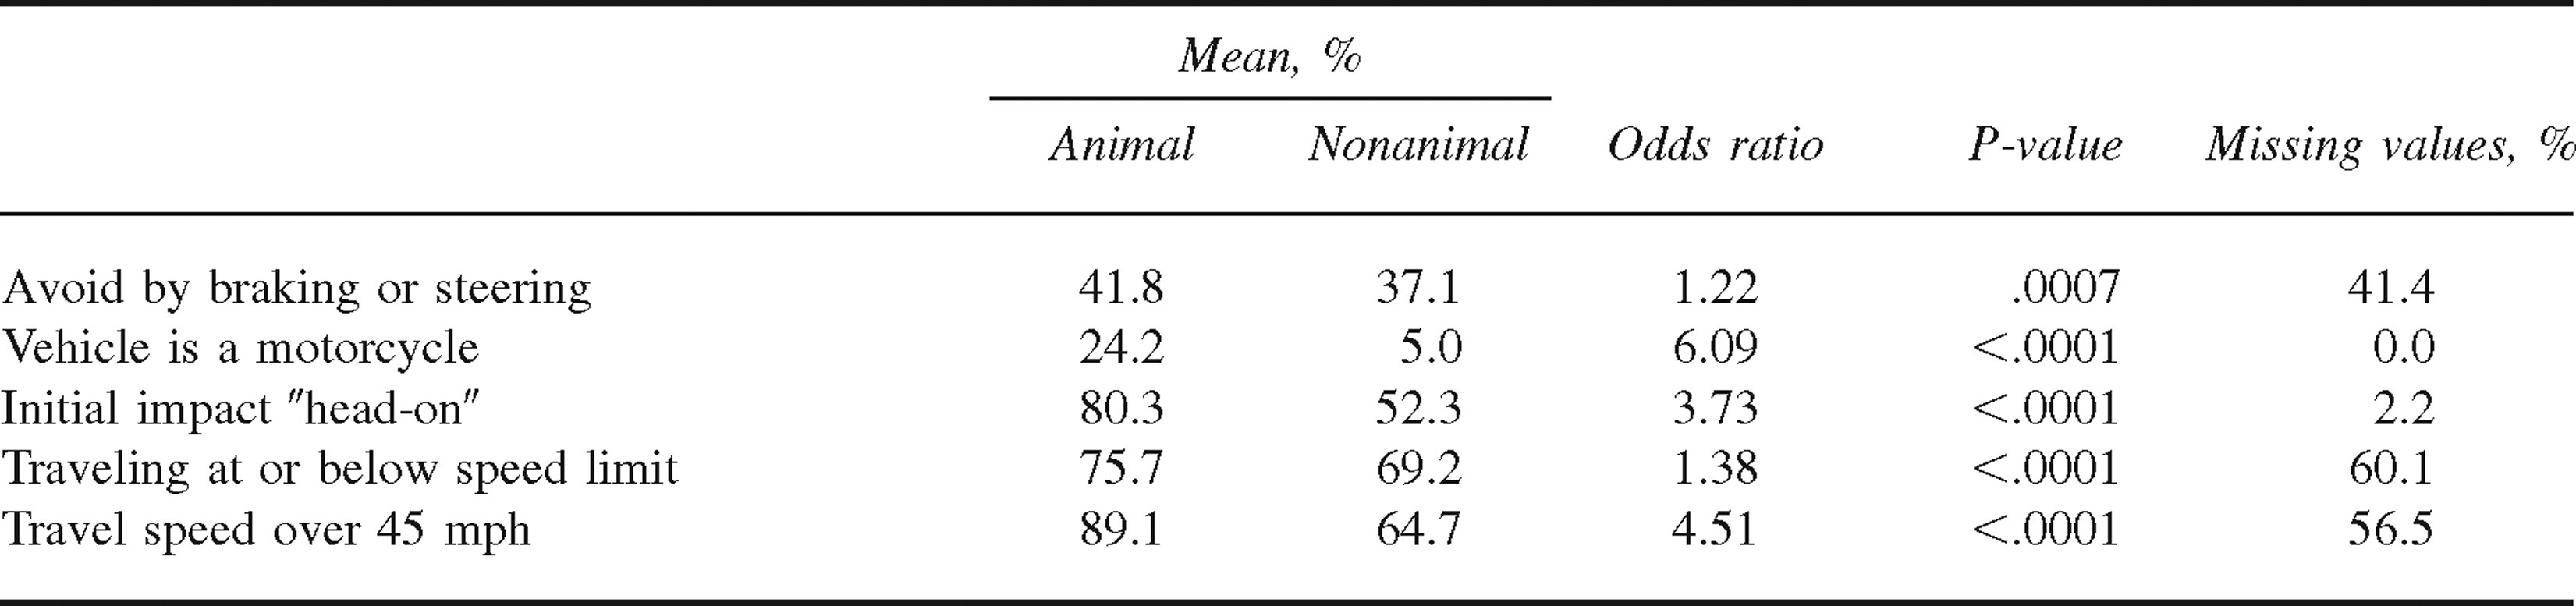
Passenger cars were the major vehicle body type for vehicles with at least 1 fatality for both types of events (58% for the nonanimal-related events vs 45% for the animal-related events). However, motorcycles were the second most likely vehicle body type for the animal-related events (24% vs 5% for the nonanimal-related events), whereas light trucks were the second most likely body type for the nonanimal-related events (31% vs 22% for animal-related events). In summary, the most important distinctions for the vehicles in the animal-related events vs the vehicles in the nonanimal-related events were that they were much more likely to be motorcycles (OR = 6.09) and traveling over 45 mph (OR = 4.51) and that the initial impact was CLOCK 12 (head-on impact) (OR = 3.73).
Discussion
Animal-vehicle collisions are a significant public health problem. The National Safety Council 10 makes estimates of the average costs of fatal and nonfatal unintentional injuries to show their affect on the US economy. The costs are a measure of the dollars spent and income not received as a result of collisions, injuries, and fatalities. The average economic cost per death resulting from a motor vehicle injury is $1 120 000. A nonfatal disabling injury cost is estimated at $45 000. Insurance data indicate the insurance industry paid roughly $1.1 billion in deer-related claims in 2002, with an average cost per claim of $2000, varying depending on the type of vehicle and the severity of the damage. 11 Lastly, deer and other type of game are considered a natural resource with value attached based on revenue from hunting. It has been estimated that the cost of a lost deer in a collision is between $700 and $800. 6
The number of vehicle collisions with large animals also appears to be increasing. Romin and Bissonette 12 reported that the number of collisions with ungulates increased from 200 000 in 1980 to 500 000 in 1991. The CDC 2 recently estimated the number of nonfatal injuries between a motor vehicle and an animal according to a National Electronic Injury Surveillance System–All Injury Program sample of hospital emergency departments. They estimated that 26 647 motor vehicle occupants per year during 2001–2002 were involved in collisions from encounters with animals (predominantly deer) in a roadway and treated for nonfatal injuries in US emergency departments. Only 79 injured patients were motorcyclists. The highest rate (21.1 per 100 000) of nonfatal animal-vehicle collision injuries occurred among persons aged 15 to 24 years. Among this age group, 48.9% were driving the vehicle. The sex ratio was approximately equal (50.2% male, 49.8% female) for all victims seen in emergency departments in this study. About 6% of those treated in emergency departments required hospitalization. Head and neck injuries were reported in about 51% of the cases. Deer were involved in 86.9% of the incidents, and other large animals were involved in 12%. Of the collisions, 54.4% involved a direct collision with the animal, whereas the remainder resulted from the driver attempting to avoid hitting the animal. Persons were treated more often during October and November (28% of the cases).
This report evaluated fatalities reported nationwide from the FARS database. Compared with nonfatal injuries in the CDC study, 2 we found a higher percentage of males involved in fatal animal-related collisions. It is known that at all ages males have a higher motor vehicle death rate compared with females. 13 The age range was also different, with 41% of fatality victims being 36 to 55 years old in this study compared with 27% of nonfatal injured victims in the CDC study. 2 In fact, the 15-to 24-year-olds were most likely to be involved in a nonfatal animal-vehicle collision. It is unclear why there is this age difference; however, it is known that teenage drivers are more likely to be involved in nighttime collisions. 14 Older individuals also are more likely to have fatal outcomes from traumatic events. 15 –17 Elderly persons often have numerous coexisting medical conditions that often complicate recovery. The time of year when most fatal and nonfatal collisions occurred was similar, with most collisions occurring in October (23.9%) and November (28.1%), which is the mating season for deer. Of the nonfatal collisions, 54.4% involved a direct collision with the animal, which is very similar to the 58% found in this study of fatal collisions. Although data from the FARS indicate animal-vehicle fatalities usually occur at night and are more likely to occur while a person drives on 1- or 2-lane rural roads, no information on these potential risk factors are provided in the CDC study. 2 Visibility is decreased at night, and driving while fatigued or drowsy makes lapses of attention more prevalent at night. 18
When we compare fatal animal-vehicle collisions with fatal nonanimal-vehicle collisions, we do find some similarities and differences. Demographically, the 2 groups are fairly similar except that fewer Hispanics are involved in animal-vehicle collisions and that the average age for animal-related fatalities is more likely to be between 36 and 55 years. Fatalities from animal-vehicle collisions are more likely to occur during the mating season of deer (October–November), at night, and while a person drives on 1- or 2-lane rural roads. In 2001, the NHTSA 19 reported that rural fatal collisions accounted for 61% of all fatal collisions. In rural areas, 54% of fatal collisions occur in the day. In contrast, 54% of urban fatal collisions occur at night. Nationally, approximately 89% of fatal collisions in rural areas occur on dark roadways with no artificial lighting. 19 Drivers involved in animal-vehicle collisions are less likely to be speeding or drinking than are drivers involved in nonanimal-vehicle collisions. Restraint belts were used in only 55% of fatalities where an animal was involved compared with 60% of nonanimal collisions. Collisions with animals were usually head-on, suggesting the driver was taken by surprise, did not see the animal, or was not prepared.
In a national study in 2001, motorcycles represented only 2% of registered vehicles. 20 Motorcycle deaths as a percentage of total vehicular deaths increased from 5% in 1997 to 8% in 2003. 21 This study found a much higher death rate of 28% among motorcycle riders involved in fatal collisions with animals. In fact, compared with a passenger car, per mile driven, a motorcycle rider is 32 times more likely to die in a collision according to vehicle miles traveled. 22 It is interesting to note that the study by the CDC 2 reported relatively few nonfatal hospitalizations from motorcycle-animal collisions, which would suggest that a motorcycle collision with an animal is likely to be fatal. A recent study by the Insurance Institute for Highway Safety 4 found that 65% of motorcyclists involved in a fatal animal-vehicle collision were not wearing their helmets compared with 43% of those reported in this study. The NHTSA 22 estimates that motorcycle helmet use reduces the likelihood of a collision fatality by 37%.
Nationwide, from 1992–1997, animals were responsible for 1% (n = 375) of all occupational fatalities, and 20% (n = 75) of these cases were from highway or off-road vehicle collisions. 23 Deer were responsible for 24 deaths, horses for 20, cattle for 15, dogs for 6, and other animals for 10. This study found that over 4% of the animal-vehicle collisions were reported to be work related.
Unfortunately, the FARS does have limitations. It does not provide information on the specific type of animal involved in the collision. Additionally, no information on the body system most likely injured is provided. Data on race and ethnicity are provided for only the past 6 years. Often the information provided is a best guess by the investigating officer when only a single person was involved in the fatal collision. Data on potential risk factors such as blood alcohol levels, avoidance maneuvers, or travel speed were often not recorded. Comparison of this study with the CDC nonfatal animal-vehicle injury study is limited because the CDC study did not provide information on the time of day or alcohol use, though it did have information on the species of animal involved and body system injured.
To help address the issue of type of animal involved in fatal animal-vehicle collisions, Williams and Wells, 24 with assistance from the NHTSA, obtained police reports on 147 fatal animal-vehicle collisions from 9 states during 2000–2002. Of these fatal collisions, 160 persons died. Deer were involved in 77% of the collisions, cattle in 9%, horses in 6%, dogs in 6%, and various other animals in 3%. Of the collisions, 80% involved single vehicles and 20% were multiple-vehicle events. Collisions with deer were most likely to occur during the times associated with hunting and breeding seasons, migrations, and yearling deer dispersing from their birth ranges (November, June, October), whereas collisions involving other animals occurred throughout the year. For nonfatal collisions, the CDC 2 found that 86.9% involved deer; 12.2% involved horses, cattle, or bulls; and 0.8% involved moose, elk, or bears.
As our data show, the number of fatal animal-vehicle collisions has increased over the past decade. The NHSTA's General Estimates System estimated an increase of 24% in the number of animal collisions reported to police from 1992–1993 to 2000–2001. 25 It is likely that both the fatal and nonfatal rates of animal-vehicle collisions will increase as both the numbers of vehicles on the road and the vehicle miles traveled are increasing. Also, there has been continued development and changing land-use patterns causing traffic to shift to rural areas heavily populated by deer.5,6,26 Additionally, the animal population appears to be increasing. Some researchers estimate that the white-tail deer population at the end of the 20th century in the United States was between 25 million and 30 million compared with 300 000 in 1920.27,28
What can be done to correct the problem? In a recent review, Hedlund et al 26 describe 3 general strategies to reduce collisions with animals: modifying driver behavior, modifying deer behavior, and reducing the number of deer. To affect driver behavior, methods must increase driver awareness of animals and the possibility of animal-vehicle collisions, improve the visibility of animals on approaching roads, and reduce driving speeds so that drivers have time to avoid collisions. Methods to affect animal behavior include strategies to physically block the animal from the road or make the road less attractive to the animal by appealing to its sight, smell, or sound senses. Physical control measures include fencing, underpasses and overpasses, and at-grade crossings. Sensory control methods proposed include reflectors, flagging, whistles, repellants, feeding stations away from the road, and salt alternatives in case animals are attracted to roads with salt applied to melt snow. Third, deer herd reduction may be effective. Expanding hunting seasons or increasing the number of deer harvested may decrease the population, though this practice is controversial. Methods to decrease the fertility of deer are also being evaluated. 29
On the basis of their review of the literature and scientific studies, Hedlund et al 26 believe that fencing combined with underpasses and overpasses are effective methods to decrease collisions. However, fencing is expensive to construct and maintain. Promising methods for which more research is needed include herd reduction, roadside clearing, temporary passive signs and active signs, and at-grade crossings possibly combined with signage. Methods with little demonstrated effectiveness include reflectors, roadside lighting, intercept feeding, and deer repellants. General education of drivers, passive signs, and lower speed limits appear ineffective in changing driver behavior and reducing collisions; however, these are usually components of comprehensive road safety programs. 30 Public service announcements during the months of October and November to remind people of the dangers during this period have been used in some states. Deer whistles and deer flagging are not effective.
Other ways to reduce the number of injuries from vehicle collisions with large animals include defensive driving, wearing seat belts or helmets, and being aware that because deer travel in herds there may be more than 1 deer crossing the road. Because work-related injuries from animal-vehicle collisions are not rare, training workers on this subject, especially in rural areas, should increase awareness of the problem, though what effect it will have needs further evaluation because education programs in general do not appear effective at changing driver behavior. Advances in motor vehicle technology and design, such as stronger glass, stronger support structures, stronger roofs, and remote sensing to detect animals entering highway right-of-ways, may prevent or decrease the number of human injuries.24,31
This study has found that motorcycle drivers appear to be at a high risk of a fatal event if they collide with an animal. Wearing helmets has been shown to decrease brain injuries and deaths compared with drivers without helmets who were involved in a collision. 22 Unfortunately, many states have repealed their helmet-use laws. In a recent survey, from 2000–2002, the use of helmets dropped from 71% to 58% nationally. 22 Legislators need to be made aware of the injury risk and health care costs from not wearing helmets and efforts made to require use of helmets on public highways.
In conclusion, both fatal and nonfatal injuries from animal-vehicle collisions are a significant public health problem. As the human population expands and encroaches upon natural areas for wildlife, the likelihood of an animal-vehicle collision increases. Outreach and education efforts especially targeting motorcycle riders, physical barriers, new vehicle technologies, and continued research in animal population control are all components of comprehensive programs that states must develop or expand upon to decrease the number of collisions with animals. This will protect not only humans but also the endangered and threatened wildlife population. 32
Footnotes
*
A version of this paper was presented at the North American Agromedicine Consortium Annual Meeting in Charlottesville, VA, June 27, 2005.