
Abstract
Background/Objective
We examined the changes in ventilation during sleep at high altitude using the LifeShirt monitoring system on 2 climbers who were attempting to summit Mount Aconcagua (6956 m).
Methods
Prior to the summit attempt, we measured cardiovascular and pulmonary function at 401 m (Rochester, MN) and gathered respiratory and cardiovascular data during sleep using the LifeShirt monitoring system with exposure to normobaric normoxia and normobaric hypoxia (simulated 4300 m). We then monitored the ventilatory response during sleep at 3 altitudes (4100 m, 4900 m, and 5900 m).
Results
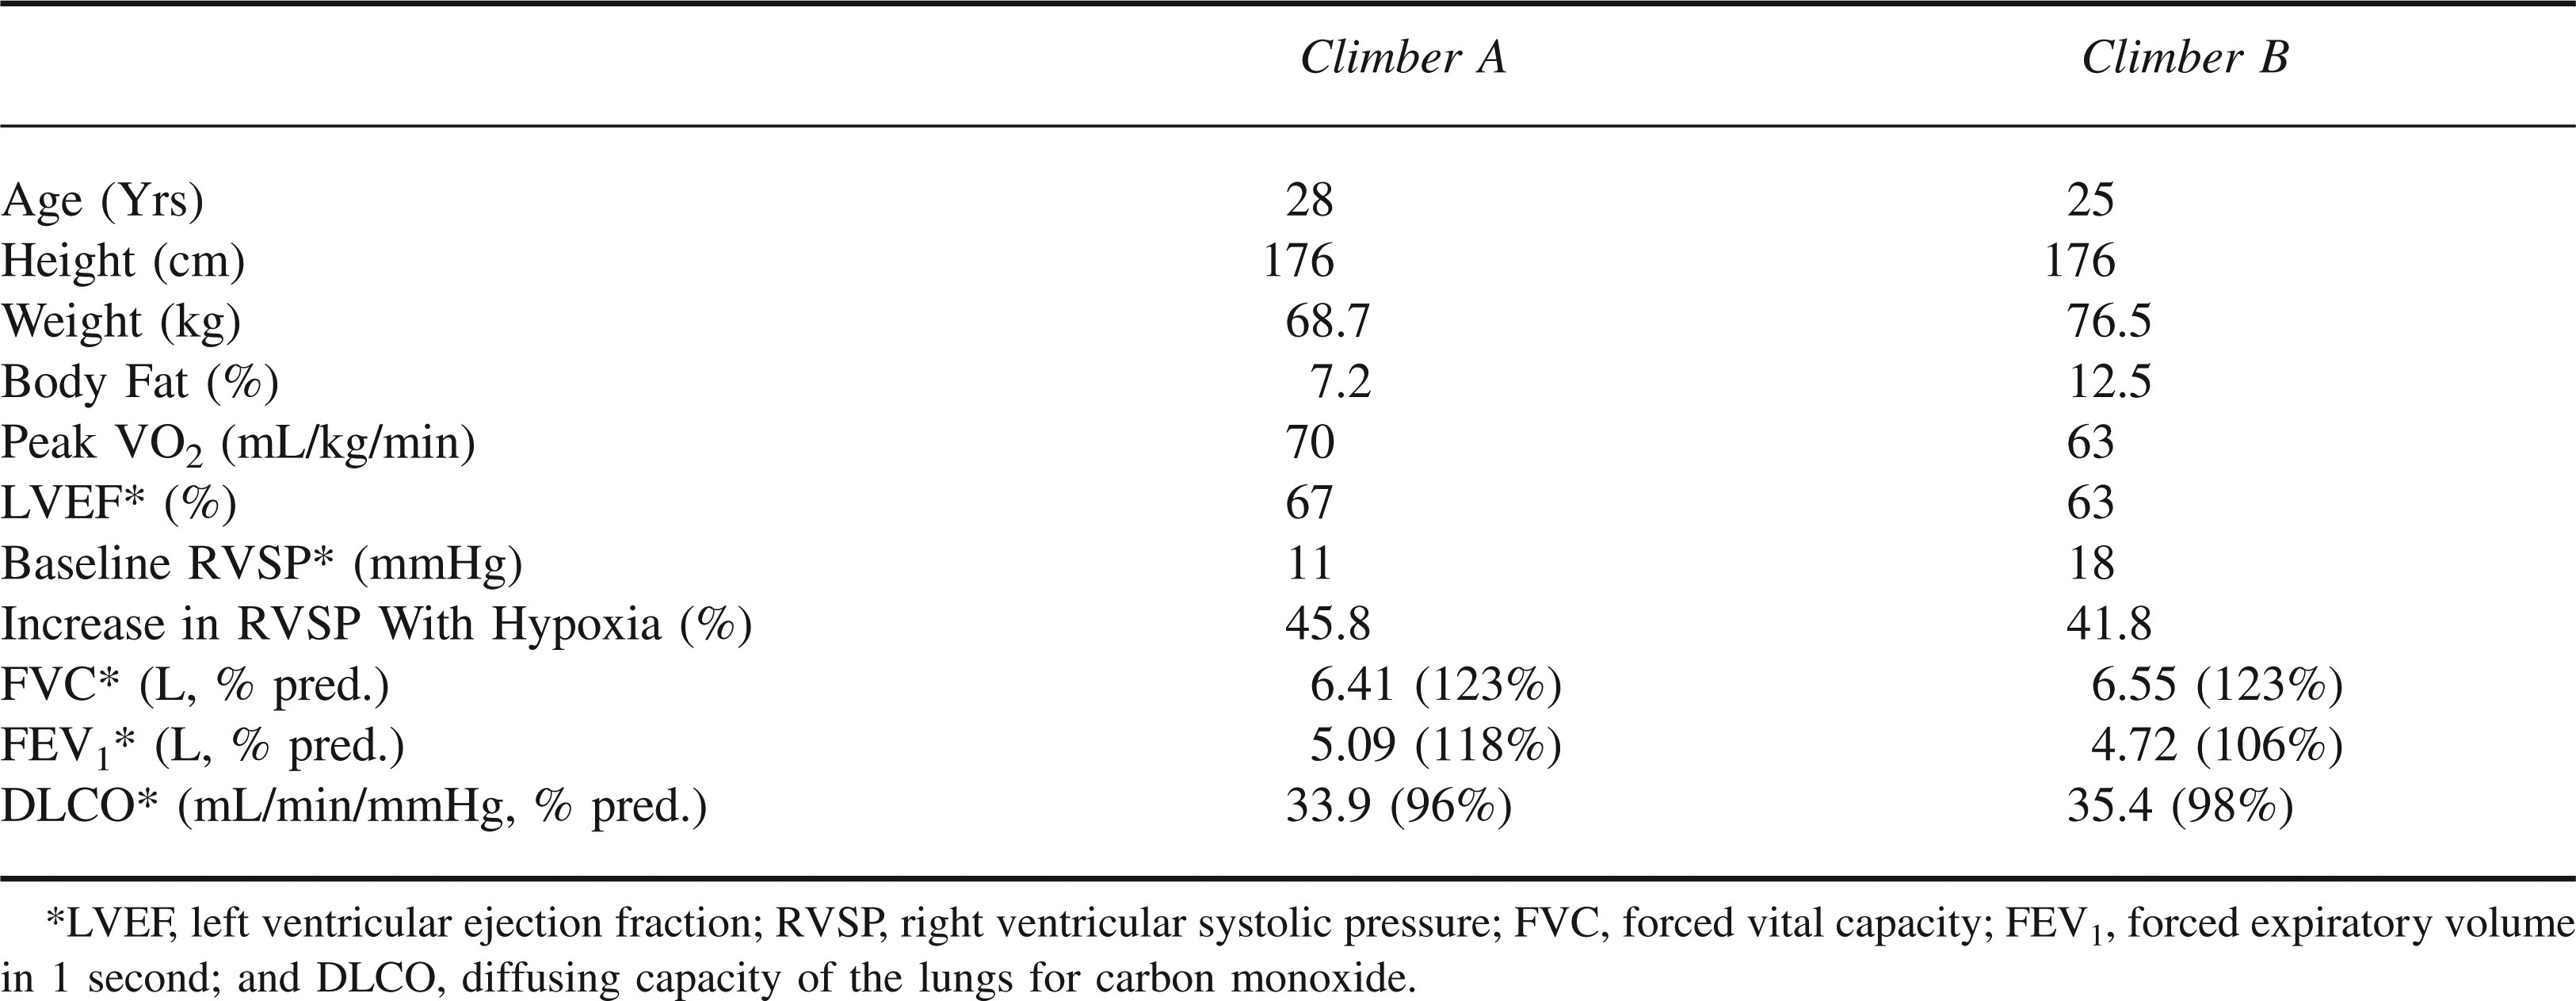
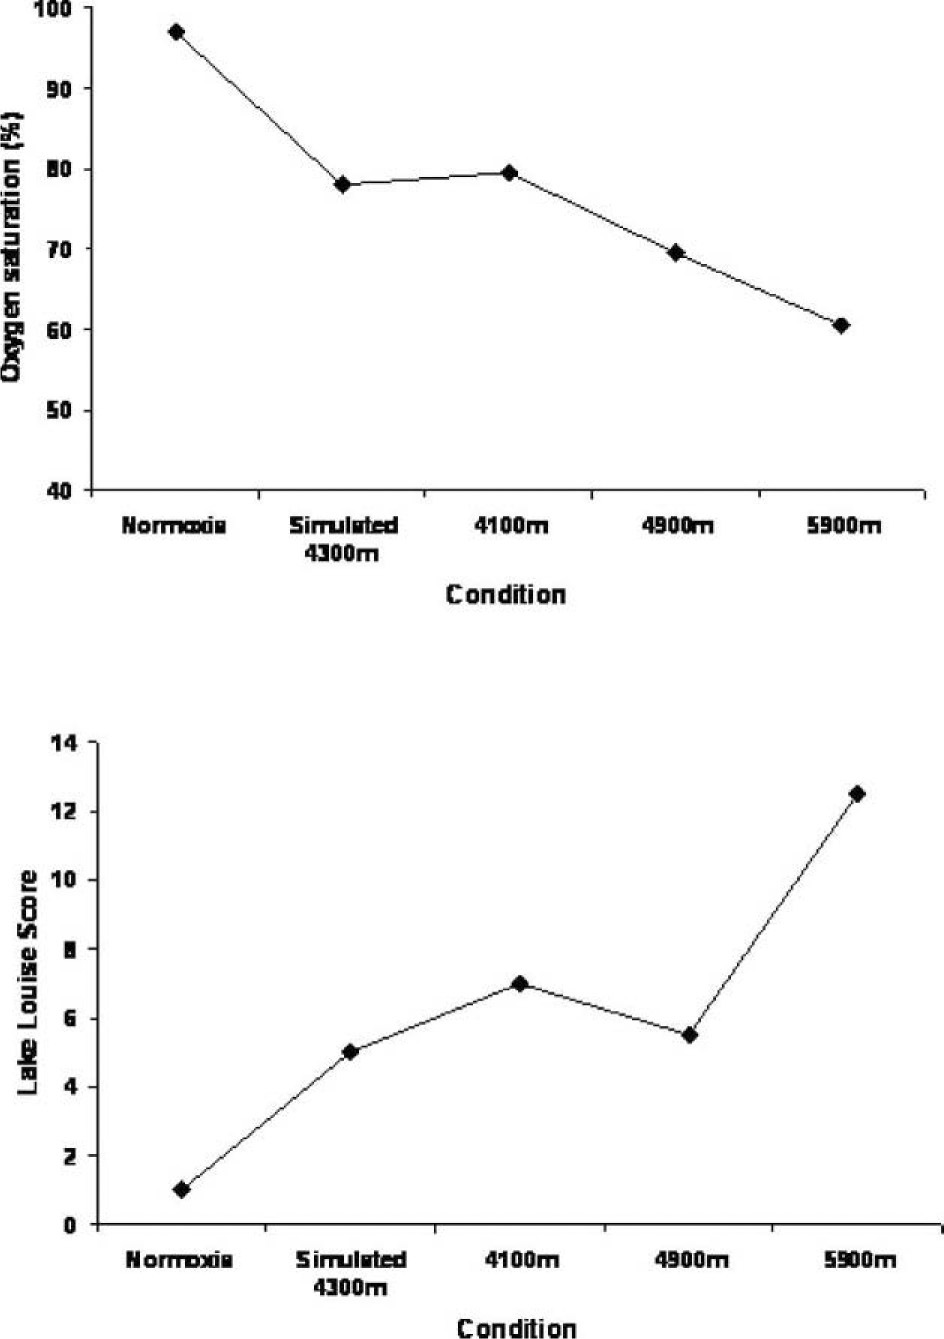
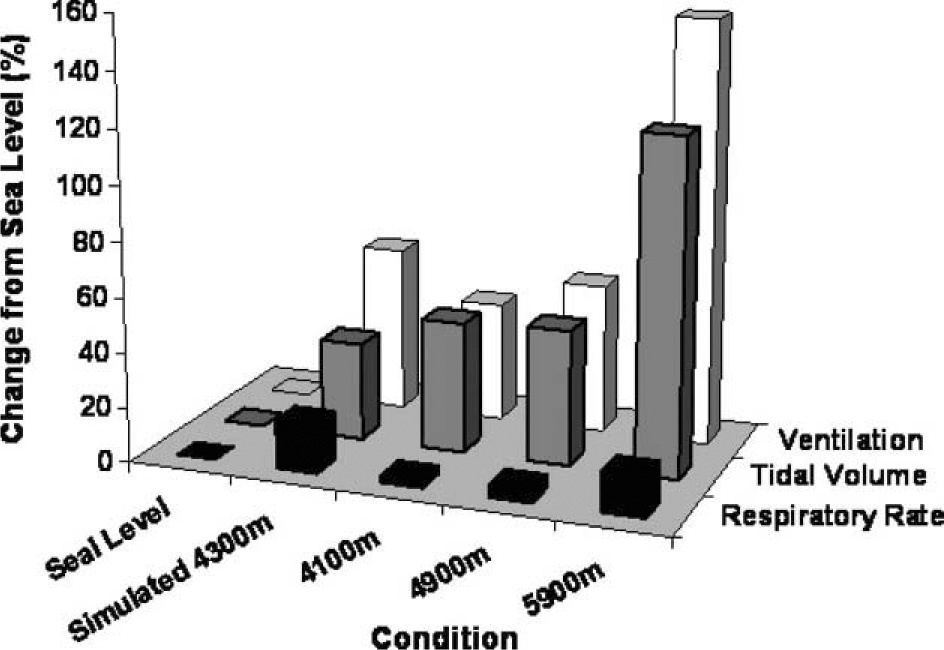
During normoxic sleep, subjects had normal oxygen saturation (O2sat), heart rate (HR), respiratory rate (RR), tidal volume (VT) and minute ventilation (VE), and exhibited no periodic breathing (O2sat = 100 ± 2%, HR = 67 ± 1 beats/min, RR = 16 ± 3 breaths/min, VT = 516 ± 49 mL, and VE = 9 ± 1 L/min, mean ± SD). Sleep during simulated 4300 m caused a reduction in O2sat, an increase in HR, RR, VT, and VE, and induced periodic breathing in both climbers (O2sat = 79 ± 4%, HR = 72 ± 14 beats/min, RR = 20 ± 3 breaths/min, VT = 701 ± 180 mL, and VE = 14 ± 3 L/min). All 3 levels of altitude had profound effects on O2sat, HR, and the ventilatory strategy during sleep (O2sat = 79 ± 2, 70 ± 8, 60 ± 2%; HR = 70 ± 12, 76 ± 6, 80 ± 3 beats/min; RR = 17 ± 6, 18 ± 4, 20 ± 6 breaths/min; VT = 763 ± 300, 771 ± 152, 1145 ± 123 mL; and VE = 13 ± 1, 14 ± 0, 22 ± 4 L/min; for 4100 m, 4900 m, and 5900 m, respectively). There were strong negative correlations between O2sat and VE and ventilatory drive (VT/Ti, where Ti is the inspiratory time) throughout the study.
Conclusions
Interestingly, the changes in ventilatory response during simulated altitude and at comparable altitude on Aconcagua during the summit attempt were similar, suggesting reductions in FiO2, rather than in pressure, alter this response.
Introduction
Exposure to altitude is known to cause several physiologic alterations in humans, most of which are compensatory in nature to improve arterial oxygenation and oxygen delivery. A number of studies have examined sleep patterns and ventilatory responses at a given altitude; however, fewer studies have examined ventilatory responses at increasing altitudes or altitudes greater than 5000 m or compared these responses to those which may occur during exposure to normobaric hypoxia. 1 –4 The comparison in the ventilatory response to high altitude and normobaric hypoxia is of interest because we have recently demonstrated a reduction in lung water (which is thought to be a stimulus for periodic breathing) following exposure to 17 hours of normobaric hypoxia. 5 This finding goes against traditional classical assumptions of hypoxia and lung fluid balance but is in agreement with animal studies.6,7 Previous work by Levine et al and Bland et al confirm these findings, suggesting a pressure effect may be necessary to cause lung fluid accumulation.8,9
Because of this apparent difference between normobaria and hypobaria on lung fluid balance, we sought to determine if there were similar differences in the ventilatory strategy during sleep with exposure to normobaric normoxia, simulated 4300 m (normobaric hypoxia), and at 3 increasing altitudes in 2 climbers who were planning an ascent of Mount Aconcagua (6956 m). We proposed that the ventilatory strategy during sleep would be altered as oxygen saturation (O2sat) decreased (with normobaric hypoxia and increasing altitude) and that the ventilatory responses to normobaric hypoxia would be similar to a comparable pressure altitude.
Methods
Subjects
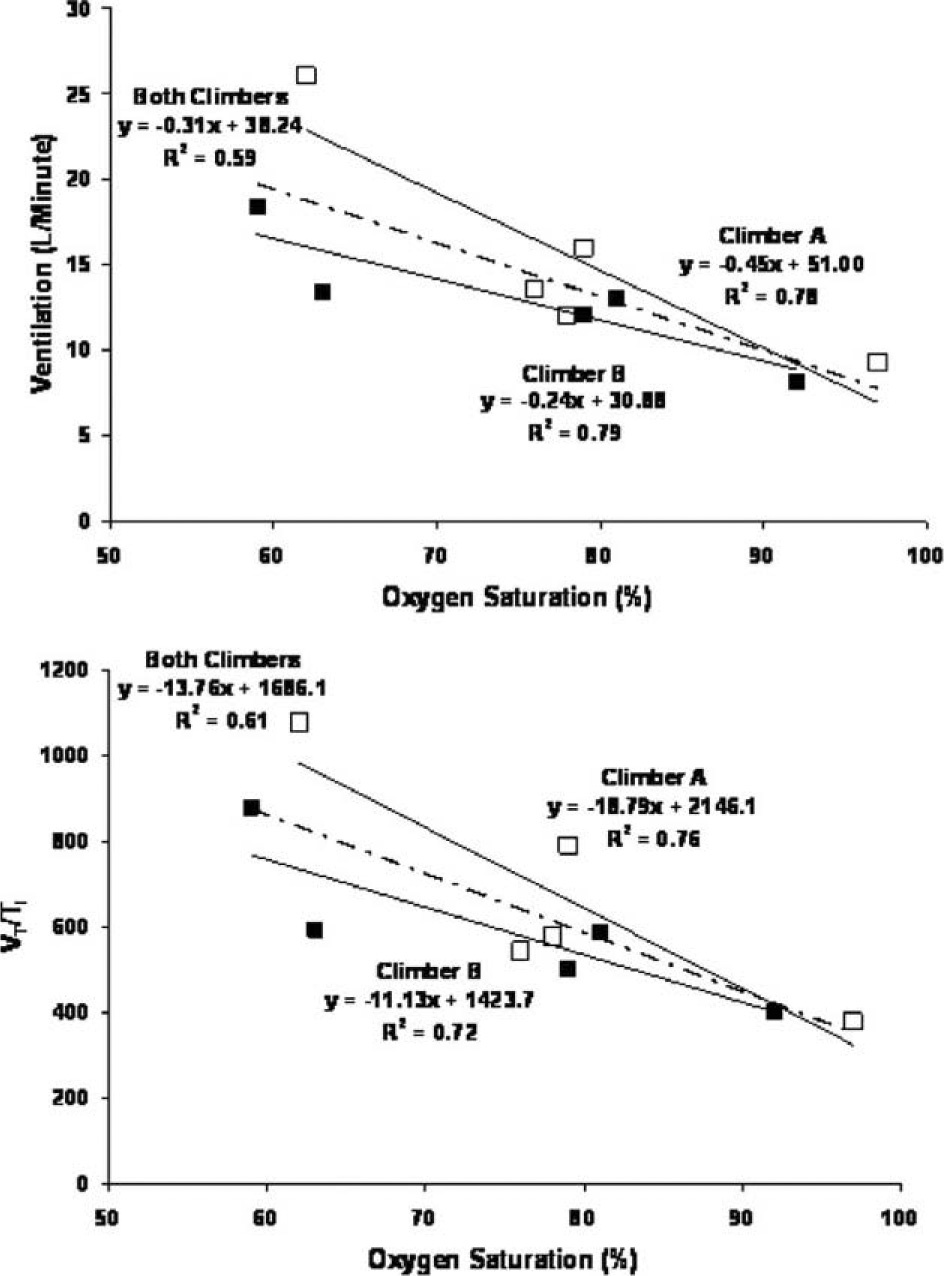
Two male climbers, who were planning a trip to Mount Aconcagua (6956 m) in Argentina agreed to visit our laboratory for screening tests and assessment of breathing pattern (minute ventilation [VE], tidal volume [VT], and respiratory rate [RR]), heart rate (HR), and O2sat during sleep under normal conditions (normobaric normoxia) and simulated 4300 m prior to their ascent. The subjects were sea-level natives and had not been to high altitude within 4 months of the study. The protocol was reviewed and approved by the Mayo Clinic Institutional Review Board, and the participants provided written informed consent prior to the study. Both climbers were healthy and had no cardiopulmonary abnormalities as determined with screening studies.
Protocol Summary
The climbers initially spent several days in our laboratory at the Mayo Clinic in Rochester, MN, where they performed screening tests as well as sleep studies. Screening tests included pulmonary function testing, a resting echocardiogram, baseline blood tests (including a complete blood count), and a cycle ergometry test to exhaustion while making classical metabolic measurements (VO2, VCO2, ventilation). Following baseline tests, we instructed the subjects on the use of a previously validated monitoring system (LifeShirt, Vivometrics, Ventura, CA). 10 The climbers then performed 2 sleep evaluations, the first under normal conditions (barometric pressure 732 mm Hg, range 730–733; FiO2 20.95%), and the second in a hypoxia tent simulating approximately 4300 m (barometric pressure 732 mm Hg, range 731–733; FiO2 12.5%, Colorado Altitude Training, Boulder, CO) located in the General Clinical Research Center (GCRC). In addition to the data collected wearing the LifeShirts, measures of HR, O2sat, RR, and blood pressure were also made by the GCRC nursing staff throughout the night. Tent O2 and CO2, as well as barometric pressure, temperature, and humidity were recorded every hour (O2 and CO2 were assessed using a Crowcon Triple Plus+ gas analyzer, United Kingdom; barometric pressure, temperature, and humidity were assessed with a Davis Perception II analyzer, Hayward, CA). Following the completion of the baseline tests and the nighttime monitoring under the 2 conditions in our lab, along with confirmation that the climbers adequately understood the LifeShirt system, the subjects left for their summit attempt.
The monitoring systems were subsequently worn by the climbers during sleep, within the first day of arrival, at 3 altitudes (4100 m, 4900 m, and 5900 m). Following the summit attempt the subjects returned to our laboratory for data transfer and debriefing.
Subject Monitoring
LifeShirt use
All LifeShirt sessions were performed during quiet rest and sleep. The monitoring system allowed for the noninvasive assessment of O2sat (finger pulse oximetry), HR (electrocardiogram), and ventilation (chest and abdominal Respitrace bands). Subjects were properly fitted for the monitoring system and carefully instructed on use of the system while in our laboratory. Prior to each use, the system was calibrated using a fixed bag volume provided by Vivometrics. All data from the monitoring system were analyzed using the VivoLogic version 2.7.1 software provided by Vivometrics.
Lake Louise survey
During exposure to normobaric normoxia, simulated 4300 m, and at all 3 levels of high altitude, the climbers completed the Lake Louise questionnaire for symptoms of high altitude illness. This questionnaire has been shown to be a useful tool for assessment of symptoms of high-altitude illness, including high-altitude pulmonary edema and high-altitude cerebral edema. 11 The Lake Louise survey was used to assess the relationship between increases in Lake Louise score and changes in physiologic parameters with exposure to hypoxia and during the ascent. In this survey, the climbers were asked a series of questions that ranged from gastrointestinal discomfort to evidence of systemic edema, with additional questions regarding dyspnea and general fatigue. The climbers filled out the Lake Louise questionnaire during quiet rest upon waking in the morning hours.
Assessment of periodic breathing
Periodic breathing (PB) was assessed visually by a technician who was blinded to the condition of the climbers. A pause in tidal breathing of 10 seconds or greater was used to define an apnea. In addition to the number of apneas throughout the night, we also assessed the amount of time each climber breathed in a PB pattern relative to the entire night (determined from the start of the apnea to the termination of subsequent tidal breathing which coincided with the start of the following apnea).
Data Analysis
Key measurements obtained from the screening studies included body fat (%), peak oxygen uptake, left-ventricular ejection fraction, pulmonary arterial systolic pressure, spirometry, and the diffusing capacity of the lungs for carbon monoxide. Ventilatory data obtained from the LifeShirt included measures of VE, VT, RR, VT corrected for inspiratory time (as an index of ventilatory drive), and O2sat. We also quantified the difference in O2sat and HR with and without PB.
Results
Both climbers completed all portions of the screening studies and successfully climbed and summited Mount Aconcagua. The climbers had normal cardiovascular and pulmonary function at rest and during exercise at sea level (subject characteristics, Table 1). Baseline values for O2sat, HR, and ventilatory responses during sleep for normobaric normoxia were O2sat = 98 ± 1%, HR = 67 ± 1 beats/min, RR = 16 ± 3 breaths/min, VT = 516 ± 49 mL, and VE = 9 ± 1 L/min, mean ± SD. Neither subject had episodes of PB during sleep under the baseline condition.
Subject characteristics of the Aconcagua climbers
Exposure to Normobaric Hypoxia and Altitude
Symptoms, ventilatory responses, and quantification of PB at baseline, normobaric hypoxia, and all 3 altitudes are shown in Figures 1 through 5.
Changes in oxygen saturation and symptoms (Lake Louise score) with exposure to normoxia, simulated 4300 m, and 3 increasing altitudes. The top panel represents the oxygen saturation, while the bottom panel represents the Lake Louise score. The X-axis represents the condition.
Changes in ventilation during sleep with exposure to normoxia, simulated 4300 m, and 3 increasing altitudes. The X-axis represents the variable assessed, the Y-axis represents the condition, and the Z-axis represents the percent change from normobaric normoxia. The open bars represent change in ventilation, the black-filled bars represent the change in respiratory rate, and the gray-filled bars represent the change in tidal volume.
Relationship between oxygen saturation and ventilation and ventilatory drive. The top graph represents the relationship between changes in oxygen saturation and ventilation; the bottom graph represents the relationship between changes in oxygen saturation and ventilatory drive (VT/Ti).
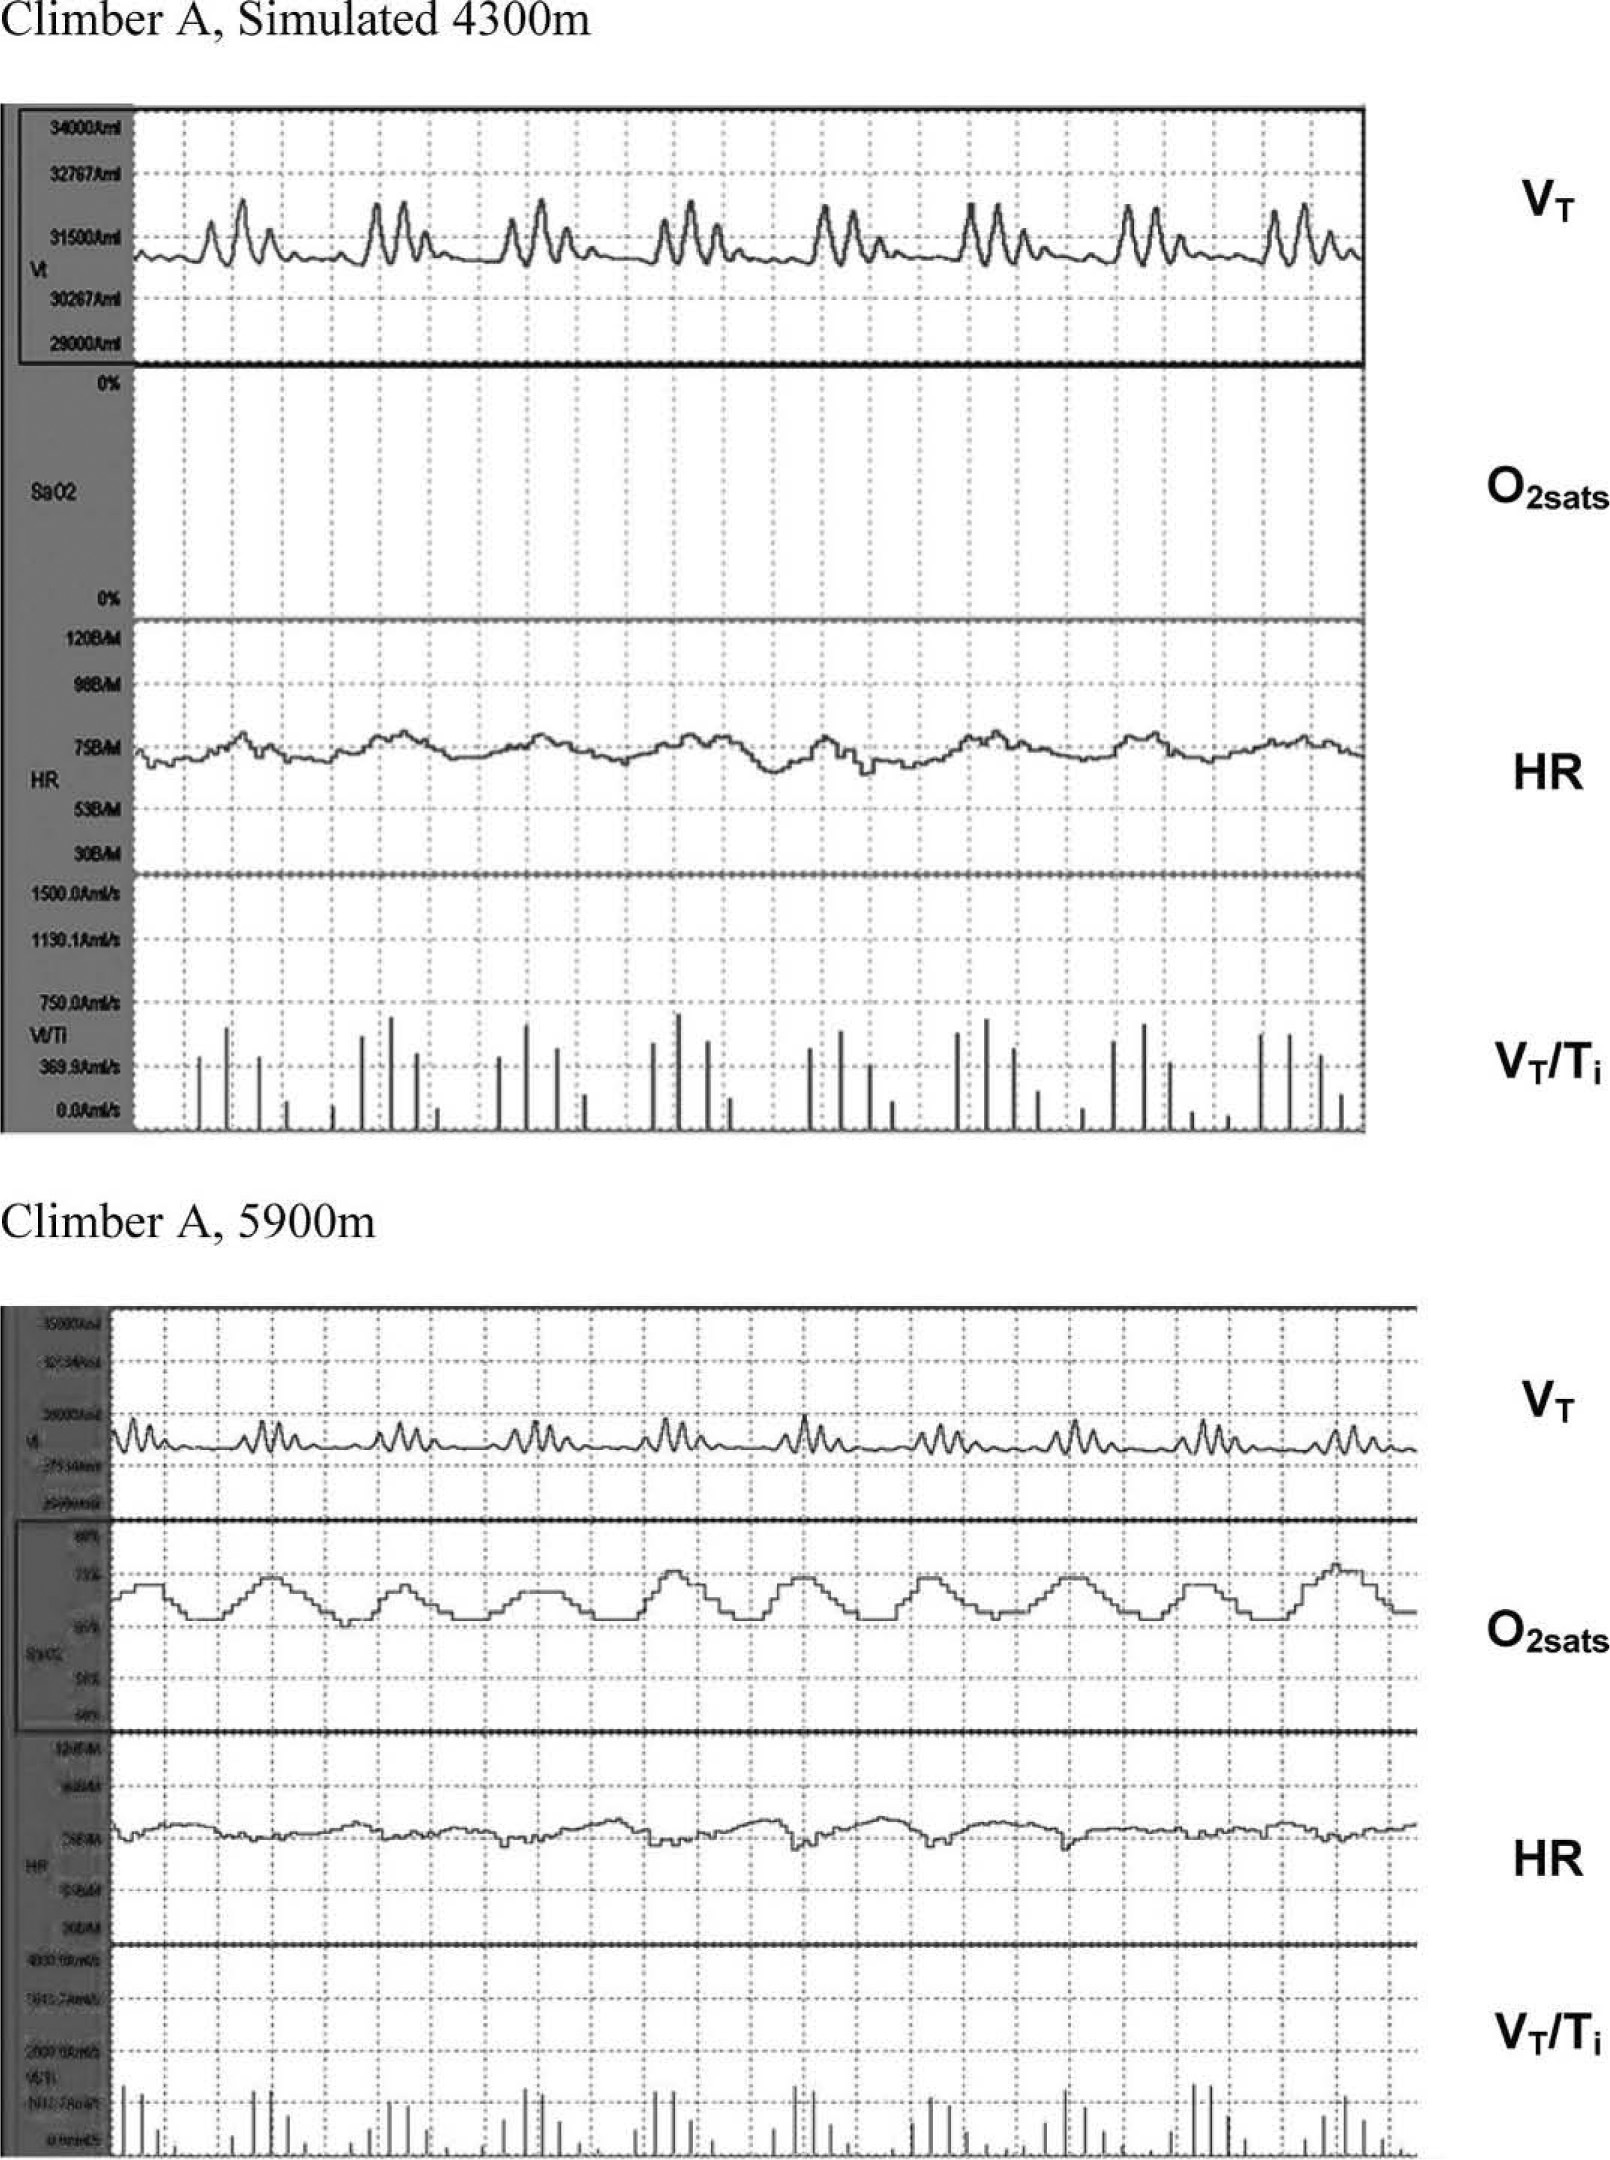
Example of periodic breathing (PB) in both climbers during simulated 4300 m and at 5900 m. The top 2 figures represent an example of PB during sleep in climber A, while the bottom graph represents an example of this breathing pattern in climber B, both at simulated 4300 m and 5900 m, respectively. The top segment of both graphs is a tracing of that individual's tidal volume, the second segment represents O2sat, the third segment heart rate, and the fourth segment ventilatory drive (VT/ Ti).
Amount of periodic breathing during sleep with exposure to normoxia, simulated 4300 m, and 3 increasing altitudes. The top graph is the average amount of apneas observed per hour in both climbers. The bottom graph is the average amount of time periodic breathing during rest and sleep in both climbers. The X-axis represents the condition.
Simulated 4300 M and High Altitude
During sleep with exposure to normobaric hypoxia, O2sat dropped and HR, RR, VT, and VE all increased (O2sat = 79 ± 4%, HR = 72 ± 14 beats/min, RR = 20 ± 3 breaths/min, VT = 701 ± 180 mL, and VE = 14 ± 3 L/min) (Figures 1 through 3) relative to the baseline condition. One of the climbers, with a history of symptoms of headaches at high altitude, developed a severe headache (3 on a scale of 0 to 3) following his overnight stay in the hypoxic environment, which resolved quickly following removal from the tent. Both climbers exhibited PB during the night with exposure to normobaric hypoxia that averaged 5% of the time subjects wore the LifeShirts (Figures 4 and 5).
Neither climber took any medications (other than for mild pain relief) to aid in their ascent or to curb acute mountain sickness (ie, acetazolamide, sildenafil). O2sat decreased incrementally, while HR, RR, VT, and VE all increased incrementally with progressive increases in altitude (O2sat = 79 ± 2, 70 ± 8, 60 ± 2%; HR = 70 ± 12, 76 ± 6, 80 ± 3 beats/min; RR = 17 ± 6, 18 ± 4, 20 ± 6 breaths/min; VT = 763 ± 300, 771 ± 152, 1145 ± 123 mL; and VE = 13 ± 1, 14 ± 0, 22 ± 4 L/min; for 4100 m, 4900 m, and 5900 m, respectively). In addition, the occurrence of PB increased with each increasing altitude (percent of night = 10, 14, and 20, for 4100 m, 4900 m, and 5900 m, respectively).
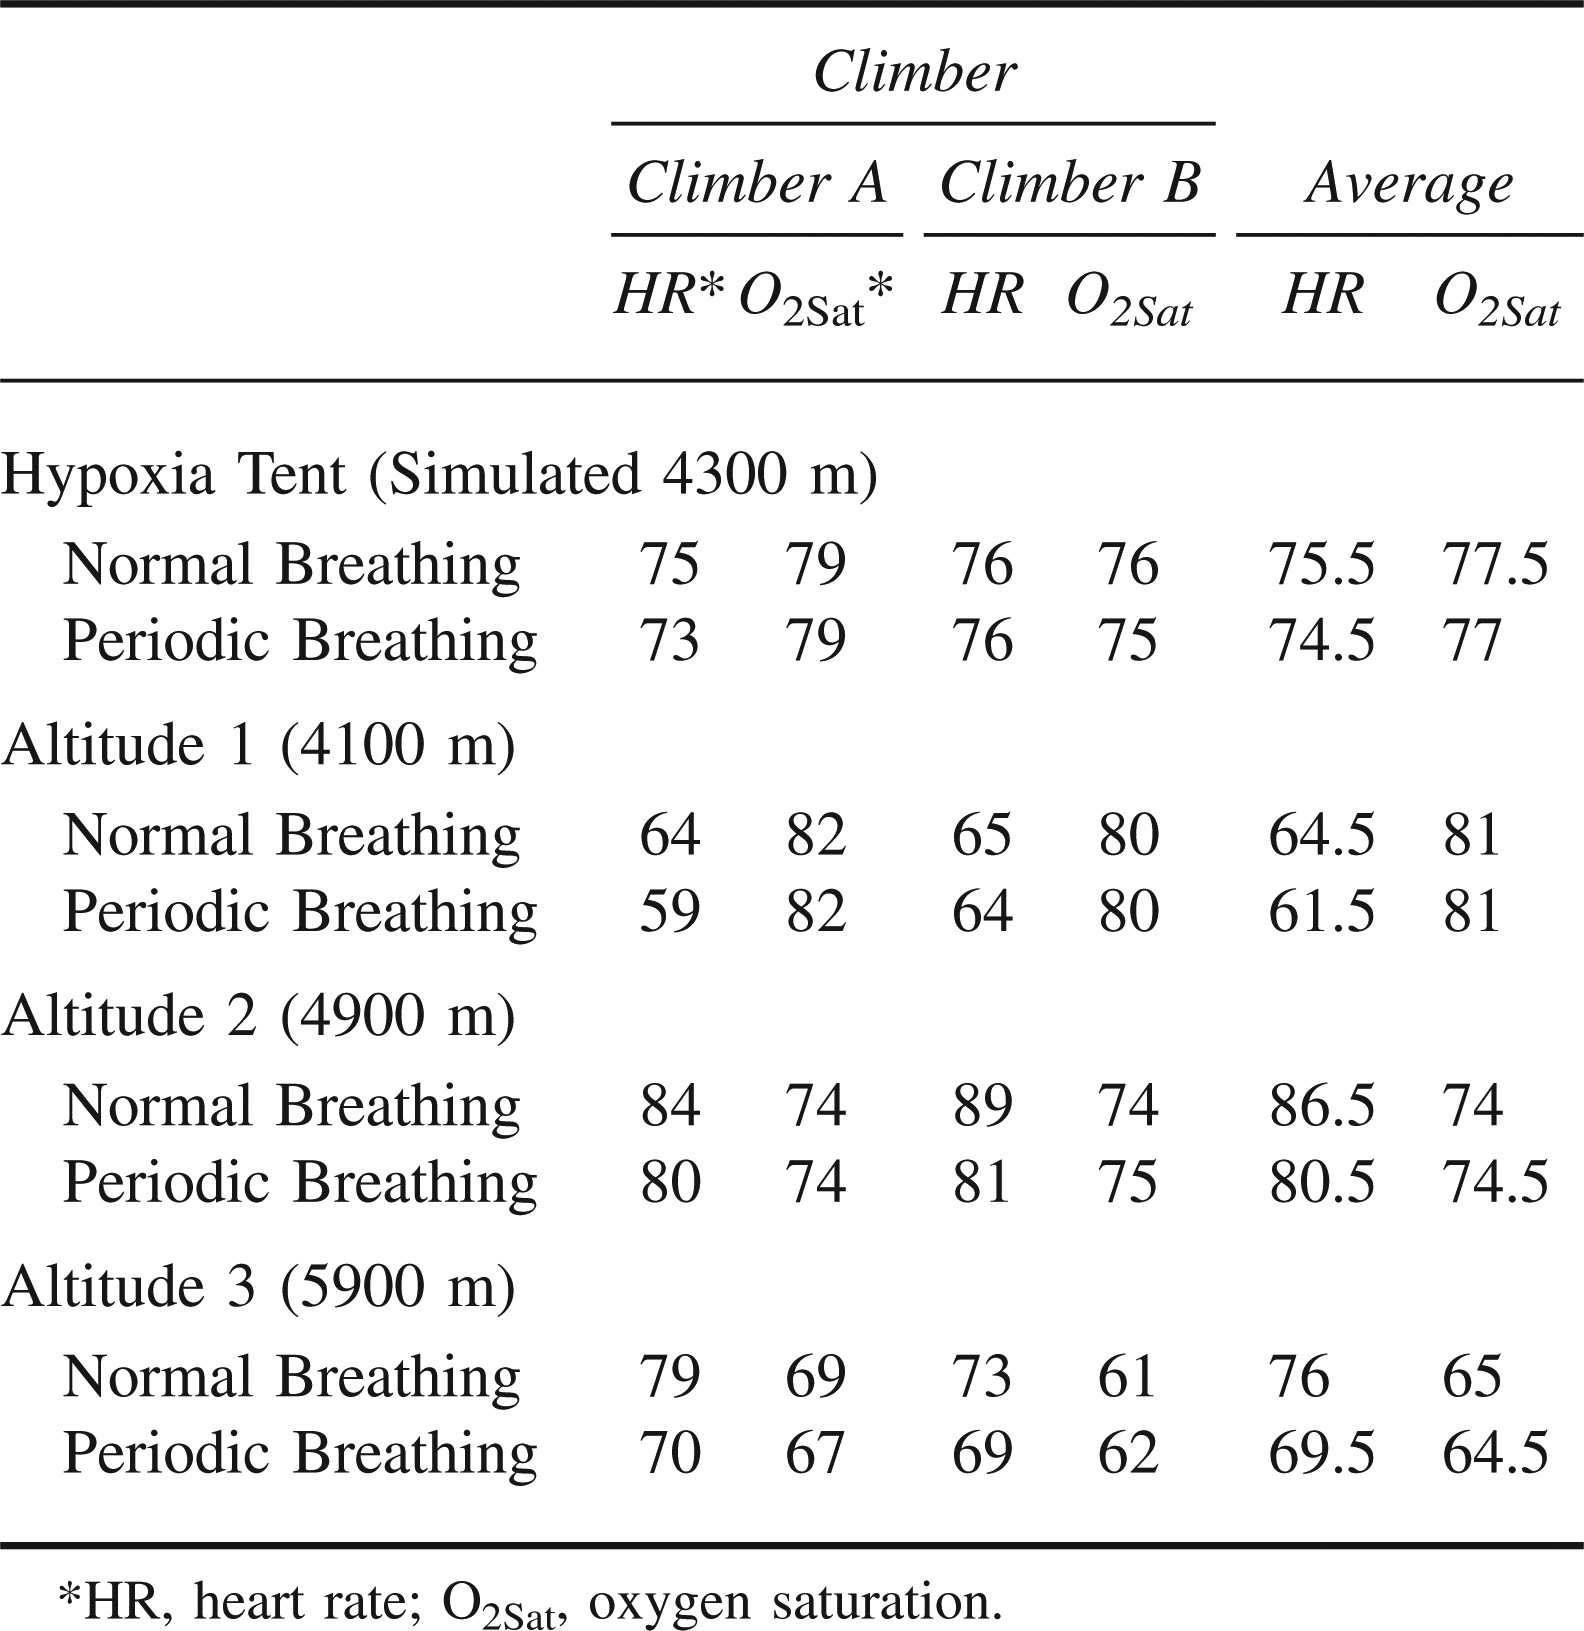
There was a strong relationship between O2sat and VE and our index of ventilatory drive in each of the climbers throughout the study. The average O2sat was the same during periods of PB and normal breathing with exposure to normobaric hypoxia and at all 3 altitudes (Table 2). However, HR was lower during PB relative to normal breathing with exposure to hypoxia and at all 3 altitudes. As with simulated altitude, the climber with a history of headaches at high altitude developed a 3 out of 3 headache on the final night of data collection (5900 m).
Oxygen saturation and heart rate during normal breathing and during periodic breathing in Aconcagua climbers
Discussion
Although there have been a few studies examining the ventilatory patterns during sleep with progressive increases in altitude, fewer studies have examined the response to a full night of rest with exposure to normobaric normoxia, normobaric hypoxia, and at increasing altitudes in the same subjects. 1 –4,12 In addition, there are differences between pressure altitudes and normobaric hypoxia that could influence ventilatory control during sleep. 13 In the present study, we evaluated the ventilatory responses during sleep in 2 climbers at sea level, simulated 4300 m, and during sleep on a climb of Mount Aconcagua, at 4100 m, 4900 m, and 5900 m. We observed declines in O2sat that were consistent with the inspired partial pressure of oxygen. In both climbers, the decline in O2sat was associated with progressive increases in an index of ventilatory drive (VT/Ti), with a corresponding increase in VE. Most sojourners to high altitude exhibit an increase in the drive to breathe associated with increases in VE. 13 –16 In the present study, the increase in VE was due primarily to an increase in VT as RR changed only slightly. The increase in VE with altitude is thought to be a result of an increased drive to breathe signaled by the peripheral chemoreceptors in response to the reduction in arterial O2. 16 Symptoms as assessed by the Lake Louise questionnaire also paralleled the changes in altitude, the decline in O2sat, and the rise in VT/Ti and VE. A clear novelty of the present study is the use of a portable monitoring system with the capability to gather data “in-the-field” during ascent to high altitude.
Periodic breathing has been observed in climbers for over a century and is thought to occur in most climbers ranging anywhere from 0% to 93% of the total sleep time. 17 In the present study, the amount of PB and the percentage of time spent in this breathing pattern also increased with progressive increases in altitude. Interestingly, the stimulus resulting in PB appeared to be independent of whether this was achieved with hypoxic gas or changes in barometric pressure with altitude, but the amount of PB was greater with altitude when compared to normobaric hypoxia despite similar O2sat. This is a novel finding because previous work has compared the ventilatory responses in a laboratory setting and “in-the-field,” but the laboratory was located at high altitude, rather than comparing normobaric hypoxia to hypobaria. Interestingly, the stimulation resulting in PB appeared to be independent of whether this was achieved with hypoxic gas or changes in barometric pressure with altitude; however, the amount of PB tended to be slightly greater with altitude exposure compared to normobaric hypoxia despite similar O2sat.
The average O2sat during PB was similar to non PB; however, the average HR was lower with PB. This is likely because of differences in the average respiratory rate during non PB and PB. Although the VE during PB and non PB were similar, RR was attenuated. A recent study by Narkiewicz has demonstrated a strong relationship between RR, sympathetic activity, and HR. 18 From the standpoint of maintaining mean arterial oxygenation, it does not appear that PB results in any significant advantage or disadvantage as observed previously; 12 however, there were greater oscillations in O2sat during periods of PB, which could play a role in neurohumoral activation from the intermittently greater hypoxemia.
The present study is limited in its conclusions due to the small number of subjects and is, therefore, descriptive in nature, but the data are unique and may provide a basis for larger, more sophisticated and mechanistic studies.
Conclusions
The climbers successfully reached the summit after a 2-week trek. The climbers exhibited similar ventilatory responses with altitude (4100 m) and with hypoxia (simulated altitude of 4300 m) with similar reductions in O2sat. There was a tendency for more of a tidal volume response to breathing at altitude vs breathing hypoxic gas, which may be because the subjects had no acclimatization with exposure to normobaric hypoxia but had some acclimatization at a similar altitude. Periodic breathing was common in both climbers, present with simulated altitude, and progressively increased over the proportion of the night with increasing altitudes, but did not alter the average O2sat during sleep.
Footnotes
Funding
This work was supported by NIH Grants HL71478, and AHA Grant 56051Z. We would like to thank Kathy O’Malley and Angela Heydman for their help with data collection, and Renee Blumers for her help with manuscript preparation, as well as the tremendous efforts of the 2 climbers, and Vivometrics for their continued help and support. We would also like to thank the staff of the Mayo Clinic General Clinical Research Center (GCRC) for their assistance throughout this study. The Mayo Clinic GCRC is supported by US Public Health Service grant M01-RR00585.