
Abstract
An intelligent recognition algorithm was developed to identify fibers in the cross sections of blended yarn containing meta-aramid 1313 (Nomex), poly(phenylene-1,3,4-oxadiazole) (POD), flame resistant viscose, and flame-resistant vinylon. The yarn cross section image was obtained at x400 magnification. Drawing software was used to manually isolate single fiber images for training the back propagation (BP) neural network model in Matlab language image processing software. The GrabCut algorithm was used to de-noise the image and separate the target from the background. Finally, single fiber images and fiber distributions were obtained through the program. The result showed that the BP neural network model with the GrabCut algorithm can identify fiber type in a complex background more easily and more accurately than traditional algorithms.
Introduction
Identification of extremely similar fibers is always an important topic in the textile industry. 1 Traditional image recognition is based on text retrieval technology. Usually, the quality of cross-sectional fiber image is affected by the slicing and imaging device. Many novel fiber identification methods based on the extraction and analysis of morphological features were proposed to solve these problems.2-4 The combination of BP neural network model and GrabCut algorithm can be used to enhance the edge information of the fiber and increase the contrast between fibers and the back-ground. 5 The intelligent identification of multi-component fame-resistant blended yarn using the BP neural network model and GrabCut algorithm is described in this article.
Experiment
The quality of cross-sectional slice images of fame-resistant blended yarns depends on the technical operations of the dyeing, surface modification, embedding, and slicing. Dyeing makes the color of each component in the fame-resistant blended yarns more vivid, highlighting the characteristics of each component, make them differ-ent from each other and conveniently observed under the microscope. Modification of the fiber surface more strongly combines the fiber with the embedding agent in the yarns. When the fiber surface is rough, it is not required to be surface-modified, but when it is not hydrophilic and the surface is smooth, modification is required. Embedding is the step before the slicing process, used to hold the slender and soft yarns, make it more convenient to slice and keeping the fiber from moving after slicing. Slicing is a necessary step to obtain the cross section of the fame-resistant blended yarns. The quality of the slice determines whether the ideal fiber cross section can be observed. These steps are all necessary prerequisites for intelligently identifying fibers through computer technology.
Experimental Materials, Reagents, and Instruments
Fibers used in the study were meta-aramid (Taparan) 1670 dtex/1000f, POD 1.67 dtex*70 cm, flame resistant viscose 200 dtex/50 f, and flame resistant vinylon 1.5 dtex*70 cm. The fibers formed flame resistant blended yarns 36 s.
Reagents were Argazol Red NF-3B, Cationic Blue SD-GSL, citric acid, sodium dihydrogen phosphate, penetrant JFC, E44(6101) epoxy resin, 650 low molecular polyamide resin, and flexibilizer DBP.
Instruments were an AL104 electronic balance, JT601N electronic balance linkup series infrared dyeing machine of high temperature and high pressure, STR/I plasma processor, Y802N 8-basket conditioning oven, KD-202 hand-style slicer, CX41RF microscope, and KQ-700B ultrasonic cleaner.
Experimental Method
Flame-resistant blended yarns were dyed at a concentration of 75:1, using 2% Argazol Red NF-3B and Cationic Blue SD-GSL by a two-bath, two-step process.
Plasma treatment was used in surface modification of the fiber, which can not only make the fiber better combine with the embedding agent by obtain hydrophilicity but also resolve fiber slippage and other problems. An STR/I plasma processor was used for 240 s with vacuum of 0.7 MPa.
Epoxy resin as the embedding agent increases the hardness of the embedded body and completes the mechanical continuous slice operation. The embedding agent was epoxy resin: DBP: low molecular polyamide resin at a ratio of 100:5:90.
The KD-202 rotary slicer was used for slicing. Slice thickness was set to 10 μm and the surface environment of the slicing was epoxy resin.
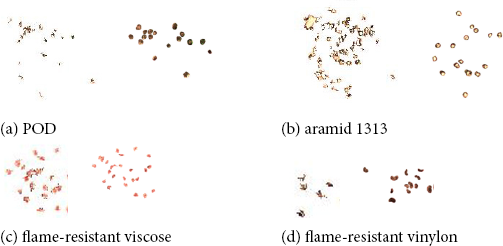
As can be seen from Fig. 1, the Aramid 1313 has a blue circular cross section with white core; POD has the blue circular cross section and dyeing uniformity; the flame-resistant viscose has a clear red serrated cross section; the flame resistant vinylon has a round section of the waist and the color is black. Each fiber can be clearly identified by the human eyes.
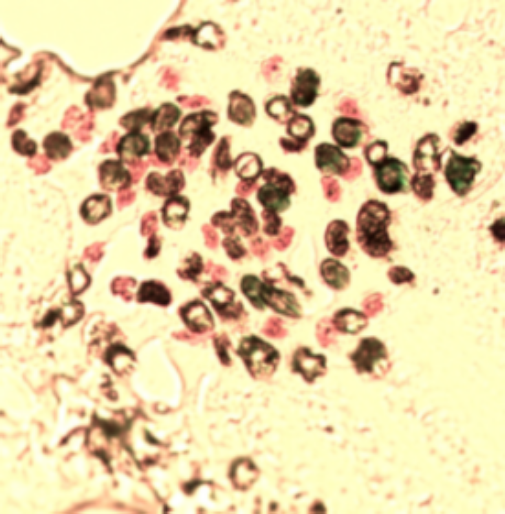
Slice diagram obtained under the best process.
To obtain a more ideal sample, Photoshop image processing software was used to manually extract the fiber from the image to be identified. The main steps were:
Create a folder and four single-fiber folders under this folder;
Use the Photoshop “brush” tool to manually distinguish the fiber image;
Use the “quick selection” tool to add each fiber to the selection, copy the background layer and create the mask layer of each fiber;
Use the “Cut” tool to cut out each single fiber in the mask layer and save them in the PNG format to their respective folders.
BP neural network is a multi-layer forward network, which is composed of an input layer, output layer, and hidden layer (one layer or multi-layer).6–7 A typical three-layer BP neural network model is shown in Fig. 2. The BP neural network model used in this article is shown in Fig. 3.
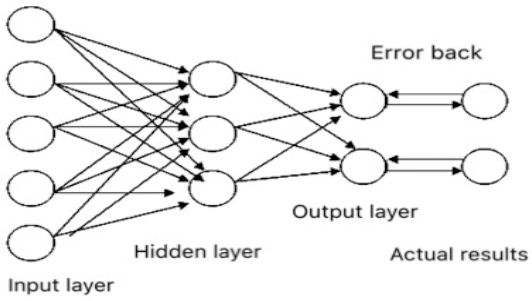
A typical BP neural network model.
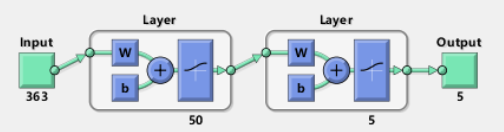
The BP neural network model in this paper.
The process assumes that the number of elements in the input layer, the intermediate layer, and the output layer are N, L, and M0 respectively. X = (x0, X1,…, xN-1) is the input vector added to the network; H = (h0, h1,…, hL-1) is the intermediate layer output vector; Y = (y0, y1, …,yM-1) is the actual output vector of the network; D = (d0, d1, …, dM-1) is used to represent the target output vector for each mode in the training group. The weight of the output unit i to the hidden unit j is Vij; The weight of the hidden unit j to the output unit k is Wjk. In addition, θk and Øj are used to represent the threshold value of the output unit and the hidden unit, respectively.
The transfer function reflects the impulse strength of the stimulus of the lower layer input to the upper node, it is also called the stimulus function, and generally take the continuous value Sigmoid function in (0, 1), which is:
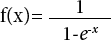
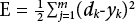
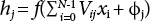
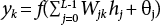
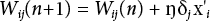
In the formula, j is the serial number of the node; i is the serial number of the hidden layer or input layer node. X'i is the output of node i or external input; n is the learning rate and δj is the error term.
In the first step, the weights and threshold value are initialized with a uniformly distributed random number. Next is training with the sample data. The input vector X and the target vector D are loaded; outputs H and the hidden layer and the output layer Y are calculated; error of the output layer is calculated; and the hidden layer unit error is calculated. Weight and threshold value are modified with Eq. 2–5. The error signal is returned along the original continuously and the weight of each layer of neurons is modified to propagate to the input layer one by one. After the forward propagation process, the two processes are repeated to minimize the error signal. Calculations determine whether all the errors meet the requirements. If the requirements are satisfied, the learning ends; otherwise, the output layer error is recalculated. In the third step, information vector X is input and output vector Y is determined by simulation, calculation, and prediction.
To dry the image and separate the fiber from the background, the powerful GrabCut algorithm was selected to process the image in this article. The algorithm can process the color image and simultaneously complete the separation of the target image from the background. GrabCut algorithm is one of the mature applications for image segmentation at present. The basic idea of the GrabCut algorithm is to map the whole image to an s-t network diagram as shown in Fig. 4 where the source point s represents the foreground endpoint, and the sink point t represents the background point.8–9
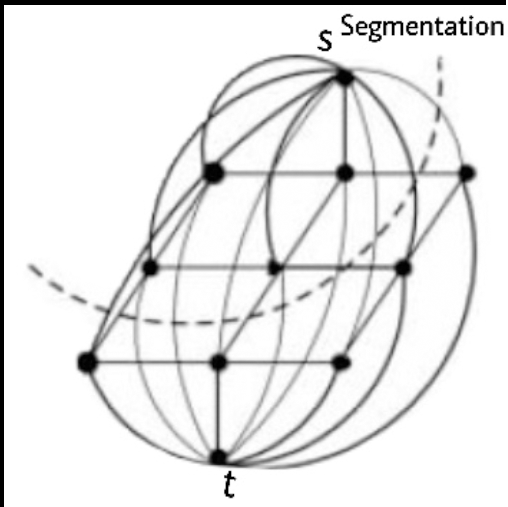
S-T network diagram.
Color images are made up of pixels in RGB color mode (R = red, G = green, and B = blue). It is unrealistic to create a complete color space histogram, so the GMM model is used to establish the color image data mode. Each GMM (foreground or background) can be regarded as a covari-ance of K dimension (usually K = 5). The parameters of this model are:

The smooth term of the color image is:

The energy minimization in GrabCut was achieved by iteration, with the advantage that the opacity alpha value can be automatically modified and the parameters θ of the color model GMM are corrected using pixels re-determined from the TU pixels of the initial ternary diagram.
The main process of the GrabCut algorithm is described as follows:
(1) Initial value
The user initializes the ternary graph T by setting the background TB. The foreground is set to null, which is TF=, and TU takes the complement of the background.
For n∊TB, there is αn = 0; if n∊TU, αn = 1.
Foreground and background GMM models are initialized with two sets of αn = 0 and αn = 1 respectively.
(2) Iterative minimization
The GMM parameter kn corresponding to each pixel n in the TU is found. GMM parameter θ is obtained from the data Z.
The minimum energy is used to get the initial split:
The steps are repeated to convergence.
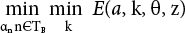
A comparison of before and after image processing and ideal contours is shown in Fig. 5 and Fig. 6. The fibers in the image processed by the GrabCut algorithm can be separated from the background almost completely, but there are some differences between them and the ideal contour. There are serious adhesion phenomena among single fibers especially in the areas where the fibers are dense. The edges of aramid 1313. did not separate well from the background. All these problems will result in error or lower accuracy in subsequent identifications. Xing 9 and Xu 10 proposed the concept of a fiber skeleton to remove the narrowest area between the fibers to separate them, but it is difficult to identify the true profile of some fibers.
Comparison before and after image processing.
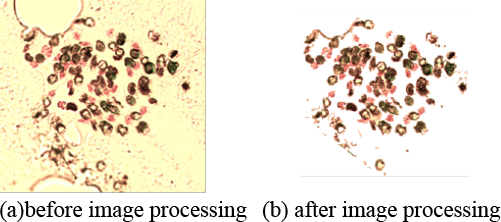
Fig. 6. Ideal contour.
Results and Discussion
After training a large number of fiber samples into the BP neural network model and processing the image with the GrabCut algorithm, a single-fiber image was obtained. This image was compared with the ideal contour obtained from Photoshop image processing software. As shown in Fig. 7, the fiber image was recognized by the BP neural network, and is similar to the ideal contour. For the flame resistant viscose, except for the adhered fiber, the images are basically the same. For the POD and the flame resistant vinylon, except a small amount of unrecognized fiber, the identified position is aligned with the ideal contour, but the entire contour is not fully recognized. This may be due to too few training samples in the BP neural network. For aramid 1313, the higher crystallinity of the inner core results in the inner core not being dyed and the color being very similar to the background. A very small amount of aramid core is also not completely separated, while in the particularly dense area of the fiber, the edge of the adhered fiber and its surrounding area may be recognized as an aramid 1313, which affected the judgment of the model. In this study, the number of samples in the neural network database and the fiber segmentation technique are extremely important and need to be improved.
Single fiber images and their ideal contours.
The single fiber sample was set as the input parameter. With the center of the blended yarn at the center, five circles were drawn and numbered from the inside to the outside.11-13 The radii of the five circles is an arithmetic progression. The number of pixels of fiber in each region was calculated to generate Fig. 8 and Fig. 9.
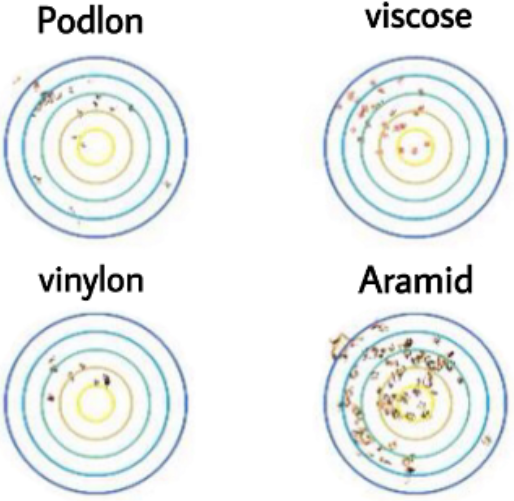
Single fiber images in the divided region.
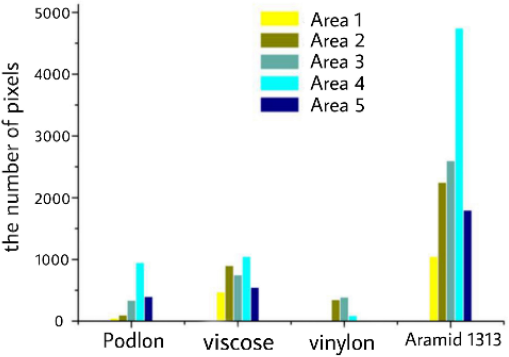
Number of pixels in each region of the fiber.
In the flame-resistant blended yarns, the number of flame-resistant vinylon fiber is lowest; the fibers are dispersed and hardly exist on the outer side of the blended yarns. POD is second least in the blended yarns, and is distributed in a large amount and dispersedly in area 4. Flame-resistant viscose fibers are the second most plentiful in the blended yarns, evenly and dispersedly distributed throughout. The number of aramid 1313 fibers is highest and due to the quantity, fibers are arranged more closely and most distributed is area 4 of the blended yarns.
Conclusion
In this paper, Photoshop image processing software is used to obtain the individual samples of flame resistant blended yarn. In the language environment of MATLAB image processing software, BP neural network was used to train with the samples, then the separation and distribution of each component on the cross-section of fame-resistant blended yarn were calculated. The experimental results show that the fiber in the image can be almost completely separated from the background with the processing of GrabCut algorithm, but the adhesion between single fiber dimensions is serious and cannot be segmented. Therefore, the number of samples in the neural network database and the technique of fiber segmentation are very important and need to be improved.