
Abstract
Adsorption and desorption studies were done of polyhexamethylene biguanide (PHMB) onto two different types of textile fiber surfaces. Based on these studies and mathematical modelling, the rate constants were calculated. Two different experimental conditions were used to simulate laundering, namely wet-to-wet and dry-to-wet. The model PHMB surface concentrations showed that the model can be used to describe the adsorption kinetics on cotton and cotton-polyester blends with reasonable accuracy.
Introduction
Adsorption and desorption rate studies are frequently done in heterogeneous systems to optimize process design.1-4 In this study, kinetics of the adsorption and desorption process of an antibacterial molecule to and from a textile substrate has been modelled mathematically. This model was experimentally validated and the adsorption rate constants determined. This work was part of an EU project to apply antimicrobial functionality to cotton and cotton-polyester blend workwear, which are laundered in an industrial laundry. The results of this project, part of which is shown in this paper, were successfully implemented. The other aspects related to this work can be found in the literature.5-7
The molecule chosen for this work was polyhexamethylene biguanide (PHMB). PHMB is a widely-used broad-spectrum antibacterial agent. The exhaust treatment of various types of textiles with PHMB can be done easily since PHMB is quite soluble in water. Good water solubility of the agent was essential if it was to be added to the laundering machine at the rinsing stage of the washing cycle. Studies have shown that the textiles treated with low bulk concentrations of PHMB have the required antibacterial performance as required by the standards.5,8-10
In one work, the indirect quantification of PHMB on the surface of cotton via the adsorption of a dye has been attempted. 11 Adsorption processes can be modelled using isotherms like those of Nernst, Langmuir, and Freundlich. 12 The adsorption of PHMB onto cotton has been described with such models in earlier work. 13 In this citied work, PHMB adsorption on to the cotton substrate followed the Langmuir isotherm at low bulk concentrations. It was concluded that this implies site-specific adsorption of PHMB molecules on the cotton surface. The attachment of PHMB to cotton is due to the electrostatic interactions which exist between the cationic biguanide groups of the PHMB and the carboxylate groups of cotton. 14 The adsorption curves from the work done by Blackburn et al. 13 also indicated that hydrogen bonding was present between cotton and the PHMB molecules when the PHMB bulk concentrations were increased. This was concluded from the derived adsorption isotherm constant, which was characteristic of the Freundlich isotherm. The Freundlich isotherm refers to the multilayer stacking of PHMB molecules on the cotton substrate during the exhaustion process; hydrogen bonding is involved in this type of adsorption. Computer simulations showed that the hydrogen bonding was between the biguanide units of PHMB and the oxygen, C-O-C, and the hydroxyl groups of cotton.
In contrast to the above mentioned research, our work describes the textile adsorption and desorption kinetics of PHMB with time. The PHMB fabric surface concentration was shown as a function of the adsorption and desorption rate constants in the mathematical model. In this mathematical model, the Nernst isotherm was assumed, which gives a linear relationship between the concentration in the bulk and the concentration at the surface of the fibers. The Nernst isotherm simplifies modelling and was expected to be valid at lower concentrations, even if the actual adsorption followed a Freundlich isotherm.
The Kinetics of Adsorption and Desorption
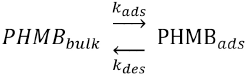
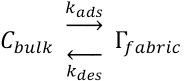
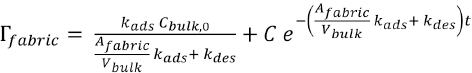
As PHMB molecules are transferred from a bulk solution to the surface of the fabric during the adsorption process, the rate constant at which the molecules are adsorbed onto the textile can be referred to as
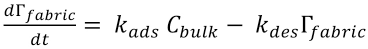
The above expression can be rewritten as Eq. 2.
C
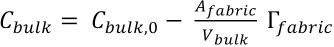
The PHMB surface concentration can be related to the bulk concentration using the mass balance equation. The total amount of PHMB molecules in the system equals the amount in the bulk and the amount at the fabric surface (Eq. 4).

A
The substitution of this bulk concentration expression in Eq. 3 gives Eq. 6.

From which Eq. 7 follows.

The general solution of this equation is given in Eq. 8.
The integration constant C can be found by applying the initial condition (Eq. 9)
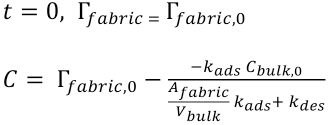
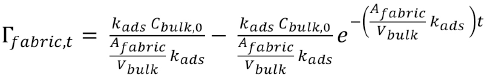
with which the final solution of Eq. 7 becomes Eq. 10.
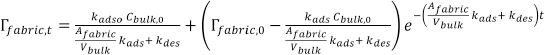
This is the general model that describes the kinetics of adsorption and the desorption processes. The rate of adsorption and desorption can be calculated from the rate constants. The values of the rate constants can be found from the experimentally-determined adsorption and desorption curves.
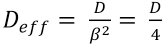
This model is only valid if the adsorption is not influenced by transport limitations. Therefore an analysis was made of the diffusion of PHMB into the textile. To quantify the characteristic diffusion time for PHMB in the textiles, the approach of Groot Wassink,
12
Nierstrasz et al.,
15
and Warmoeskerken et al.
16
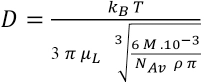
was used. Assuming that the PHMB molecule is a sphere, the diffusion constant
The dimensionless Fourier number

In yarns, the diffusion takes longer because the actual diffusion path is longer than the free path length due to the presence of the fibers in the yarn. This ratio is expressed using the tortuosity factor
For a diffusion process to be completed, a value of 1 for the

Textile Adsorption and Desorption Experiments
The adsorption and desorption curves of PHMB to and from the textile substrates were obtained from the exhaustion experiments done with PHMB. The adsorption and desorption of PHMB could be followed by measuring the change in the concentration of PHMB in the bulk. In case of adsorption experiments, the bulk refers to a liquor containing PHMB and the bulk refers to a liquor containing only water in desorption experiments. The measurement of the change of the PHMB concentration in the bulk was done by UV-Vis absorbance measurement of bulk liquor at regular time intervals with a UV-Vis spectrophotometer (Cary 100, USA).
Experimental
Materials
Cotton and blends substrates were procured from Testgewebe, GmBH, Germany. These substrates were plain-woven and bleached. The fabric density was 170 g/m2. The blends were a mix of cotton and polyester in a 35:65 ratio. PHMB (Reputex 20) was procured from Lonza Group, UK. The molecular weight of the PHMB used was 2750 g/mol. 9
Adsorption and Desorption Experiments
The adsorption and desorption studies were done on fabrics measuring 10 cm × 10 cm. A bulk liquor containing PHMB was prepared using an LCR (liquor to cloth ratio) of 100:1 for the adsorption experiments. The experiments were done at a thermostated temperature of 40 °C. The fabric samples were continuously stirred in the glass beaker with magnetic stirrers. These experiments were conducted with a PHMB bulk concentration of 0.05 g/L (the UV-Vis spectroscopy absorbance of this solution was less than 1). PHMB is a colorless solution with a UV-Vis absorbance peak at 236 nm.5,13
Bulk liquor (1 mL) was pipetted out and measured for its absorbance at 236 nm during the experiments. This volume (1 mL) was replaced into the bulk liquor after the absorbance measurements to not change the total bulk volume. The duration of the experiments was kept at 100 min. By the end of this duration, most of the PHMB in the bulk solution was adsorbed. This was concluded from the low UV-Vis absorbance value of the bulk solution at the end of the experiment. Absorbance measurements were made every minute during the first 10 min of the experiment, every 2 min for the next 10 min, and then every 5 min until the end of the experiment.
For the desorption experiments, a PHMB-treated fabric with a known surface concentration of PHMB was soaked inside a bulk liquor containing water. The PHMB surface concentration of these fabrics was determined from the previously described adsorption experiments. These desorption experiments were done with an LCR of 100:1. The fabric was continuously stirred in the glass beaker with magnetic stirrers. The temperature in these experiments was maintained at 40 °C and the duration of the experiment was kept at 100 min. The absorbance of bulk liquor was measured at a wavelength of 236 nm. The bulk liquor measurement was made every minute the first 10 min, then every 2 min for the next 10 min, and finally every 5 min until the end of the experiment.
The PHMB treatment of textiles in the industrial laundering industry can be done in dry, wet, or moist conditions depending on the process flow of the workwear. The PHMB can be added either at the end of the rinsing cycle or the washed fabrics can be treated separately. More on the laundering process can be found in the literature. 17 This initial wet or dry state of fabric can have an influence on the adsorption rate constants. To study the impact of the initial moisture condition of the fabric on the adsorption and desorption rate constants, the tests in this study were conducted in both states. These two different initial moisture conditions of the fabric in this study are referred to as the wet-to-wet (W-W) and dry-to-wet (D-W) states of the fabric. For the D-W tests, an initially dry fabric was placed inside the bulk liquor or water during the adsorption or desorption experiments respectively. For the W-W tests, the fabric was made wet just before the start of the experiment. This wetting was done by placing the fabric in a beaker containing water for a few seconds and then the respective experiment was conducted.
Fabric Properties
The fabric properties are important for the study of textile adsorption and desorption kinetics. The total surface area of all the fibers is therefore needed for the calculation of PHMB concentration at the fabric surface.
If

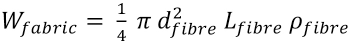
The fabric surface area is related to the weight of the fabric as shown in Eq. 17.
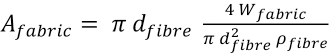
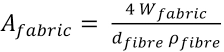
or as Eq. 18.
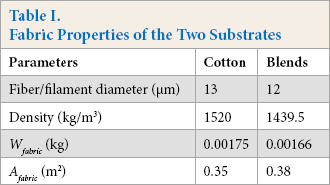
In this work, the average diameter of cotton and polyester fibers were measured with a scanning electron microscope (SEM). The diameter of the cotton fiber varied between 10 and 15 μm. An average value of 13 μm was used for the cotton fibers in the model. The filament diameter of the polyester filaments in the blends were between 10 and 13 μm. Based on this, the average fiber diameter for the blends was taken at 12 μm.
Though the fiber/filament cross sections were not entirely uniform, we assumed them to be perfectly cylindrical for the simplified model. In modelling work, textile fibers are frequently considered to have the shape of a cylinder as a first approximation.
18
This can be considered justifiable considering that cotton fibers become cylindrical and rod like after mercerization.
19
From the respective fiber/filament diameter, density, and weight of fabrics, the
Fabric Properties of the Two Substrates
Results and Discussion
PHMB Surface Concentrations of Cotton, Blends, and Polyester
A PHMB calibration curve was made with the UV-Vis spectrophotometer showing the linear relationship between the absorbance against the various concentrations of PHMB at 236 nm (Fig. 1). This equation was used to calculate the concentration of the PHMB in the bulk in the adsorption and desorption experiments.
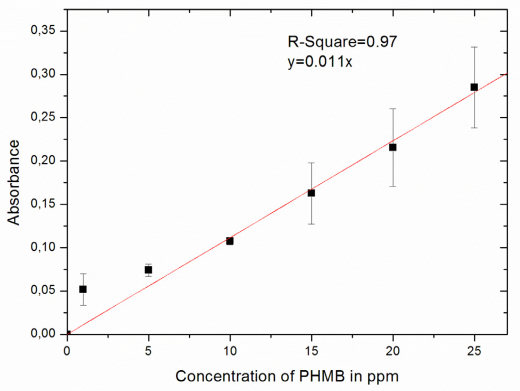
Calibration curve of PHMB with UV-Vis spectrophotometer. The unit for the concentration of PHMB here is expressed in ppm (parts per million) where 1 ppm = 0.001 g/L.
From the calculated concentration of PHMB in the bulk and the
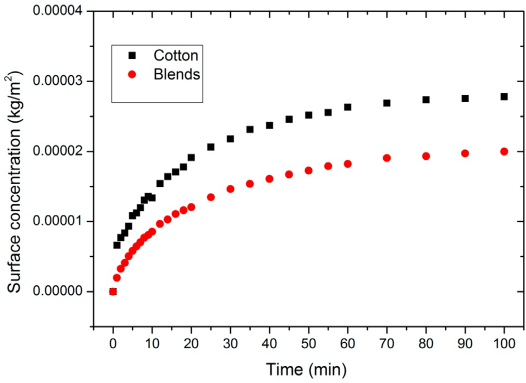
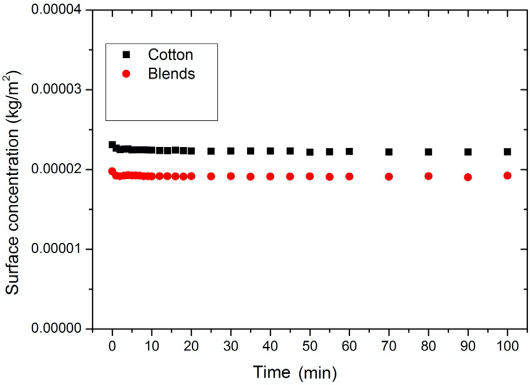
The surface concentration of PHMB on the substrates in dry-to-wet (D-W) tests. Blends refer to a mix of cotton and polyester (35:65). The PHMB bulk concentration was 0.05 g/L.
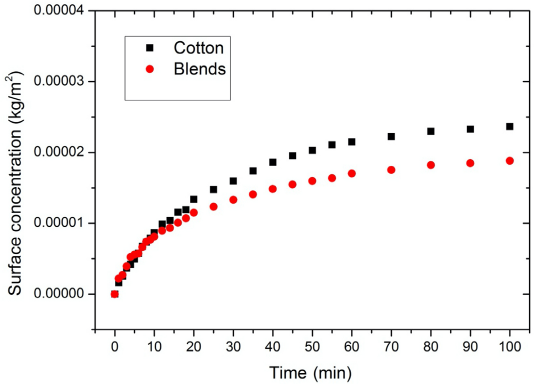
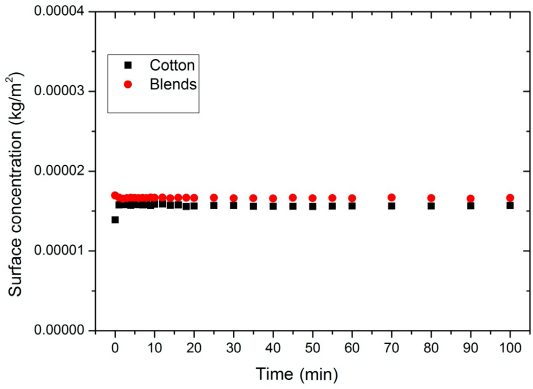
The surface concentration of PHMB on the substrates in wet-to-wet (W-W) tests. Blends refer to a mix of cotton and polyester (35:65). The PHMB bulk concentration was 0.05 g/L.
The adsorption curves in Figs. 2 and 3 show that cotton had a higher PHMB surface concentration than the blends. As mentioned earlier, PHMB molecules bind to the cotton through electrostatic interaction. This electrostatic interaction is between the cationic biguanide groups and the carboxylate groups of cotton. Therefore, the number of carboxylate groups on the fabric is a determining factor in the PHMB fixation amount apart from the surface properties of the fabric. The blends tested theoretically contained only 35% of the number of carboxylate acid groups in pure 100% cotton. Therefore the lower number of ionic sites in the blends as compared to cotton would result in a lower PHMB surface concentration.
The surface of polyester in the blends had no reactive groups, and, therefore, no covalent or ionic bonds are possible between the PHMB and the polyester. The PHMB adsorption on to the polyester part of the blends is therefore through physical adsorption. Polyester is also inherently hydrophobic due to the aromatic and ethylene groups in its structure. The PHMB molecule contains polar biguanide groups and non-polar hexamethylene groups. Some hydro-phobic interactions can be expected between the non-polar groups of PHMB and the polyester surface of the blends.
For the desorption experiments, fabrics with known surface concentration of PHMB molecules on the treated textile were used. After the desorption experiments, from the measured PHMB bulk concentrations and the
The results of the desorption experiments are given in Figs. 4 and 5. The desorption experiments show that the desorption of PHMB into the bulk from the substrates (in both D-W or W-W scenarios) was almost zero. This conclusion was derived from the absorbance measurements of the bulk liquor where the fabric was placed. The influence of desorption therefore was excluded from the general Eq. 10 for further calculations.
The desorption curves for the three substrates D-W tests.
The desorption curves for the three substrates W-W tests.
Adjusted Model and Determination of the Adsorption Rate Constants
Considering zero desorption, when the initial fabric concentration is zero (i.e., if
This expression can also be shown as Eq. 20.
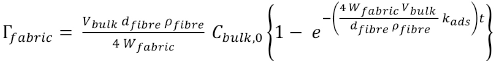
Therefore the general equation has been modified to the above adsorption equation.
By taking the system properties as given in Eq. 21,
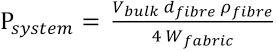
the equation is rearranged into Eq. 22.
A plot of
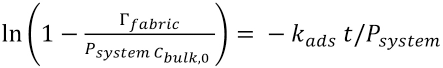
Table II shows the calculated adsorption values for cotton and blends for both the D-W and W-W scenarios. From the adsorption rate constants shown in Table II, it appears that the diffusion of PHMB onto the textile fibers was already quite fast and was irrespective of the initial dry or wet state of the fabric. This would imply that the use of mechanical energy would not significantly improve the diffusion any further.
Calculated PHMB Adsorption Rates for Cotton and Blends Substrates under the Dry to Wet and Wet to Wet Scenarios
The adsorption rate constant for cotton in the D-W state was twice the rate constant of the W-W condition. The adsorption rate constants for blends for both D-W and W-W states were similar. This might be explained due to the wettability of cotton being better than polyester. Wettability is a prerequisite for the wicking property of a substrate. When a dry fabric is placed into the liquor, the adsorption is mainly driven by wicking, while in the case of a wet fabric being treated in liquor, the adsorption is primarily driven through diffusion.
Model PHMB Surface Concentrations on Cotton and Blends
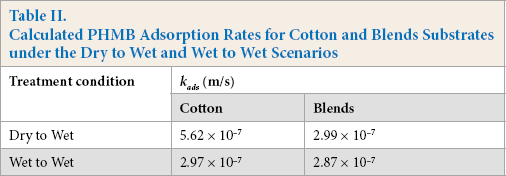
From the experimentally-determined adsorption rate constants and the general adsorption equation, the PHMB surface concentrations (Eq. 20) were recalculated. These surface concentrations are referred to as model surface concentrations in this study. Figs. 6 and 7 show the experimental surface concentrations and the model surface concentrations for cotton and blends for the D-W and W-W scenarios respectively. It appears that the model surface concentrations and the experimental surface concentrations were quite similar (Figs. 6 and 7).
The experimental surface concentration values versus the model surface concentration values of PHMB on cotton and blends for the D-W scenario.
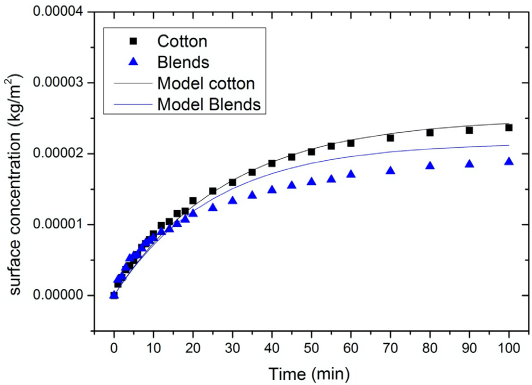
The experimental values of surface concentration versus the model values of surface concentration of PHMB on cotton and blends for the W-W scenario.
Second-order kinetics were not considered for this work since the graphs for second-order kinetics were non-linear and the model graphs from first-order kinetics were able to predict the surface concentrations with reasonable accuracy.
Calculation of the Characteristic Diffusion Time
Using Eqs. 11–14, the characteristic diffusion time was calculated for the PHMB in the cotton and blend textile materials as a function of temperature. For these calculations, the density of the PHMB was estimated to be ∼1000 kg/m3. The results are shown in Table III.
Calculated Characteristic Diffusion Time
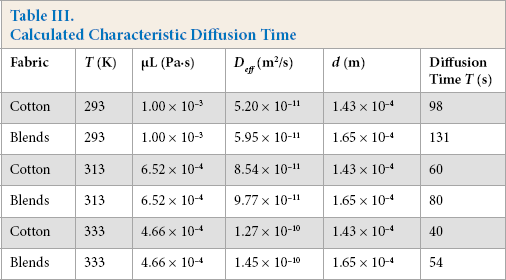
The values of diffusion time (Table III) show that the characteristic time for diffusion (1-2 min) was low compared to the timescale of the absorption experiments (0-120 min). Therefore, it appears that the results of the kinetic experiments were not influenced by transport limitations in the yarns. This was confirmed by the results presented in Table II.
Conclusion
The PHMB textile adsorption and desorption kinetics were modelled mathematically. The adsorption and desorption rate constants of the PHMB molecule onto the two textile substrates were experimentally determined. Nearly zero desorption of the PHMB was observed from the substrates. The general model was therefore modified to exclude the influence of desorption of PHMB from the substrates. The determined adsorption rate constants were then used to recalculate the model PHMB surface concentrations. The recalculated PHMB surface concentrations showed that the model can be used to describe the adsorption kinetics on cotton and the blends tested. It was concluded that the absorption rate of PHMB in the textile materials in this scenario was completely determined by the kinetics of the absorption process and was not influenced by transport limitations.