
Abstract
The AATCC TM22-2014 spray test (similarly BS EN ISO 4920:2012) is widely used to determine the water repellency of textiles. Given the ongoing move towards non-fluorinated chemistries to provide water repellent finishes on textiles, modifications to the spray test are suggested to discriminate between those which initially demonstrate similar repellency and aid in assessment of performance within laboratory textile testing. An extended shower duration of 60 minutes or 120 minutes is recommended, with additional calculations to objectively quantify surface wetting. This increased test period demonstrated differences in performance between repellent finishes with a 1.37 g mass difference between fluorinated and non-fluorinated chemistries after 120 minutes. Further quantification of repellent performance, as set out in this study, would determine the performance of non-fluorinated durable water repellent (DWR) chemistries and suitability for end use.
Introduction
Liquid repellent properties are used in a range of end-use textiles including personal protective clothing, medical equipment, stain resistance on home interiors, and weather protection, a sector worth US$2.94 billion in Europe. 1 Termed durable water repellents (DWRs), repellent textiles have become commonplace in everyday life and resist the absorption, wetting, and penetration of liquids and soils.2,3
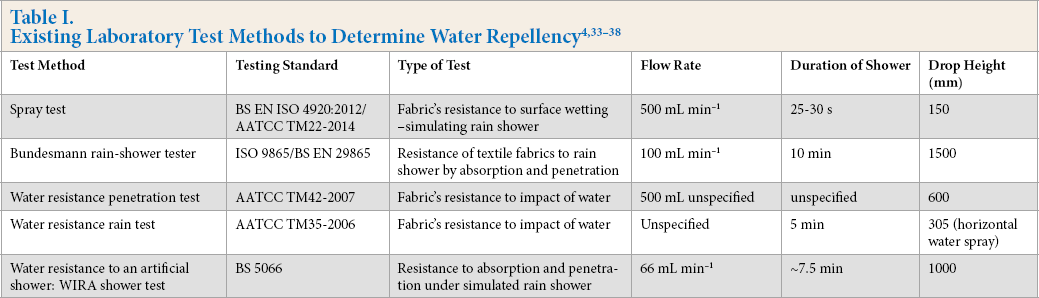
Water repellency specifically can be evaluated by laboratory textile test methods categorized by: (1) tests simulating exposure to rain by water spray, and (2) immersive tests evaluating water sorption. Most commonly used to evaluate water repellency is the spray test described by BS EN ISO 4920:2012 and AATCC TM22-2014. 4 While the literature discusses the use of the spray test in quality control, rather than predicting fabric performance, 5 it is the most widely-used test method to determine water repellency due to its accessibility, and is widely used across the textile development, research, and sourcing sector. Other laboratory textile tests simulating rain exposure used, to determine water repellency (summarized in Table I) are less-readily used and differ in flow rate, volume of shower, and distance between spray and sample, making comparisons of data difficult. Liquid repellency can also be determined analytically by evaluation of the static wetting properties from contact angle measurements. 6 However, the inherent surface roughness of textile surfaces is not well suited to this determination of wetting properties and the static nature of this analysis inhibits understanding of the end use.
Despite the spray test being the most widely used and discussed method to determine water repellency, the use of the subjective assessment against the pictorial scale poses variability between users with chance of biased assessment. 7 Reliance on the judgement of the tester, their understanding of the pictorial rating, and interpretation of the descriptions can lead to differences in the interpretation of water repellency results. Jeong 8 proposed an objective evaluation using image thresholding to evaluate the wet area ratio of the test surface; however, scanning the wet surface and determining the threshold separation could be troublesome.
The simulated rain shower of the spray test (the 250 mL used has to take 25–30 s to pass through the funnel) is exceptionally short compared to rainfall within the end-use environment and other laboratory test methods for water repellency (Table I). Evaluating water repellency after a longer simulated shower would mimic end-use conditions—for outdoor repellent clothing where a person cannot seek shelter immediately and rain showers are of varying duration. In assessment, the ISO rating scale (graded 0–5) is most commonly used with highly repellent fabrics rated 4/5 due to the definition brackets of the rating scale.
Compounds based on the class of chemistry using fluorine and carbon, known as fluorocarbons, have been used for DWRs and textile repellency since the 1950s. Perfluoroalkyl and polyfluoroalkyl substances (PFASs) are synthetically-produced chemicals, where one or more carbon atoms and all hydrogens have been replaced by fluorine; i.e., containing a perfluoroalkyl moiety (CnF2n+1).9,10 The chemical class of PFASs includes a number of polymers and non-polymers, including side-chain fluorinated polymers, which compromise of a polymeric backbone with branching fluorinated side chains. 9 The strong bonding of this chemistry imparts a highly-durable and stable finish, exhibiting a high level of liquid repellency against a range of water and oil-based liquids.11,12 However, the chemical class of PFASs have been heavily criticized, specifically long-chain perfluoroalkyl acids (PFAAs), which have been shown to be persistent, bio-accumulative, and toxic.13–15 Of high regulatory interest are perfluoroalkyl carboxylic acids (PFCAs), the most well-known being perfluorooctanoic acid (PFOA), and perfluoroalkane sulfonic acids (PFSAs), for example perfluorooctanesulfonic acid (PFOS).9,11,16,17
Subject to pressure and publicity from non-governmental organizations (NGOs) since 2010, the textile and apparel industry has moved from long side-chain fluorinated polymers to shorter-chain analogues.18–20 In 2006, the US Environmental
Protection Agency (EPA) set a voluntary phase-out of PFOA in its Stewardship Programme, 21 and the EU regulated PFOS under Directive 2006/122/ECOF 22 and regulated PFOA in 2015, with restrictions on textiles by 2023.23,24
Chemistries with shorter side-chain fluorinated polymers, perfluoroalkyl moieties (C6F13 or C4F9) have been used as replacements for repellent textile finishes. While the shorter chain length provides a lesser degree of repellency, some repellency to polar liquids is provided.25,26 Shorter side-chain analogues do not release PFOS and PFOA, but there is equivalent concern on their persistence, bio-accumulative nature, and toxicity, with potential degradation products of perfluorohexane sulfonic acid (PFHxS) and perfluorobutane sulfonic acid (PFBS). 27 The European Chemicals Agency (ECHA) is currently reviewing a proposal to restrict PFHxS, which, due to its persistence and bio-accumulative traits, is already listed on the REACH candidate list. 28
Alternatives to fluorinated polymers for DWRs have been intensively researched for over a decade and are based on three groups: (1) hydrocarbon chemistry (CnH2n+2), (2) silicone chemistry [-Si-O], and (3) hyper-branched chemical structures.16,29 However, a lesser level of liquid repellency has been seen using hydrocarbon-based DWRs due to the inherently higher surface tension. 30 Hyper-branched chemical structures, or dendritic chemistry, create highly branched units around a backbone core, which concentrated the functional end groups. 31
The adoption of non-fluorinated DWRs is dependent on fabrics meeting the performance requirements of brands, end-use expectations, and the durability of the repellent performance. In addition, loss of repellent functionality indicates degradation of the DWR chemistry with loss to the environment during abrasion, weathering, or laundering.32 The spray test is most-commonly referenced in evaluation and comparison of alternative chemistries for DWRs using only the pictorial scale in both academic research and by mills and chemical suppliers. Recent research comparatively investigating DWRs have chosen to calculate percentage mass change as a method to objectively quantify the wetting.25,26,32 Calculation of the mass change of the textile sample after the water shower eliminates the subjective, potentially biased, pictorial rating. In recent literature by Schellenberger and Hill, percentage mass change calculation showed discrimination between initially perceived similarly performing fabrics. 32 With the movement to alternative chemistries for DWRs and the surge in discussion on data from the spray test, this study proposes the need for an adapted spray test method and suitable objective calculations. This work calls for the standard test method to be revisited and suggests cost-effective modifications to allow greater discrimination of repellent textiles to rigorously assess suitability for end use.
Experimental
Materials
Woven fabric samples were supplied for the study by various brands. According to manufacturer details, one fabric was finished with a long side-chain C8 fluorinated DWR, two of these fabrics were finished with a shorter side-chain C6 fluorinated DWR, and two of these fabrics were finished with a non-fluorinated DWR. All of the fabrics were commercially in use or in development at the time of the study, intended for use in repellent outerwear apparel, and therefore illustrative of the outdoor apparel industry.
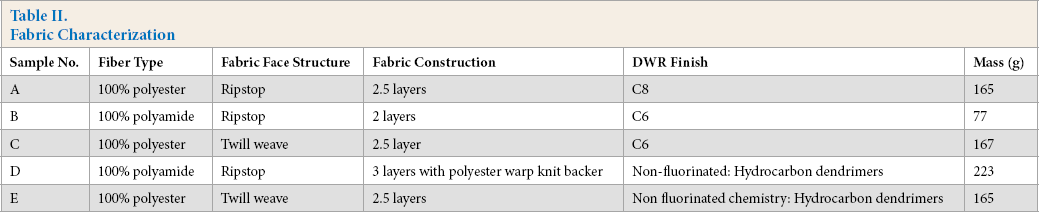
Five fabrics were selected (Table II) with samples A, C, and E being directly comparable; supplied by the same brand, with the same fiber type and fabric construction with only the DWR finish differing. The specimen size was 165 × 165 mm.
Fabric Characterization
Extended Spray Test
The standard spray test apparatus used for AATCC TM22-2014 (provided by James Heal for this study) consists of a funnel and spray nozzle supported 150 mm above the test specimen and holder (Fig. 1). 4 A simulated water shower of 250-mL volume is sprayed under controlled conditions onto the textile sample. Following the shower, the hoop holding the test specimen is tapped twice with rotation and the face of the specimen rated against the rating chart (Fig. 2) 4 with the specimen assigned a number 0–100 (ISO 0–5) according to the degree of wetting on the surface and judged by the tester with the rating descriptions. The AATCC rating scale and BS EN ISO rating scale are used interchangeably and correlate comparatively (correlation coefficient r = 0.93). Supplementary information related to this are available from the author upon request.
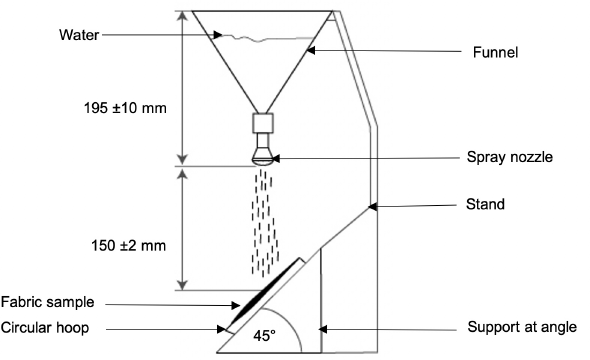
Existing spray test apparatus.
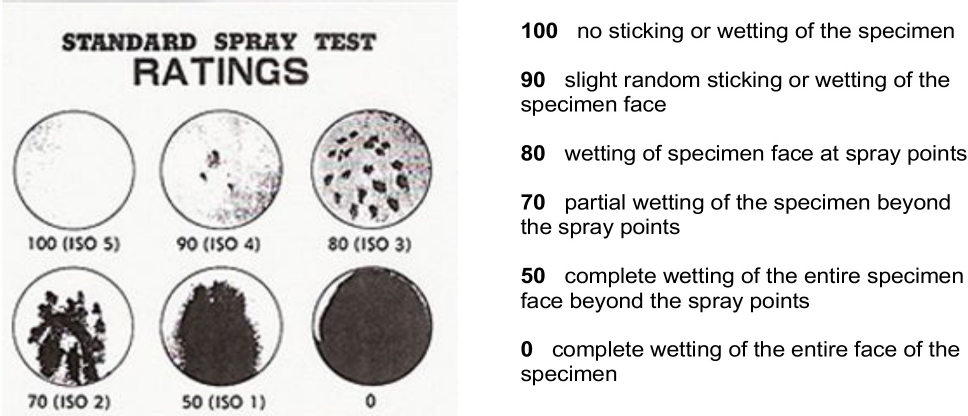
Standard rating scale with descriptions as set out in AATCC TM22-2014 and BS EN ISO 4920:2012
For this work, the apparatus, as described, was adapted to extend the water shower. Samples were tested under three additional time periods in addition to the standard spray shower duration of 25–30 s. To extend the standard shower duration of the spray test, a continuous system was devised in which the water flows consistently through the funnel and nozzle onto the fabric. The standard test apparatus (
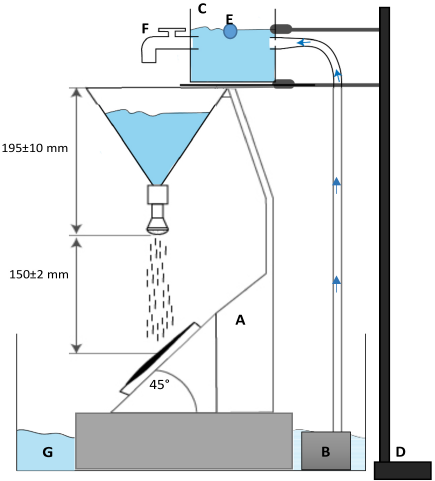
Setup of extended spray test with further details of the holding container.
Prior to each test, the flow rate was checked as an average of ten water (distilled water) volume measurements. For each test, the conditioned test sample (65% ± 2% relative humidity (RH) at 20 ± 2 °C) was mounted onto the circular hoop and placed onto the support. Separate tests were run for each specimen with four time durations: standard test, 10 (in line with the duration of the Bundesmann test (BS EN 29865:1993/ISO 9865:1991)), 60, and 120 min (feasible time periods in which a wearer may be able to seek shelter). A separate specimen was used for each test; three specimens were tested from each fabric sample.
Modified AATCC Rating Scale and Intermediate Ratings
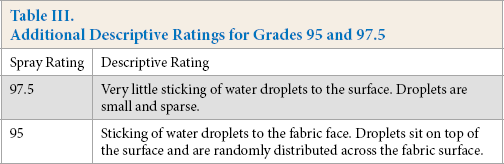
At the end of the test, the sample was tapped twice as stated within the testing standard and subjectively assessed with intermediate ratings. A spray rating of 100 was deemed as unachievable and a rating of 97.5 was given as in Table III. This was decided based on previous work and testing observing that there was always water sticking to the fabric surface. 25
Additional Descriptive Ratings for Grades 95 and 97.5
Calculation of Percentage Mass Change and Mass Gain
The mass of each dry and conditioned fabric sample was measured using a Precisa 310C-3010D balance (g) and noted to two decimal places. The spray test method was used and a rating assigned. At the end of testing, the sample was carefully removed from the fabric holder, to avoid any wetting or movement of droplets on the fabric surface. Mass increase in g (Δm) was calculated to quantify the uptake of water following the spray test and to focus on wetting of the fabric surface, and within the fabric bulk should this occur. This was calculated according to Eq. 1.
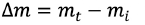
mi is the initial mass of the fabric and mt is the mass after testing.
Results and Discussion
The standard spray test, with a spray duration 25-30 s, shows a similar spray rating of >95 for all fabric samples. This describes comparable wettability between the differing DWR finishes. However, the spray rating assigned to the fabric samples decreased with extended test time. Long side-chain fluorinated polymer (SFP) (C8) DWR sample A showed a good level of water repellency after all extended tests, and was rated at 85 after the 120 min shower (Fig. 4). Both shorter side-chain fluorinated polymer (SFP) (C6) DWR samples B and C demonstrated a decrease in water repellency after an extended 10 min test. Both samples were assigned a spray rating of 80 after the 60 min and the 120 min extended showers. The repellency shown by the extended spray test duration differed between the non-fluorinated DWR samples. Sample E demonstrated prolonged water repellency over the extended tests (assigned a spray rating of 80 after 120 min) compared to the other non-fluorinated DWR sample D (assigned a spray rating of 75 after 120 min) (Fig. 4).
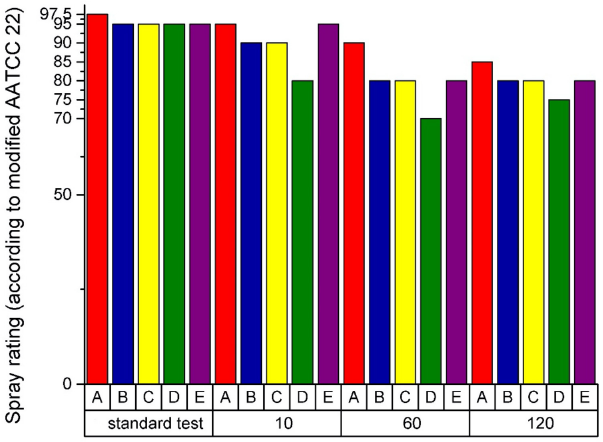
Spray test rating of samples at each extended spray test. Fabric samples categorized by sample ID and extended spray test duration (min).
Δm values after the extended spray test were comparable across all fabric samples, with sample D demonstrating a slightly greater wettability (Fig. 5). Δm values over the extended spray test durations were seen on all samples due to water absorption from water pressure and penetration overcoming the DWR. Sample A (long SFP (C8) DWR) demonstrated a consistent low Δm value, and therefore, a greater level of water repellency, compared to the shorter SFP (C6) DWR sample C and the non-fluorinated DWR sample E over all extended spray test durations. After an extended spray shower of 60 min, long SFP (C8) DWR sample A demonstrated the greatest water repellency with the lowest Δm value (0.43 g). After 120 min, both non-fluorinated DWR samples tested demonstrated a high Δm value, and therefore water uptake (sample D, 1.71 g, and sample E, 2.00 g). This decrease in water repellency is in line with the low spray rating grades (<80) assigned to both samples after 120 min. Both samples also demonstrated a greater variation, shown by the error bars of standard deviation, between repeat testing, after the 120 min shower, compared to fluorinated DWR samples. This variation describes the increased wettability of sample D after 60 min and decreased wettability after 120 min; once the fabric surface was wetted, continued water penetration was variable, but contributed to the increased mass.
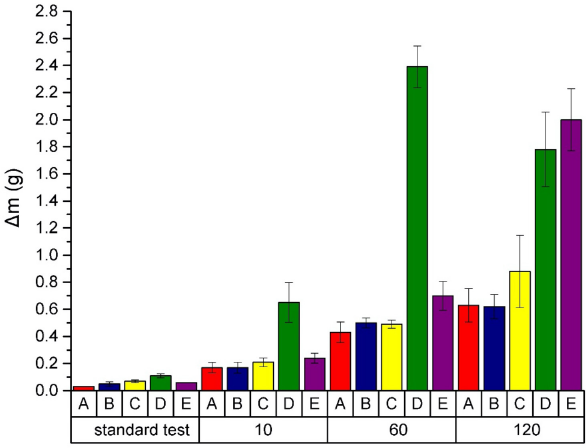
Δm values over the extended spray tests. Fabric samples categorized by sample ID and extended spray test duration (min). Error bars show standard deviation.
Δm values, and therefore water uptake, increased over the extended spray test durations (Fig. 5). Data from the standard spray test (with spray duration of 25–30 s) showed a similarly low Δm value, and therefore good water repellency, between the non-fluorinated DWR samples and fluorinated DWR samples. However, the extended spray durations allowed a greater discrimination between these initially similar performing samples. After a spray shower of 120 min, there were clear differences between fluorinated and non-fluorinated samples. Fluorinated DWR samples (A, B, and C) demonstrated Δm < 0.88 g, while the Δm values for non-fluorinated samples (D and E) were between 1.7 and 2.0 g.
A one-way analysis of variance (ANOVA) was conducted to determine if there was a statistical difference between the different DWR types at each extended spray test duration and therefore was used to recommend the most suitable spray shower duration to discriminate between the DWR types. Details of this supplemental information is available from the author upon request. The wettability, indicated by Δm, of samples A, C, and E were directly compared (sample fabric type and construction). After the standard spray test, a statistically significant difference was indicated by the post-hoc tests (Tukey HSD) between the long SFP (C8) DWR (sample A) and the shorter SFP (C6) DWR (sample C) (p < 0.05), but not between these two DWR types and the non-fluorinated DWR (sample E), where p = 0.165. No statistically significant difference was indicated between the DWR types after the extended spray test of 10 min (data available from the author upon request), however, in both the extended spray shower tests of 60 and 120 min, a statistically significant difference was indicated between both the long SFP (C8) DWR (sample A) and the shorter SFP (C6) DWR (sample C), with the non-fluorinated DWR (sample E) (p < 0.05). After both extended shower durations, a statistically significant difference was not indicated between the two fluorinated DWR types (samples A and C). It is therefore recommended that the spray test shower duration be extended to both 60 and 120 min to allow differentiation between fluorinated and non-fluorinated DWRs.
Conclusions
The existing AATCC TM22-2014 spray test method is used readily and widely to determine performance of water repellent textiles in a range of sectors. Within this study, the water repellency of fabrics treated with fluorinated and non-fluorinated DWRs, which initially demonstrated comparable wettability, were shown to differ when tested with the extended spray test described. After extended spray tests of both 60 and 120 min, differences in repellency were clearly seen between the samples tested and the fluorinated and non-fluorinated DWR types. This allowed discrimination between DWR types, which were initially shown to be similarly repellent by the standard test duration of 25-30 seconds. Following statistical testing, it is recommended that the spray test shower duration be extended to both 60 and 120 min to allow differentiation between fluorinated and non-fluorinated DWRs. It is recommended that the spray test include the adaptations described in this paper, which are easily accessible and cost-effective. This is proposed to assist in assessing DWRs, ensuring adequate functionality and thorough assessment, given the recent movement in legislation and increasing sustainability conscience of the textile and apparel industry.
Footnotes
Acknowledgement
The author acknowledges the funding provided by the University of Leeds in support of the doctoral research project by a University Research Scholarship.