
Abstract
Hydroxyl changes of cotton cellulose treated with sodium hydroxide (NaOH) solution is closely related with hydrogen bonding (H-bonds) between different hydroxyls, which is difficult to directly measure by common instrumentational methods of X-ray diffraction (XRD) or Fourier transform infrared (FTIR) spectroscopy. Two-dimensional correlation spectroscopy (2Dcos) is a powerful tool to analyze the changes of molecular spectroscopy. In this study, the alkaline-treated cotton cellulose was monitored in real time by attenuated total reflection (ATR) in combination with 2Dcos. Results indicated that the H-bonds changed in the following sequence order:
Keywords
Introduction
As a natural cellulosic fiber, cotton has found broad applications in apparel, medical, and industrial areas. Cotton fabrics show many advantages including moisture absorbency, air permeability, and wearing comfort,1,2 and as a result, have become the most popular fiber in textile products. Basically, cotton cellulose is composed of crystalline and amorphous regions.3–6 The amorphous regions show significant effects on the moisture absorbance, dyeing properties, and chemical modification of cotton fabrics. Therefore, cotton fabrics are usually processed in concentrated sodium hydroxide (NaOH) solution, in a process known as mercerization.6,7 In the crystalline region, different cellulose chains and their conformation are fixed by the abundant and strong intermolecular hydrogen bonds (H-bonds) between hydroxyls. However, in the amorphous region, cellulose chains have weak and irregular H-bond interactions, making the structure loose.8,9 Alkaline treatment of cotton fibers breaks up the weak H-bonds and swells the amorphous regions of cellulose, and then destroys the strong H-bonds in the crystalline region, resulting in the conversion of crystalline to amorphous regions. Common methods, such as Fourier transform infrared spectroscopy (FTIR) and X-ray diffraction (XRD), cannot characterize the changing process of different hydroxyls on the glucose ring of cellulose or the related H-bonds. Chemical modification of cotton fabrics also includes the participation of hydroxyls in the amorphous region.10–13 Therefore, it is very meaningful to clarify the mechanism of cotton fabrics treated with NaOH solution from the perspective of the real-time changing process of hydroxyls and H-bonds at the molecular level.
Two-dimensional correlation spectroscopy (2Dcos), first proposed by Noda, 14 is an effective mathematical method to analyze complex molecular spectroscopy. With the assistance of 2Dcos technology, the spectral resolution can be greatly improved, and some indistinguishable peaks in the original spectra can be observed. 2Dcos has been widespread applied in the analyses of molecular functional groups, including the changing process of hydroxyls and H-bonds of cellulose and cellulose acetate,15–17 the phase transition of thermal sensitive materials,18,19 the diffusion behavior of small molecules in polymers, 20 the molecular reaction mechanism between chemicals and cellulose hydroxyls, 21 and so on. After 2Dcos analyses, the changing sequence order of molecular functional groups can be easily obtained. Furthermore, external perturbations, such as temperature, time, pH value, and pressure have been introduced into 2Dcos studies. Therefore, the effects of perturbations on the transition point or transition range of chemical species can be determined due to their different responses to the factors.22,23
In this study, the attenuated total reflection-Fourier transform infrared spectroscopy (ATR-FTIR) combined with 2Dcos was used to characterize and analyze the hydroxyl or H-bond changing of cotton cellulose during the alkaline treatment process. Changes in Gibbs free energy in the process were calculated using Gaussian 09 software to analyze the reactivity of different hydroxyls. Through this study, the alkaline mercerization mechanism will be understood as the changing sequence order of hydroxyls or H-bonds of cellulose at the molecular level. This may also provide a theoretical basis for the investigation of chemical modification of cellulose involving hydroxyls or H-bonds.
Experimental
Materials
Pure 100% plain woven cotton fabrics (40 S × 40 S, fabric weight 117 g/m2, warp density 133 ends/in., weft density 72 picks/in.) were subjected to desizing, scouring, and bleaching, and were provided by Wuxi Tianmu Extra Width Printing & Dyeing, Co. Ltd. (Wuxi, China). Sodium hydroxide (NaOH) was analytical agent and purchased from Sinopharm Chemical Reagent Co. Ltd. (Shanghai, China). Potassium bromide (KBr) was FTIR spectral grade agent and purchased from Tianjin Botianshengda Technology Development Co. Ltd. (Tianjin, China). Qualitative filter paper (diameter = 7 cm) was obtained from Shanghai Titan Scientific Co. Ltd. (Shanghai, China).
ATR-FTIR Spectroscopy
The fabric was folded into four layers and put onto the ATR test platform. NaOH solution (200 g/L) was dropped (2–3 droplets) onto a filter paper with a pipette, and the wetted filter paper was immediately placed onto the fabric for testing. 20 The alkaline treatment process was recorded by a Spectrum Two FTIR spectrometer (PerkinElmer Inc.). The spectrum was obtained every 50 s in absorbance mode, and a total of 30 spectra were obtained. The scan range was 4000 to 400 cm−1, and there were four scan times with a resolution of 4 cm−1.
FTIR Spectroscopy
The NaOH concentration used was chosen from a range of tested NaOH concentrations. Detailed information is available from the author upon request. The fabrics were ringed in the NaOH solution (200 g/L) at room temperature (RT) for 0–300 s, and then washed consecutively with 70 °C water for 3 min, 90 °C water for 5 min, 50 °C water for 5 min, and tap water for 15 min until the pH value of the washed water was close to neutral. Afer that, the alkaline-treated fabrics were dried at 80 °C for 5 min in an oven. The alkaline-treated fabrics were cut into powders, accurately weighed (2 mg), mixed with 100 mg dried KBr, and then pressed into a transparent pellet. A Spectrum Two FTIR spectrometer was used to scan the samples in the absorbance mode at a range of 4000 to 400 cm−1. There were 64 scan times with a 4 cm−1 resolution for each sample. The empirical formula for the crystallinity index (CI) of cellulose was calculated by Eq. 1. 4
A1371cm−1 and /A2900cm−1 are the intensities of absorbance peaks at 1371 and 2900 cm−1, respectively.
2Dcos Analysis
The 2Dcos analyses of ATR-FTIR spectra was performed using 2D Shige v.1.3 (Shigeaki Morita, Kwansei-Gakuin University Japan, 2004-2005) software. The final contour maps were processed by an Origin Program v.8.0, and pink and grey colors indicated positive and negative correlation values, respectively.
Gaussian Calculations
Chemical structures of compounds were built up with the ChemBioOffice Ultra 2010 software package and were processed using MM2/Minimize energy program. And then geometry optimization of a compound was processed by Gaussian 09W software at the density functional theory (DFT)-unrestricted B3LYP/6-31G(d, p) level. Furthermore, the optimized compound was processed with a frequency program. The calculated results and the structures of compounds can be obtained with a GaussView 5.0 software. 24 , 25 The modified glucose (MG) molecule was taken as a model of cellulose.
XRD Analysis
The samples were examined by a D/max-2550 PC X-ray Diffractometer (Rigaku Ltd., Japan). The rotation rate of the specimen relative to the X-ray source was 0.025 °/s from 5° to 90°. Diffracted radiation intensity was detected by the detector, which was rotated simultaneously at 0.02 °/s. The crystallinity
Results and Discussion
2Dcos Analyses of ATR-FTIR
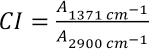
Collected ATR-FTIR spectra of cotton treated with concentrated NaOH solution and changes of intensities of related absorbance peaks during varied times are shown in Fig. 1. The absorbance peaks of hydroxyls located at 3600-3000 cm−1 decreased after prolonged time as shown by the arrows (Fig. 1a), and the shapes of spectra are almost unchanged.
(a) ATR-FTIR spectra and (b) absorbance intensities of cotton treated with NaOH solution at different times.
The absorbance at ∼2900 cm−1, which was attributed to the stretching vibration of C-H bond connected with hydroxyls, 26 overall increased a little with increased time. This was understandable, because lots of H-bonds were formed between different cellulose chains before alkaline treatment, and the rigid network constructed by hydroxyls with H-bonds affected the stretching vibration of C-H connected with hydroxyls. However, after alkaline treatment, many hydroxyls can be converted to sodium alkoxide due to H-bonds disappearing, 7 and consequently, the constraint on the stretching vibration of C-H was reduced. The intensities of different peaks decreased rapidly when time was increased to 300s, then decreased slowly from 300 to 600s, and finally leveled of (Fig. 1b). This was explained as the hydroxyls being rapidly converted to sodium alkoxide at the beginning due to the high concentration of NaOH solution, and the transformation rate decreased when the NaOH concentration was gradually reduced. The NaOH would react with the hydroxyls of cellulose and produce water, reducing the NaOH concentration. Finally, the changing of cotton cellulose was completed. During the process, H-bonds between different hydroxyls (inter- or intramolecular) were broken, and the responses of various H-bonds to the NaOH solution were different from each other.
To investigate the real-time changing of different hydroxyls and H-bonds, the time-dependent spectra of cotton treated with NaOH solution were obtained by ATR-FTIR at RT. The spectra were then processed with the 2D-Shige programs. The contour maps are presented in Fig. 2. Tentative assignments of absorbance peaks referred to the reports are summarized in Table I.
Assignments of Different Absorbance Peaks a
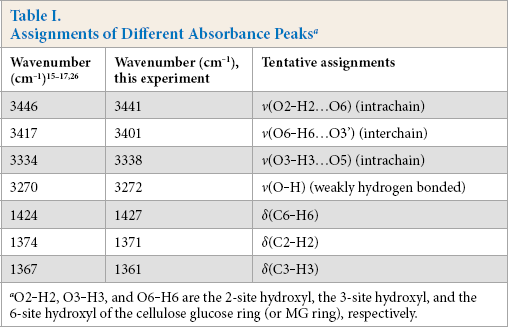
O2-H2, O3-H3, and O6-H6 are the 2-site hydroxyl, the 3-site hydroxyl, and the 6-site hydroxyl of the cellulose glucose ring (or MG ring), respectively.
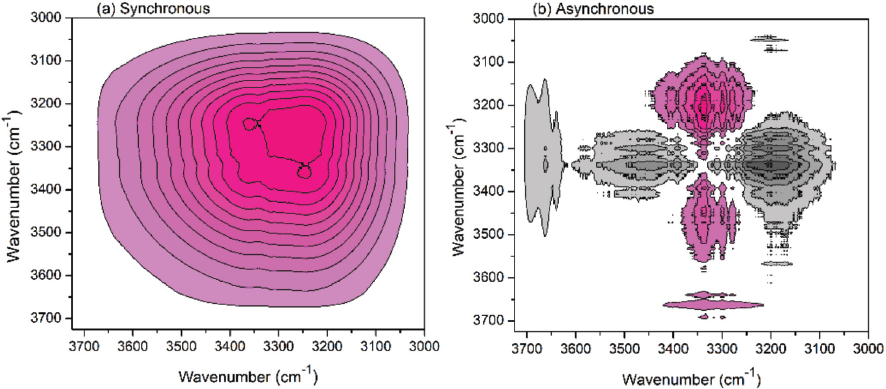
2Dcos (a) synchronous and (b) asynchronous maps of cotton treated with NaOH solution (3725-3000 cm−1). Due to the different resolution levels, the wavenumbers of absorbance peaks may be a little different in the measured spectra and 2Dcos maps, and the wavenumbers in the measured spectra were used for analyses.
2Dcos included synchronous and asynchronous spectra. The synchronous spectrum reflected the relationship of spectral changes at two given wavenumbers, and positive and negative correlation values mean that the intensities at two wavenumbers simultaneously changes in the same directions (both of them increased or decreased) and in opposite directions, respectively. The asynchronous spectrum indicated sequential or unsynchronized changes of spectral intensities at two given wavenumbers. The asynchronous map (Fig. 2b) showed higher resolution than the synchronous one (Fig. 2a), because more peaks (reflected by the contour maps) could be observed in the asynchronous map. According to Noda's rule (
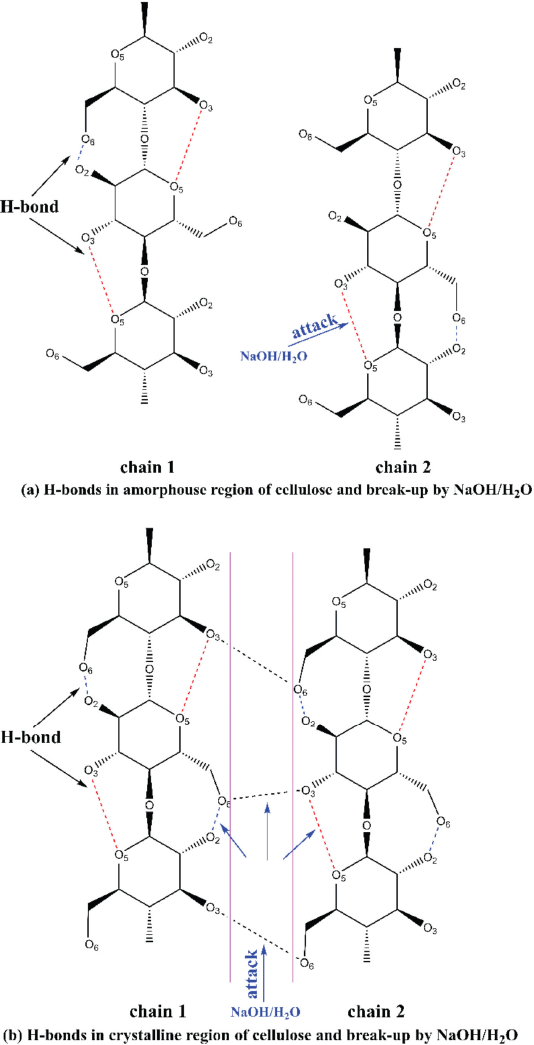
The scheme of H-bonds destroyed by NaOH solution in (a) the amorphous region and in (b) the crystalline region (hydrogen atoms are not shown).
With the process continuing, O6-H6…O3’ was destroyed prior to O2-H2…O6 in the crystalline region. This can be explained in Fig. 3b. The NaOH solution diffused faster in the zone between the various cellulose chains (the zone between the two pink lines) than into the interior of the chains (the zone between the pink line and cellulose chain) due to the steric effect. Therefore, the intermolecular H-bonds were first destroyed, and the change was recorded in the infrared spectra.
For the change of O3-H3…O5 bonds in the crystalline region, it will overlap with the change in the amorphous region. This can be explained as follows. The breaking of O3-H3…O5 bonds (H-bonds) in the amorphous region occurred first during alkaline treatment, and the related hydroxyls became free. The crystalline region would be converted to an amorphous region as the NaOH treatment time was prolonged, while the O3-H3…O5 bonds in the crystalline region were also broken and converted to free hydroxyls. Therefore, the changes of O3-H3…O5 bonds in the crystalline region and amorphous region overlapped each other, which might not be separated with each other in ATR-FTIR spectra.
Besides the H-bonds between hydroxyls, the C-H bonds connecting to the hydroxyls can also be affected during the alkaline treating process and the spectra change can be recorded. Therefore, the changes of absorbance peaks between 1500 and 1300 cm−1 were further analyzed by the 2Dcos program and contour maps are shown in Fig. 4. Based on the results in Fig. 4 and Noda's rule, it was concluded that 1367 cm–1 → 1427 cm–1 → 1371 cm–1, or
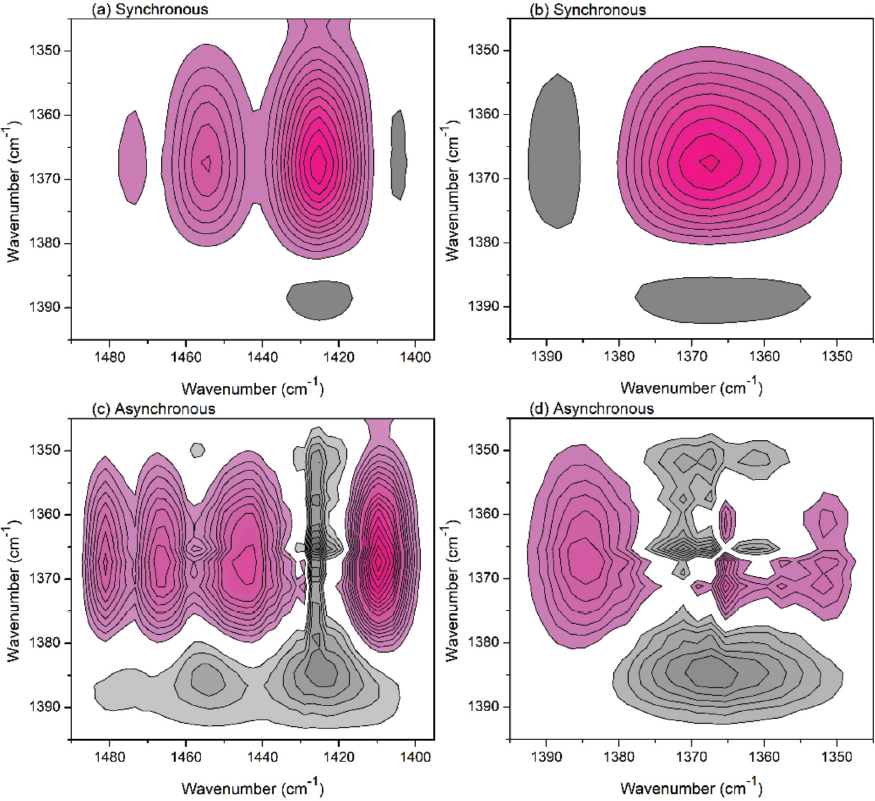
2Dcos (a) (b) synchronous and (c) (d) asynchronous maps of cotton treated with NaOH solution (1495-1345 cm−1).
Calculation
The alkaline treatment of cotton can be considered as a reaction between cellulose hydroxyls (a weak acid) with NaOH (a strong base), with sodium alkoxides formed. Consequently, the intermolecular H-bonds in the crystalline region were destroyed, and the cellulose fibers were swollen in the alkaline solution. During this process, the hydroxyl anions (OH−) will first be adsorbed onto the hydroxyls of cellulose. The modified glucose (MG) molecule (Scheme 1) was taken as a model of cellulose for the optimization calculation.
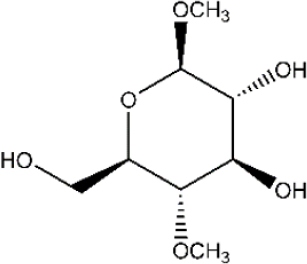
Chemical structure of the modified glucose (MG) molecule.
Results in Fig. 5 show that the MG molecule displayed an electrostatic potential (ESP) map as (from positive to negative): H(23) (connected with O3) > H(27) (connected with O6) > H(19) (connected with O2). Therefore, OH− was first adsorbed onto the O3-H3, and then onto the O6-H6. Finally, OH− would be most slowly adsorbed onto the O2- H2 among these three kinds of hydroxyls. This corresponds with the changing sequence order of H-bonds in Fig. 2.
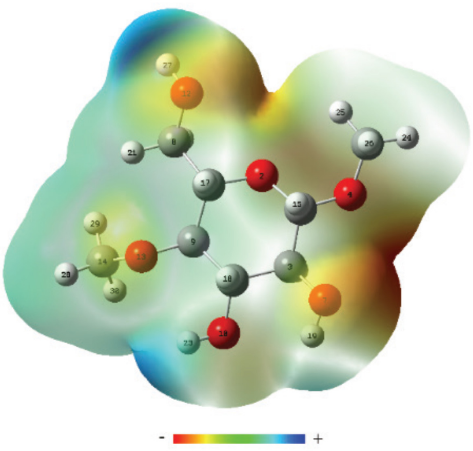
The electrostatic potential (ESP) of the MG molecule.
After adsorption, OH− will attack the hydrogen atom (H) of the hydroxyls in cellulose. According to molecular frontier orbital theory, 29 this should be determined by the highest occupied molecular orbital (HOMO) of OH− and the lowest unoccupied molecular orbital (LUMO) of the cellulose. For this reaction system, the HOMO was a constant, we could only consider the contributions of different hydroxyls to LUMO to compare the reactivity of different hydroxyls. Results (Fig. 6a) indicate that the contributions of different hydroxyls to the LUMO of the MG molecule was as follows: H(23) (connected with O3) > H(27) (connected with O6) > H(19) (connected with O2), which was in accordance with the changing sequence order of H-bonds as discussed previously. However, the contributions of H(27) and H(19) to the LUMO were close, 7.64% and 6.47%, respectively. In addition, changes in Gibbs free energies (ΔG) for the reaction of OH− with the MG molecule were also obtained (Fig. 6b). From the perspective of thermodynamics, the reactivity of different hydroxyls was O3-H3 > O2-H2 > O6-H6, and all hydroxyls reacted with OH- spontaneously due to the negative ΔG. The difference of ΔG (10.95 kJ/mol) between O2-H2 and O6-H6 was much less as compared with ΔG values for the reactions (-215.55 kJ/mol and -204.60 kJ/mol, respectively). All in all, O3-H3 was the most reactive hydroxyl and its change was the first recorded in the ATR-FTIR spectra.
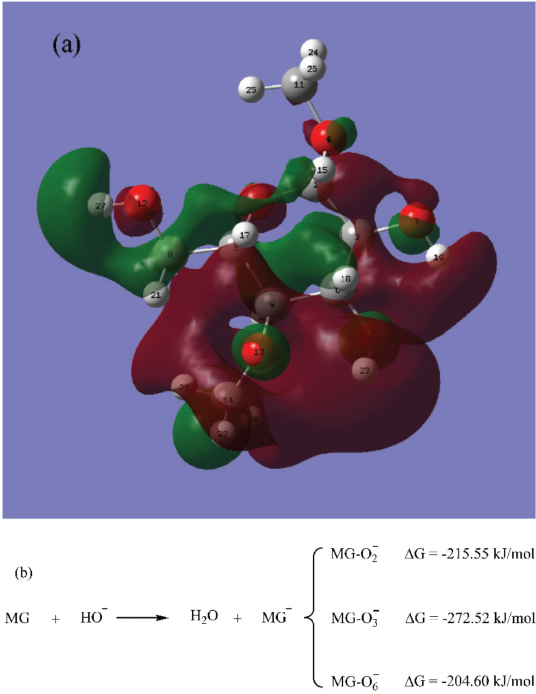
(a) The LUMO distribution of the MG molecule and (b) the ΔG of OH with the MG molecule.
Effects on the Crystallinity
Fig. 1b reveals that the alkaline treatment process of cotton included three stages based on this experiment: (1) the fast changing stage of 0-300 s; (2) the slow changing stage of 300-600 s; and (3) the relatively steady stage of 600-1500 s. To investigate the effects of alkaline treatment on the crystallinity of cellulose, the samples were characterized by XRD and the crystallinity of cotton was calculated by Eq. 2. In Fig. 7a, the control sample shows the characteristic peaks of cellulose I at 14.8° (plane (101)), 16.2° (plane (10)), and 22.8° (plane (002)). The cotton treated for 50 s showed the characteristic peaks of cellulose II at 12.2°, 20.4°, and 21.7°. The peaks increased with increased time, indicating a transformation of cellulose I into cellulose II. The peak at 2θ = 22.8º gradually decreased and broadened, because the crystalline regions were destructed by the NaOH solution. Fig. 7b shows that XRD and FTIR results were in good agreement with each other, with both indicating the decrease of cellulose crystallinity as the alkaline treatment time was prolonged. Due to the high initial concentration of NaOH solution, the crystallinity of cellulose showed a big drop at 50 s, and then decreased slowly.
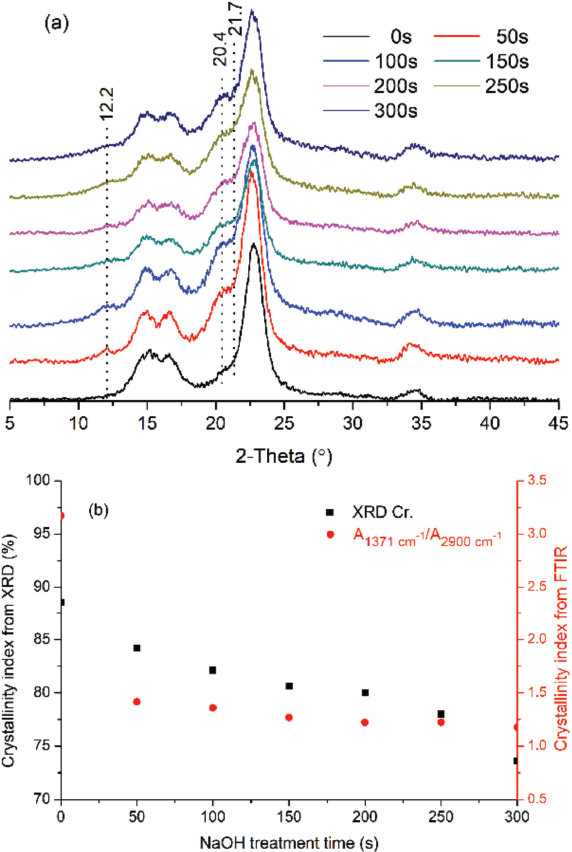
(a) The XRD spectra and (b) the crystallinity index of cotton treated with NaOH solution for different times.
Conclusions
The hydroxyl changing mechanism of cotton cellulose treated with NaOH solution was characterized by ATR-FTIR with the assistance of 2Dcos. Analyses on the changes of hydroxyls and correlated C-H bonds indicated that the changing sequence order of H-bonds was ν(O3-H3…O5) (intramolecular) → ν(O6-H6…O3’) (intermolecular) → ν(O2-H2…O6) (intramolecular). Besides, this mechanism was also confirmed by Gaussian calculations on the ESP of the MG molecule and the LUMO locations at the different hydroxyls. The crystallinity of alkaline-treated cotton cellulose decreased with time increasing to 300 s, and XRD and FTIR presented a similar decreasing tendency of the crystallinity index.
Footnotes
Acknowledgement
This project was financed by the National Natural Science Foundation of China (grant number 51803025) and the China Postdoctoral Science Foundation Project (grant number 2018M641893).