
Abstract
In the present study, the significance of nanofiller lead oxide (PbO) on the dynamic mechanical analysis (DMA) and interlaminar shear strength (ILSS) performance of luffa fiber–reinforced epoxy composites was investigated. The epoxy matrix was altered with nanofiller PbO of different weight percent through a mechanical stirring process. The PbO-added luffa fiber epoxy composites were made through hand layup preceded by the compression molding method. The prepared composite samples were investigated for ILSS and DMA. The test results lead to the inference that the 1.25 wt% PbO nanofiller–added composite samples attained 25%, 17%, and 55% of higher loss modulus, storage modulus, and ILSS, respectively, as compared with the other prepared samples. The morphological investigation was conducted on the fractured surface of the interlaminar tested samples. The micrographic images show the bonding nature of the luffa fiber with the epoxy matrix, fiber breakage, and fiber pullouts. The characterization studies such as FTIR, XRD, and EDX were conducted on the fabricated composite samples. The XRD studies show that the rise in weight percent of the nanofiller PbO enhances the crystallinity of the composite samples. Moreover, the composite sample prepared with 1.25 wt% nanofiller PbO can be used to prepare low-cost roofing materials for sustainable housing projects.
Keywords
Introduction
The demand for using natural fibers for preparing green composites for domestic and several industrial applications has initiated an interest to use natural fiber as reinforcement to make eco-friendly materials [1–4]. The attractive nature of natural fibers such as low cost, low density, accessibility, and sustainable nature prompted their use as reinforcements in various studies [5]. Natural fibers such as coir [6], sisal [7], jute [8], luffa [9], and banana [10] were usually used as reinforcements to make polymer composite materials. However, the prepared natural fiber composite materials can substitute synthetic fiber composite materials in light-duty applications. The natural fiber composites find their potential usage in automobiles, musical instruments, aerospace, construction, and marine sectors [11]. The usage of natural fiber composites is limited to high-duty applications due to their poor bonding and incompatibility with the matrix [12]. To enhance the compatibility of the fiber with the matrix and to use it for high-duty applications, various methods have been reported. Surface treatments are the most commonly used methods to enhance the adhesion between the fiber and the matrix. Surface treatments such as alkali [13–15], silane [16,17], benzoyl chloride [18], isocyanates [19], and permanganate [20] were used. Furthermore, the alkali treatment was the most frequently used surface treatment method. Shanmugasundaram et al. deliberated the consequence of alkali treatment on Areca palm leaf stalk fiber with different wt% of NaOH (5, 10, and 15) and observed that the 5 wt% alkali treatments showed an improvement in the mechanical and thermal stability of Areca palm leaf stalk fiber as compared with the untreated fiber [11]. Yan et al. investigated the influence of 5 wt% alkali treatment in coir fiber polymer composites for 30 min and concluded that the alkali treatment raises the tensile strength by 17% and flexural strength by 16.7% [6]. Bharath et al. explored the effects of 5 wt% alkali treatment in Moringa oleifera fiber and determined that the alkali treatment raises the cellulose content of the fiber, and it may be because of the removal of oily substances and waxes from the fiber [21]. From many studies of alkali treatment, it is well-recognized that the 5 wt% alkali treatment shows good bonding with the polymer matrices. Hence in the present study, the luffa fiber was treated with 5 wt% NaOH for 1 h to enrich its adhesion with the epoxy matrix.
Furthermore, to enrich the properties of natural fiber composites, the accumulation of organic and inorganic fillers is used in various studies. Even though several matrices were used for creating fiber-reinforced composites, the epoxy polymer is frequently used, owing to its specific properties such as good strength, resistance to indentation, and better bonding nature. The problems associated with an epoxy polymer such as low impact strength, low breakage durability, and brittle quality limited its use in structural applications [9]. To enhance the mechanical performance and to increase its use in structural applications, the epoxy matrix was modified with fillers. Fillers such as nanoclay [22], SiC [23], TiO2 [24], Al2O3 [23], and graphene oxide [25] were most frequently used in polymer composites. Despite organic and inorganic fillers used with epoxy to enhance their properties, few problems will arise during the preparation of composite materials. One is the strong affinity of nanofillers to aggregate because of their high surface area, and another one is the lack of strong interfacial adhesion between the filler particles and the polymer chains if more volume of filler particles is used [26,27]. Soundhar et al. deliberate the consequence of the crab shell filler on the mechanical performance of jute fiber composites, and they reported that the incorporation of the filler increases the mechanical performance of jute composites. Moreover, the addition of a filler of more than 4 wt% reduces the mechanical performance, and it is due to the cluster of fillers [7]. Prasad et al. investigated the addition of nanofiller titanium oxide with an epoxy of different weight percentages of 0.5, 0.7, and 0.9. From the study, it is concluded that the addition of the nanofiller increases the flexural, tensile, and impact strength. Furthermore, the incorporation of the nanofiller reduces the water absorption tendency of the polymer composites [28]. Patnaik and Nayak studied the effect of silicon carbide filler addition with jute/epoxy composites. The mechanical properties such as hardness, tensile strength, flexural, and impact strength of jute/epoxy composites were improved on the addition of 15 wt% silicon carbide particulate filler by 39.47, 52.5, 48.5, and 14.5% respectively [8]. Hence in this study, the epoxy matrix was modified with nanofiller PbO to make luffa fiber–reinforced composites for low-range radiation-shielding materials.
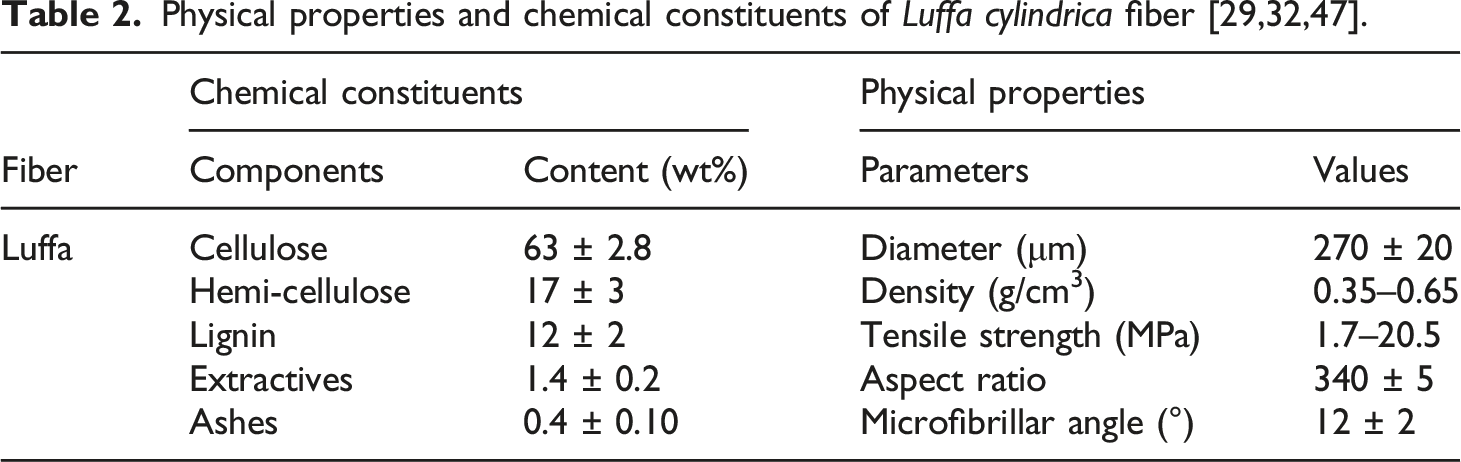
In the present work, the Luffa cylindrica fiber is used as reinforcement. Fibers such as banana, jute, sisal, and coir are the most frequently used reinforcements in polymer composites [18]. The chemical composition of luffa fiber, such as cellulose 64%, lignin 15%, hemicellulose 17%, ash 0.4%, and extracts 3.2%, is related to some frequently used natural fibers [29,30]. The young luffa fruit contains compounds such as phenolics, flavonoids, ribosome-inactivating protein, and triterpenoids, made to use as medicine for immune-stimulatory and anti-inflammatory agents [31,32]. The striking features of the luffa fiber over other natural fibers are lightweight, remarkable stiffness, strength, sound absorption properties, and low extraction cost trigger to use as reinforcement in polymer composites [33,34]. The matured luffa fruit has a unique knitting arrangement, and it appears as a 3D mat-like structure after drying, which does not exist in other natural fibers [33]. Anbukarasi and Kalaiselvam studied the consequence of surface treatments on luffa fiber composites in different arrangements (mat, particle, and short). They conveyed that the treated mat-structured reinforced luffa fiber increases the mechanical properties [32]. Mohanta and Acharya explored the influence of surface treatments on luffa fiber composites, and they conveyed that the mechanical performance of luffa fiber increases with surface treatments. The prepared composite samples can be used for making door panels, false ceilings, and partition boards [18]. Chen et al. reported that the luffa fiber absorbs more moisture than other natural fibers due to the presence of porous structures and surface grooves. To reduce the moisture absorption of the luffa fiber, the authors surface-treated the luffa fiber with NaOH with different weight percentages. The authors concluded that the 5 wt% alkali treatment reduces moisture absorption [35]. In many studies, it was perceived that the mechanical performance of the luffa fiber was enhanced with surface treatments. Moreover, a few studies reported the addition of nanofillers for enhancing the properties of luffa fiber. Mohana Krishnudu et al. studied the effect of nanofiller CaCO3 addition with luffa-/coir-reinforced epoxy composites on mechanical and dielectric properties. The authors conveyed that the addition of the filler increases the mechanical properties for optimum wt% of the filler [36]. Ashok studied the effect of nanofiller graphene on mechanical, ballistic impact, and water absorption behavior of luffa fiber composites. The authors conveyed that the luffa fiber with epoxy, modified with nanographene, enhances the ballistic impact behavior and mechanical performance as compared with luffa fiber without the nanofiller [9]. Even though it is not so much explored as reinforcement in polymer composites, to enrich the performance of luffa fiber for industrial applications, the current work has been carried out; moreover, no work is reported on interlaminar studies and dynamic mechanical analysis (DMA) on luffa fiber with nanofiller PbO. In this perspective, an attempt was made to enrich the performance of the luffa fiber composite with nanofiller lead oxide (PbO) addition. Lead oxide (PbO) is an inorganic compound used for making lead-based industrial glass and ceramic components. In addition to that, a few works have reported the influence of lead oxide nanofillers on the behavior of polymer composites [37,38]. On the other hand, lead oxide filler grabbed the attention of researchers due to its significant properties such as radiation shielding, and thermal, structural, dielectric, and good compatibility with other materials [39,40]. The authors [3] have already studied the influence of nanofiller PbO on the mechanical, thermal, and water absorption properties of a luffa fiber composite. Mohamed et al. studied the effect of nanofiller PbO with recycled high-density polyethylene plastics as a radiation-shielding material. The authors reported that the addition of nanofiller PbO with plastics enhances the radiation-shielding properties for low-range gamma radiation doses as compared with bulk PbO [41]. Atef et al. studied the mechanical and radiation-shielding properties of PbO-filled polyvinylchloride/acrylonitrile butadiene rubber polymer blends. The authors conveyed that the addition of the prepared polymer blends with PbO is suitable for low-range gamma radiation–shielding applications [42]. The performance of luffa fiber with nanofiller PbO addition can be further investigated with ILSS and DMA, to determine the shear strength and viscoelastic behavior of prepared composite samples. Merzoug et al. studied the quasi-static and dynamic mechanical–thermal performance of date palm/glass fiber composites. The authors concluded that the addition of date palm fiber with glass fiber enhances the glass transition temperature and damping behavior of prepared samples [43]. Shahroze et al. investigated the effect of nanoclay content on dynamic mechanical properties of sugar palm fiber polyester composites. The authors reported that the optimum wt% of nanoclay enhances the dynamic mechanical properties [44]. The current work attempts to study the influence of nanofiller PbO on the ILSS and DMA of luffa fiber composites and to upscale the luffa fiber into a potential reinforcement to prepare a low-cost roofing material.
Materials and experimental details
Materials
Properties of nanofiller PbO.


SEM image of nanofiller PbO.
Extraction of luffa fiber
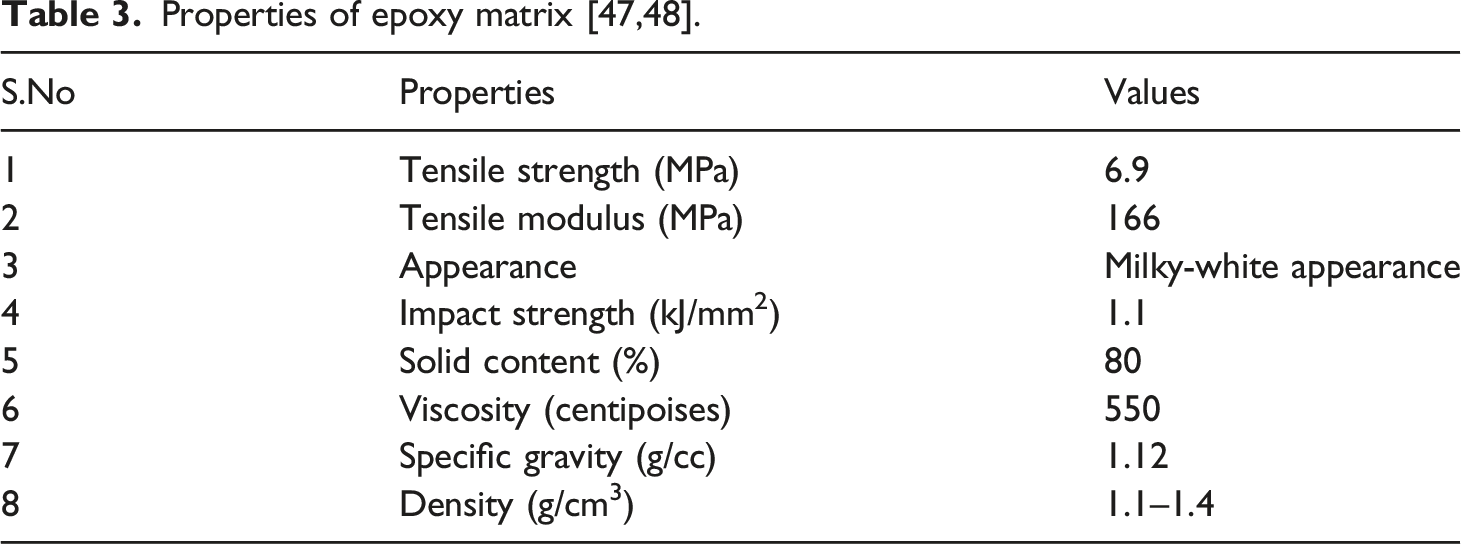
The Luffa cylindrica fruits were collected from local sources and are shown in Figure 2(a). The collected fruits were preserved in sunlight for 2 days, and after drying, the outer shell is detached from the fruit manually, and after removing the shell, it has a fibrous-like structure as shown in Figure 2(b). The luffa fiber is cut in the form of a mat, and it is shown in Figure 2(c). The properties of the luffa fiber and epoxy resin are given in Tables 2 and 3. The fibers are cleaned with distilled water for the removal of dust particles present in them and then kept in sunlight for the removal of moisture from the fibers. The cleaned and dried luffa fibers were immersed in 5 wt% NaOH in a beaker for a duration of 1 h. After 1 h, the treated fibers were taken out from the beaker and scrubbed using purified water for the removal of the sticking sodium hydroxide, to neutralize the fiber surface. Then, the washed fibers are kept in the oven and heated at a temperature of 80°C [1,49]. (a) Luffa fruit; (b) luffa fiber; (c) luffa fiber mat.
Fabrication of the composite material

Designation and composition of prepared composite materials [3].


Photographic image of prepared composites.
The density of luffa fiber, nanofiller PbO, and epoxy matrix are 0.56, 9.53, and 1.3 g/cm3 respectively. The linear density of the fiber is 0.07 g/cm.
Experimental details
Interlaminar Shear Strength
The ILSS of the prepared composite samples was tested using the short beam shear test method (bending mode II). The samples for the investigation were machined with sizes as per the ASTM standard D2334 [24,28]. The universal testing machine (model UTN-40; FIE Pvt. Ltd., India) with a crosshead speed of 1 m/min was used to apply the load onto the sample. The diameters of the support cylinder and the loading nose were prepared as per the standards. The specimen dimensions such as length and breadth were adjusted according to the thickness of the sample. The samples for the test are prepared with a dimension of 18 mm × 6 mm × 3 mm [51]. The ILSS was calculated using equation (2) [52].
Dynamic Mechanical Analysis
The DMA is a technique used to define the viscoelastic behavior (storage modulus, loss modulus, and damping factor) of the luffa/epoxy and nanofiller PbO-added luffa fiber epoxy composites [53,54]. The DMA performance of different weights of PbO-added luffa fiber epoxy composites was examined using Model DMS 6100 (SII Nano Technology, Japan). The samples for the DMA test were machined with dimensions of 55 mm × 13.5 mm × 3 mm as per ASTM standard D 4065 [8]. The experiments were performed using the three-point bending mode with a constant frequency of 1 Hz in a nitrogen environment [54]. The temperature range of 30°C−150°C was ramped with a heating range of 3 °C/min.
Characterization studies
Scanning electron microscope
The micrograph investigation was conducted on the tested specimens using a Hitachi S-3400N SEM. Details such as the adhesion strength between the fiber and the resin, internal failures, interfacial bonding, voids, and fiber pullout are shown with the help of SEM images. The samples for the micrograph study were glazed with gold for a depth of 15–20 nm through an ion-sputter device.
Fourier transform infrared spectroscopy
Fourier transform infrared spectroscopy (FTIR) is an analysis used for finding various bonds, functional groups, structures, and stretching of bonds in the prepared composite materials. The FTIR analysis is conducted using a Perkin–Elmer-make infra spectrometer. The spectrum is recorded with wavenumbers stretching from 4000 to 400 cm−1 with a resolution of 4 cm−1. The FTIR analysis is conducted on the samples with and without the nanofiller at a scanning speed of 2 mm/s.
X-ray diffraction
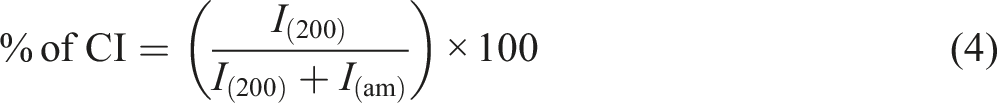
X-ray diffraction analysis is a technique used for computing the crystalline size and crystalline index of the fabricated samples. The samples with and without nanofillers were inspected for XRD with settings of the current 30 mA and temperature 25°C. The signals were recorded for 2θ in the range of 10° to 90°. The monochromatic radiation source used for the analysis is Cu Kα with a wavelength of 0.514 nm. The crystallinity index (CI) and the percentage of the crystallinity index of the fabricated samples are computed using equations (3) and (4) [55,56]

Energy-dispersive X-ray spectroscopy
Energy-dispersive X-ray spectroscopy (EDX) is a method used for identifying the chemical elements present in a sample. It will show both the qualitative and quantitative data of the chemical elements present in the sample. The data gained from the EDX analysis shows the spectra with peaks equivalent to the chemical elements present in the composite samples. The peak positions in the EDX analysis show the position of the chemical elements whereas the peak heights in the analysis show the quantity of each element present in the sample.
Results and discussion
Interlaminar Shear Strength
The ILSS test was performed on the luffa fiber/epoxy composite and nano PbO-filled luffa fiber/epoxy composite samples to know the interface between the fiber and the matrix and to understand the contributions made by nano PbO. The effect of PbO filler loading on the ILSS of luffa fiber/epoxy composites is shown in Figure 4. The results showed that the improvement of ILSS was perceived with the addition of nanofiller PbO in luffa fiber composites. The increase in ILSS is due to the addition of nanofiller PbO with an epoxy matrix which prompts the mechanical interlocking of the epoxy matrix and the luffa fiber. The 1.25 wt% PbO added composite sample–yielded maximum ILSS values of 6.26 MPa. The percentage increase in the ILSS with the incorporation of 1.25 wt% PbO was 55% when compared with the luffa fiber composite without nanofiller PbO. The increase in ILSS is due to the addition of PbO nanofillers with the matrix, which may act as interlocking agents between the luffa fiber and the matrix, and as a consequence, the frictional slippage between the fiber and the matrix is restricted. The addition of nanoparticles beyond 1.25 wt% decreases the ILSS, and it may be due to an increase in the filler causing more particle-to-particle interaction rather than causing the nanoparticles to interact with the fiber and the matrix. The same trend in results was witnessed by various researchers for ILSS with nanofiller addition [24,57]. An increase in the filler content may increase the microspaces among the filler and the matrix; the clustering of particles causes inadequate dispersion of the nanofiller with a matrix that may decline the filler–matrix interfacial bonding and thereby reduce the ILSS of the composite samples. It is observed that a 36% increase in interlaminar strength was achieved as compared to works reported in Ref. [57,58]. Effect of PbO content (wt %) on interlaminar shear strength.
Micrograph inference on ILSS
The fractured surfaces after the ILSS test were examined using an SEM for evaluating the interlaminar bonding between the matrix and the fiber. Figure 5(a)–(f) show the micrograph images of ILSS-tested samples with PbO nanofiller in the epoxy matrix from 0 wt% to 6.25 wt% of luffa fiber/epoxy and PbO filler–added luffa fiber epoxy composites. Figure 5(a) shows the micrograph images of the luffa/epoxy composites, and from the figure, it is clear that the fibers were drawn out from the epoxy matrix, and it is due to the poor interfacial adhesion between the epoxy and the luffa fiber. From Figure 5(b) it is evident that the incorporation of the nanofiller PbO with epoxy shows minimum fiber pullout, which results in enhanced interfacial bonding. The increase in interfacial bonding was observed for 1.25 wt% PbO (sample C2), and it may be due to the good bonding between the matrix epoxy and the luffa fiber. Figure 5(c)–(f) shows the micrograph images of interlaminar-tested samples with 2.5, 3.75, 5, and 6.25 wt% of PbO-added epoxy composites. From the SEM images, it is evident that more regions of fiber pullout were spotted, and it may be due to the cluster of the nanofiller PbO with the epoxy matrix. The increase in weight percentage of nanofiller PbO with the epoxy matrix causes the particle-to-particle interaction, and this leads to a decrease in the ILSS. The same trend was reported by various researchers with micrograph analysis of the interlaminar shear–tested samples [24]. Micrograph images of (a) 0 wt%, (b) 1.25 wt%, (c) 2.5 wt%, (d) 3.75 wt%, (e) 5 wt%, and (f) 6.25 wt% loaded PbO luffa/epoxy composites.
Dynamic Mechanical Analysis
The dynamic mechanical investigation shows particulars such as the storage modulus, loss modulus, and damping factor of the prepared composite samples and it is described in the subsequent sections.
Storage modulus
Figure 6 shows the variations in the storage modulus of luffa fiber epoxy composites with and without nanofiller PbO addition. The deviations in the storage modulus concerning temperature change were observed. From Figure 6, it is apparent that the storage modulus tends to decrease with a temperature rise. The composite sample with 1.25 wt% nanofiller PbO showed the maximum storage modulus value with a percentage increase of 25% as compared with the sample without nanofiller addition. This might be due to the enriched interfacial adhesion between the matrix and the fiber. Furthermore, the addition of nanofiller PbO with the epoxy matrix resists the movement of the polymer chain and, thus, increases the storage modulus of the prepared sample. The bonding strength of the composite samples is directly related to the storage modulus. A similar trend in results was proved by various researchers [44,59]. The addition of nanofiller PbO beyond 1.25 wt% showed a decrease in the storage modulus. It is clear that in the glassy region, the storage modulus values of the prepared composite samples are in a higher range, and it is due to the strongly packed molecular chains. Moreover, the sudden drop in storage modulus was observed at a temperature range of 80–100°C, and it is due to the glass/rubbery state change. While increasing the temperature, the composite samples tend to lose their tight molecular packing arrangement, which gradually decreases the storage modulus in the rubbery region [60]. Effect of PbO loading (wt %) on the storage modulus.
Loss modulus
The dissimilarities in the loss modulus of the luffa fiber epoxy composites with and without nanofiller PbO are presented in Figure 7. The loss modulus of the prepared composite was plotted concerning the temperature change. From the figure, it is perceived that the loss modulus increases with the addition of nanofiller PbO. The composite sample with 1.25 wt% nanofiller PbO displayed the maximum loss modulus value with a percentage increase of 17% as compared with the sample without nanofiller addition. The high surface area of nanofillers repels the movement of the polymeric chain, and this may trigger the frictional dissipation of heat energy in the prepared composite samples resulting in higher filler and matrix interactions, which might cause the rise in the loss modulus [54]. The loss modulus of all the prepared samples rose steadily to the peak value and was followed by a sharp decrease [59,61]. It is clear from Figure 7 that the addition of nanofiller PbO causes the enlargement of the loss modulus peak due to a rise in the chain segments. Furthermore, it is observed that the loss modulus value decreased with a temperature rise, and it may be due to the free movement of the polymeric chains [44]. Effect of PbO loading (wt %) on the loss modulus.
Damping factor (Tan δ)
The effect of nanofiller PbO addition on the damping factor of luffa fiber/epoxy composites is demonstrated in Figure 8. From the figure, it is clear that the damping factor increases with the temperature rise, and it reaches a maximum in the transition region, and further temperature rise diminishes the damping factor of the prepared composite samples, and it is achieved in the rubbery region. The tan delta graph evidenced that all the prepared composite samples below glass transient temperature show the declining trend in damping factor, and it is due to the frozen chain segments. As a result, greater molecular mobility occurs which may cause the reduction in damping factor. A comparable trend in results was proven for polymer composites by various researchers [44,62]. Interestingly the incorporation of nanofiller PbO with luffa fiber/epoxy composites showed enhancement in the damping factor. The composite sample with 1.25 wt% nanofiller PbO showed the maximum damping value with a percentage increase of 33% as compared with the sample without nanofiller addition. However, it may be due to the addition of harder and stiffer nanofiller PbO with an epoxy matrix which resists the movement of the matrix molecules, causing a raise in the damping factor of sample C2. From Figure 8, it is clear that the tan delta peak became broader for the luffa/epoxy composites with PbO addition. The broader peak indicates more time for relaxation of molecules which may cause low mobility of polymer chains, and as a result higher crosslinking is formed for all luffa/epoxy composites due to improved interfacial interfaces [54]. Effect of PbO loading (wt %) on the damping factor.
Fourier Transform Infrared Spectroscopy
The confirmation of nanofiller PbO addition with the epoxy matrix, and the presence of different functional groups in the fabricated polymer composites were examined using FTIR. FTIR spectra with peaks for samples with and without the filler are shown in Figure 9. In the FTIR analysis of sample C1, the peak with wavenumber 3340 indicates the presence of O–H stretching due to cellulose [35,63]. The FTIR spectral peak at 2918 cm−1 occurs due to the C–H stretching of cellulose and hemicellulose present in the fiber [18]. The C–O stretching is seen in the FTIR spectral peak at 1400 cm−1 due to the existence of lignin in the fiber. FTIR analysis of sample C2 indicates the existence of O–H, C–H, and C–O stretches in the FTIR spectral peak at 3250 cm−1, 2930 cm−1, and 1405 cm−1, respectively. However, the fingerprint region in the FTIR image shows the peaks of metal oxide Pb–O bonding which indicates the presence of nanofiller PbO in the fabricated samples. Generally, metal oxide fillers are found in the region at a peak range of 400–950 cm−1 [28]. In FTIR analysis of sample C3, it indicates the existence of O–H, C–H, and C–O stretches in the FTIR spectral peak at 3220 cm−1, 2918 cm−1, and 1400 cm−1, respectively. The fingerprint region in the FTIR image shows the peaks in the range of 1000–413 cm−1, which indicates the existence of metal oxide PbO. The FTIR analysis of sample C4 indicates the existence of O–H, C–H, and C–O stretches in the FTIR spectral peak at 3400 cm−1, 2919 cm−1, and 1390 cm−1, respectively. The FTIR analysis of sample C5 indicates the existence of O–H, C–H, and C–O stretches in the FTIR spectral peak at 3230 cm−1, 2910 cm−1, and 1400 cm−1, respectively. The FTIR analysis of sample C6 indicates the existence of O–H, C–H, and C–O stretches in the FTIR spectral peak at 3225 cm−1, 2910 cm−1, and 1400 cm−1, respectively. From the FTIR results, it is clear that the variation in nanofiller weight percentage modification with the epoxy matrix shows a downshift in the transmittance percentage value, which indicates the confirmation of the increase of the nanofiller in the prepared composite samples; the same fashion in results was reported by [64]. Effect of filler PbO loading (wt %) on the FTIR analysis.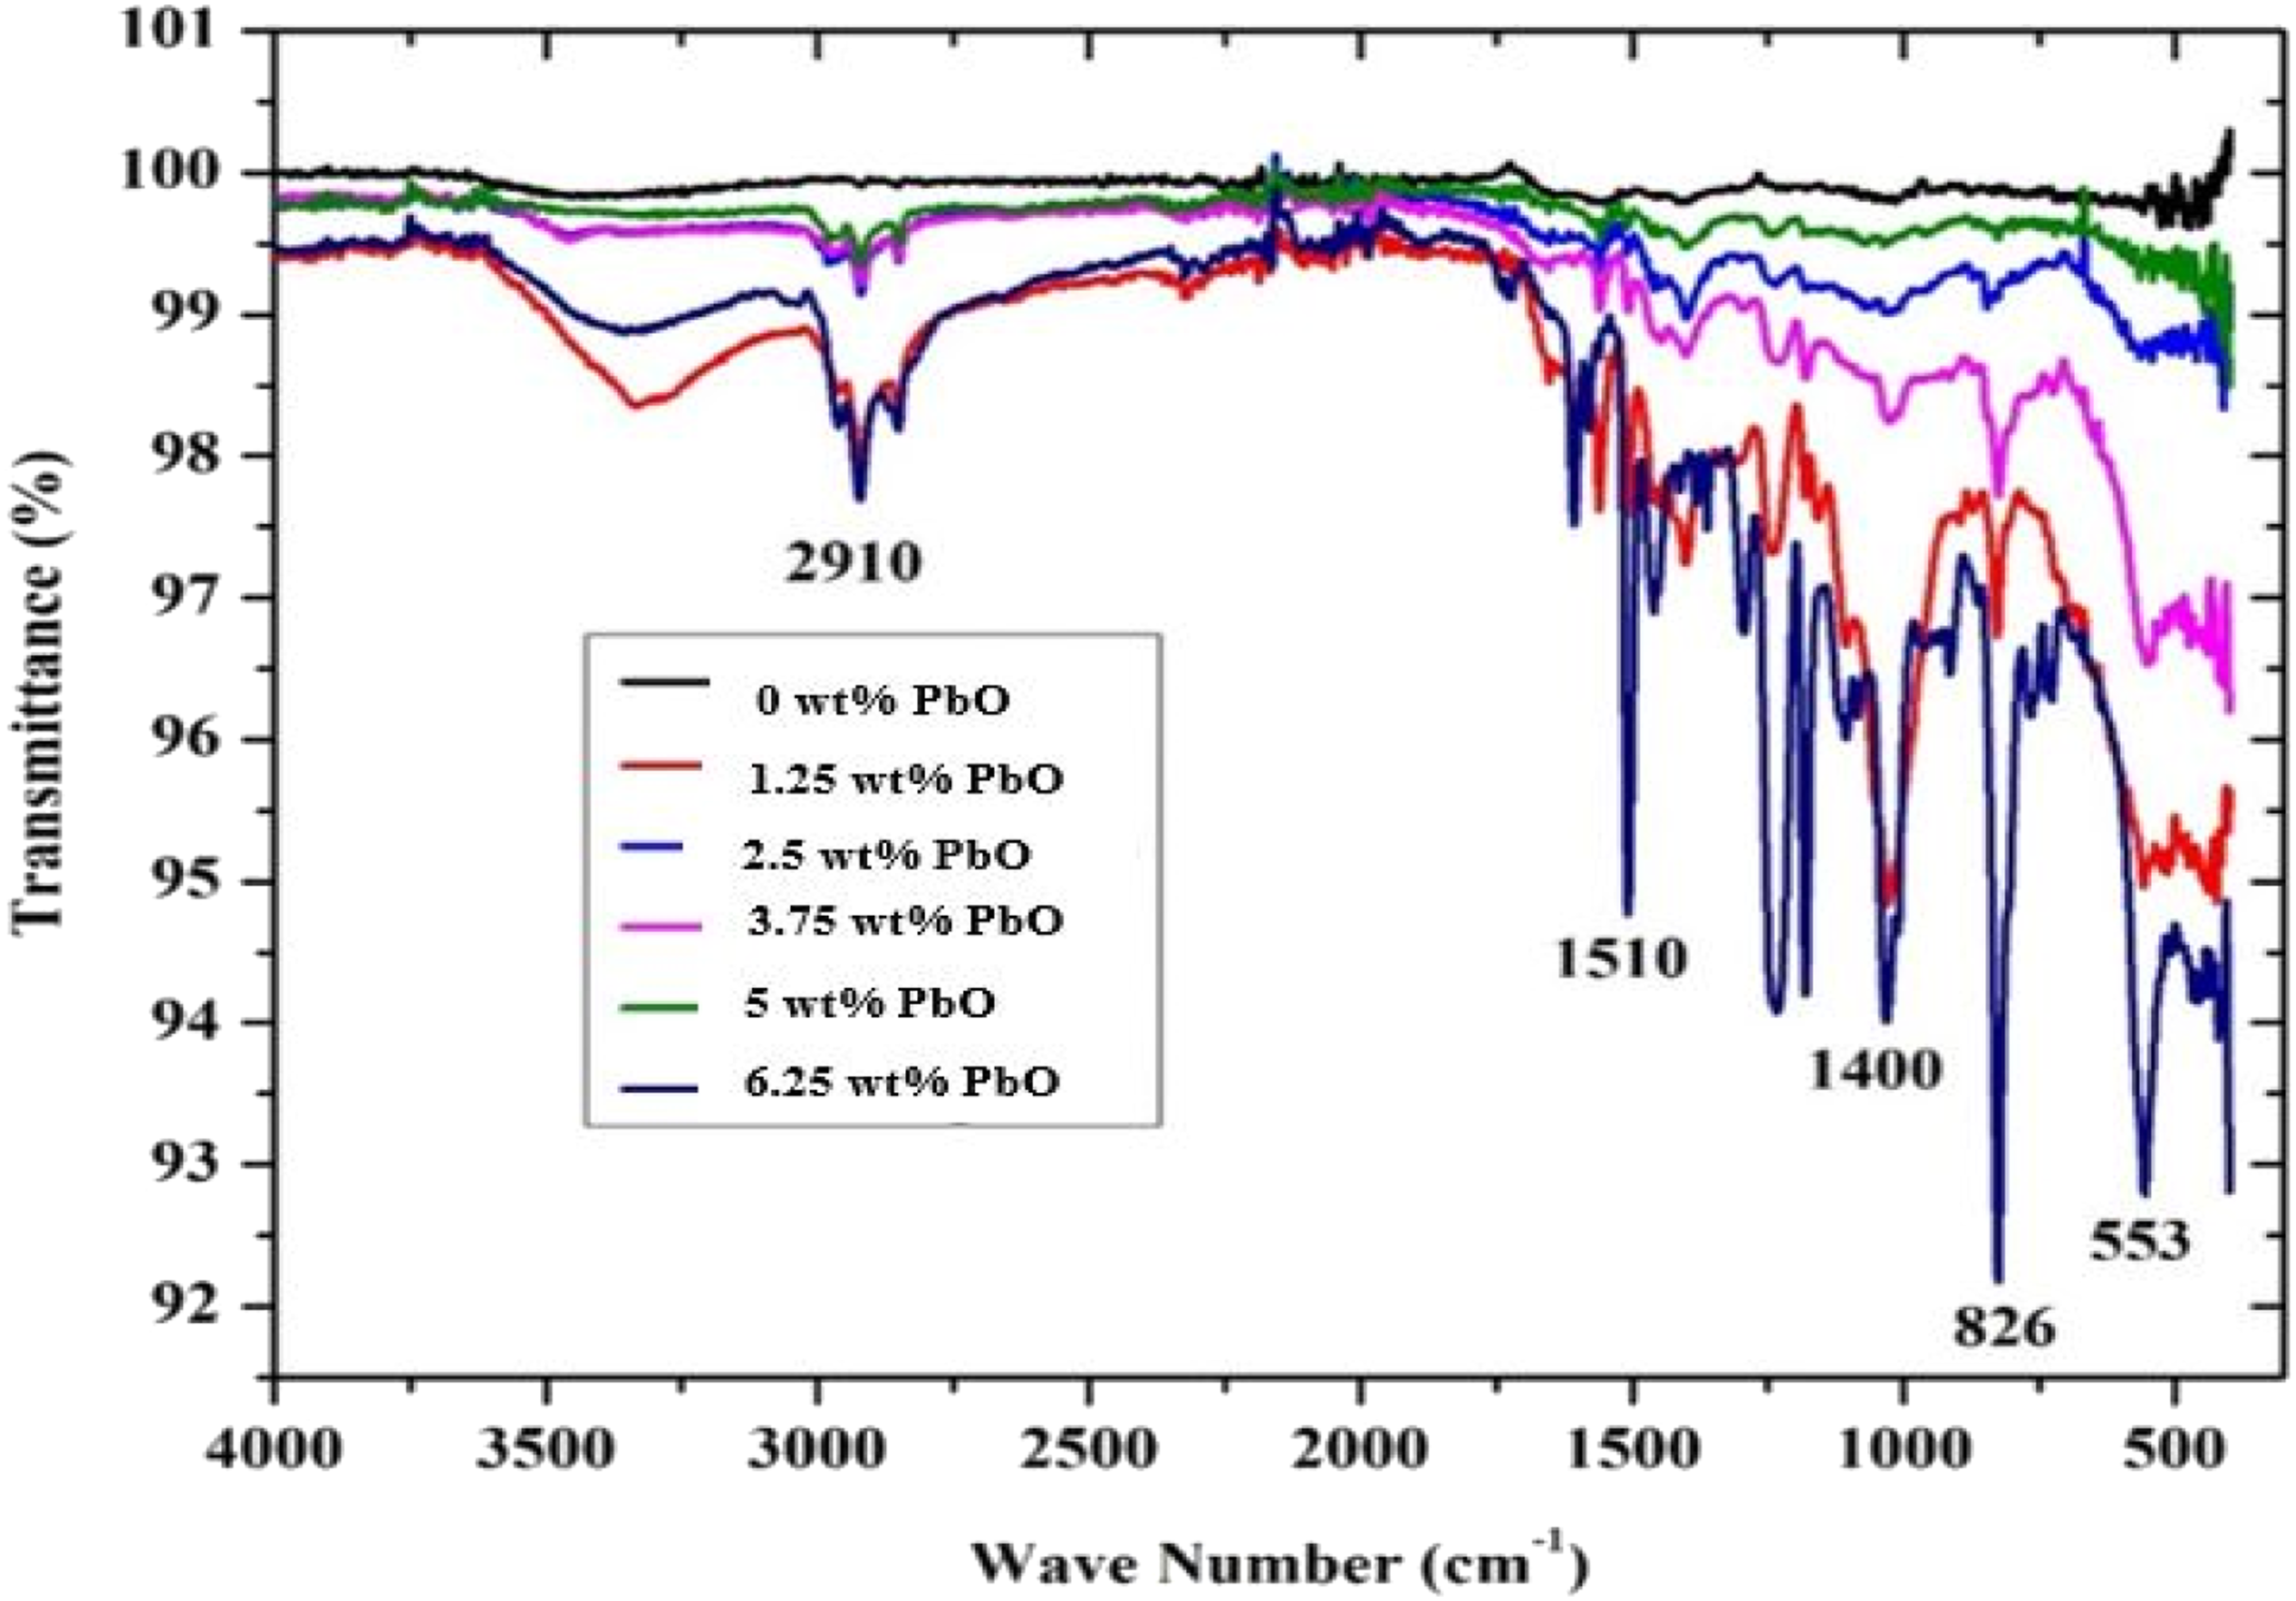
XRD analysis
XRD analysis of fabricated composite samples.

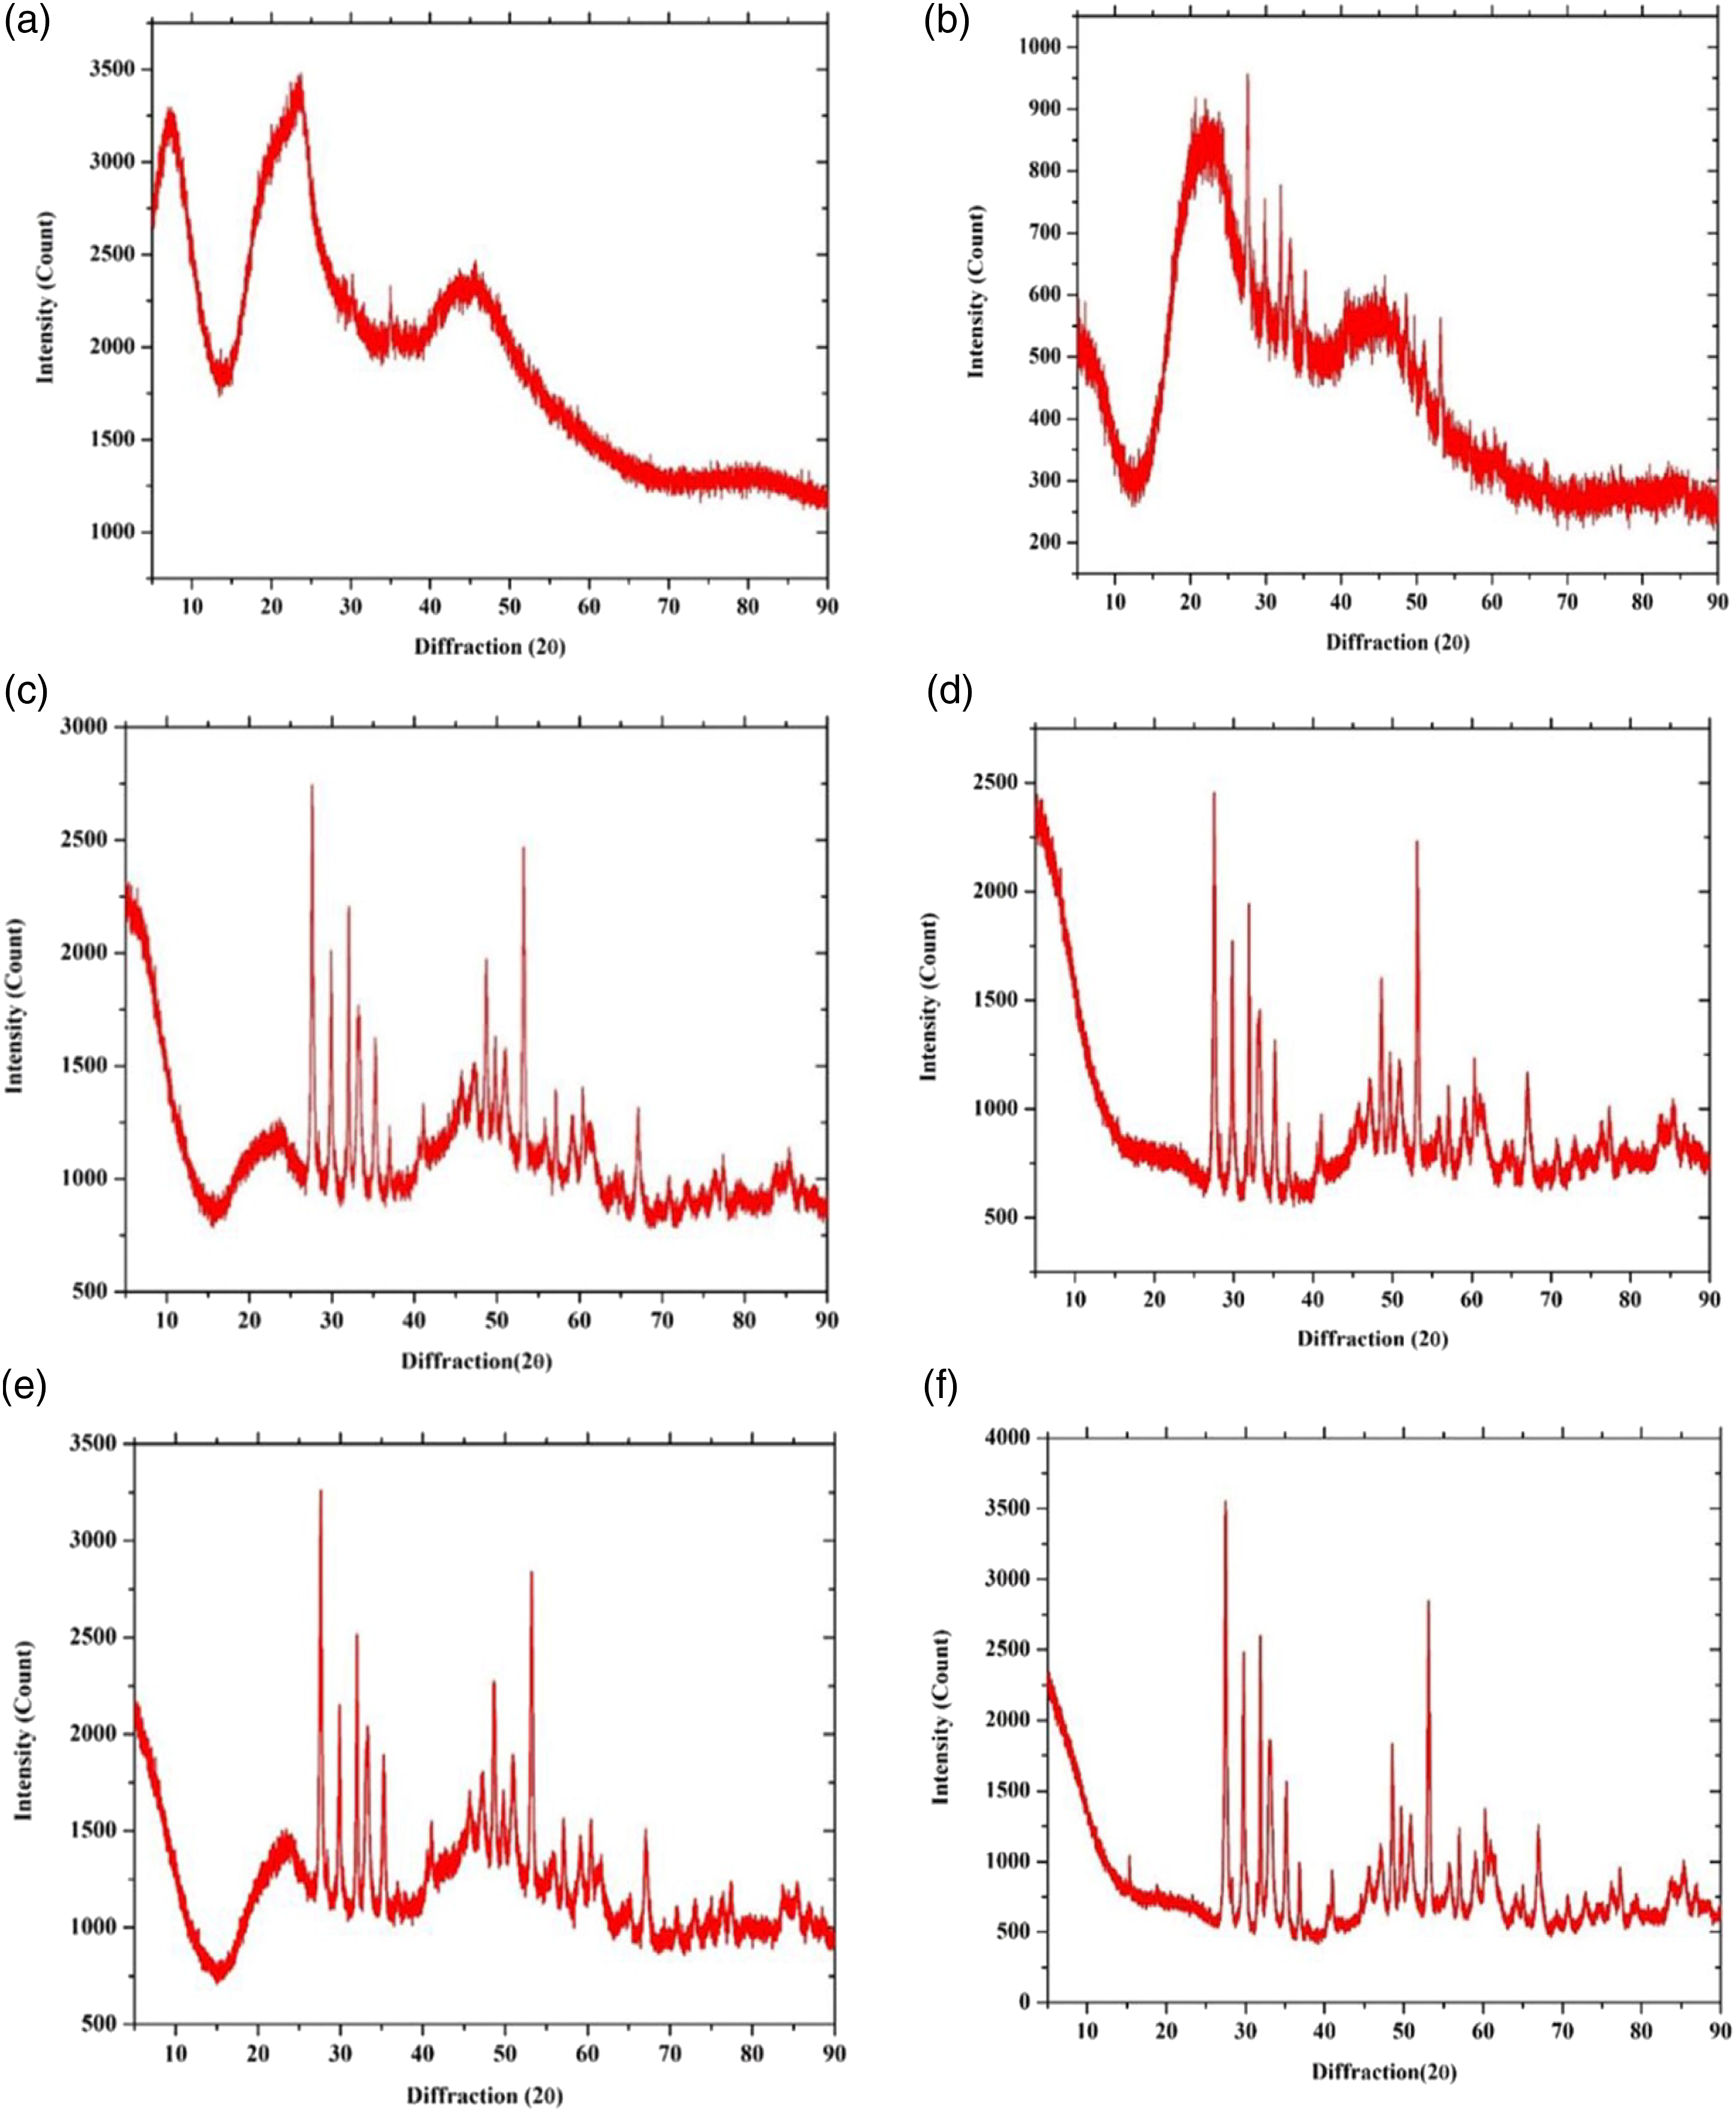
XRD analysis of composite samples: (a) 0 wt%, (b) 1.25 wt%, (c) 2.5 wt%, (d) 3.75 wt%, (e) 5 wt%, and (f) 6.25 wt% loaded PbO luffa/epoxy composites.
Energy-Dispersive X-Ray Spectroscopy
The elemental compositions of the fabricated composite samples with and without nanofiller PbO were explored using a SEM equipped with energy-dispersive X-ray analysis. The elemental compositions of all the prepared composite samples are shown in Figure 11(a)–(f). Figure 11(a) demonstrates the elemental compositions of luffa fiber without the filler (sample C1). Sample C1 shows the higher amount of oxygen (O), carbon (C), and also the low amount of elements such as silicon (Si), aluminium (Al), and calcium (Ca), and it confirms the removal of lignin, wax from the fiber surface due to the surface treatment. The same trend in elemental compositions was conveyed by [18,66]. The elemental compositions of luffa fiber with the nanofiller are shown in Figure 11(b)–(f), and from the figures, the existence of nanofiller PbO in the fabricated composite samples is evident. The atomic and weight percentages of the elemental compositions in the prepared composite samples are listed in Table 6. EDX analysis of composite samples: (a) 0 wt%, (b) 1.25 wt%, (c) 2.5 wt%, (d) 3.75 wt%, (e) 5 wt%, and (f) 6.25 wt% loaded PbO luffa/epoxy composites. Elemental compositions of fabricated composite samples.

Conclusions
The present study examined the consequence of nanofiller PbO addition on ILSS, characterization, and DMA of luffa fiber epoxy composites. The following observations were drawn from the study: • It is observed that the addition of nanofiller PbO enriched the dynamic mechanical properties of the luffa/epoxy composites. • The incorporation of the nanofiller enhanced the storage modulus, loss modulus, and damping factor. The percentage increases in the storage modulus, loss modulus, and damping factor are 25, 17, and 33%, respectively. • The ILSS test results of 1.25 wt% PbO–filled luffa/epoxy composites showed a maximum value of 6.26 MPa compared to the luffa fiber/epoxy composites without the filler. • The micrograph images of ILSS-tested samples showed better fiber–matrix bonding and minimum fiber pullout with the incorporation of 1.25 wt% nanofiller PbO. • The XRD patterns indicate the presence of metal oxide PbO fillers in the prepared composite samples. • The crystallinity index and percentage of crystallinity for 1.25 wt% PbO nanofiller–added luffa fiber/epoxy composites are 0.48 and 56.09, respectively. • The fingerprint region in the FTIR curve evidenced the presence of nanofiller PbO in luffa fiber epoxy composites. • The energy dispersive X-Ray analysis confirms the existence of carbon and oxygen as the major constituents, which proves that the prepared luffa/epoxy composites with fillers are organic. • In the future, studies on tribiological behavior and radiation-shielding properties are to be explored to find the potential material to make radiation-shielding cloth materials for radiation workers. • Thus, it is concluded that the prepared luffa/epoxy composites with PbO fillers are of low cost and eco-friendly materials which can be used as roofing materials.
Footnotes
Acknowledgements
The authors would like to acknowledge the Central workshop of the Mechanical Engineering Department, Anna University (Chennai, India), and the research center of Easwari Engineering College (Chennai, India) for providing their facilities for completing the research work.
Declaration of conflicting interests
The author(s) declared no potential conflicts of interest with respect to the research, authorship, and/or publication of this article.
Funding
The author(s) received no financial support for the research, authorship, and/or publication of this article.