
Abstract
A droplet-impacted fabric surface deposition process was established based on the two-phase volume of fluid (VOF) computing model. This study was important because implementation of drop-on-demand 3D printing used for forming flexible conductive lines on fabric depends on understanding the droplet deposition mechanism. The interaction of droplets and the fabric substrate, as well as the penetration process, were simulated. The distribution of pressure and velocity, and the influence of surface tension and viscosity, in the droplet deposition process were also studied. The simulation and confirmatory experimental results show that the internal pressure gradient in the liquid was the main reason for the droplet spreading, penetration, and bubble formation. These research results lay a theoretical foundation for droplet spray printing of conductive lines on fabric surfaces.
Introduction
Intelligent textiles are a new generation of textiles that integrate sensing, communications, artificial intelligence, and new technology into traditional textiles. These can measure and sense temperature, heat, electromagnetic fields, humidity, radiation, force, motion, location, biological activity, and so forth. There are many applications for intelligent textiles, such as monitoring, information transmission, warning indicators in lightweight smart spacesuits, protective clothing for special environments, and casual wear. These features are applicable and have great market potential in the military, aerospace, bio-medicine, sports, leisure, entertainment, and health care industries.1,2
The technology of flexible conductive line manufacturing is the important foundation for integration of electronics with textiles. Sewing, embroidery, weaving, knitting, and screen printing are used for inserting conductive materials into fabrics, but these methods have several disadvantages, including a complex crafting process, poor flexibility, limited resolution of the forming line, and high cost.3–5
Drop-on-demand three-dimensional (3D) printing technology is a new additive manufacturing technology. 6 With the advantages of wide-ranging material selection, free-form fabrication, and not requiring expensive equipment, it has great potential for directly forming conductive lines. The droplet is the basic forming unit and its form after deposition on the fabric surface is critical to the geometric precision and quality of the conductive line. However, it is difficult to observe precise changes in droplet morphology and the influence of related factors by experiments directly. Fortunately, the transient characteristics of the droplet deposition process, including droplet morphology, its internal flow field, pressure field, and so forth, can be predicted using a numerical simulation method.
A great deal of research has been carried out regarding droplet impact on solid substrates. Li used the volume of fluid (VOF) method to study the successive deposition and solidification processes of uniform alloy droplets using drop-on-demand three-dimensional (3D) printing methods. 7 Gunjal established the model of a single droplet impact on a wall using the VOF method to analyze the influence of impact velocity, droplet diameter, viscosity, droplet diffusion radius, and splash height.8,9 In a study of droplet deposition on a fabric surface, Verleye regarded the yarn in the fabric as an impermeable entity and established the micro geometry model. The flow of resin in the unit cell of the fabric was simulated with the finite difference method. 10 Takano predicted the permeability of the fabric and investigated the effect of shear on permeability with the uniform method, but neglected the liquid flow in the yarn. 11 The flow of resin in the fabric unit cell was simulated using a fabric simplified model and investigated the effect of geometric parameters on the permeability. 12 Prior research mainly focused on the impact of the droplet on a solid substrate and the prediction of fabric permeability. However, studies on the morphological changes in a droplet on the surface and inside the fabric were not sufficiently addressed.
In this research, a VOF model of droplet deposition on a fabric surface was demonstrated. Droplet collision with the fabric substrate and the penetration process were simulated. The influence of surface tension and viscosity of the liquid on the deposition process were also investigated, laying a theoretical foundation for the formation of high-quality conductive lines on the fabric surface.
Mathematical Model and Numerical Simulation
In this study the theoretical model of droplet deposition on a fabric surface is established first. Then, the physical model, boundary condition, material properties, and other factors based on the experimental parameters and related theories are set. The 2D flow through the intertow channel is modeled using the commercial Flotran CFD (Ansys Inc.) code with the Fluid 142 2D fluid element, and the numerical calculation process and the post-processing of the result are performed.
Fabric Geometry Modeling
Due to the complexity of fabric structures, their geometrical structure varies depending on various forms (woven or knitted) and stress states. The present study uses long fiber woven plain polyester fabric (Chromarat 150TB) as the research object and quotes the original data from the reference. 13
The fabric model is shown in Figs, 1a–c, representing the fabric geometry model, simplified fabric model, and SEM image of the fabric cross section, respectively. The fabric model established in the authors research considered yarn permeability. The fabric geometric model is made more consistent with the real fabric by comparing with the SEM image of the actual fabric.
Theoretical Modeling
The droplet deposition process involves two states of matter: gas and liquid. The numerical simulation used adopts the VOF method. The mass and momentum conservation equations of each phase are given in Eqs. 1 and 2.

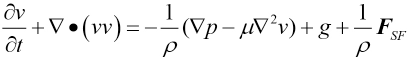
∇ represents divergence, v, t, ρ, μ, and FSF are speed vector, time, pressure, viscosity, and surface force, respectively.
Mixed phase density is calculated using Eq. 3.
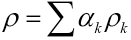
αk is the volume fraction of k phase fluid. Other physical properties of the mixed phase are calculated using Eq. 4.
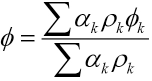
For the computational grid α k = 0, the grid is free of k phase fluid; for α k = 1, the grid is filled with k phase fluid; for 0 < αk < 1, the grid contains k phase fluid and other phase fluids.
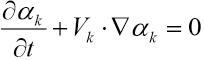
The two-phase interface is traced by solving the continuity equation of the volume fraction using Eqs. 5 and 6.

Surface tension and wall adhesion should be taken into account when tracking the free surface change of the droplet. Brackbill et al. 14 proposed the use of the continuous surface tension FSF, and it is added to the momentum equations in the form of source term as shown in Eqs. 7–9.
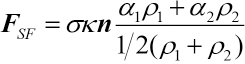

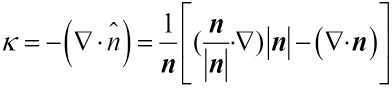
Where FSF, κ, n, α, and
When the droplet is in contact with the fabric surface, adsorption by the fabric is added to the surface normal (Eq. 10).
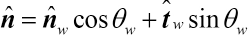
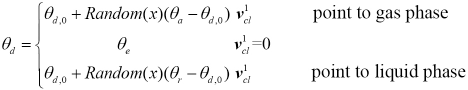
During the coupled solution process of interaction between the gas liquid two-phase flow and the fabric, the governing equations of the wetting model can be expressed as Eqs. 11 and 12.
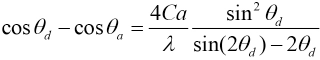
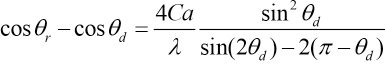
θ d , θa, and θr are dynamic contact angle, advancing contact angle, and retracted contact angle, respectively. θa and θr reflect the contact angle hysteresis caused by the interaction between liquid and fabric. Ca = μU/σ represents the influence of liquid velocity on the change of contact angle in the wetting process. U is the contact line speed, and λ is the characteristic parameter of the dimension contact line, which reflects the influence of fabric properties on the wetting process.
To simplify the calculation, the droplet is regarded as an incompressible viscous Newton fluid. The deposition process is a constant temperature flow process. The liquid flow in the yarn is expressed as an incompressible Navier-Stokes equation (Eq. 14).
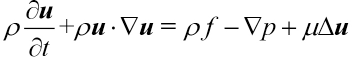
f and ρ are the unit mass force of liquid and fluid density respectively.
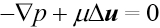
Due to the slow flow velocity of the liquid in the fabric, the nonlinear convection term is neglected, only the steady-state solution is concerned, and the time term is eliminated. The flow of droplets in the yarn can be expressed by the Stokes equation (Eq. 15).
For the internal flow in the yarn, the yarn is regarded as a porous medium. The flow is described by the Brinkman equation:
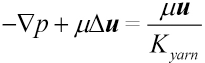
Kyarn is the permeability tensor of yarn.
Finite Element Modeling
Fig. 1 shows the schematic diagram of the droplet ejection device. When the numerical simulation is carried out, the simulation area is comprised of a droplet that is ejected from the nozzle to reach the steady state, the whole fabric substrate, and the gas environment between the fabric and the droplet (dashed box in Fig. 1).
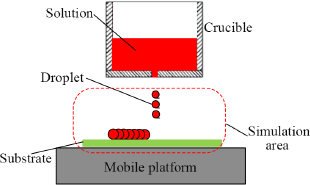
Schematic diagram of the droplet ejection system.
The fluid is always distributed along the axial direction during the deposition process, so the flow, pressure, and velocity fields can be determined according to the two-dimensional axial symmetry problem. Considering the accuracy and efficiency of the calculation, the droplet and ambient gas are divided into quadrilateral structure grids, and the interior of the fabric is divided into a triangular unstructured grid. There are 17,146 grid elements in the simulation area. The grid of numerical simulation is shown in Fig. 2.
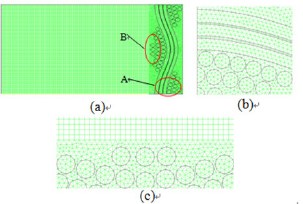
Numerical simulation of regional grid chart. (a) Graph of the simulated area grid (b) first local amplification, and (c) second local amplification.
In this study, the numerical simulation calculation area is a 738 x 600 μm two-dimensional region. The calculation region and boundary condition are shown in Fig. 3.
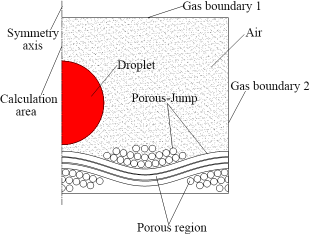
Calculation area and boundary conditions.
The model of droplet deposition on fabric surface involves solid, liquid, and gas phases. Assuming that there is an incompressible laminar flow between the liquid and the gas, the gas phase is defined as the primary phase and the liquid phase is the second phase. A droplet with the radius of 300 μm is defined in the two-dimensional region. It is in point contact with the fabric surface. The fabric is impacted at a certain initial velocity.
Definite Solution Condition
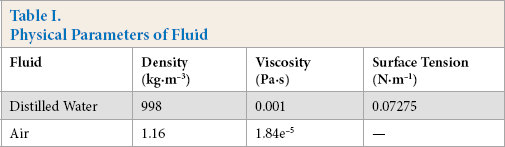
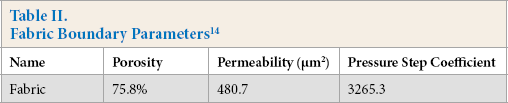
Fluid physical parameters are shown in Table I. The fiber is considered as a porous medium in the simulation. Its boundary parameters are set as shown in Table II.
Physical Parameters of Fluid
Fabric Boundary Parameters 14
To accelerate the convergence speed of a single iteration step and satisfy both momentum and continuity equations, the PISO algorithm is selected. Considering the complex turbulence inside porous media, the PRESTO! method is used. The QUICK scheme, which is suitable for quadrilateral/triangle mixed mesh generation and more accurate than the second-order windward scheme, is adopted for discretization. 15
Results and Discussion
Distilled water droplet deposition on the fabric surface mainly involves droplet impact onto the fabric and droplet penetration into the fabric.16,17
Analysis of Droplet Morphology in Impact Process
The diameter of the droplet is 300 μm, the flying speed is 1 m/s over ∼5–7 mm, and the static contact angle between the droplet and the fabric surface is 60°. 18 The morphology change process of the droplet as it impacts the fabric surface is shown in Fig. 4, where the picture above is the experimental picture and the picture below is the simulation result. The droplet remains spherical in the falling stage. Subsequently, the droplet wets the surface of the fabric and quickly spreads across the surface of the fabric to the sides. Then, some bubbles and spreading films (1.2 ms) are observed. Thereafer, the droplet spread rapidly (2.7 ms) on the fabric surface. The droplet reaches the maximum spreading diameter at 3.4 ms. Its edge height at this time is greater than the central part. An annular liquid layer (3.4 ms) is formed and a pit is visible at the center of the droplet. The annular liquid layer could not be observed since the experiment is done on the side of the droplet shooting. With the development of the droplet motion state, the inner portion of the liquid begins to retract to gather at the center of the collision. The depth of the pit is gradually reduced until it disappears. The droplet is moving upward and is conically distributed on the fabric surface. The droplet reaches its maximum retraction position for the first time until 5.8 ms. Thereafer, constant oscillation (11.1 to 46.3 ms) occurs until the energy consumption is exhausted. Finally, it reaches equilibrium at 46.3 ms.
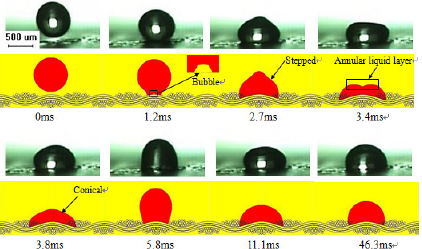
Droplet morphology change during collision process.
To analyze the cause of the bubble generation, Fig. 5 shows the simulated pressure distribution 0.1 μs before the droplet collides with the fabric surface.
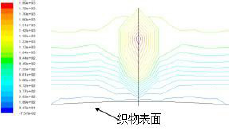
Pressure distribution 0.1 μs before the collision.
The maximum gas pressure between the droplet and the fabric surface is 1890 Pa at 0.1 μs before droplet impingement. At this point, this part of the gas is hampered by the effect of surface shearing and cannot move away quickly. As the droplet continues to approach, the compressed air makes the bottom of the droplet deform and fatten. It forms a layer of gas between the droplet and fabric surface. Thus, the droplet is not fully in direct contact with the fabric surface in the early stage of the collision and spreads over a gas layer.
Fig. 6 shows the gas layer width between the droplet and the fabric surface over time. The width of gas layer increases first and then decreases with time.
Change of gas layer width with time.
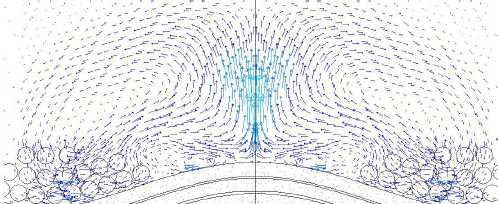
To further explain this phenomenon, Fig. 7 shows the velocity distribution of the droplet at 0.1 μs after droplet impingement onto the fabric surface at the three-phase interface (Fig. 7b).
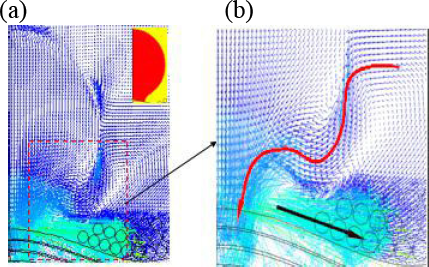
Droplet velocity vector after the collision 0.1 μs. (a) Droplet velocity vector and (b) local amplification.
The overall speed of the droplet is in the vertically downward direction after the droplet impacts the fabric surface. But the velocity distribution of the collision area near the center is different from the main body of the droplet (box in Fig. 7). At the interface of the gas-liquid two-phase on the edge of the droplet, the droplet is rapidly concentrated toward the center of the collision (red arrow in Fig. 7) due to the droplet movement down to drive the surrounding gas to produce a vortex, changing the flow direction of the droplet liquid edge. The pressure at the center of collision then increases dramatically. The gas between droplet and the fabric surface is discharged to both sides (the direction of the black arrow in Fig. 7). Part of the gas is discharged too late to be involved in the liquid forming the bubbles, and then the gas layer width increases. The width of the gas layer reduces under the effect of surface tension when it is at a maximum. Because of the unique structure of the fabric and the existence of the pores, the bubble gradually decreases in size until it disappears.
The droplet is stepped spreading (droplet spreading morphology is described as being ladder shaped) on the fabric surface at 2.7 ms in Fig. 4. This is because the droplet has a greater impact kinetic energy in the falling process. Shock waves are produced when the droplet contacts the fabric surface. 19 It is gradually transferred from the bottom of the droplet to the upper part to form the surface wave on the surface of the droplet. Therefore, the droplet is spread on the fabric surface in a stepped form.
To analyze the reasons of the formation of the annular liquid layer at 3.4 ms, the droplet velocity contour map at 3.4 ms is obtained as shown in Fig. 8.
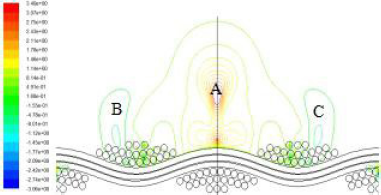
3.4 ms time micro droplet velocity contour map.
The spreading speed of the droplet spreading edge B and C is 0.155 m/s, and the spreading is slow. While the central portion A of the liquid remains at a high speed (3.4 m/s), it continues to spread to both sides along the fabric surface. The droplet edge surface tension is larger than at the center, and the spreading speed is smaller. The central portion of the liquid has greater speed due to inertial force, so as to form an intermediate high-low-high edge of the annular liquid layer.
To analyze the reason for the conical distribution of droplet on the fabric surface at 3.8 ms, Fig. 9 shows the droplet velocity vector at 3.8 ms. The liquid at the center is rising continuously and its rising velocity (1.21 m/s) is greater than the velocity of the liquid at the edge (0.455 m/s). Thus, it forms a conical shape.
3.8 ms time droplet velocity vector.
Analysis of Droplet Morphology in the Permeation Process
When the droplet collides in contact with the fabric surface and eventually reaches equilibrium by reverse complex oscillation, the droplet begins to penetrate into the fabric. Fig. 10 shows the morphological changes of the droplet during the permeation process.
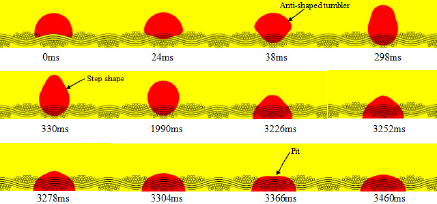
Droplet morphology change during permeation process.
The droplet penetrates into the fabric in the vertical direction. There are varying sizes and shapes of pores in the fabric. At the beginning, the pores are smooth and the liquid penetrates rapidly (24 ms). Then the pores are completely filled with liquid. The droplet is “anti-tumbler-shaped” at 38 ms.
Fig. 11 shows the droplet velocity contour map at 38 ms. The region D at the bottom of the droplet has a larger velocity (1.45∼1.93 m/s) than the upper E region (0∼0.386 m/s). This is because the bottom of the droplet has a greater velocity under the capillary force and quickly penetrates into the fabric. While the upper portion of the droplet is not in contact with the fabric, and without the capillary force, the speed is relatively low. Thereby, it forms a “counter-tumbler shape.” The droplet is a step shape distribution having a thin top and a thick bottom at 298∼330 ms. The droplet velocity vector at 330 ms (starting at t = 0 as shown in Fig. 11) is shown in Fig. 12.
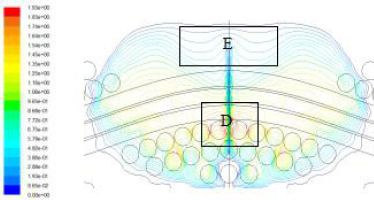
38 ms time droplet velocity contour map.
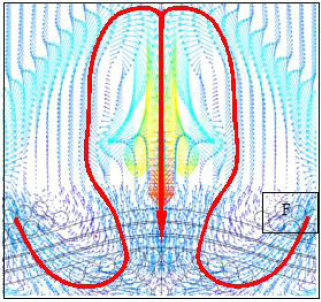
330 ms time droplet velocity vector.
Because the presence of the pores between the fibers and the internal fibers after the droplet penetrates into the F region, the direction of the droplet changes and moves in the direction shown by the red line in Fig. 12. The liquid on both sides of the droplet is moving upward and the center of the liquid moves downward to form a step shape which is upper tip and down course. The speed of the upper part of the droplet upward movement gradually decrease to 0 under the effect of the surface tension, and then the droplet begins to move downward (1990 ms). After that, the droplet is moving down and penetrates to both sides (3226∼3304 ms). The droplet height is the smallest at 3366 ms, and there is the same pit as the collision course. Then the droplet appears to shrink back slightly and finally reaches the equilibrium state at 3460 ms.
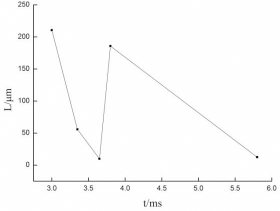
An image acquisition system is used to collect the droplet penetration process data in the fabric, and the height of droplet in the penetration process is measured as shown in Figs. 13a and b, showing experimental pictures of the penetration process and the droplet dimensionless height H(t)/ D0 changes with the dimensionless time t /T, respectively.
As can be seen from Fig. 13a, the experimental images can only observe the morphology changes of the droplet on the fabric surface. But they cannot observe the penetration process inside the fabric. Due to the limitations of the shooting rate, it cannot capture the precise shape of the droplet motion stage and the critical moment in all stages of deformation. As can be seen from Fig. 10, the precise shape changes of the droplet at any time can be obtained from the simulation results. The trend of simulation and experiment results in the penetration process is basically consistent (Fig. 13b).
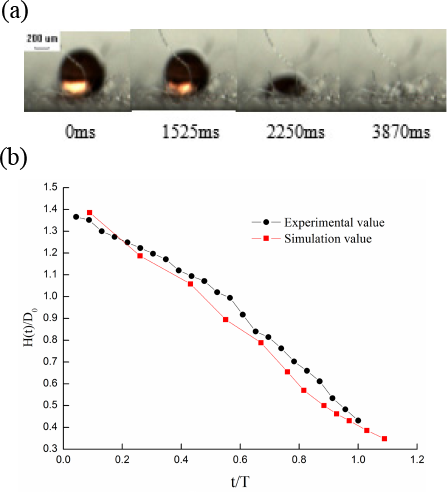
Comparison of simulation results and experimental results in the penetration process. (a) Experimental penetration process and (b) the droplet dimensionless height H(t)/D0 changes with the dimensionless time t/T simulation.
Pressure Field Analysis
The simulated internal pressure distribution of the droplet on the fabric surface in the deposition process is shown in Fig. 14 to further clarify the nature of the droplet shape change and reveal the main reason for droplet spreading and penetration.
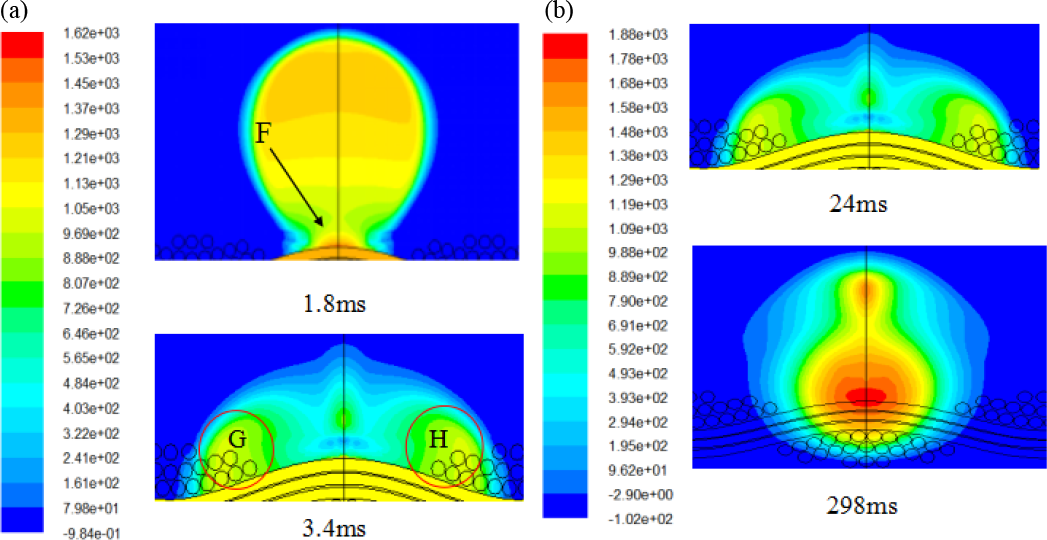
Pressure distribution at different times in the deposition process. (a) In the collision process and (b) in the penetration process.
In Fig. 14a, the collision center F area, where the droplet contacts with the fabric surface, produces great pressure (1360 Pa), due to the intense droplet impact at 1.3 ms. While the pressure on the edge of the droplet is small (63.3 Pa), a large pressure gradient is formed. The main part of the droplet spreads along the fabric surface under the effect of the pressure gradient. As time goes by, the pressure difference between the center of the collision and the edge of the droplet gets smaller and smaller. After the edge of droplet penetrating into the fibers at 3.4 ms, the effect of capillary force is produced with the role of the yarn pores, so that the pressure of the G and H regions gradually decreases to 1050 Pa. The pressure at the center of the droplet is reduced to 241 Pa, and the droplet begins to shrink under the effect of the reverse pressure gradient.
In Fig. 14b, the pressure gradient is more obvious during the penetration process. Because of the presence of the fabric internal pores in the initial stage of penetration, an additional pressure on the curved surface of the capillary is generated. It leads to the formation of a capillary pressure gradient. The liquid flows spontaneously in the capillary pores and penetrates into the fabric interior under the action of the pressure gradient (1685 Pa). When the liquid penetration reaches a certain point, the pressure gradient within the droplet changes. A reverse pressure gradient is formed on the upper part of the droplet, causing the upper liquid to move upward. The liquid in the lower part continues to penetrate inside the fabric with the capillary pressure differential, and the droplet is in step shape.
The analysis of the internal pressure field around the droplet shows that the pressure gradient inside the droplet is the main reason for droplet spreading and penetration.
Effect of Fluid Parameters
Droplet deposition on the fabric surface is affected by many factors, including droplet diameter, deposition rate, and fluid parameters. Fluid parameters are the essential attribute of a fluid and play a very important role in the deposition process. In this section, the effects of surface tension and viscosity on the deposition process are studied.
Influence of Liquid Surface Tension
The droplet diameter is 300 μm, the simulated surface tensions are 0.028, 0.042, and 0.073 N/m, and the droplet impacts the fabric surface at a speed of 1 m/s. The dimensionless spreading diameter D(t)/D0 in the collision process and the dimensionless height H(t)/D0 in the penetration process change with time t are obtained by simulation as shown in Fig. 15.
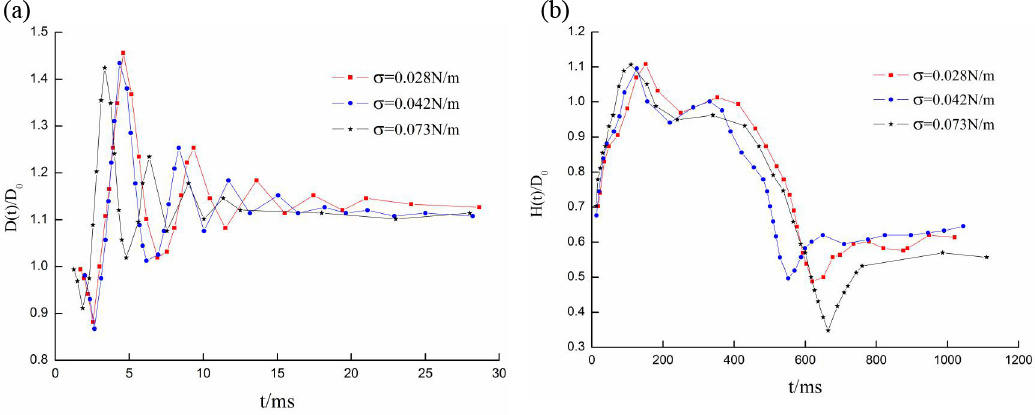
The (a) droplet dimensionless spreading diameter and the (b) dimensionless height vary with time under various surface tensions.
The smaller the surface tension, the larger the oscillation amplitude of the droplet and the oscillation frequency, whether in the collision or the penetration process. The smaller the surface tension, the longer the time of achieving the maximum spreading diameter and maximum penetration height. The greater the surface tension, the shorter the first time to achieve the minimum penetration height in the penetration process. The droplet oscillation damping difference is obvious under varying surface tension. The spreading diameter of the droplet, which has a large surface tension, is smaller in the equilibrium phase. It shows that the surface tension has an inhibitory effect on droplet spreading.
Effect of Liquid Viscosity
The droplet diameter is 300 μm, and the simulated viscosity of the liquid are 1.0 × 10⁻⁶, 5.8 × 10⁻⁶, and 12.0 × 10⁻⁶m2/s. The droplet impacts the fabric surface at a speed of 1 m/s. The dimensionless spreading diameter D(t)/D0 in the collision process and the dimensionless height H(t)/D0 in the penetration process change with time t are obtained by simulation as shown in Fig. 16.
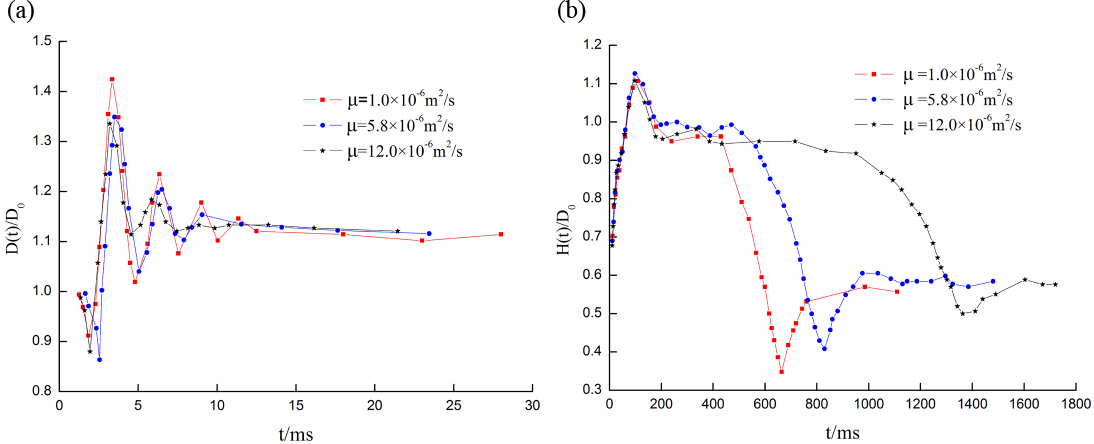
The (a) droplet dimensionless spreading diameter and the (b) dimensionless height vary with time under various viscosities.
The smaller the viscosity during the collision process, the larger the oscillation amplitude of the droplet and the oscillation frequency (Fig. 16a). The spreading of the droplet is mainly affected by the inertial force in the early stages of the collision process, and it is less affected by the viscosity. The role of viscous force gradually increases with the development of spreading. The lower the viscosity, the greater the maximum spreading diameter of the droplet. Subsequently, as the droplet continues to oscillate through more movement and deformation, the viscous force is gradually dissipated. The spreading diameter of the droplet in the final equilibrium state is less affected by viscosity.
The permeation process of the droplet is basically unaffected by the viscosity in the early stage of permeation (Fig. 16b). It is mainly affected by the capillary force and quickly penetrates into the fabric. Thereafer, the viscosity has great influence on the permeation process. The larger the viscosity, the more time is required for the penetration process, and the less liquid permeates in the final fabric penetration.
Conclusion
In this study, a method of theoretical analysis combined with numerical simulation was used to study the droplet collision and penetration process. A 2D model of droplet impingement on the fabric substrate was developed based on a VOF method. The numerical results were compared to experimental results showing a qualitative agreement, leading to the following conclusions.
The reason for bubble formation is that the gas pressure near the fabric surface rises when the droplet impacts the fabric, which leads to different distribution characteristics of liquid and gas near the contact zone. Analysis of the pressure field shows that the pressure gradient is the essential reason for droplet spreading, penetration, and morphological changes on the fabric surface. Droplet oscillation amplitude and frequency are enhanced by the reduced surface tension and viscosity of the liquid. The lower the surface tension, the longer time it takes to reach the maximum spreading diameter and maximum penetration height. The time it takes for the droplet to reach the maximum spreading diameter has little relationship with the viscosity. The time of the permeation process becomes longer as the viscosity increases.
Footnotes
Acknowledgement
The authors gratefully acknowledge the support of this research by the National Natural Science Foundation of China (No. 51475350) and the Graduate Innovation Foundation of Xi'an Polytechnic University (No. chx201857).