
Abstract
A macro sampling chamber equipped with mid-infrared (IR) focal plane array (FPA) detector was used to examine chemical treatments of cotton fabrics. Conventional IR methods typically examine individual points in a sample, while the FPA detector provides spatially resolved spectra that can corroborate chemical treatment and its distribution on the cotton fabric. Characterizations of three distinct treatments are presented: non-durable treatments of N, N-diethyl-3-methylbenzamide (DEET), an active ingredient in commercially available insect repellents, a phosphazine-based fire retardant, and fabric treated with deuterated water. All chemical treatments examined in this study exhibited distinct vibrational bands that could be used as markers of the fabric treatments. Our results suggest that the mid-IR FPA detector can be used to characterize fabric treatment uniformity and provide qualitative confirmation of fabric chemical treatment.
Introduction
Cotton remains an important fiber in the textile market. 1 Clothing, home furnishings, and industrial products are among the many areas where the fiber is extensively used. Cotton compares favorably to other textiles for its softness, breathability, and versatility. Still, the fiber presents some disadvantages; cotton, for example, shows more wrinkling and is more combustible than synthetic fibers.1,2 Chemical finishing of cotton products can provide better control over these limitations and impart improved or new properties to its products. 2
Numerous chemical finishing treatments have been developed for cotton products. Chemical finishes can be classified as either durable (e.g., stain repellents and water repellants,3,4 wrinkle resistant,5,6 or anti-microbial7,8), or non-durable (e.g., many flame retardants9,10 and fabric softeners 11 ) depending on their ability to withstand conventional laundering. For these finishing treatments to be effective, even application of the finishing agent is necessary. 2 Physical characterization of the treated product tends to highlight the improved capacity of the fabric (e.g. flame tests in the case of frame retardants, 12 and water repellency). A few methods also directly examine the presence of the finish on the fabric, mainly, spectroscopic techniques, such as vibrational spectroscopy, 13 nuclear magnetic resonance (NMR) spectroscopy, 14 inductively coupled plasma (ICP), 15 and gas chromatography-mass spectrometry (GCMS), 16 but not its distribution.
Fourier transform infrared (FTIR) spectroscopy is often used to examine cotton fabrics following chemical treatments.7,17–20 Spectral bands associated with the treatment chemicals are used to corroborate incorporation into the fabric. Characterization with FTIR spectroscopy has benefited from the wide adoption of attenuated total reflection (ATR) accessories, a simple sampling technique that allows the treated fabrics to be examined in a manner of minutes and with little sample preparation. Still, conventional FTIR studies typically examine only a few points in the modified sample; hence, no information on treatment distribution or uniformity is typically provided.
Recent studies have explored the use of a mid-IR focal plane array (FPA) detector in the FTIR examination of cotton samples.21,22 Array-type detectors are capable of examining multiple points in a sample simultaneously. 23 This type of examination allows for the easy creation of infrared chemical images, spatially-resolved visual images that provide a sense of the composition and distribution of a sample. The detector has been used to examine cell wall development in individual fibers, 21 to identify contaminants in cotton samples, 24 and to examine sample distribution in cotton fiber bundles. 22
Herein, we further explore the use of an FPA mid-IR detector to examine the distribution of chemical finishings or treatments on cotton fabrics. This study uses an infrared sampling chamber equipped with a FPA detector and a single reflectance ATR unit to examine the uniformity of various chemical treatments on cotton fabrics. This study is not meant to be an exhaustive survey, but a preliminary study to establish the feasibility of this concept. To this end, cotton fabrics were treated with three chemicals, a phosphazine-based fire retardant, an insect repellent, and deuterated water, and the distribution of each treatment examined with the FPA detector.
Experimental
DEET Non-Durable Finish
Two methods were used to treat cotton fabrics with N,N-diethyl-3-methylbenzamide (DEET, Aldrich). In the first method, 5 mL of a DEET solution in ethanol was placed dropwise on the cotton test fabric. The DEET solution concentration was of 20% (v/v). Excess solution was removed using a horizontal, vertical padder type HVF (Werner Mathis AG) with an applied pressure of 50 psi and a rate of 5 m/ min. The remaining ethanol was evaporated by allowing the samples to dry in the hood for 1 h. For the second method, cotton fabrics were immersed in a solution of DEET (5 mL, 20% v/v) in ethanol. The excess solution was then removed using a padder, and the fabrics were again immersed in the DEET solution. Excess solution was removed using a padder. This application process was repeated three times and the samples were then air-dried as described above. Samples from both finishing methods were placed in 20-mL sealed vials and stored at room temperature (RT) until FTIR testing was performed. Following the initial study, test fabrics were again placed in vials and stored uncapped in an incubator at a temperature of 26.6 °C and a relative humidity (RH) of 52% for the specified time periods (4 weeks). Once this time point was reached, the samples were subjected to additional IR testing.
Treatment with Phosphazene-Based Fire Retardant
Synthesis of 1,1′,4,5-tetrahydrotrispiro[1,3,2-diazaphospho-le-2,2′-[1,3,5,2,4,6]triazatriphosphinine-4′,6′′-dibenzo[d, f] [1,3,2]dioxaphosphepine-6′,6′′′-dibenzo[d, f][1,3,2]dioxa-phosphepine] (PZN1) was previously described. 25 PZN1 was incorporated into the cotton test fabrics using a standard pad-dry-cure method and a supercritical carbon dioxide method. Briefly, for the pad-dry-cure method, a cotton fabric was immersed in a pan containing a solution of PZN1 (the solution concentration was changed to reach the desired percent add on) in 1:1 dichloromethane (DCM)/acetone. After 5 min, the fabric was removed from the pan and excess solution padded with a roll. The treated fabric was dried at 100 °C for 5 min, and cured at 160 °C for 90 s in a Mathis Labdryer LTE. Treatment with the supercritical CO2 method (scCO2) was similar; fabrics were placed in a beaker containing a solution (5%) of PZN1 in 1:1 DCM/acetone for one hour. The excess solution was removed, and then the fabric was placed into a scCO2 reactor (HPR-Series Reactor, Supercritical Fluid Technologies Inc.) The remainder of the solution was transferred into the reactor and scCO2 was added into the chamber until the desired pressure was attained (1500 psi at 90 °C for a 9% add-on). After removal from the chamber, the fabric was cured at 140 °C for 3 min. Percent add-on was calculated for each fabric using Eq. 1.

Wafter is the weight of the fabric after treatment and Wuntreated is the weight of the original fabric before treatment.
Treatment with Deuterated Water
Deuterated water (Acros Organics) was added dropwise to a small section of cotton fabric and allowed to air dry. Excess water was removed with a gentle stream of nitrogen gas, and the sample examined in the FTIR sampling chamber immediately after treatment.
FTIR Examination
Fabric and cotton bundle samples were examined with an IMAC macro sampling chamber (Bruker Optics) equipped with an FPA detector and a FastIR ATR unit (Harrick Scientific Products). The sampling chamber is connected to a Vertex 70 (Bruker Optics) that supplies the mid-IR light source. The Vertex 70, the sampling chamber, and the ATR accessory were used without further alterations. Samples were placed on top of the ATR crystal (25-mm in diameter), and secured using a metal plate and clamp. Care was taken to ensure samples were secured using comparable pressure. All FTIR data were collected in ATR mode. Samples were examined with 80 scans at a resolution of 8 cm–1 (3800–900 cm−1). Adjacent pixels in the FPA were grouped into areas incorporating 16 × 16 pixels. Spectra were plotted with an IGOR Pro (version 6.2, Wave-metrics). Cotton band assignments were taken from previous studies. All spectra were corrected against an air background. Additional processing was limited to atmospheric (CO2 and water) and baseline corrections, both performed with OPUS 3D spectroscopy software (version 6.5, Bruker Optics).
Environmental Scanning Electron Microscopic (ESEM) Images
ESEM analysis was performed with a Philips XL 30 ESEM, with a 4.4 spot size, an acceleration voltage of 12 k V, 500× magnification, and a working distance of ∼6.5 m.
Results and Discussion
DEET Non-Durable Non-Durable Treatment
Fig. 1 shows the FTIR spectrum of a cotton fabric treated with a 20% solution of DEET. Its structure contains an IR active amide bond and a phenyl ring that produce a series of notable IR stretches (Fig. 2). While not a common chemical treatment for fabrics, there are ongoing studies exploring DEET's potential use as a non-durable cotton finish designed to evaporate with time. Evident in the treated cotton fabric (Fig. 1) were the typical bands associated with cotton; a broad OH band (3600–3000 cm–1), a CH region (3000–2700 cm–1), and a series of combination bands in the fingerprint region that are typically described as O-H and C-H bending modes (1500 and 1150 cm–1).22,24 In addition to the cotton bands, peaks associated with DEET were noticeable, including an intense C=O stretch near 1627 cm–1 and various C-H (2965–2900 cm–1) peaks. The intensity of the C=O peak, in an area with a relative low intensity cotton moisture peak, suggested it can be used to monitor DEET treatment in cotton fabrics. 21
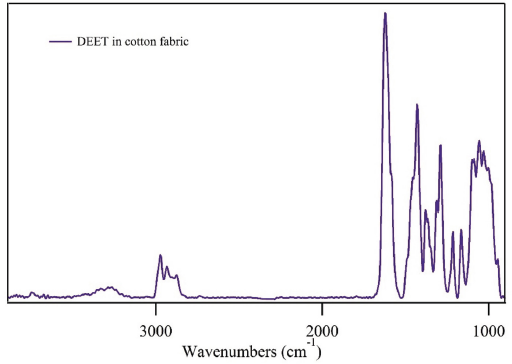
FTIR spectrum of a cotton fabric treated with a 20% solution of DEET.
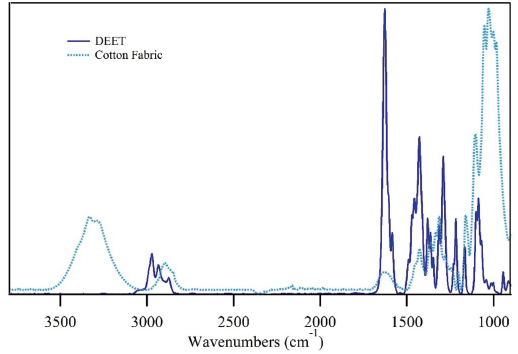
FTIR spectra of DEET (dark blue trace) and a cotton fabric (light blue trace).
Fig. 3a shows a chemical image of a cotton fabric treated with a 20% DEET solution. The chemical image is a visual representation of spectra collected in a 15 × 15 mm area of the fabric sample. Sixty-four distinct spectra made up the chemical image, and each point was integrated to the intensity of the C=O band. Since small differences in peak intensity could arise from sensitivity in the detector array and its pixels, the intensity of each point in the image was normalized to the dominant cotton band observed near 1060 cm–1.
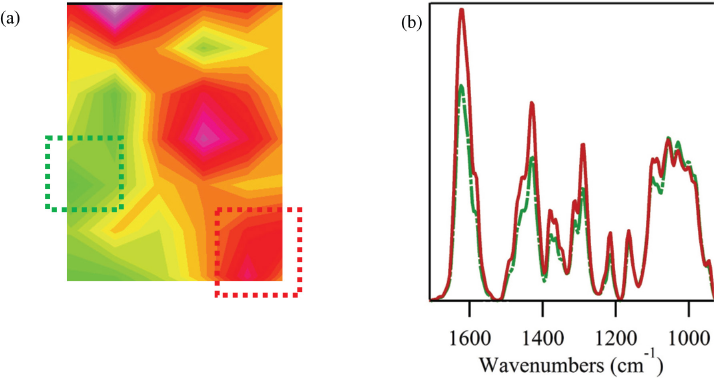
FTIR examination of a cotton fabric treated with a 20% solution of DEET using drop-wise deposition. (a) Chemical image of treated cotton fabric and (b) extracted infrared spectra for the points indicated in the chemical image with the green and red squares. For the chemical images, all sample points were normalized to the C-O band associated with cotton and centered around 1060 cm–1. Colors in the chemical image indicate level of integration for the DEET band centered around 1627 cm–1, with red tones indicating high integrations and green/blue colors indicating low integrations.
The chemical image displayed significant variability in the integrations of the DEET treatment. While all points showed some level of the chemical, the relative intensity of the DEET treatment was highly variable. Fig. 3b showed two of the spectra composing the chemical map. One point was taken from an area with high DEET intensity (red) and one with low intensity (yellow). The results suggest that the treatment with DEET using drop-wise deposition was not effective in creating an even finish. For a second attempt at the DEET treatment, the samples were repeatedly immersed in the DEET solution followed by passing through a padder. This small change resulted in a more even distribution of the DEET over the cotton fabric (Fig. 4a). Spectra of various points in the chemical image confirmed an even distribution of the DEET treatment (Fig. 4b), and were almost indistinguishable.
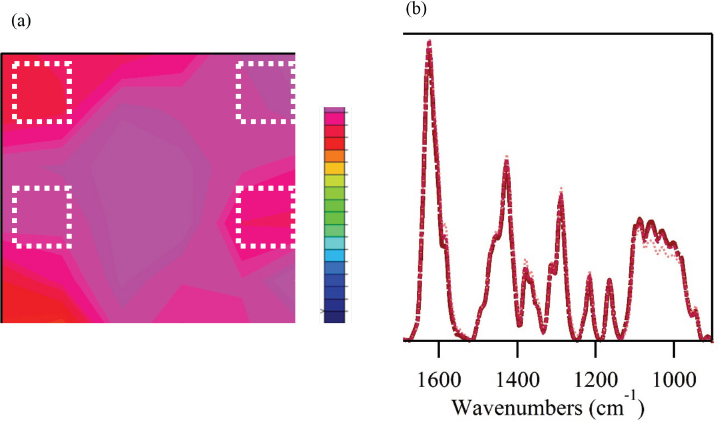
FTIR examination of a cotton fabric treated with a 20% solution of DEET using an immersion and padder application. (a) Chemical image of treated cotton fabric and (b) infrared spectra for the points indicated in the chemical image with white squares. Details of the chemical images are given in Fig. 3.
The infrared imaging technique was also used to explore the durability of the DEET treatment. Treatment of a fabric with DEET requires slow evaporation of the chemical for it to serve as an effective insect repellent. The cotton fabric examined in Fig. 4 (immersion and padder application) was stored in a sealed container for a month, and reexamined with the FPA imaging setup (Fig. 5a). The relative intensity of the DEET C=O band was comparable to the ones observed for a newly-prepared sample. The cotton fabric also maintained an even coating of the DEET treatment, as indicated by the even red tone of the chemical image. These results indicate that the DEET treatment was stable against significant evaporation when stored in a sealed container. The treated cotton fabric was then stored unsealed for a week before being reexamined (Fig. 5b). The concentration of the DEET treatment was reduced as evidenced by the decrease in the relative intensity of the DEET C=O band (Fig. 5c). Similarly, the uniformity of the DEET treatment was lost, with the chemical image of the fabric showing a multitude of color-based intensities (Fig. 5b). Notably, a large amount of the DEET treatment remained in the cotton fabric after a week of airing. A separate study will identify the release rate of the treatment. Taken together, these findings suggest that infrared imaging of cotton fabrics can be used to monitor DEET fabrics treatments and their uniformity.
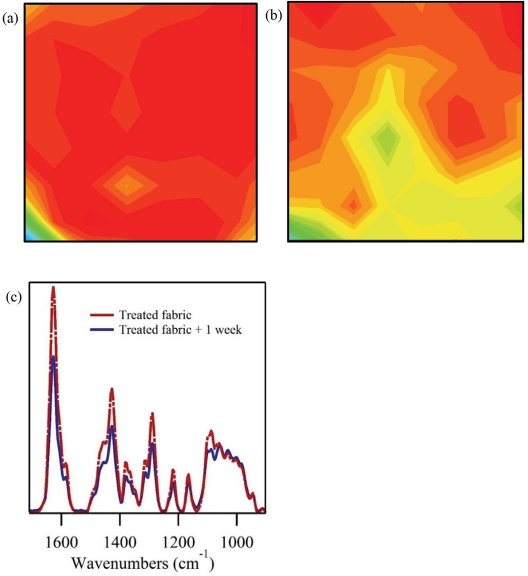
FTIR examination of a cotton fabric treated with a 20% solution of DEET using an immersion and padder application after storage. (a) Chemical image of treated cotton fabric following storage in a sealed vial for four weeks, (b) in a unsealed vial at room conditions for one week, and c) representative spectra of treated fabrics following indicated storage. Details of the chemical images are given in Fig. 3.
Phosphazene-Based Flame Retardant (FR)
Chemical imaging was used to examine a phosphazene-based, non-durable fame retardant (PZN1) treatment. The flame retardant and fabric treatment were previously described. 25 While FTIR and ESEM characterizations were reported, these studies did not provide a sense of the treatment uniformity. Two techniques for the finishing treatment were reported: a traditional pad-dry-cure method and a scCO2 treatment. Fig. 6 shows a series of chemical images for cotton fabrics treated with PZN1: a 6% add-on using a pad-dry-cure treatment (Fig. 6a) and using scCO2 (Fig. 6b), and a 9% add-on using a pad-dry-cure treatment (Fig. 6c) and using scCO2 (Fig. 6d).
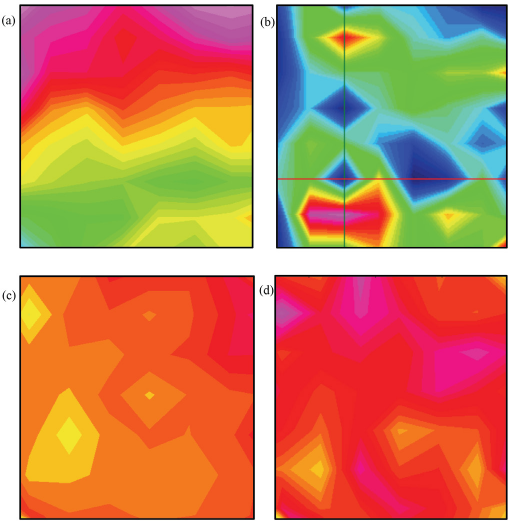
Chemical images of a cotton fabric treated with FR PZN1 at two add-on concentrations, 6 and 9%. (a) 6% add-on using pad-dry-cure, (b) 6% add-on using scCO2, (c) 9% add-on using pad-dry-cure, and (d) 9% add-on using scCO2. For the chemical images, spectra were normalized to the C-O band associated with cotton centered around 1060 cm–1. Colors in the chemical images indicate level of integration for the PZN1 band centered around 1226 cm–1, with red tones indicating high integrations and green/blue colors indicating low integrations.
The phosphazene derivative showed distinctive FTIR peaks near 1226 cm–1 and 1136 cm–1 (Fig. 7), an area with few vibrations associated with cotton (Fig. 2). As such, the chemical images were normalized to the dominant cotton C-O band, and integrated to the FR peak at 1226 cm–1. Both chemical images for the 6% add-on treatments showed a broad range of integrations. Independent of treatment method, the FR integrations varied from low (green tones) to high integrations, localized integrations (red tones). As the percent add-on increased to 9%, a more even distribution was observed. All areas showed moderately high integrations (orange tones) or higher (red and pink tones). Interestingly, the 9% scCO2 treatment showed a slightly narrower range of integrations than the equivalent pad-dry-cure sample. Flame tests on the fabrics showed that fabrics with a 6% add-on of the FR (scCO2) were not able to extinguish the flame test, while fabrics with 9% add-on showed a reduced fire hazard (Fig. 8). Typically, FR treatments require a FR load threshold for the fabric to resist burning. In the case of PZN1 this load threshold, reported to be 9%, 25 coincided with an even distribution on the cotton fabric. ESEM images of the pad-dry-cure fabrics, before and after FR treatment, pointed towards the limitation of that method for characterizing fabric chemical treatments. While the images showed some material aggregation on the surface of the treated fibers, absent chemical analysis, there was no confirmation that these aggregates were of the FR. There was, however, even char in the surface of the treated fabric following a flame test. Thus, FTIR imaging can be used to monitor the distribution of a phosphazene-based FR in a cotton fabric. Future experiments will explore if a more evenly-distributed FR treatment of PZN1 at lower add-on percentages might improve the fabric's flame resistance.
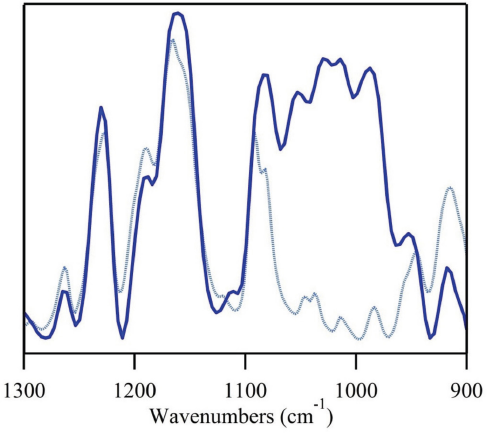
FTIR spectra of PZN1 (dark blue trace) and cotton fabric with 9% add-on of PZN1.
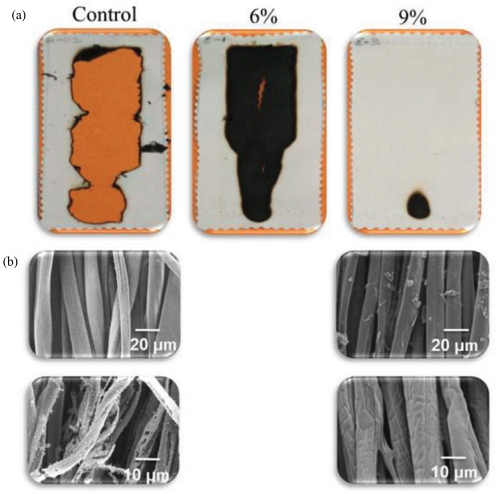
(a) Images of cotton fabrics following an open flame test, images shown correspond to fabrics with 6 and 9% add-on of PZN1, a control fabric is also shown, and (b) ESEM images of a cotton fabric treated with PZN1 before (top) and after (bottom) the open flame test (right column). A control fabric before (top) and after the flame test is also shown (left column). Image modified from reference 25.
Deuterated Water Treatment
Fig. 9 shows the chemical image of a cotton fabric treated with drops of deuterated water (D2O). Deuterated water can be used to examine the crystallinity of a sample, with current understanding suggesting that O-H bonds in the amorphous cellulose region exchange readily with the heavy water to form O-D bonds. Given enough time, all the hydroxyl groups in the amorphous region and in surface chains of the cellulose crystalline regions will exchange, leaving only the inner chains of the cellulose crystals in cotton unaffected. For this analysis, spectra were normalized to the dominant C-O peak in cotton, which remained mostly unaffected in intensity by deuteration. The chemical images were integrated to the new O-D band that was observed ∼2480 cm–1. While only a small drop of heavy water was added to the sample, the water quickly spread to the surrounding areas in the fabric. Extracted spectra from the chemical image showed fairly intense O-H bands even though a significant portion of O-H bands were exchanged (compared to the O-H band intensity in Fig. 1). This change in intensity was due to the increase propensity of the O-H groups to form hydrogen bonds in the presence of increased moisture. The higher the incidence of hydrogen bonds, the stronger the infrared signal of the O-H group involved. The distribution of the deuterated cellulose O-D band was not uniform throughout the sample as this result followed from single-drop deposition.
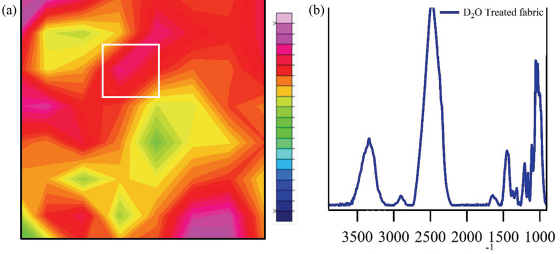
FTIR examination of a cotton fabric treated dropwise with deuterated water. (a) Chemical image of treated cotton fabric and (b) infrared spectra for the point indicated in the chemical image with a white square. For the chemical images, all sample points were normalized to the C-O band associated with cotton and centered around 1060 cm–1. Colors in the chemical image indicate level of integration for the deuterated O-D band centered around 2500 cm–1, with red tones indicating high integrations and green tones indicating low integrations.
Fig. 10 shows a time progression study of a cotton fabric treated with a small amount of D2O. The cotton sample was examined immediately following treatment with D2O. Integrations for the chemical images were as in the above study (Fig. 9). The initial chemical image showed a localized intensity in the right edge of the image (Fig. 10a). A chemical image taken 3 min after the initial study showed a reduction in the pink integrations (highest intensity), and a growing red integration. This change provided an indication of moisture movement in cotton, which was often reported to be quick and in rapid exchange with the atmosphere. The following chemical images (Figs. 10c–e) provided insight on the change in distribution of the deuterated bands as the sample was allowed to equilibrate with atmospheric moisture, with the area with deuterated water bands slightly expanding, but the integrations decreasing (tones change from mostly red to yellow, and finally green tones).
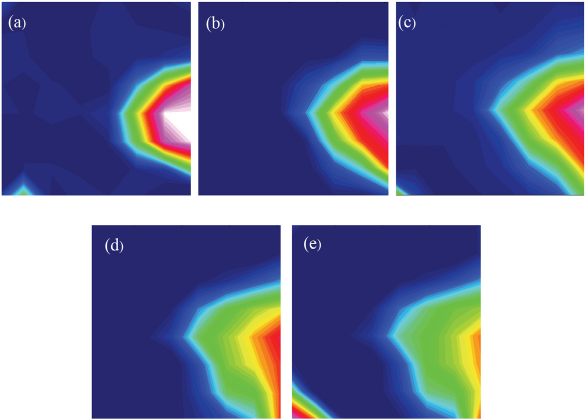
Time progression study of a cotton fabric treated with a small amount of deuterated water. (a) Chemical image of cotton fabric immediately following treatment, (b) chemical image of cotton fabric 3 min after initial study, (c) chemical image of cotton fabric 5 min after initial study, (d) chemical image of cotton fabric 45 min after initial study, and (e) chemical image of cotton fabric 60 min after initial study. Details of the chemical images are given in Fig. 9. Blue tones are associated with areas having non-deuterated hydroxyl bands.
Conclusions
This study described the use of a mid-IR FPA detector for the examination of chemically-treated cotton fabrics. Tree examples were highlighted; all non-durable fabric surface treatments. The study was undertaken as a proof of concept to examine the potential use of a mid-IR FPA detector to examine the composition and evenness of a cotton chemical finish. Chemical images of the treated fabrics can be produced in a matter of minutes, and allow for easy determinations of the sample composition and distribution. The system has its limitations; determinations on sample distributions are not quantitative, but based on band integrations that assume constant intensity from the bands. Additionally, the method requires marker bands in the chemical treatment that present themselves in areas where cotton bands are of minor intensity. If bands overlap significantly, more cumbersome analysis would be required. These examinations of sample distribution have not been confirmed with a second analytical method. As noted in the introduction, commonly-used methods in the characterization of treated fabrics (e.g., NMR, ICP, and GC-MS) mostly provide treatment confirmation, but little information on distribution. The mid-IR FPA method can be used to give qualitative information on the distribution of cotton chemical treatments.