
Abstract
Malachite green (MG) is a widely-used textile dye. It fades in the presence of the cationic surfactant cetyltrimethylammonium bromide (CTAB) in aqueous solutions and in oil/water/surfactant microemulsions. The surfactant was treated as a reactant in this study, as there were direct interactions between MG and CTAB in these solutions. By measuring the absorbance of different MG aqueous solutions and microemulsions at the maximum absorbance wavelength, and using the appropriate association models to analyze the experimental data, a good linear relationship was observed between MG and CTAB. Association constants were obtained and the value of the thermodynamics function of association ΔrGm was calculated. It was concluded from these results that microemulsion formation had an inhibitory effect on the association reaction.
Introduction
Malachite green (MG) is a triphenylmethane compound that is used as a textile dye for nylon, wool, silk, leather, and cotton dyeing. 1 It can produce a large amount of wastewater effluent in the dyeing process. Because MG is highly toxic, 2 contains residues,3,4 and has teratogenic, carcinogenic, and mutagenic effects on the human body,5–7 many countries ban its use. MG has been put on “The List Of Veterinary Drugs And Their Compounds Banned for Use for Food Animals” (Agriculture Department Announcement No. 193, May 2002, China). 8 Because of its low price, some individual units in China still use it. Therefore, further study is needed to develop new rapid detection methods and low-cost materials for water treatment.
Surfactants are widely used as penetrating agents, emulsifiers, and wetting, dispersing, and levelling agents in the printing and dyeing industry. The interaction between surfactant and dye in solution occur between individual molecules (or ions), or between dye molecules (or ions) and surfactant micelles (or reverse micelles), vesicles (or polymer vesicles), bilayer lipid membranes, or multilayer casting membranes.9–11 In most cases, the dye and surfactant molecules associate, resulting in solubility, change in absorption spectra, and dyeing properties.12–15 This association is influenced by electrostatic forces, hydrogen bonding, van der Waals force, and entropy change. The strength, position, and mechanism of interaction between the surfactant and the dye molecules is very complex. Therefore, research into the interaction between dye and surfactants is of great significance to the development of new dyes and auxiliaries.
A surfactant such as cetyltrimethylammonium bromide (CTAB) can help form microemulsions in aqueous solution. A microemulsion is a system of water, oil, and an amphiphile to give a single, optically isotropic, and thermodynamicallystable liquid solution. 16 Different ratios of liquid, surfactant, and external parameters, such as temperature or pressure, can spontaneously form different microstructures, such as water-in-oil, oil-in-water and bi-continuous structures. 17 Microemulsions (also known as swollen micelles) have good solubility and can change properties by composition adjustments. They have potential applications as drug carriers, 18 nano materials, 16 for tertiary oil recovery, 19 and as chemical reaction media. 20 Inverse microemulsions, also known as water-in-oil (W/O) microemulsions, are used for preparing small, uniform nanoparticles. 21 The water pool in inverse microemulsions increases the solubility of organic molecules. Solubilization in inverse microemulsions is a means of extraction leading to effective separation of dye material, and can be developed into a new kind of separation technology.
The catalytic activity of micelles has been studied for different organic reactions, especially the hydrolysis of esters, 22 Schiff bases, and carbocationic dyes. 23 There are reports on the mechanism of dye fading in the presence of surfactants.24–26 Raducan et al. studied the fading of MG in the presence of two cationic surfactants and one anionic surfactant, suggesting that the cationic surfactants had a catalytic effect, while the anionic surfactant had an inhibitory effect on fading. 27 The alkaline hydrolysis of MG in aqueous solution in the presence of CTAB was examined by Dasmandal et al. 28 The absorption spectra of MG aqueous solutions and oil/water/CTAB microemulsion were measured at room temperature. New thermodynamics association models based on the suspected reaction mechanism were built and the association equilibrium constants were obtained. By measuring the absorption spectra of a series of aqueous solutions at various molar concentrations of CTAB, at the same concentration of MG, at various times, the reaction kinetics equation was established, and the order and rate constants of association reactions were determined.
Experimental
Materials
MG dye was obtained from Shanghai Zhongqin Chemical Reagent Co. Ltd. CTAB (99.0 wt% pure) and isooctane and n-butanol (both 99% pure AR grade) were purchased from Laiyang Shuangshuang Chemical Reagent Co. Ltd.
Association Interactions
The MG aqueous solution, MG and CTAB aqueous solution, and MG aqueous solution/CTAB/isooctane/n-butanol microemulsion were prepared. The maximum absorption wavelength of these solutions were obtained by using a UV-2100 UV-Vis spectrophotometer (Shanghai Yuanxi Instrument Co. Ltd.) to scan from 350 to 700 nm. As shown in Fig. 1, curve 1 is the strong absorbance peak intensity of MG in aqueous solution. When CTAB was added to the solution, the absorption peak intensity significantly weakened (curve 2). Both absorption intensity and peak shape changed in the water/CTAB/isooctane/n-butanol microemulsion (curve 3), likely due to the existence of an association interaction between MG and CTAB.
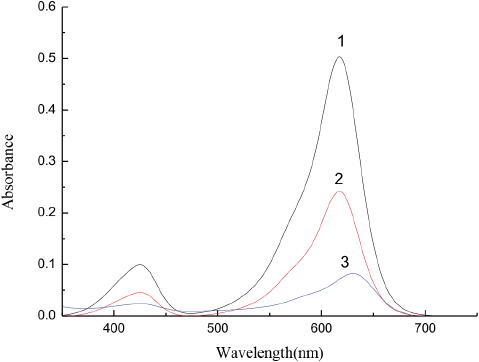
MG spectra: 1-MG aqueous solution; 2-MG in 1 × 10⁻³ M CTAB solution, and 3-MG in oil/water/CTAB microemulsion. All the concentrations of MG are 1 × 10⁻⁵ M.
Molar Absorption Coefficient
The strongest absorbance peak intensity appeared at 617 nm for the MG/CTAB aqueous solutions (Fig. 1, curve 2) and at 630 nm in the MG/water/CTAB/isooctane/n-butanol microemulsion (Fig. 1, curve 3). Therefore, the maximum absorption wavelengths at 617 nm and 630 nm were used to measure the absorbance of MG/CTAB aqueous solutions and microemulsions, respectively.
To get the molar absorption coefficients of MG at the different maximum absorbance wavelength respectively at 25 °C, the absorbance of a series of MG aqueous solutions of known concentration with solvent as a reference were determined, and the molar absorption coefficient obtained by fitting experimental data to straight lines through the origin (Fig. 2). The value of molar absorption coefficients of MG (εMG) were (5.37 ± 0.056) × 104 L·mol–1·cm–1 and (4.10 ± 0.067) × 104 L·mol–1·cm–1 at 617 nm and 630 nm respectively.
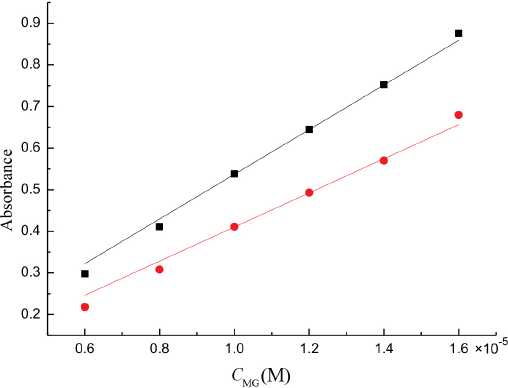
The absorbance of MG at various concentrations in aqueous solution: ■ at 617 nm; • at 630 nm.
Absorption Spectra of Aqueous MG Solutions
A series of solutions of MG (1 × 10⁻⁵ M) and CTAB concentrations from 5 × 10⁻⁵ M to 4.5 × 10⁻⁴ M were prepared respectively. The solutions were transferred into optical cuvettes and the absorbance of each sample was measured by the UV-Vis spectrophotometer at 25 °C and a wavelength of 617 nm.
Absorption Spectrum MG Microemulsions
MG solutions at 1 × 10⁻³ M concentration were prepared. A series of microemulsions with R (molar ratio of water to CTAB) values of 10, 15, 20, and 25 were prepared. The absorbance of different microemulsions were measured at 25 °C at a wavelength of 630 nm.
Results and Discussion
MG and CTAB Association Thermodynamics
Equilibrium Constant K in Aqueous Solution
It was assumed that an association reaction existed between MG and CTAB: CTAB + MG ⇔ complex
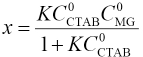
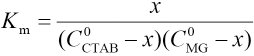
Association equilibrium constant K can be represented as in Eq. 1.
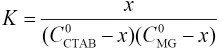
Where C0MG and CCTAB are the respective starting concentration of MG and CTAB, and x is the concentration of the association complex formed between MG and CTAB. When the CTAB concentration >> x, the experiments were analyzed by the Rose-Drago equation.29,30 Eq. 1 can then be expressed as Eq. 2.
Applying Beer's Law leads to Eqs. 3 and 4.

A corresponds to the absorbance of the initial solution, A is the absorbance of solution when the reaction comes to equilibrium, and εMG, εCTAB, and εM are the molar absorptivities of MG, CTAB, and complexes, respectively. The combination of Eqs. 2–4 gives Eq. 5.
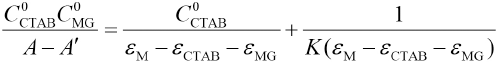
We determined the absorbance at 617 nm by preparing MG/ CTAB/water solutions that had different concentrations of CTAB and the same concentration of MG at room temperature. When this absorbance did not change, the association reaction reached thermodynamic equilibrium. We measured the absorbance of CTAB with water as the reference and found that the molar absorption coefficient of aqueous CTAB to be very small, therefore εCTAB ≈ 0. The plot of (C0CTAB C0MG)/ (A - A') vs C0TAB shown in Fig. 3 yielded straight lines with a slope of 1/(M - εCTAB – εMG) and an intercept of 1/K(εM -εCTAB - εMG), giving the association equilibrium constant of K = (6.51 ± 0.64) × 104 L·mol−1 and the molar absorption coefficient of complex εM = (2.40 ± 0.21) × 104 L·mol–1·cm−1.
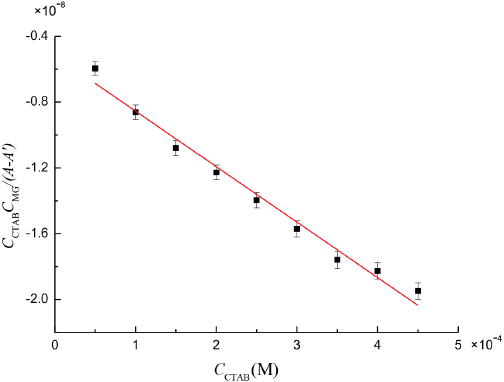
Plot of (C0CTABC0MG)/(A - A ') vs C0CTA
Association Equilibrium Constant Km in Microemulsion
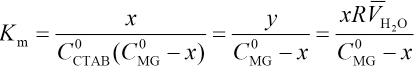
The association reaction between CTAB and MG in micro-emulsions takes place in the interfacial layer between water and surfactant. Assuming that y = nM/nCTAB, where nCTAB and nM are total quantities of CTAB and MG complexed with CTAB, respectively. This can be expressed as Eq. 6.
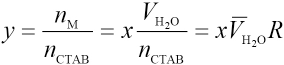
VH2O is the volume of water,
Because the concentration of complexes x is far less than the concentration of CTAB, Eq. 7 can be expressed as Eq. 8.
If as in Eq. 9,
then
The overall concentration xoverall is the concentration of the association complex formed by MG and CTAB in the micro-emulsion and may be written as in Eq. 11.
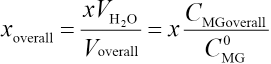
Voverall and CMGoverallare the total volume of microemulsion and the initial concentration of MG in the microemulsion, respectively. A blank microemulsion (not containing MG) was used as a reference. The absorbance Am of microemulsions with different CMGoverall values can be represented as in Eq 12.

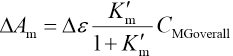
ΔAm can be determined using Eq. 13.

Where Δε = εM - εMG rearrangement of Eqs. 10, 11, and 13 give Eq. 14.
A straight line passing through the origin may then be obtained by plotting ΔAm vs CMGoverall. The slope of the line takes the form represented in Eq. 15.
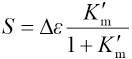
Substitution of Eq. 10 in Eq. 15 gives Eq. 16.
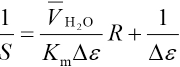
The plot of 1/Sversus R should yield a straight line and the slope and intercept of the line can be used to calculate Δε and Km.
Fig. 4 shows plots of ΔAm vs CMGoverall, in which four lines corresponding to R = 10, 15, 20, and 25 pass through the origin coordinates. The values S of slopes obtained through a least-squares fitting program were -36861.8 ± 101.2, -35477.4 ± 121.8, -34278.9 ± 100.4, and -33664.6 ± 137.2, respectively. Fig. 5 shows a plot of 1/S vs R. The values of 1/S and R were fitted into Eq. 16 to obtain Km = (2.57 ± 0.25) L·mol 1 and Δε = (3.93 ± 0.05) × 104 L·mol 1 ·cm 1 values.
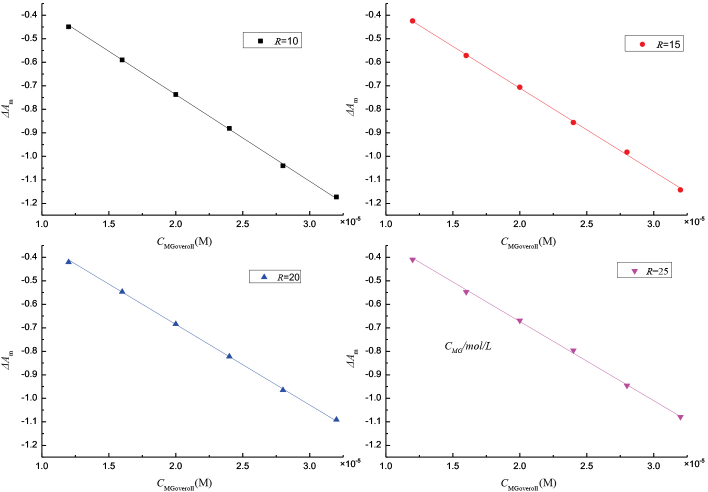
Plots of ΔAm vs CMGoverall for oil/water/CTAB microemulsions at different R values.
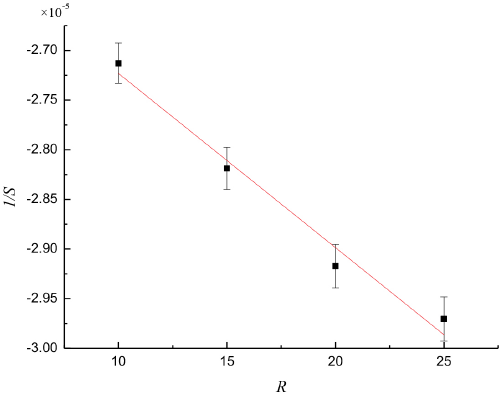
Plot of 1/S vs R for microemulsions.
Thermodynamic Parameter ΔrGm
μMG,μCTAB, and μC are the chemical potentials of MG, CTAB, and the association complex in aqueous solutions and microemulsions, respectively, and can each be expressed in the form of Eq. 17.
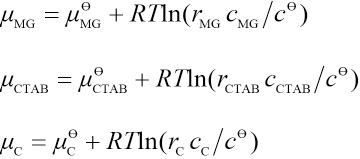
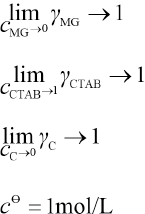
cMG, cCTAB, and cC are the concentrations of MG, CTAB, and the association complex, respectively. r is the activity coefficient, R is the molar gas constant, and T is the temperature. γ is the activity coefficient and meet the following conditions:
The Gibbs free energy ΔrGm may be expressed as Eq. 18.

Where Kγ= γC /γMG γCTAB, Kγ tends to 1 resulting in Eq. 19.
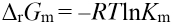
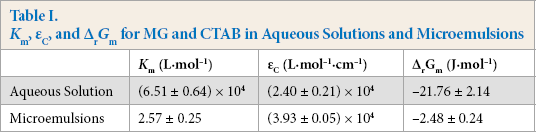
Km values can therefore be used to calculate Δr Gm values. All Km and ΔrGm values are list in Table I.
Km, εC, and ΔrGm for MG and CTAB in Aqueos Solutions and Microermulsions
Association Reaction Kinetics Model
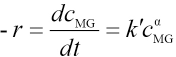
The association reaction rate equation between MG and CTAB can be expressed as in Eq. 20.
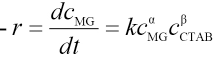
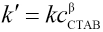
α and β are the partial orders of reaction and t is time. If cCTAB is much greater than cMG in the association reaction process, then cCTAB undergoes almost no change during the reaction and therefore,
The apparent reaction rate constant, k', can be then written as in Eq. 21.
Eq. 22 then follows.

Eq. 22 can be rewritten as Eq. 23.
Integration of Eq. 23 leads to Eq. 24.
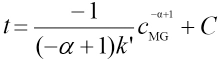
Cis a constant. The actual measured absorbance should be expressed as Eq. 4, because the molar absorption coefficient of CTAB can be ignored at a wavelength of 617 nm, that is εCTAB ≈ 0. Therefore, the actual measured absorbance can be expressed by Eq. 25.

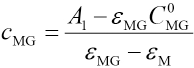
εMG and εM are molar absorptivities of MG and complex, C0MG is the initial MG concentration, and cMG is the solution concentration of MG during the reaction. The concentration of MG in the reaction system should be expressed as Eq. 26.
The apparent reaction rate constant k' and reaction order α can be obtained by nonlinear fitting to Eq. 24, and k and β can be obtained using Eq. 21.
Reaction Order and Rate Constant of Association Reaction
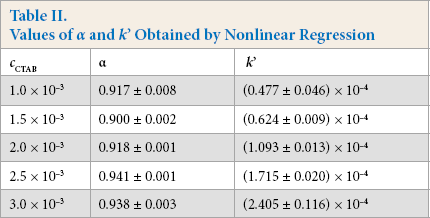
After we mixed the 1.0 × 10⁻⁵ M MG solution and 1.0 × 10⁻³to 3.0 × 10⁻³ M CTAB solutions, we measured their absorbance at 617 nm over time at 25 °C. The dependences of time t vs absorbance cMG at different CTAB concentrations are presented in Fig. 6. The apparent reaction rate constants k' were estimated by nonlinear regression at different concentrations of CTAB (Table II). The values of k' increased with increased CTAB concentrations, but the values of α changed little, with an average value of 0.923 ± 0.003.
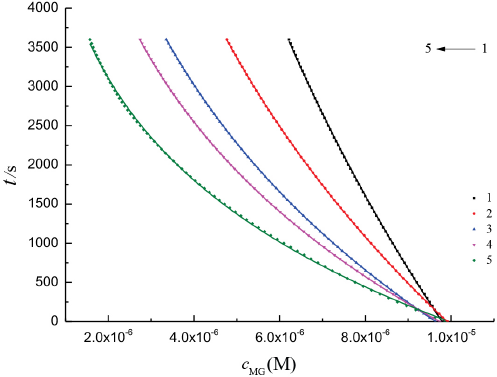
The plot of t vs cMG. [CTAB] 1: 1.0 × 10⁻³ M, 2: 1.5 × 10⁻³ M, 3: 2.0 × 10⁻³M, 4: 2.5 × 10⁻³ M, and 5: 3.0 × 10⁻³ M. [MG] was 1.0 × 10⁻⁵ mol/L. Dashed lines represent experimental data and solid lines represent fitting results.
Values of α and k’ Obtained by Nonlinear Regression
If Eq. 21 is converted to the logarithmic form, Eq. 27 results.
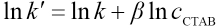
The plot of lnk ’ vs lncCTAB results in s a straight line as shown in Fig. 7.
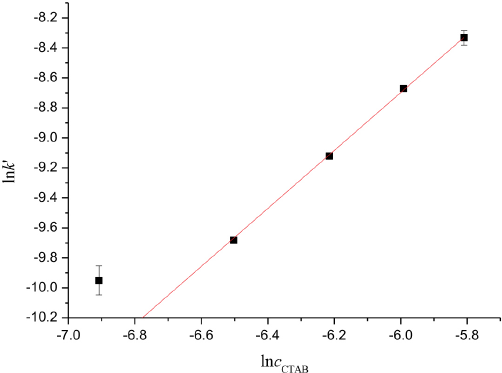
The plot of ln k' vs lncCTAB.
Weighting least-squares fitting obtained β = 1.931 ± 0.106 and lnk ’ = 2.886 ± 0.654. The total order of the reaction was n = α + β = 2.854 ± 0.109 and the reaction rate constant was k = (17.920 ± 11.365) (mol·m–3)−1.854·s–1.
Conclusions
In this study, we determined absorption spectra for Malachite Green (MG)—solutions used for textile dyeing— showing that an association interaction (microemulsion) existed between cetyltrimethylammonium bromide (CTAB) surfactant and MG dye. Association models based on a proposed reaction mechanism were built and the association constants between MG and CTAB in the aqueous solution and microemulsion were determined by linear regression of experiment data. The data gave a very good linear relationship. The association equilibrium constant was K = (6.51 ± 0.64) × 104 L·mol–1 and Km= (2.57 ± 0.25) L·mol–1·cm–1. Km is much less than K. Microemulsion formation had an inhibitory effect on the association reaction. After measuring absorbance of aqueous solutions with various CTAB concentrations and a fixed concentration of MG at different times, and setting up the reaction kinetics equation, the association reaction order of MG and CTAB in aqueous solutions was 2.854 ± 0.109 with the reaction rate constant k = (17.920 ± 11.365) (mol·m–3)–1.854·s–1. The fading of MG can help to detect MG in solution, and the research of association behaviors also have important value for the further study of textile dyeing mechanisms.
Footnotes
Acknowledgement
This work was supported by the Innovation Fund of Small and Medium-Sized Enterprises of Gansu Province (Grant No. 1407GCCA013), the Lanzhou Municipal Science and Technology Bureau Program (Grant No. 2015-4-137) and the Qing Lan Talent Engineering Funds of Lanzhou Jiaotong University.