
Abstract
Spin drying is the most commonly-used operation for laundry dehydration in domestic washing machines. In past decades, some parameters affecting residual water were investigated and semi-empirical models were given. However, they were only valid for test conditions because of incompatible unit analyses. In this study, a mathematical model with dimensionless numbers was developed by analogy between multilayer porous cotton textile and compressible porous media. Initially, textile porosity determined under compression and dewatering experiments were then determined at different drum speeds, water temperatures, and with test fabrics having various numbers of textile layers. Afterwards, all inputs and outputs were converted to dimensionless numbers, such as saturation (S) and capillary number (N cap ). Finally, the mathematical model, including capillary effects for compressible porous media, was obtained to predict water content after spinning.
Introduction
Solid-liquid separation is a basic research topic in the chemical, reservoir, and textile industries for economical collection of solid content. Rushton specifies separation methods using vacuum, compression, and centrifugation for effective water removal. 1 Centrifugation has some advantages compared to other methods such as the large amount of dewatering per energy consumption and short process duration. It is especially beneficial for energy consumption during tumble drying after water removal by washing machine spinning. 2
Parameters influencing residual moisture content (RMC) were investigated. Welo et al. examined the impact of fiber type on water retention. The RMC value was low for glass fiber and higher for cotton and rayon fibers. 3 Moreover, Loeb's studies demonstrated that RMC values decreased drastically when water surface tension was reduced. 4 Additionally, he researched the effect of the number of textile layers on water retention during dewatering. The percentage of remaining water was less for triple-layer fabrics compared to single-layer fabric as the centrifugal pressure increased. 5 However, there is a physical limit for cotton fiber's RMC value, which is 30–40%. 6 Also, the RMC value decreased with increased temperature. 6 Denton studied the distribution of moisture among layers during centrifugation and found that the water amount increased from the inner layers to the outer layers. 7 Recently, Richter investigated the influence of fabric softeners during washing and determined that the water extraction rate increased due to the decreased surface tension afforded by the textile softener. 2 Further-more, Merediz notes that the dehydration flow was higher as the drum speed accelerated. RMC values came closer to each other when the motor remained at its final revolution speed for an adequate period of time. 8
Schubert indicates that three states exist in compressible porous media: capillary, funicular, and pendular states. 9 The capillary state occurs at the initiation of spinning where the compressible porous media layer is practically saturated and the capillary pressure suddenly increases. In the funicular state, the capillary pressure increases gradually while water is being discharged from the textile. Hwang et al. claimed that water remains solely among the contact of particulates at the end of spin extraction and is characterized as the pendular state. 10 At this third stage, water cannot be further drained mechanically from the compressible porous media. In the literature, the ratio of volume of remaining water to volume of porous media is described as saturation, as shown by Eq. 1.
S is saturation, V l is liquid volume (m3), Vp is porous volume (m3), V is total volume (m3), and ε b is bulk porosity. The bulk porosity can be calculated by Eq. 2.
L is total thickness during compression (m), Ais projection area of the textile (m2), ρs is solid density (kg/m3), msis solid mass (kg), and nk is number of sheet layers.
Parallel to water saturation, water extraction performance can be expressed as RMC as specified in the BS EN 60456 (2011) standard as Eq. 3. 11
ml is remaining mass of water (kg) and mbis mass of base load before washing (kg) under ambient room conditions (23 °C and 55% relative humidity (RH)). Mass of solid content can be calculated using Eq. 4.
Rm is water regain, Vs is volume of solid (m3), and ρs is solid density (kg/m3).
During centrifugal dewatering, the capillary pressure reaches the value of the centrifugal pressure such that more water cannot be discharged from the textile. This results in a state of irreducible saturation S∞. 10 The capillary number (Ncap, which is defined as the ratio of centrifugal forces to surface tension forces, is determined by Eq. 5.
x is characteristic fiber diameter (m), ρl is liquid density (kg/m3), and σ is surface tension (N/m) The derivation of Ncap is shown in the Annex A section.
The centrifugal acceleration (C) is determined by Eq. 6.

w is angular speed of the rotating drum (s–1) and r is radius of the rotating porous media (m). There are different empirical equations for equilibrium saturation that are correlated by radius of the drum, angular velocity, fiber diameter, and liquid density12,13
In this study, the development of a mathematical model with dimensionless numbers was arrived at by analogy between multilayer porous cotton and compressible porous media based on chemical and reservoir engineering principles. Therefore, correlation between S∞and Ncapwas obtained from experimental analyses of multilayer porous cotton. This new approach allows calculation of RMCoutside of experimental space. First, experimental studies were proposed to calculate the porosity related to applied pressure, since wet cotton textile was treated as a deformable porous media. Ten, the porosity was used in determining Sand Ncap. Finally, statistical analyses were performed to calculate equilibrium saturation.
Experimental
Bulk Porosity of Multilayer Porous Cotton
In these experiments, multilayer porous cotton were preferred for investigating porosity changes under centrifugal pressure. The bed sheets defined in the BS EN 60456 standard were used in these experiments since they had the required properties. 11 The fabric was plain woven from ring spun made of long staple pure cotton, and had a yarn count of 33 × 33 tex and a pick count of 24 × 24 picks/cm.
The density of the dry fabric must be determined to calculate the porosity. Preston and Nimkar specify that the dry density (ρs of cotton fiber was 1550 kg/m3. 14 When bone-dry cotton fibers were exposed to standard conditioning (20 °C and 65% RH) for at least 8 h, the material absorbed atmospheric moisture, which is defined as water regain (Rm). Rm is the ratio of water mass to solid mass. Ford claimed that Rmwas ∼8% for cotton-based textiles. 15 Since absorbed moisture occupies volume, it must be considered during porosity determinations. To investigate irreducible saturation (S∞) during centrifugation, the porosity of a multilayer porous cotton was determined as the compressible pressure was increased. Hearne and Nossar found that the textile density was altered by applied compression. 16 They suggested an empirical expression to identify the relationship of density to pressure. Moreover, Chan et al. discovered that the specific resistance of porous material was associated with the applied pressure. 17 Wakeman and Tartelon calculated a power law correlation between porosity and compressive pressure. 18 In summary, a test setup was needed to calculate the porosity depending on the compressive pressure.
A Zwick Roel Z020 model device was used to apply compression (Fig. 1). Specimens (20 × 20 cm) were prepared and were placed between the upper and lower planes of the apparatus.
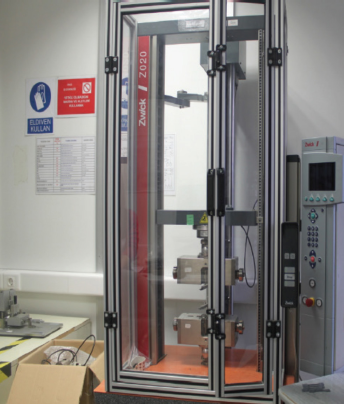
Compression device for changing porosity of multilayered textiles.
The lower plane was fixed with a joint, while the upper plane was left as moveable to implement the predetermined force. The test machine contained force and displacement sensors for measurement.
Centrifugal dewatering can be performed for different amounts of a textile. The number of textile layers under pressure were set to 20, 40, and 80 to simulate consumer use. First, test materials were held in the same water bath for a minimum of 30 min to assure water absorption before compression. The applied pressure for each test material was scanned in a wide range to measure porosity. Test results can be seen in Table I. The thickness of test material was recorded along with the change of force. Ten, the bulk porosity of the multilayer porous cotton was calculated by use of Eq. 2.
Porosity Versus Compression Pressure
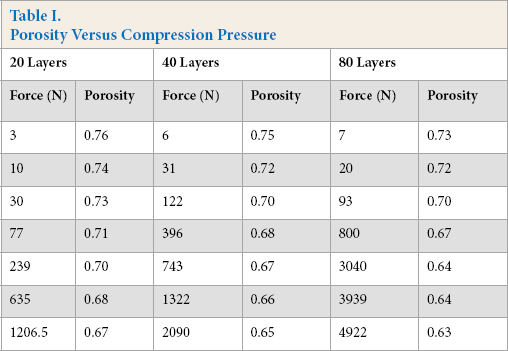
During compression tests, the peripheral area of the wet test material was exposed to the atmosphere and the porous volume exclusively contained water. When pressure was applied to the material, water left the textile easily because of water's incompressibity, while assuming that the cotton fiber density remained constant. Under these conditions, the volume of extracted water equaled the change of porous media volume. When force balance was considered, the relation between bulk porosity and compressive force can be expressed as Eq. 7.
L is thickness of the pressurized test specimen (m), g is gravity (m/s 2 ), and P is pressure (Pa). The derivation of Eq. 7 is given in Annex B.
A logarithmic plot of bulk porosity versus compressive pressure is given in Fig. 2. It was observed that the number of layers also affects porosity under compressive pressure.
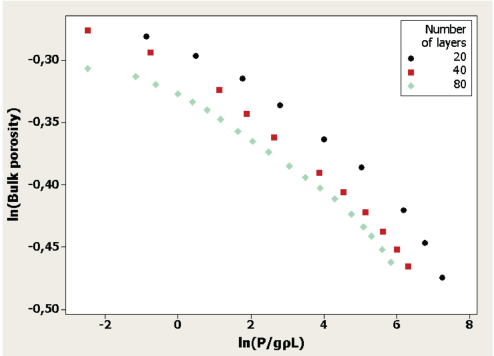
ln(porosity) versus ln(P/gL)curves.
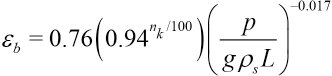
Minitab 16 software was used to perform regression analyses between εb P/ρsgL and nk Eq. 8 derived from Eq. 7, was used to calculate the bulk porosity versus thickness, pressure, and number of layers. At the end of regression analyses, R 2 was 98.69%, which shows a high-level relationship with the inputs used.
Centrifugal Dewatering
Dewatering experiments were carried out in a test setup (Fig. 3). The centrifuge was a converted Arçelik 8147 CMK model washing machine. This machine had a controllable brushless DC motor to run the drum at different revolutions.
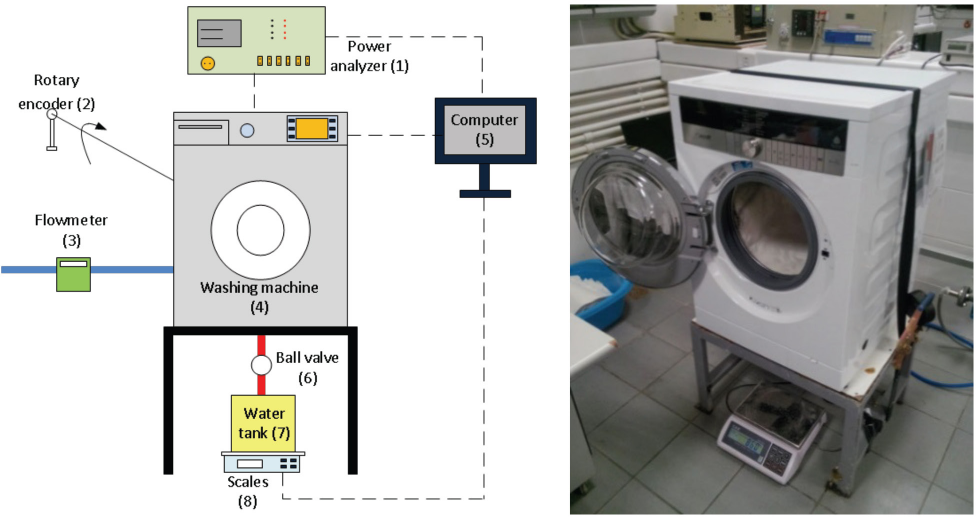
Test setup: power analyzer (1), rotary encoder (2), flow meter (3), washing machine (4), computer (5), ball valve (6), water tank (7), and scales (8).
The centrifuge was secured onto a platform and the motorized valve was connected to the bottom of a tub. When the control unit activated water drainage before spinning, the valve was opened and water was released onto a scale (CAS ED-H) to obtain the dewatering rate. The test system also included a Schneider Electric Ion 6200 brand power meter to measure the power consumption of motor, valves, and heater, ensuring that each component was driven correctly by the control unit. There was also a water heater between the drum and tub to heat water to the target temperature before spinning. A rotary encoder (Autonics E50S8-360-3-T-24) to measure drum speed, power analyzer, flowmeter, data logger, and computer were also included in the system. A T-type thermocouple was used with an Agilent Datalogger to measure water temperature. The surface tension of the liquid was measured using a Kruss K12 model tensiometer. The water temperature was changed by the control unit and the surface tension was determined by the temperature.
The triple wings of the drum were removed from the test setup to attach the multilayer porous cotton homogeneously as shown in Fig. 4. The compressible porous media were usually in the form of a slurry, which was a homogeneous mixture of solid and liquid. However, attachment was required to keep the multilayer porous cotton homogeneous. Screws were first welded to the surface of the drum. Next, the textile specimens were cut and attached to the drum by screws. The length of each layer decreased from the outer radius to the inner direction. The multilayer porous cottons were initially designed this way.
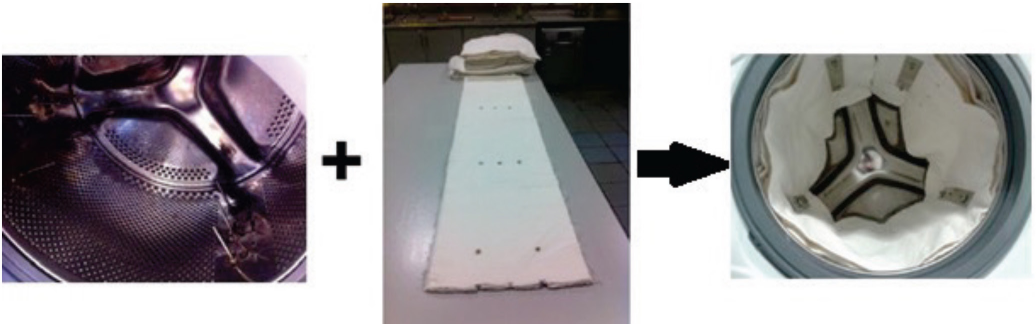
Attachment of multilayered sheets to drum.
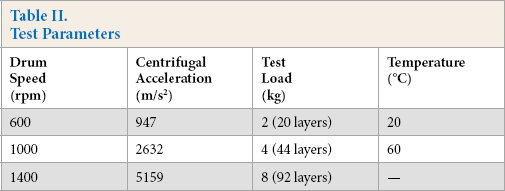
Full factorial experimental design was used to investigate the influence of all inputs. The effects of drum speed, test load, and temperature are shown in Table II. The final rotational speed of drum was the main influential parameter affecting centrifugal pressure and textile porosity. A wide range of drum speeds (from 600 to 1400 rpm) were studied. The number of sheet layers is also another important input as highlighted in the literature. Therefore, the test load mass was changed to determine the effect of sheet layers on bulk porosity. Temperature was also studied to understand the influences of water density and surface tension on irreducible saturation.
Test Parameters
During tests, enough water was added into the system to soak the test loads before centrifugation, depending on the number of layers, and was measured using an Endress Hauser Promag P50 model flowmeter. The water and test materials were heated to the target temperature at a drum speed of 52 rpm to obtain homogeneous temperature distribution. Ten, the valve was opened and the residual water was drained on to the scale before spinning. The motor was controlled at the same acceleration to reach the target speed, and then allowed to run for 10 min at spin speed to ensure that the specimens achieved irreducible saturation at the end of spinning. The uncertainties of the scale and T-type thermocouples used were ± 2% and ± 0.75% respectively. The rotary encoder had an uncertainty of ± 0.5% for the measurement of angular velocity.
Results and Discussion
First, the results were compared with the previous studies of Denton 7 as shown in Fig. 5. Cotton-based test materials were used, the drum speed was adjusted to 1450 rpm and the drum diameter was 20 in. 7 The influence of centrifugal acceleration on RMC is shown. Test results from the two sets of experiments got closer when the acceleration was between 1000 and 5000 m/s 2 .
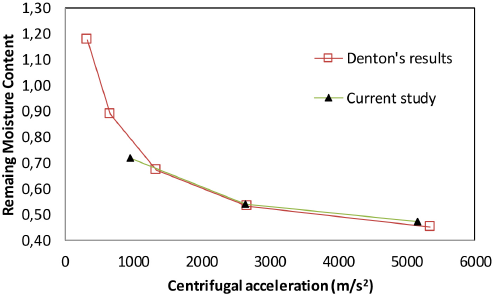
Comparison of test results versus Denton's results.
RMC versus different drum speeds can be seen in Fig. 6 for 8 kg of textile. The greatest amount of water was discharged during drum acceleration. When the motor rotated for a sufficient period at target speed, the rate of evacuated water decreased sharply and the water amount in the porous media approached the irreducible saturation value. It can be readily observed that the remaining water in the textile decreased as the speed of drum increased due to centrifugal forces.
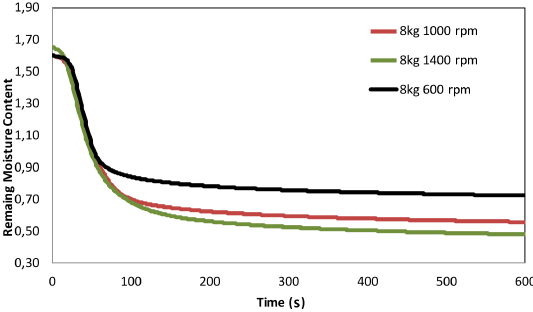
RMC versus drum speed (rpm).
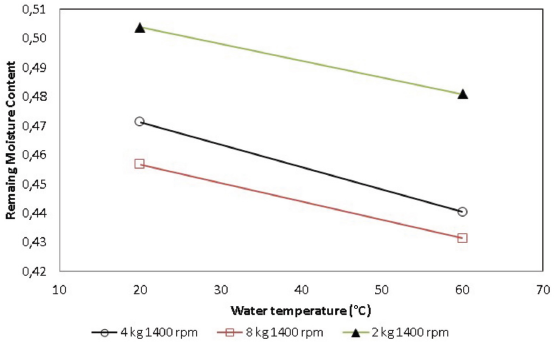
RMC versus water temperature (°C)
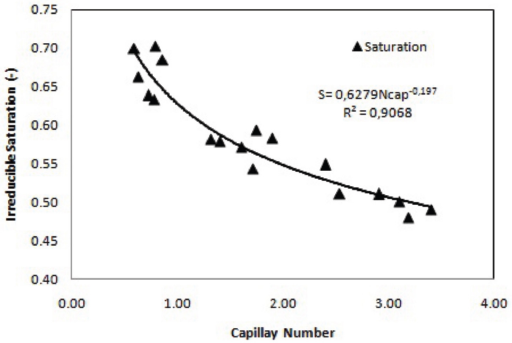
The irreducible saturation S∞ versus Ncap.
RMC versus water temperature can be seen in Fig. 7 for different test load amounts. RMC decreased with increased water temperature due to decreased surface tension at higher temperatures.
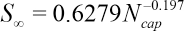
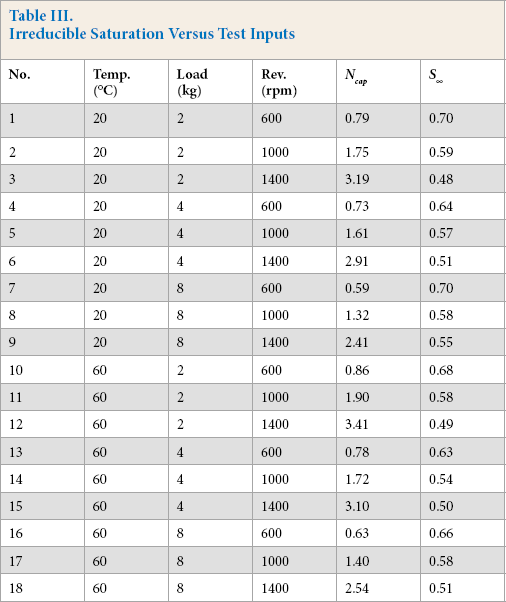
The test results in Table III indicate the relationship between S∞ and Ncap. Graphical analysis shows a logarithmic relation-ship between S∞ and Ncap. The regression between S∞ and Ncap is shown in Eq. 9.
Irreducible Saturation Versus Test Inputs
R 2 was 90.68%. Fig. 8. plots the relationship between S∞ and Ncap, showing both experimental data and regression curves
Normality and equal variances tests were applied to check the validity of Eq. 9 (Fig. 9). It was assumed that the significance level α = 0.05. When an Anderson-Darling test 19 was applied, the standard deviation was 0.022 and the p-value was 0.165 where the residuals distributed normally. Afterwards, Bartlett's test 19 for equal variance was applied giving a p-value of 0.714 where the residuals didn't change versus ft values. These results show that the model assumptions were valid and the pooled standard deviation was 0.022.
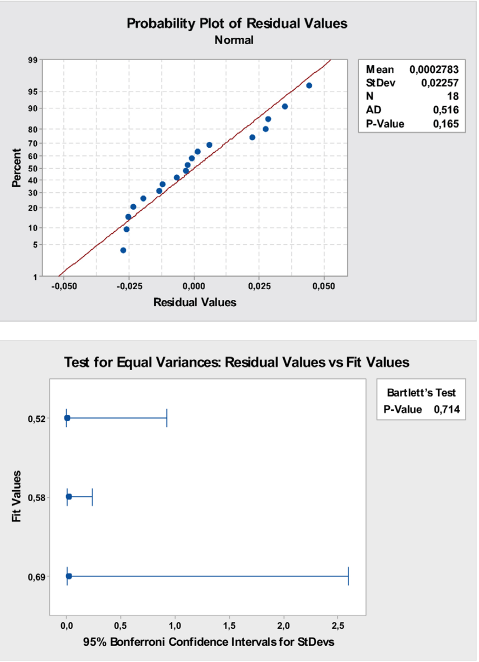
Normality and equal variances test results.
A comparison of Denton's results 7 and model predictions obtained by Eq. 9 are given in Fig. 10. The comparative results got closer when the centrifugal acceleration was between 500 to 5000 m/s 2 . The difference in comparative results increased at lower drum speeds (less than 500 rpm). The number of experiments at lower revolutions must be increased to get closer results.
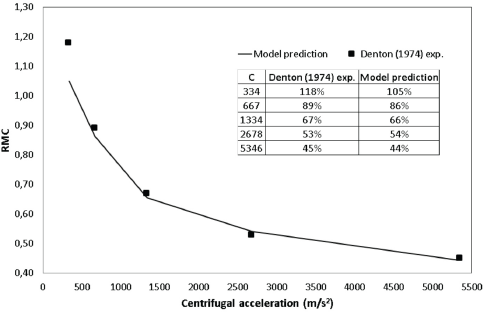
Comparison of experimental data and regression analyses.
The dimensionless model was established as defined in Eq. 9 and the model was validated with experiments executed by Denton. 7 Finally, mechanical system modifications can be modeled by using simulations. RMC of bed sheets and pillow cases defined in BS EN 60456 were calculated for an 8-kg washing load. Calculations were carried out after changing temperature, drum index, and drum speed. Fig. 11 shows the RMC versus design and algorithm parameters.
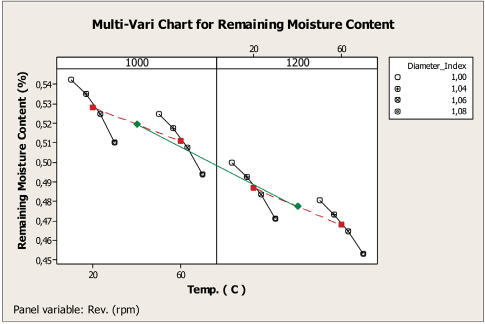
Multi-Vari chart of RMC versus diameter index, revolutions (rpm), and temperature (°C).
The RMC was greater than 0.54 for the 1000 rpm drum speed at 20 °C using the common drum diameter of 480 mm. Simulation suggests that RMC can be decreased with an increase in the diameter index. It was estimated that the amount of water remaining after spinning can be reduced ∼3-5% with an 8% increase in drum diameter at the same temperature. Additionally, the remaining water was also decreased by 8% at 60 °C.
Conclusion
The correlation between S∞ and Ncap was investigated by using analogies with compressible porous media and multilayer porous cotton. First, the test material was chosen as a bed sheet defined in the BS EN 60456 standard and its physical properties were calculated at room temperature. Ten, the relationship between deformable porosity and compressive pressure was obtained from experimental studies for a different number of textile layers (Table II).
Full factorial experiments were then performed by changing water temperature, number of layers, and drum speed. The residual moisture content (RMC) decreased as the drum speed increased. Increased water temperature reduced S∞due to the resulting decrease in water surface tension.
Finally, regression analysis was performed between S∞ and Ncap resulting in R 2 = 90.10%. The analogy between compressible porous media and multilayer porous cotton during centrifugal dewatering was valid in this study. Normality and equal variance tests were applied, model assumptions were valid, and pooled standard deviation was 0.022.
Tanks to the model containing S∞ and Ncap dimensionless numbers, the water extraction performance was calculated for different load amounts, drum designs, and water temperatures. The same effectiveness observed at 1200 rpm can be obtained at 1000 rpm when run at 60 °C in a centrifuge with an 8% increase in drum diameter.
This study contains a model to predict RMC versus design inputs except for different algorithm alternatives and spin durations. Additionally, the momentum equation must be solved to obtain time-dependent solutions. In future work, Coriolis effects, type of flow regime, and behavior of the permeability term during compression can be achieved by reduction of current experimental data for a momentum equation solution.
Footnotes
Annex A
This section contains the derivation of capillary number (Ncap).
The pressure drop acting through the cake during spin drying was originated by Tiller and Hsyung and is expressed as Eq. A-1. 20
w is angular velocity (s–1) and ρl is centrifugal pressure drop between the outer radius (r0) and inner radius (ri). In porous media the Ncap introduces the effect of viscous forces versus surface tension (Eq. A-2).
μ is dynamic viscosity of the liquid (Pa·s), u is liquid flux (m/s), and σ is surface tension of water (N/m). The released liquid passed through the multilayer porous media during dewatering can be defined by Eq. A-3. 21
Annex B
This section describes parameters affecting the change of bulk porosity (εb). Fig. B-1 shows the force balance of the multilayer porous cotton under pressure. The force balance can be expressed as Eq. B-1.
P is pressure acting on the textile (Pa), Ap is projection surface of the textile (m2), g is gravity (m/s 2 ), and ρ is density of the porous textile (kg/m3) Eq. B-2 shows the mass balance of the compressible porous medium.
After the integration Eq. B-4, the change of bulk porosity (εb) can be obtained theoretically as shown in Eq. B-5.
Porosity is main function of thickness (L) and pressure (P). Therefore, the following expression (Eq. B-6) was used during the data reduction of experimental results to obtain bulk porosity (εb).