
Abstract
Continuous measurement of temperature profiles on the surface of the human body offers various kinds of information valuable for clinical diagnosis and as a useful guide to take suitable action. In this article, the behavior of a newly developed temperature sensing fabric (TSF) over extended periods of time in a practical application and its comparison with a reference temperature sensor was investigated. The performance of the TSF was analyzed by measuring the human body skin temperature under steady-state and dynamic conditions. A dedicated interface was built in the LabVIEW environment to measure and record the temperature readings of the TSF and reference temperature sensor simultaneously. The reference and TSF sensors both followed exactly the same trends and experienced the same type of movement artifacts.
Keywords
Introduction
To improve patient quality of life and lower healthcare costs by reducing hospitalizations, a number of research studies have been carried out in recent years. These include development of wearable health monitoring systems (WHMS) for continuous monitoring of human body vital signs over extended periods of time.1,2 To acquire body signals, a sensing platform adjacent to the body is required. Textiles can offer a comfortable, flexible platform to embed sensing functions; therefore, development of sensing fabric or textile-based sensors has been the key investigative area within the domain of WHMS. 3
Vital signs are measurements of the physiological condition of the human body and reveal the body's ability to regulate body temperature, maintain blood flow, and oxygenate body tissues. 4 Each vital sign has its respective role in diagnosis and control of disease. In standard medical settings, the most commonly measured vital signs are temperature, respiratory activity, electrocardiography (ECG), and blood pressure. Human body temperature is an important indicator of human body physical condition. Only a few degrees’ deviation (± 3.5 °C) from the normal core body temperature of 37 °C can cause impairments and fatality to the human body.5,6 For instance, abnormal body temperature can be an indicator of illness at an initial stage and can be a useful guide to take suitable action.4,7
Along with core temperature, the skin temperature profile on the surface of the human body offers various kinds of information valuable for clinical diagnosis. Abnormalities of skin temperature distribution are often studied together with unusual peripheral blood circulation, 8 vascularization or heat production in the underlying tissue, 9 or diagnosis of nerve compression. 10 In most clinical settings, the core or skin temperature of the human body is measured in an epi-sodic manner; a few times, on a daily basis. However, there are certain medical conditions where it's important to measure the human body temperature continuously in a clinical environment along with other vital signs. For example, Van Vliet et al. reported the importance of continuous skin temperature measurement of neutropenic patients. 11 Similarly, continuous body temperature measurements are sometimes also performed in non-clinical settings (e.g., sports, military, general healthcare, firefighting situations, and studies related to biorhythms and assessment of thermal strain in extreme environments).12–16
Within the context of WHMS, previous research has mainly concentrated on the development of sensing fabric for the measurement of respiratory and electro-cardiography signals17–24. For human body temperature measurement, researchers have predominantly counted on commercially-available temperature sensors, such as temperature-measuring integrated circuits (ICs) and therm-istors.25–28 A literature review revealed that the development of sensing fabric for human body temperature measurement was insufficiently explored in the few available isolated studies.29–34 These studies were preliminary in nature; sensors were fabricated by a cumbrous labor-intensive processes and were limited in their depth of characterization and performance in both the laboratory and application environment.
This paper presents part of the research carried out to develop TSF for the purpose of continuous ambulatory monitoring. In earlier articles, TSF was fabricated on an electronic industrial-scale knitting machine,35,36 a test-rig was developed to calibrate the TSF, 37 and the effect of strain and humidity on TSF performance 38 was studied. One of our research objectives was to evaluate TSF performance in the application environment. This study was carried out by subjecting the TSF to various static and dynamic environments for extended periods of time and comparing its performance with the reference temperature measuring system. The effect of clothing layers and clothing pressure were also studied.
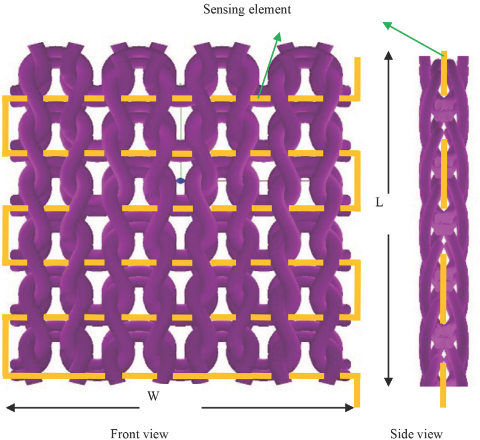
Particulars of the design and the construction of the TSF were readily accessible. 35 The TSF was fabricated on an electronic industrial fat-bed knitting machine by inlaying a fine metallic wire as a sensing element in the middle of the two-layer polyester knitted fabric as shown in Fig. 1. The tungsten, nickel, and copper sensing elements, in the shape of bare and shielded wires of varied diameters (from 50 μm to 150 μm), were used in the manufacture of the TSF to ascertain the most appropriate design. The TSF samples were fabricated by embedding 3.8 m of sensing wire in the middle of a 3.5-mm thick fabric in a temperature monitoring area of 8 × 8 cm. Highly-textured polyester yarn was used as the base material of the TSF, which increased the fabric bulki-ness and provided better cover of the sensing element from abrasion. The sensing element was scarcely noticeable and had no considerable effect on the aesthetics or the comfort of the fabric. The measurement principle of the TSF was based on the inherent property of metal wire to change its electrical resistance with changes in temperature.
Materials and Methods
Reference Temperature Measurement System
A foil resistance temperature detector (RTD) made with a platinum element was used as the reference temperature sensor as shown in Fig. 2. 39 To acquire the RTD signals, a four-channel data logger especially designed for RTD sensors (PT-104 by PicoTech) was also used (Fig. 2). 40 According to the specifications of the RTD sensor and the PT-104 data logger, their combined accuracy at 35 °C is ± 0.2 °C.
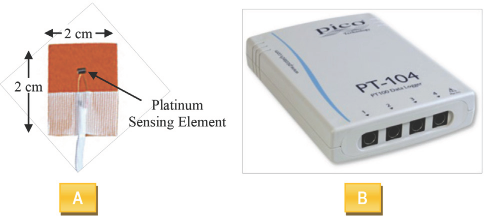
Reference temperature measurement system. A) A foil RTD with a platinum element, and B) A PT-104 data logger for the foil RTD.
TSF Temperature Measurement System
To acquire temperature data from the TSF, an Agilent 34401 Multimeter (Fig. 3) was used as a data logger. 41 The same instrument was used to measure resistance during resistance-temperature testing for calibration purpose. 37 In operation, it acquired resistance signals from the TSF and displayed them as temperatures after processing the calibration equation of a particular TSF sample.
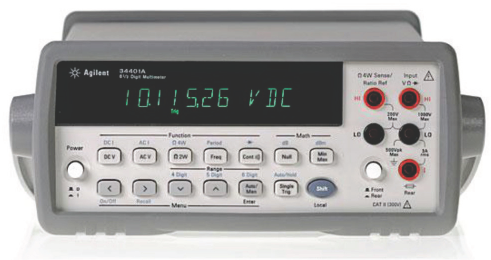
Agilent 34401A benchtop multimeter.
The calibration equation of a TSF sample can be created by first generating the regression equation of resistance (
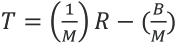

where
Temperature Recording Interface
The computerized instruments used for measurement of TSF temperature and the reference sensor have their own respective software suites for measuring and recording data. However, the requirement of this study was to visualize the temperature and resistance signals in one application. The PT-104 data logger and Agilent Multimeter were also supplied with driver routines and a selection of examples of how to use these drivers with LabVIEW. By calling and modifying the example LabVIEW files of both instruments, a customized PC interface for measurement and recording of TSF and RTD temperature data was developed in the LabVIEW environment (Fig. 4).
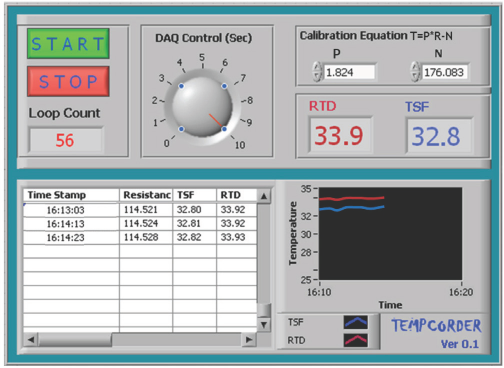
Temperature recording interface (Tempcorder) created in the Lab-VIEW environment.
The consequence of this development was the capability to visualize and record the temperature data, along with a date and time stamp, during the human body test sequences. The graphical user interface (GUI) was styled to view real time TSF temperature data and RTD in tabular, graphical, and indicator formats (Fig. 4) This customized interface was named the Tempcorder (Temperature Recorder). Before the start of the test, calibration constants of the particular TSF sample were inserted. When the required length of the test ended, the recorded data file was viewed and analyzed in an Excel spreadsheet.
Sample Preparation
To deploy the TSF samples for human body testing, the samples required some preparation. Fig. 5 explains all the steps of the sample preparation process. The output of the computerized fat-bed knitting machine is a TSF sample with ends of sensing elements a few centimeter apart as shown in Fig. 5A. 35 To connect the ends of these sensing element to the multimeter lead, a tiny dedicated connector, such as a Molex connector, was required. However, it was important to bring both ends of the sensing element close to each other as shown in Fig. 5B. Therefore, both ends of the sensing element were routed towards the non-sensing area of the TSF by inlaying (using a sewing needle) the sensing element manually along the edges. Subsequently, the ends of the sensing element were soldered to the Molex connector (Fig. 5C), which was already bonded to the required position with polyacrylate cement. To facilitate human body temperature measurement and to maintain the TSF pressure on the skin, a stretchable fabric belt was prepared (Figs. 5D and E). To fasten the TSF sample on the fabric belt, hook and loop fastener pads were sewn on the non-sensing area of the TSF and on the belt (Figs. 5D and E).
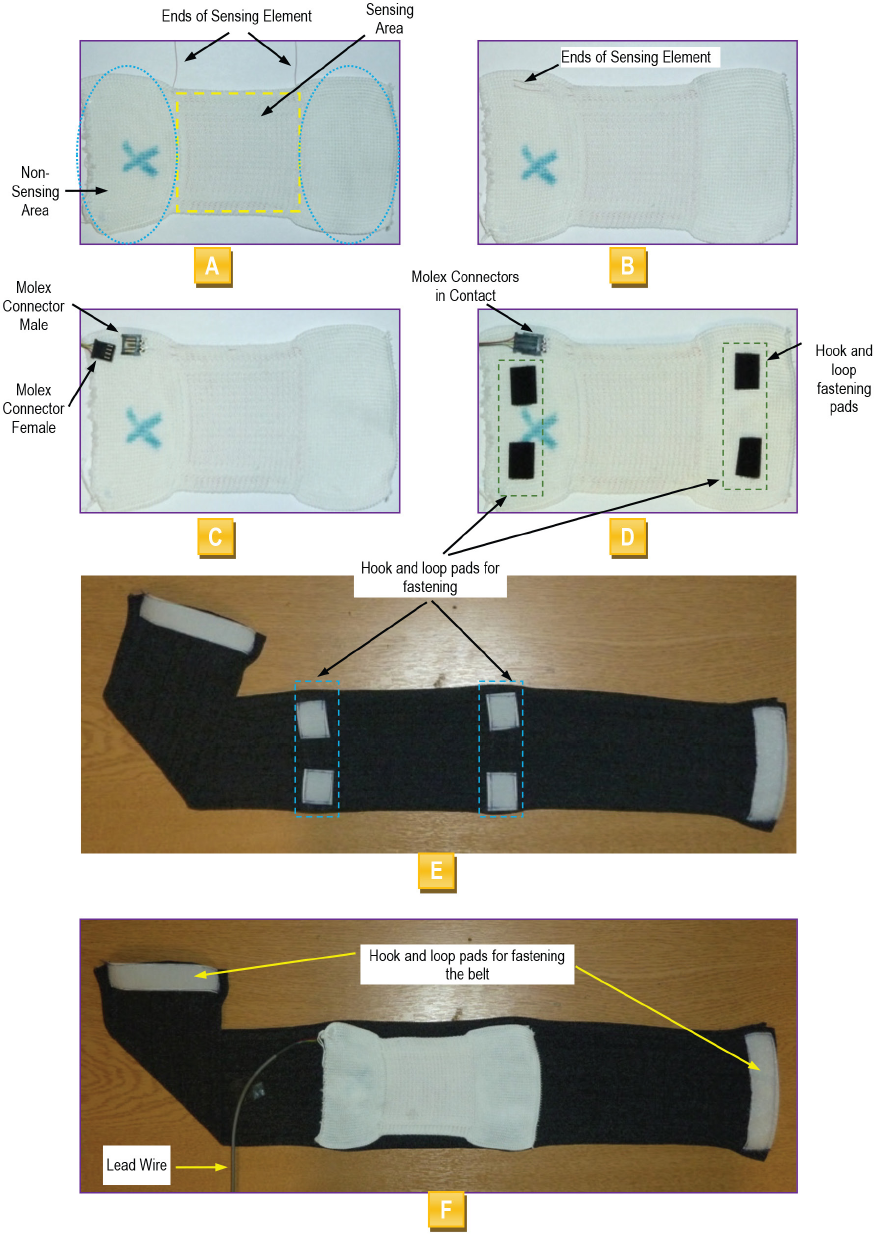
Various stages of sample preparation for human body testing. A) TSF with ends of sensing element widely separated, B) ends of sensing element routed together, C) ends of sensing element soldered to Molex connector, D) hook and loop fastener pads attached at non-sensing area of the TSF, E) hook and loop fastener pads sewn to stretchable fabric belt, and F) TSF fastened to belt by hook and loop fastener pads.
Highly sensitive TSF samples, made of insulated sensing element (i.e., braided enameled nickel of 61 μm diameter), were used in this study. These particular samples were chosen because of their performance in laboratory temperature-resistance experiments and strain testing.35,38
TSF Performance in the Steady State
TSF performance in the steady state was assessed by performing two types of experiments under laboratory conditions of 60% relative humidity (RH) and 25 °C. These were the effect of pressure, applied by the TSF on the skin, on TSF temperature measurement, and estimation of the thermal conduction error in the TSF temperature measurement.
To rule out any variations in pressure due to of body movement (such as respiratory effort), limbs (arm and thigh) were chosen as a measurement site instead of the torso. During the test, the subject was relaxed and comfortably seated.
Effect of Pressure
The pressure applied to a human body by wearing a cloth is known as clothing pressure. Skin temperature registered by a TSF worn on a human body depends upon the quality of its thermal contact with the skin. This thermal contact may be enhanced by increasing the pressure applied by the TSF on the skin. Therefore, knowledge of the TSF pressure is important while assessing its sensing performance.
Clothing pressure is usually measured by inserting a flexible pressure sensor (such as an air pack) into the region between the skin and the clothing.42,43 Pressure may be applied by stretching the fabric or by applying pressure circumferentially (e.g., by using a blood pressure measurement cuff). A pressure cuff, typically used for blood pressure measurement, was used to apply the pressure circumferentially around the limb (Fig. 6). An electro-pneumatic interface pressure measuring device, the Oxford Pressure Monitor (OPM MK II) with a 2 × 2 cm inflatable sensor, was used to measure the pressure applied by the TSF on the skin (Fig. 7).
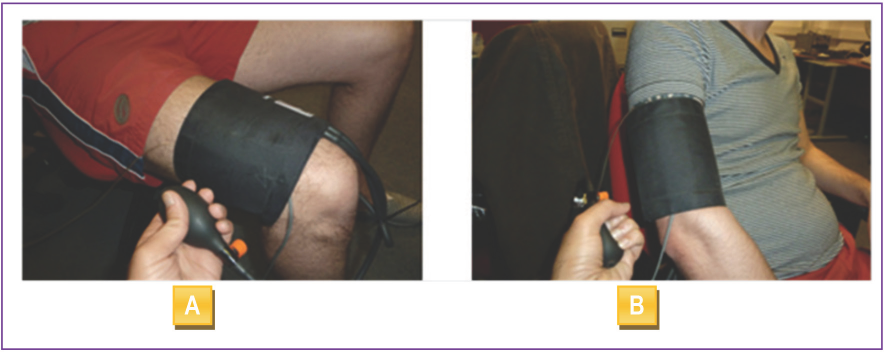
Blood pressure cuff to create the required clothing pressure on the skin. Heat Flow Direction: Skin → Pressure Sensor →TSF → Belt → Cuff → Environment
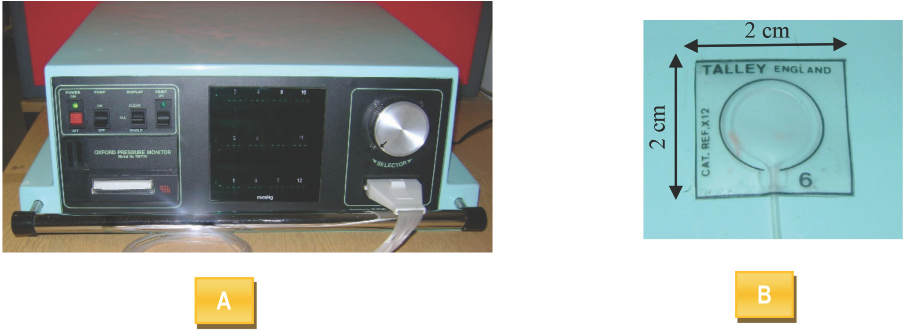
Pressure measuring system. A) Oxford Pressure Monitor (OPM MK II) and B) 2 × 2 cm inflatable pressure sensor.
First the pressure sensor was affixed to the specified body part. The TSF-attached-fabric-belt was then wrapped around the limb and kept in place with hook and loop fasteners. Ten the cuff was wrapped on top of the fabric belt. A pump (attached to the cuff by a tube) was used to inflate the cuff by blowing air into it (Fig. 6). The inflated cuff increased the TSF pressure on the skin.
Tests were performed at various pressure settings in the range of 0 kPa and 4 kPa. During each pressure setting, a pause was introduced to allow the temperature readings to become steady. When the temperature readings were stable, the pressure was increased. During pressure testing, the subject was relaxed and comfortably seated, but was aware of the increasing pressure and tightening at the experimental location.
Figs. 8 and 9 show the relationship between the skin temperatures registered by the TSF in response to its pressure on the skin on the thigh and arm, respectively. Pressure applied by the TSF on the skin improved the thermal contact and hence registered an increased TSF temperature. The number of temperature readings taken at set pressure values can be related to the time required to achieve thermal equilibrium. The time required to achieve thermal equilibrium at low pressure values was greater than at high pressure values. Another important observation was that the TSF temperature increased more rapidly up to a defined pressure range (2 Pa to 2.5 Pa). At higher pressure, very little temperature increase was observed. It was concluded that clothing pressure played an important role in the estimation of skin temperature.
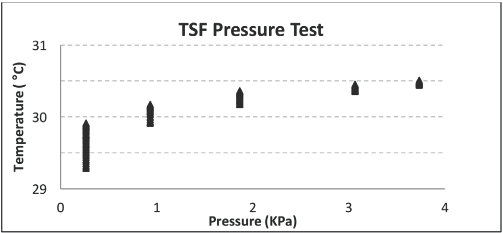
Effect of pressure on skin temperature measurement (measurement site: thigh).
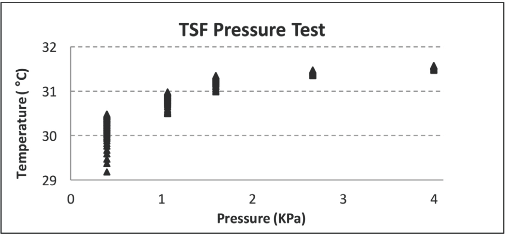
Effect of pressure on skin temperature measurement (measurement site: arm).
To measure the temperature of any surface, the thermal contact of a temperature sensor with the surface should be as good as possible. 44 Similarly, for skin temperature measurements, the TSF must have good thermal contact with the skin, which can be improved by applying adequate clothing pressure. However, clothing pressure is not a constant quantity, is different at different regions of the body, and also varies with respect to time due to body movement. The factors upon which clothing pressure depends are clothing design, fabric structure, fabric material, size and shape of the body, and body movements. Additionally, air movement can also affect clothing pressure considerably. 43
Considering the abovementioned factors, it may not be possible to have constant clothing pressure at specific body positions during different body movements. This implies that the quality of thermal contact between the TSF and the skin would not always be constant. Due to this irregular thermal contact, the temperature registered by the TSF in dynamic environment would also possess movement artifacts.
Thermal Conduction Error
As discussed earlier, the sensing element was inlaid exactly in the middle of a 3.5-mm thick TSF. This means that the sensing element will never be in contact with the skin, even if the TSF is completely affixed to the skin with some sort of adhesive. Depending on the overall thermal resistance between the sensing element and the skin, there will always be a temperature drop from the skin to the TSF sensing element, which can be termed as the thermal conduction error. This terminology can be related to the stem conduction error in the RTD and thermocouple probes. 45 This experiment will estimate the thermal conduction errors of the TSF and RTD in a steady state environment.
To rule out any artifacts generated by respiratory activity, the thigh area was selected as the measurement site. A constant pressure of ∼1 kPa was applied and maintained by the blood pressure cuff to rule out any variation in thermal contact between the TSF and the skin.
The experiment was performed in two phases. At first, the RTD was attached on the thigh region. The TSF-attached fabric-belt was then wrapped around the thigh and kept in place with hook and loop fasteners. Ten the cuff was wrapped on top of the fabric belt and inflated to maintain a constant pressure of 1 kPa. Both the RTD and the TSF were in full contact with the skin in this experimental setup. After achieving thermal equilibrium, the temperatures of both the TSF and the RTD were measured for a few minutes (first phase). After a while, the RTD position was changed. The newly-positioned RTD was now in between the TSF and the belt. In this second phase of the test, the RTD was not in contact with the skin while the TSF was in full contact with the skin. During testing, the subject was relaxed and comfortably seated.
Fig. 10 presents the temperature profiles of the TSF and the RTD in both phases of the experiment. In the first phase, the TSF showed a thermal conduction error of 1.3 °C in comparison to the RTD. The drop in the TSF temperature can be attributed to the thermal resistance between the TSF sensing element and the skin. After changing the position of the RTD sensor, in the second phase of the experiment, the RTD temperature dropped from 31 °C to 28.5 °C (with a conduction error of 2.5 °C). Considering the new position of the RTD, its temperature drop can be attributed to the overall thermal resistance of the TSF. It can also be seen in Fig. 10 that the new position of the RTD disturbed the thermal equilibrium between the TSF and the skin for a short time, as witnessed by a brief downward peak. Apart from that, the TSF temperature profile remained constant throughout the test with a conduction error of 1.3 °C. It was concluded that conduction errors were the results of thermal resistance between the skin and the sensing element of the temperature sensor. To closely approximate the skin temperature, the sensor should be in good contact with the skin as this will reduce the error margin.
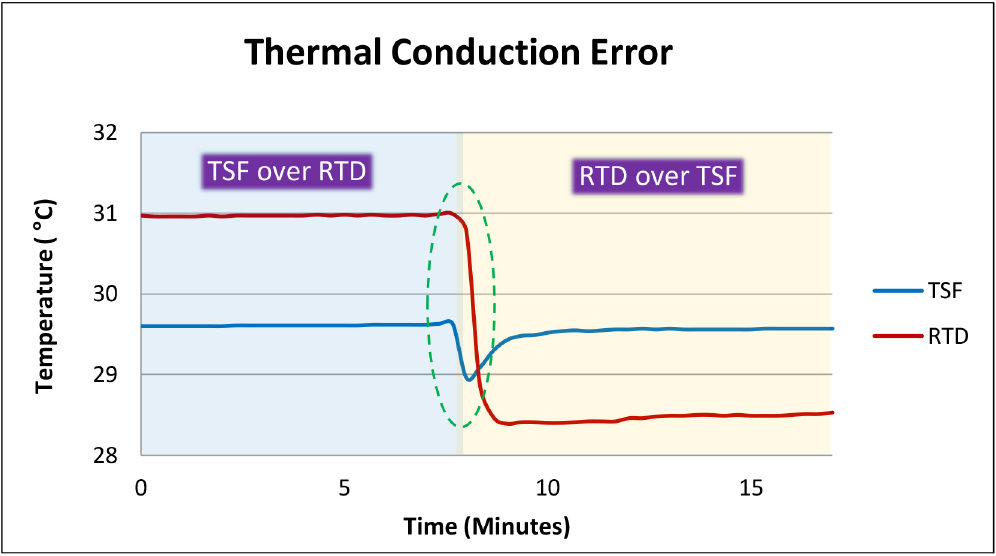
TSF performance in steady state at a constant clothing pressure of 1 kPa. Heat flow direction in both phases of the test. Phase 01: Skin → RTD → TSF → Belt → Cuff → Environment. Phase 02: Skin →TSF → RTD → Belt → Cuff → Environment.
TSF Performance in the Dynamic State
In the steady state test, no change in the external thermal environment of the TSF was made, and apart from the fabric TSF and belt, no extra layers of clothing were worn. The TSF performance in a dynamic state was determined by considering the effects of body movement, respiratory chest movement, and clothing layers under laboratory conditions (60% RH and 25 °C).
The lateral chest area beneath the arm was selected as a measurement site because it not only provided a broad surface to place the TSF, but was also less prone to respiratory movements in comparison with other possible sites on the torso. Fig. 11 shows the TSF placed on the lateral chest wall along the mid-axillary line, just below the armpit. Another advantage of this measurement site was that the external environment of the TSF area could be changed by forcing the arm to contact the lateral chest wall or be stretched out as shown in Fig. 12. The first RTD was attached at the measurement site, as described above. The TSF-attached fabric belt was worn around the chest and kept in place with hook and loop fasteners as shown in Fig. 12A.
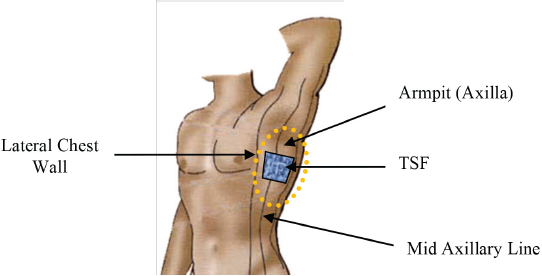
TSF placement on lateral chest wall of torso for skin temperature measurement.
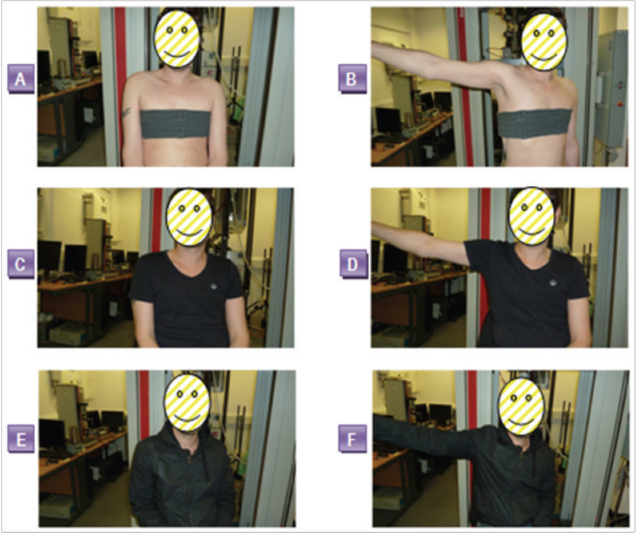
Subject arm movement during the test while wearing different layers of clothing.
Test 01 (Effect of Arm Movement)
In this test, the subject wore only a TSF-attached belt. The subject was stationary and sitting comfortably on the chair. However, the subject was allowed to move his arm, between the relaxed and extended positions as shown in Fig. 12A and B. The temperatures profiles from this test are shown in Fig. 13.
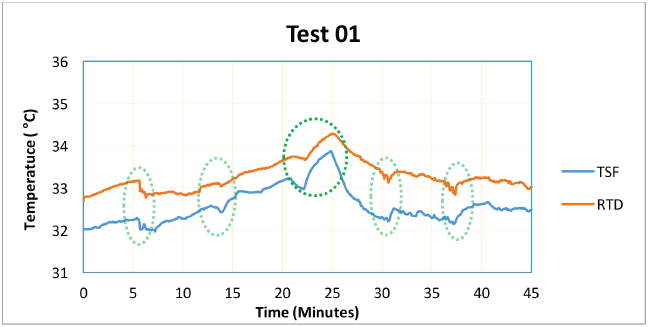
Comparison of TSF and RTD temperature profiles in a dynamic environment (Test 01). Heat Flow Direction: Skin → RTD → TSF → Belt → Environment, with arm movement
As discussed earlier, the TSF temperature was prone to thermal conduction error and environmental effects, and will register lower temperatures than the actual skin temperature. This can be further verified by examining the temperature profiles of the TSF and RTD in Fig. 13. How-ever, the most important observation to be noted here is that the reference and the TSF sensors both followed exactly the same trend and experienced the same quality of movement artifacts. Although the subject was seated on a chair, nonetheless, respiratory activity and arm movement affected the temperature profile. The major abnormalities in both temperature profiles, as highlighted by the dotted circles, were related to the arm movements. Sometimes the arm was in full contact with the lateral chest wall, sometimes in half contact, and sometimes in the outstretched position. Arm movement not only disturbed the thermal contact between the sensors and the skin, but also influenced the external thermal environment near the measurement site.
Test 02 (Effect of Clothing and Arm Movement)
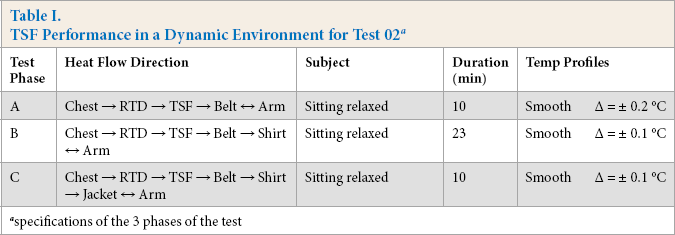
This experiment was performed to investigate the effect of clothing and arm position on TSF performance in comparison to the RTD. The temperatures profiles derived from this test are shown in Fig. 14, along with the indications of the three phases of the test.
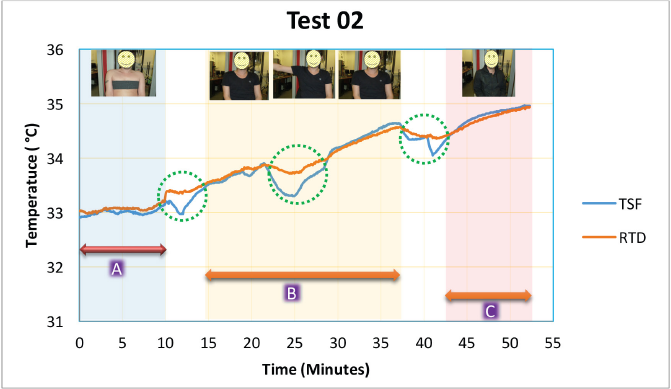
Comparison of TSF and RTD temperature profiles in a dynamic environment (Test 02).
As evident from the settings in Table I, the only difference between the phases of the test are the extra layers of clothing worn by the subject during the test. In phase B, the subject wore the T-shirt on top of the fabric belt, while in phase C, the subject wore a wind breaker jacket in addition to the fabric belt and T-shirt (Fig. 12).
According to Fig. 14, the difference between the TSF and RTD temperatures throughout the test were not as significant as in earlier experiments. This may be related to the position of the subject's arm, which, throughout the full length of the test, was rested straight in parallel to the lateral chest wall as shown in Fig 12A, C, and E. This arm position not only reduced the effects of environmental temperature on the temperature profile of the sensors, but also provided an additional heating and pressure source to help bring the temperature of the sensors closer to the skin temperature. The layers of clothing helped to reduce the difference between the TSF and RTD temperatures by reducing the effect of the environmental temperature and improving the isothermal conditions near the measurement site. With each added clothing layer, the thermal equilibrium point was increased slightly. An almost 2 °C increment in temperature was observed with additional clothing. However, it is important to note that the arm was pressed against the body all the time. For other body measuring sites, such as the front chest wall, the equilibrium point would be different.
Both temperature profiles experienced a few abnormalities as highlighted by the dotted green circles in Fig. 14. The explanations of these abnormalities are:
the subject wore the T-shirt from around the 11th minute of the test
between minutes 22 and 28, the subject stretched out his arm from its resting position for few minutes (see Fig. 12D) and then returned it to the normal position
the subject wore the jacket from around the 38th minute of the test
As a consequence of having to put on extra clothing, the subject's arm was displaced from its resting position. This reduced the thermal contact of the TSF and the skin and disturbed the thermal equilibrium in the proximity of the TSF resulting in the lowering of the registered temperature.
Test 03 (Effect of Clothing & Body Movement)
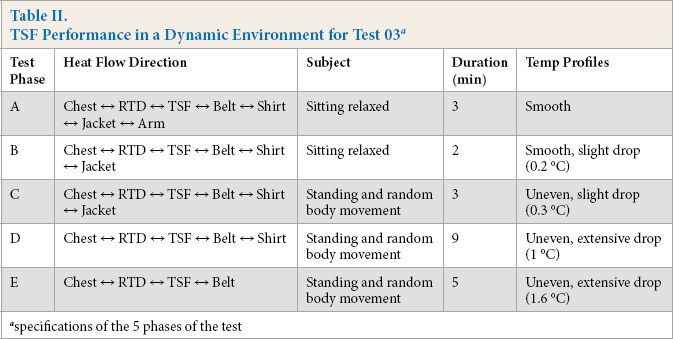
This experiment was performed to investigate the effect of clothing and body movement on the performance of the TSF in comparison with the RTD. The temperature profiles from this test are shown in Fig. 15 along with the marking of the five phases of the test. The five phases of the test are explained in Table II.
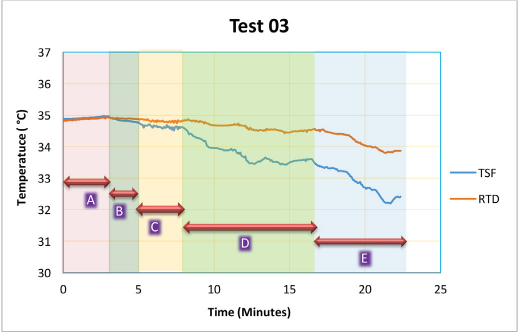
Comparison of TSF and RTD temperature profiles in a dynamic environment (Test 03).
It is evident from Fig. 15 that Phase A, in which the subject was wearing a shirt and jacket and was sitting relaxed with his arm pressed against the lateral chest wall, was the most stable phase among all phases of the experiment. As the subject started to remove the layers of clothing and started executing random movements, the temperature profiles of both sensors became irregular and fell in comparison with the temperature values at the start of the test. Fig. 16 presents some photographs of Phase C of Test 03 when the subject was making random body movements while standing.
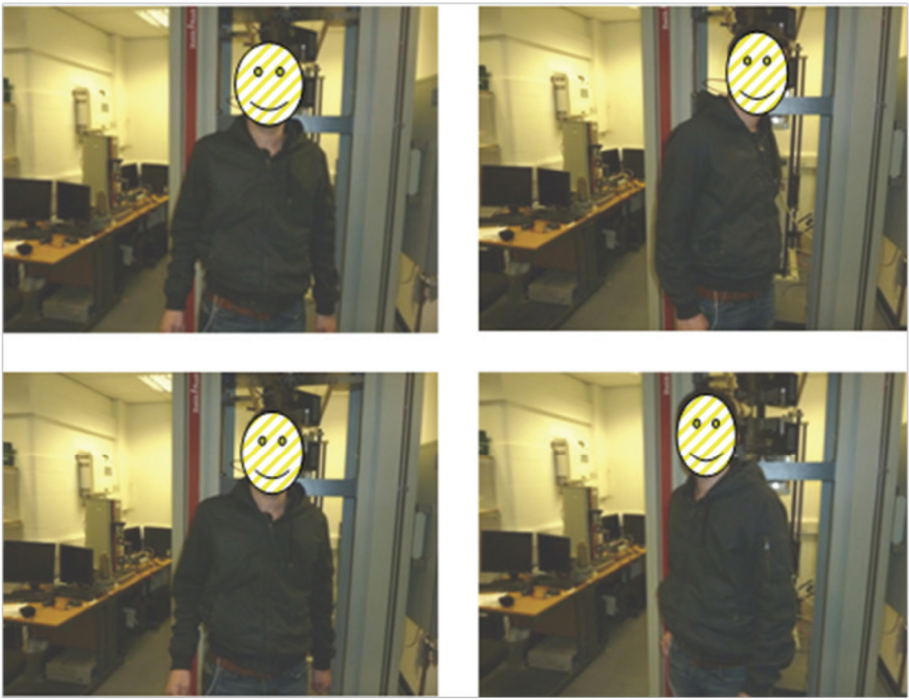
Images of phase C of Test 03 while the subject made random body movements.
Discussion
It is evident from all steady state and dynamic experiments that the choice of measurement site, subject movement, clothing layers, and the TSF pressure on skin and external environment affected not only the performance of the TSF but also the RTD. Even an RTD sensor of ± 0.001 °C accuracy would also experience the dynamics of the application environment while measuring the skin temperature. However, it was encouraging that, in each of the tests, apart from conduction error, the TSF and reference sensors followed the same trend in general.
Under standard conditions, the temperature registered by the TSF would always be less than the skin temperature because of:
thermal contact error depending on the thermal contact resistance between the TSF and skin
thermal conduction error depending on the thermal resistance between the skin and the sensing element (at half of the thickness of the TSF) and the temperature of the outer side of the TSF
Once the values of these errors were known, they can be added into the TSF temperature to estimate the human body skin temperature. Fig. 17 demonstrates the general scenario of temperature drop between core body temperature and environment as highlighted by the yellow line. The temperature registered by the sensing element of the TSF depended upon environment temperature, thermal contact error, and thermal conduction error. Thermal contact error can be reduced by making a firm contact between the TSF and the skin. Thermal conduction error may be reduced by bringing the sensing element of the TSF closer to the skin (possibly by producing a thin TSF). Environmental effects can be reduced by using extra layers of clothing.
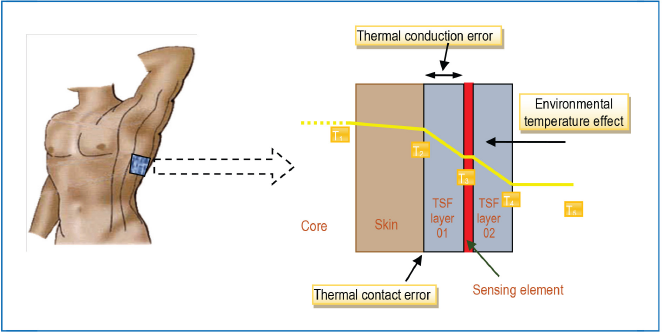
Error scenario while estimating human body skin temperature.
Parsons has discussed that human body skin temperature is affected by the dynamic interaction of the parameters of human thermal environment (HTE, i.e., air temperature, radiant temperature, air velocity, air humidity, layers of clothing, body movement, and metabolic heat generation). 46 Tat means the TSF (or any other temperature sensor) deployed to measure skin temperature would also be affected by the above mentioned parameters. In addition, the values of the TSF thermal contact and thermal conduction errors would also be changed and may no longer be valid for estimating skin temperature. It was not possible to assess TSF performance by varying all HTE factors as it was beyond the scope of this study. Another study is likely required to fully assess TSF performance in a practical environment by varying the HTE factors.
This problem of contact error is not only limited to the TSF; as any textile based sensor used to measured human body vital signs, such as ECG and respiration, would also experience movement artifacts in practical applications. These movement artifacts are sometimes even stronger than the weak signal of the vital sign under observation. This is prob-ably the main factor that limits the broad applications of textile based health monitoring systems. 47
Core body temperature can be estimated by measuring skin temperature and heat loss from the body and using an appropriate algorithm based on various thermal environments.
Conclusion
This article provided information on the behavior of a newly-developed temperature sensing fabric (TSF) by comparing it with the resistance temperature detector (RTD) during monitoring of skin temperature over extended periods. It is evident from these steady state and dynamic experiments that subject movement, choice of measurement site, clothing pressure on skin, number and types of clothing layers, and external environment affected not only the performance of the TSF but also the RTD.
Clothing pressure plays an important role in the estimation of skin temperature as it improved the thermal contact and hence registered an increased temperature closer to the actual skin temperature. The TSF temperature was found to increase more rapidly up to a pressure range of 2 kPa to 2.5 kPa. At a constant clothing pressure of 1 kPa, the TSF showed a thermal conduction error of 1.3 °C that could be attributed to the environmental temperature and overall thermal resistance between the TSF sensing element and the skin. The extra layer of clothing helped in creating the isothermal environment in proximity of the TSF and RTD, which resulted in the reduction of the temperature difference between the TSF and RTD to 0.2 °C. The quality of the TSF thermal contact with the skin was found to be the most important parameter with respect to skin temperature estimation. The random body movement of the subject heavily affected the TSF and RTD thermal contact with the skin, resulting in the registration of noticeably lower temperatures. Apart from potential use in general healthcare applications, the TSF could also be used in studies related to bio-rhythms and assessment of thermal strain in extreme environments.
Further studies, including repeated testing on the same subject under various conditions, and testing performed on several subjects should be undertaken in the future.
Footnotes
Acknowledgements
The authors would like to acknowledge the funding provided by the NED University of Engineering and Technology Pakistan, through the Higher Education Commission of Pakistan, to carry out this study at the School of Materials, University of Manchester, UK.