
Abstract
Dyed fibers are commonly obtained as trace evidence at crime scenes. Time-of-flight mass spectrometry (TOF MS) has potential to substantially advance forensic dyed fiber analysis by providing “exact mass” data of dyes and other chemicals present in dyed fibers. Data from two approaches to using TOF MS for accurately identifying the molecular formula of dyes are reported. One involves extraction of dye from 100 üg or less of fiber followed by high performance liquid chromatography (HPLC-TOF MS) analysis. The other is time-of-flight secondary ion mass spectrometric (TOF SIMS) analysis of the surface and cross sections of dyed fibers without extraction. Both approaches can clearly identify commercially important dyes applied to polyester fibers.
Introduction
Dyed fibers are ubiquitous in all societies due to their use in clothing, carpets and rugs, and home furnishings. It is common for fibers to be transferred in the course of any movement between locations by humans or other animals. Consequently, forensic trace evidence analysis often includes fibers found at a crime scene and the need to determine if they may be associated with fibers found on a suspect or witness. 1
A major goal of the work presented here is to advance forensic trace evidence analysis methods by unambiguous identification of dyes in or on the surface of fibers via time-of-flight mass spectrometric (TOF MS) techniques. Today, fibers are analyzed in the crime laboratory using polarized light microscopy (PLM), Ultraviolet-Visible (UV-Vis) microspectrophotometry (MSP), and infrared methods. Due to their sensitivity and high resolution, high performance liquid chromatography-quadrupole time-of-flight mass spectrometers (HPLC-TOF MS) and time-of-flight secondary ion mass spectrometers (TOF SIMS) are ideal instruments for dyed fiber analysis. The exact mass of each dye component is obtained from analysis by HPLC-TOF MS. Tese data are being used to create a robust mass spectral database to assist in forensic analysis of dyed fibers. However, analysis by HPLC-TOF MS requires the destruction of fiber evidence by extracting dye from the fiber. TOF SIMS may use the database and identify dyes present in a fiber without the need for extraction. In TOF SIMS, a high energy ion beam source is focused on a submicron area of a fiber surface, causing desorption of secondary molecular ions that are extracted into a mass spectrometer. 2 The ion beam is progressively moved across a two-dimensional 100 × 100 μm area to produce a surface image based on a mass of interest. 2 While this paper focuses on some of our results with disperse and acid dyes, we have also used TOF SIMS to identify direct dyes on cotton fibers.
HPLC-TOF MS and TOF SIMS are accurate and reproduc-ible methods. Petrick and coworkers used HPLC-mass spectrometry (HPLC-MS) to differentiate among three basic dyes, where two of the dyes had similar UV-Vis data. 3 Huang and colleagues have analyzed dyes from several classes, such as disperse, acid, and direct dyes, using HPLC-MS for dye identification. 4 TOF SIMS has been successful in differenti-ating among various gunpowder types, as well as ball point pen inks.5,6 Lee et al. have identified indigo and berberine by TOF SIMS analysis of buried archeological textile samples. 7 The major focus of this work is the generation of TOF exact mass spectral data by two different methods, HPLC-TOF (which involves extraction of the dyes) and TOF SIMS (which involves only dyes on the fiber surface).
Experimental
Materials
Fabrics used in this work were a scoured 100% polyester knit (Guilford Inc.) and a 100% spun nylon 6.6 (Testfabrics #361). Water for HPLC-TOF MS analysis was 18 MΩ from a Siemens Elga Purelab Ultra purification system. HPLC grade acetonitrile and methanol were from Burdick and Jackson. Formic acid and ammonium acetate (99.9%) were from Sigma Aldrich. Acetic acid was from Termo Fisher. Commercial dye samples were obtained from various manu-facturers and were used without purification.
Apparatus
Standard dyeing procedures 8 were used to dye fabrics in either a Datacolor Ahiba Nuance Top Speed II dyeing machine or a Roaches Pyrotec dyeing machine. A Pierce Reacti-Term Heating Module with an aluminum block was used for dye extraction in Termo Scientific (# 13220) Reacti-Vials. 8
Instruments
An Agilent 1200 LC SL with diode array detection (DAD) and 6520 Q-TOF MS with an electrospray interface were used for HPLC-TOF MS analysis. For disperse dyes, the mass spectrometer was operated in positive-ion mode, and in negative-ion mode for acid dyes with a capillary voltage of 4 k V, fragmentor voltage of 110 V, nebulizer pressure of 35 psig, and a drying gas flow rate of 12 L/min at 350 °C.
A TOF SIMS V (ION TOF Inc.) instrument equipped with a Bi n m+ (n = 1 to 5, m = 1 or 2) liquid metal ion gun were used for TOF SIMS analyses. For the mass spectral images acquired in this study, a 256 × 256 pixel image of a 100 × 100 μm area was acquired using a Bi3+ primary ion beam. An electron gun was used to prevent charge buildup on the insulating sample surfaces. The total accumulated primary ion dose for an image acquisition was less than 1 × 10¹³ ions/cm2, an amount of ions that is within the static SIMS regime. C60+ sputter cleaning and damage removal and Bi3+ data acquisition were used to allow signal averaging to improve the signal-to-noise ratio. The analysis protocol consisted of sputtering the dyed nylon surface for 14.6 s with a 1 nA C60+ ion beam, followed by spectrum acquisition with Bi3+ at 1 shot/pixel for 20 frames. The C60+ sputtered area and Bi3+ analysis areas were 300 × 300 μm and 100 × 100 μm, respectively. This sputtering/acquisition sequence was then repeated until a useful signal-to noise ratio (S/N) was achieved or until the sample was consumed.
Methods
Extractions were performed on small (100–200 μg) samples of yarns pulled from the dyed fabrics. PET fibers were placed in a Reacti-Vial, 1,2-dichlorobenzene was added (typically 200 μL), followed by heating for 30 min at 120 °C. The solvent was then blown of from the vial with nitrogen, followed by dissolution in initial HPLC mobile phase (acetonitrile:water, 48:52), (200 μL). The solutions were filtered through Millex-GV 13 mm, 0.22 μm PVDF filters (Termo Fisher). Dry, disperse dye powders were dissolved in the initial mobile phase, mixed for 10 sec at 3000 rpm in a VWR vortex mixer, filtered, and diluted to give 5 ppm solutions for HPLC-MS analysis. Acid dye powders were dissolved in water, filtered, and diluted to 30 ppm prior to analysis. Each dye sample was spiked with 10 ppm uracil as an indicator of a completely unretained analyte.
For disperse dyes, a Poroshell 120 EC C18, (3.0 × 100 mm, 2.7 μm) column at 45 °C was used. For acid dyes, a Zor-bax Eclipse Plus C18 (2.1 × 50 mm, 3.5 μm) column with a Zorbax Eclipse Plus C18 narrow-bore guard column (2.1 × 12.5 μm, 5 μm) was used.
Mobile phases were water (A) and acetonitrile (B) (with 0.1% formic acid added to both for positive ion MS) for disperse dyes and 20 mM ammonium formate adjusted to pH 4 with formic acid (A) and 70:30 methanol:acetonitrile (B) for acid dyes. Gradients for the two methods are shown in Tables I and II.
Disperse Dye Gradient at 0.5 mL/min
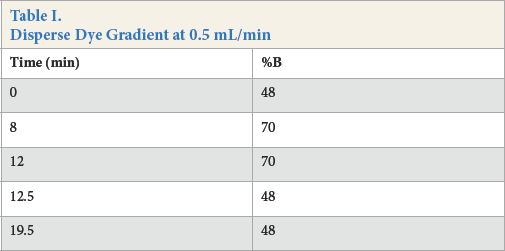
Acid Dye Gradient at 0.25 mL/min
A hydraulic press was used to compress dye powder and swatches of dyed nylon fabrics to achieve relatively fat surfaces for efficient secondary ion extraction and improved mass resolution. Cross sections of dyed fibers, with a thickness of ∼500 nm to 700 nm, were prepared by cryo-microtomy. Fibers were embedded in Eponate 12-Aaraldite 502 (Ted Pella) in silicone molds. Embedded samples were then cured over 12 h at 45 °C, 24 h at 60 °C, and then for 8 h at 70 °C, followed by an oven cool down. Cross sections were then cut on a Leica UC7 (Leica Microsystems) with a cryo-attachment at a temperature of –40 °C using a 45° cryo-diamond knife. The cryo-temperatures were necessary to avoid the smearing of both the fiber surface and the embedding medium, preventing distortion or contamination of the fibers.
Results and Discussion
Analysis of extracted dyes by HPLC-MS with a quadrupole detector is relatively common.3,4,9 In a previous paper, we reported initial studies on acid and disperse dyes by HPLC with inline DAD and TOF MS analysis. 8
Since the inception of this work, we have analyzed disperse (25), acid (50), solvent (3), direct (55), and reactive (5) dyes to begin populating a finished fiber dye database. In this report, we will focus only on some of the more recent data10,11 from the studies on acid and disperse dyes.
HPLC-TOF MS Analysis of Acid Dyes
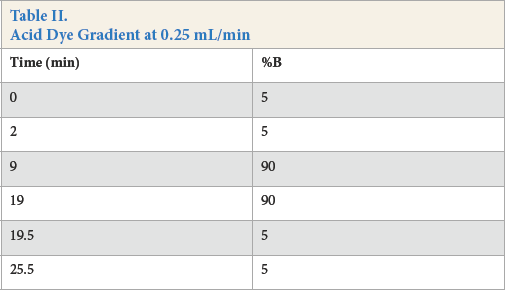
Retention and separation of anionic acid dyes on a reverse phase HPLC column is more difficult than separation of neutral disperse dyes because the charged dye is not attracted to the non-polar octadecylsilyl stationary phase. To overcome this limitation, buffers and ion pairing agents can be used. In this work, adequate separation was provided by using a pH 4 formic acid/ammonium formate buffer. Fig. 1 shows mass spectra extracted from the total ion chromato-gram of three separate dyes, C.I. Acid Blue 113, C.I. Acid Blue 25, and C.I. Acid Green 16.
Mass spectra of (a) Acid Blue 113, (b) Acid Blue 25, and (c) Acid Green 16.
In the dye database under development, dye identification was accomplished by using retention time (indexed to the unretained uracil), visible spectrum, and exact mass.
HPLC-TOF MS Analysis of Disperse Dyes
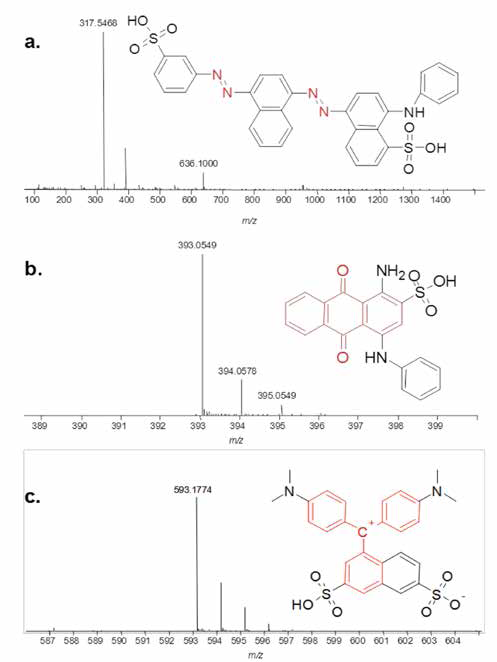
Fig. 2 shows an example chromatogram (a) showing three peaks absorbing in the blue region and a representative mass spectrum (b) from the peak at 7.53 min for a C.I. Disperse Blue 60 sample, included because it is the only test disperse dye comprised of three dyes.
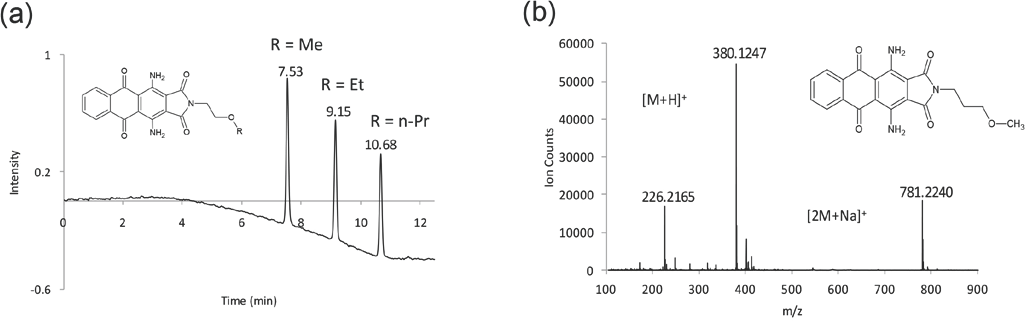
HPLC (DAD) chromatogram of (a) three components of Disperse Blue 60 at 660 nm, and (b) mass spectrum of one component of Disperse Blue 60 in one sample (7.53 min).
As can be seen from Table III, Disperse Blue 60 existed in several different compositions. Peak areas are calculated from HPLC (DAD) chromatograms (absorbances). The far right column indicates the manufacturer. The dyes from each manufacturer are grouped by rows of the same color. Four different structures, indicated by retention times in blue columns, existed, all of which were uniquely identified by MS at m/z = 380, 394, 408, and 424. The composition also varied for samples from the same manufacturer. The variability in these samples was real and probably a function of the manufacturing process. As a result, the initial goal of assigning a dye from a forensic sample to a specific manufacturer may not always be possible. Note that the sample from Manufacturer 5 contained three components (Fig. 2).
Composition of Disperse Blue 60 Samples from Six Manufacturers a
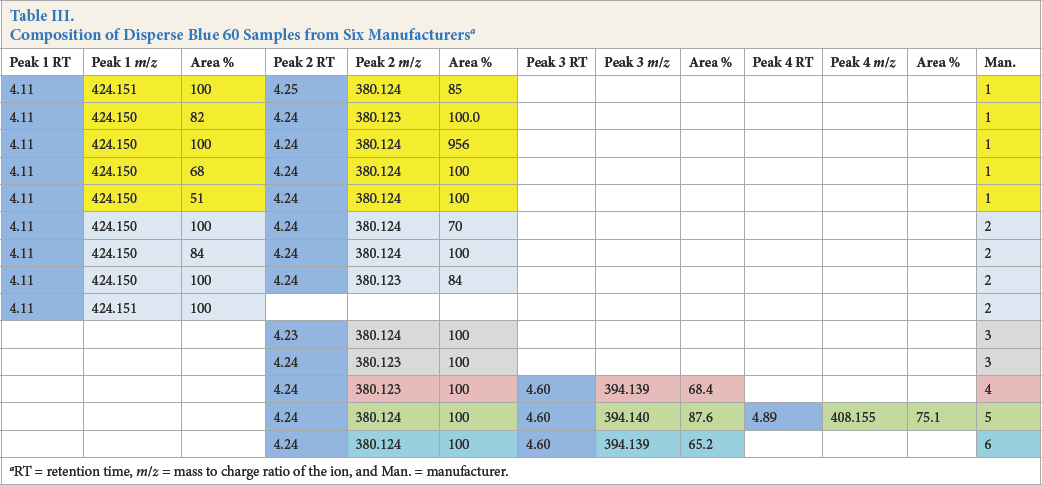
RT = retention time, m/z = mass to charge ratio of the ion, and Man. = manufacturer.
To illustrate the utility of HPLC-TOF MS in the identification of disperse dyes extracted from automotive fabrics, a few fibers from a sample of black fabric from a 2011 Ford Fusion 12 were extracted.
From the TOF MS data, three of the HPLC (DAD) peaks in Fig. 3a can be assigned to Disperse Blue 60 (7.69 min), Disperse Blue 73 (8.99 min), and Disperse Blue 77 (10.25 min). The chromatogram extracted at 540 nm (see Fig. 3) is more complicated because several of the dyes in the extract absorbed at this wavelength. The peak at 7.70 min eluted at the same time as Disperse Blue 60, but was actually Disperse Red 86 as shown by the extracted ion chromatogram (EIC) and exact mass (m/z = 423.103). An EIC for m/z = 380.124 gave a peak for Disperse Blue 60. In this case, the retention times alone were inadequate for identification, but both the DAD visible spectra (red and blue) and exact masses would conclusively discriminate between these two possibilities. The peak at 8.40 min was the major yellow dye as shown by a single peak in the 410 nm extracted chromatogram. This dye gave m/z = 378.1199, which corresponded to a molecular formula of C19H15N5O4.

Chromatogram of dyes extracted from a 2011 Ford Fusion fabric at (a) 660 nm, and (b) 540 nm.
TOF SIMS Analysis of Acid Dyes
The molecular ion of C.I. Acid Blue 25 was easily detected by TOF SIMS from 1% owf dyed nylon 6.6 cross sections (Fig. 4a). However, it was hardly detectable from the 1% owf dyed nylon surface (Fig. 4b). The low S/N value might be due to surface contamination on the dyed nylon surface.
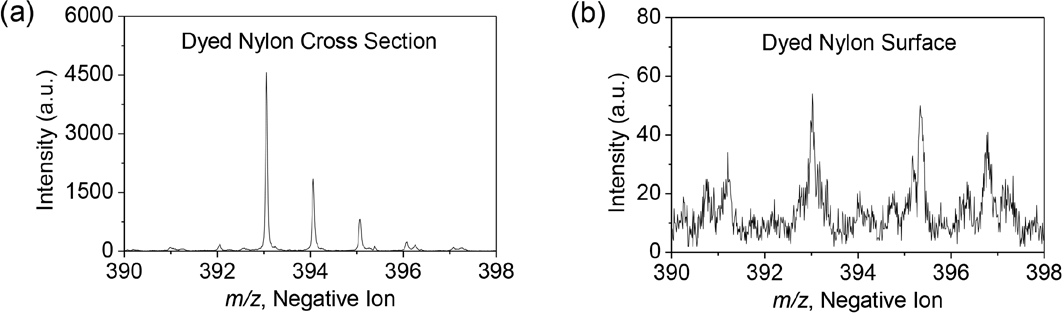
Negative ion TOF SIMS spectra showing the molecular ion of Acid Blue 25 obtained from (a) 1% on-weight-of-fabric (owf) dyed nylon cross section, and (b) 1% owf dyed nylon surface.
To improve the S/N value, we developed an analytical pro-tocol adapted to the removal of both surface contamination and at least partial Bi ion beam induced damaged material. 13 The C60+ sputtering beam and the Bi3+ analysis ion beams were used alternatively and in a cyclic manner to remove damage and to acquire data. Fig. 5 shows the negative ion TOF SIMS spectra acquired from the dyed nylon surface (a) with only Bi3+ ion beam data acquisition, and (b) with C60+ion beam sputtering followed by spectrum acquisition with Bi3+ in a cyclic manner. The results clearly show the signifi-cant S/N improvement with cyclic C60+ sputtering.
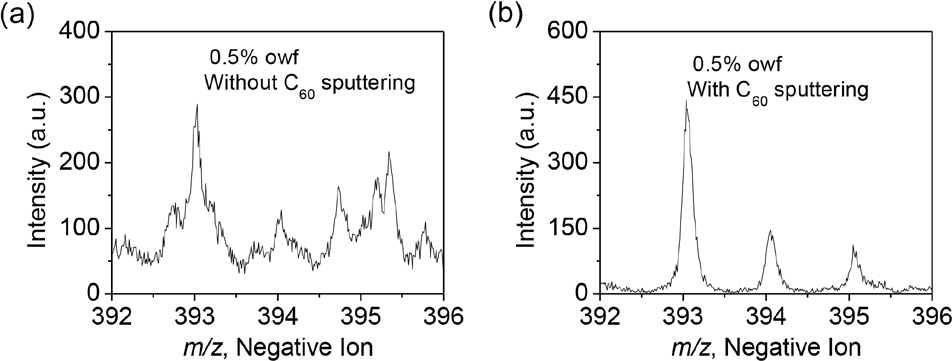
Negative ion TOF SIMS spectra showing the molecular ion of Acid Blue 25 obtained from 0.5% owf dyed nylon surface (a) without C60+ sputtering, and (b) with cyclic C60+ sputtering.
TOF SIMS of Disperse Dyes
Both the surface and cryo-microtomed fiber cross sections dyed with Disperse Blue 60 were analyzed by TOF SIMS directly without extraction. Disperse Blue 60 molecular ions were all observed for 7% to 0.1% owf dyed polyester (PET) fabrics surfaces (Fig. 6).
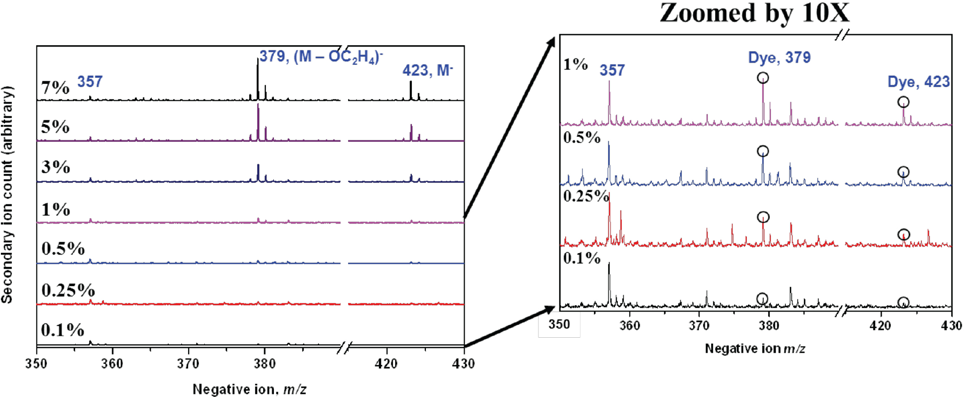
TOF SIMS spectra of Disperse Blue 60 dyed PET fabric surfaces with varied dyes (owf) showing the molecular ions at m/z = 379 and 423.
The molecular ions at m/z = 379 and at m/z = 423 for the two components in Disperse Blue 60 were selected to test quantification of this dye in PET. All spectra were first normalized to an internal reference at m/z = 357, a molecular fragment ion attributed to the PET polymer, to allow direct comparison of the mass spectra. The normalized molecular ion intensity of Disperse Blue 60 on fabric surfaces versus various dye concentrations (owf) is shown in Fig. 7a. Note that the molecular peaks at m/z = 379 and m/z = 423 gave a nearly linear relationship with dye concentration. It should be noted that the detection limit of TOF SIMS is highly dependent on the materials analyzed, especially for organic species. Since the ion yield varies for different elemental and molecular species, the response may not always be linear.
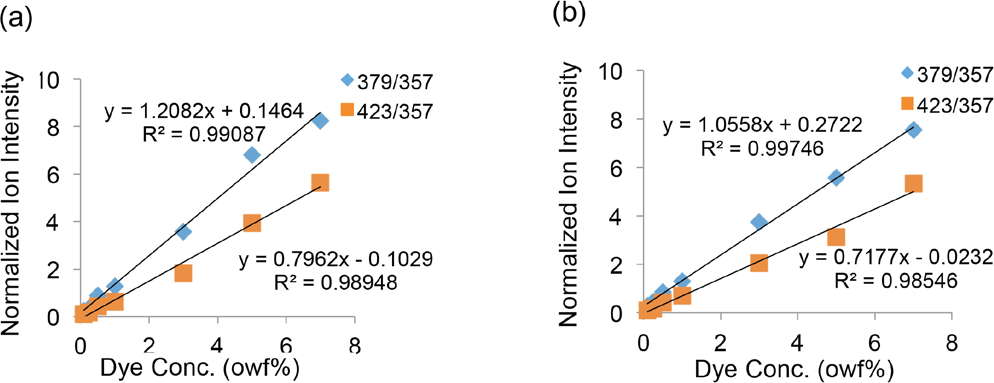
Normalized Disperse Blue 60 molecular ion intensities at m/z = 379 and m/z = 423 dye components from fabric surfaces versus dye loading. (a) the first set of Disperse Blue 60 dyed fabrics analyzed. (b) the second set of Disperse Blue 60 dyed fabrics analyzed.
The above experiment was repeated on a second set of Disperse Blue 60 dyed PET fabrics and the results obtained from the various dye concentration shown in Fig. 7b were consistent with the first set of dyed fabrics.
Resin, PET fiber, and Disperse Blue 60 in the cross section were unambiguously differentiated by TOF SIMS using their characteristic ions. Fig. 8 shows the chemical mapping of resin, fiber, and dye in the left column. Tese TOF SIMS images are color encoded and then overlaid, which are shown in the column on the right. The overlaid image shows the relative distributions of resin (red) and PET fiber (green) over the cross section analyzed, which provided clear delineation of the PET fibers. Secondary ions attributed to the Disperse Blue 60 dye (blue encoded) clearly coincided with the position of the fibers.
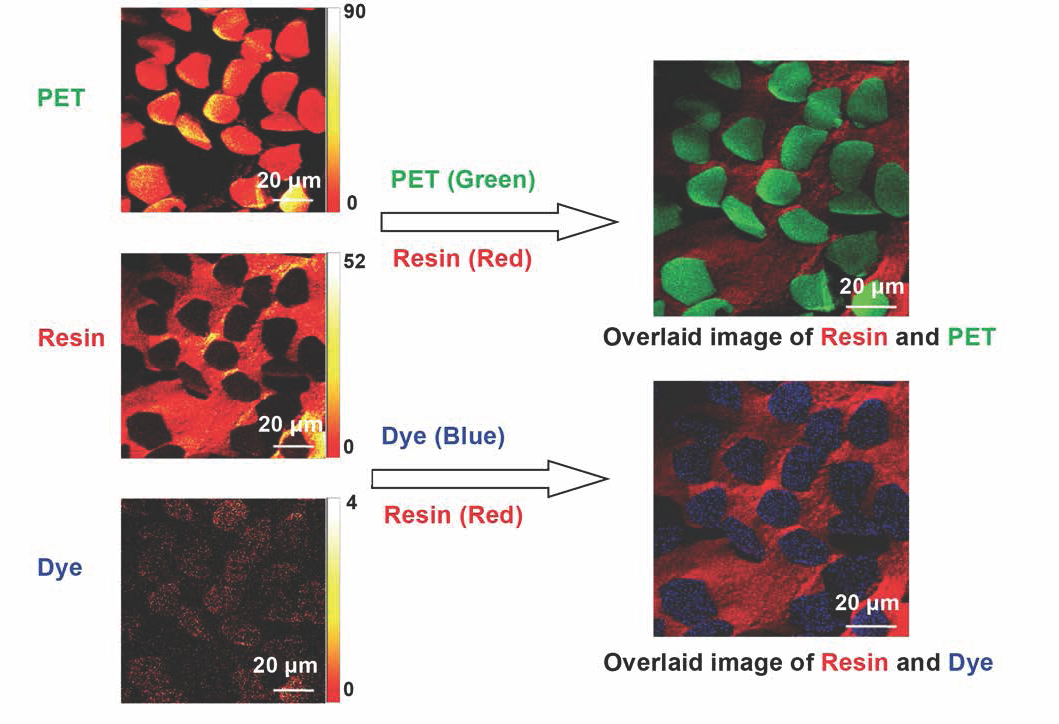
TOF SIMS secondary ion images of resin (red), PET (green) and Disperse Blue 60 dye (blue) are color encoded and overlaid to produce the images in the right column. The signal from Disperse Blue 60 clearly overlays with the PET.
Fig. 9 shows TOF SIMS images for Disperse Blue 60 molecular ion with varied dye concentration. Significant Disperse Blue 60 molecular ion intensity was observed for the fibers down to 0.5% owf dyed PET cross sections (Fig. 7). However, for the 0.1% owf dye PET cross section, the dye signal was difficult to distinguish from the background, similar to that found in the undyed control sample. The data suggest that the TOF SIMS detection limit for the cross-sectioned Disperse Blue 60 PET was as low as 0.5% owf.
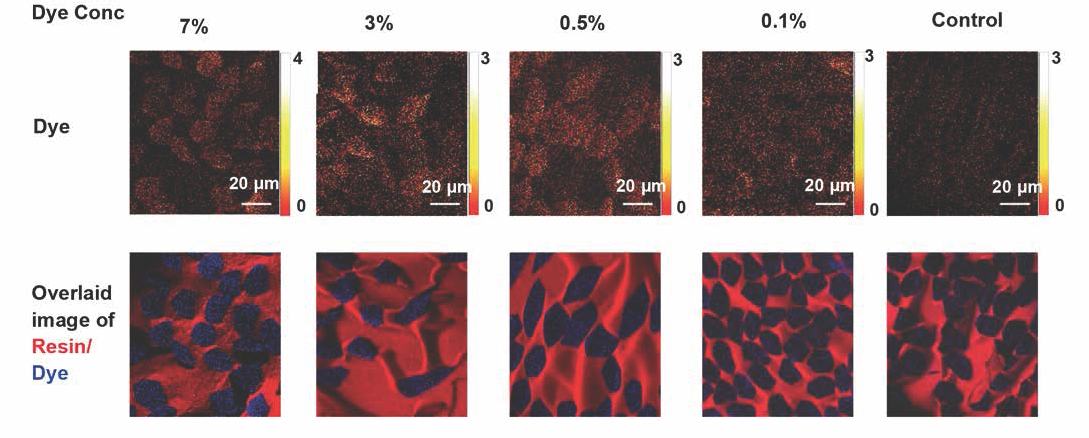
The top row contains TOF SIMS images of the m/z = 379 (molecular ion) of Disperse Blue 60 for the dye concentration given. The lower row of images has the dye (encoded in blue) overlaid onto the TOF SIMS secondary ion image of the embedding resin.
Conclusions
Time-of-flight mass spectrometry (TOF MS) was shown to unambiguously identify disperse and acid dyes in fibers when the spectra of the dyes were already known. Extraction of minute amounts of dye from small, dyed fiber samples, followed by HPLC-TOF MS analysis, was ideal for development of a standard dye database. TOF SIMS results were shown to be ideal, when compared with a database containing matching, known dyes, for dye analysis in or on fibers without extraction. Sputtering to clean the fiber surface increased the sensitivity of detecting dyes in fibers. TOF SIMS was capable of detecting dye in cross sections at concentrations as low as 0.5% owf.
Footnotes
Acknowledgements
The advice and support of Nelson Houser of M. Dohmen is gratefully acknowledged. This work was supported by NIJ grant number 2009-DN-BX-K216 and NSF grant number IIS-0941421. NIJ is the research, development, and evaluation agency of the US Department of Justice and is dedicated to researching crime control and justice issues.