
Abstract
The enzymatic hydrolysis of cellulose by cellulase is one of the major steps in the processing of cellulosic fiber based textiles. The influence of dyes on cellulase performance for cellulosic fabrics has not been conclusively studied. However, cellulase inhibition by sulfur dyes in fiber was observed to some extent. In this paper, undyed and C.I. Sulfur Black 1 dyed cotton fabrics were both treated with acid cellulase L4. The hairiness removal percentage, protein adsorption on the fabric, and glucose content in the treatment bath were monitored to explore the interaction between cellulase and sulfur dyed fabric. It was concluded that dyed fabric had higher protein adsorption, and lower hairiness removal percentage and glucose content, than that of the undyed fabric.
Introduction
Cellulases are the most common enzymes used in textile wet processing for improving textile hand and appearance in an environmentally friendly way. Enzymatic hydrolysis of cellulose using cellulase is complex. It depends on the synergy between two types of cellulases: endo-1,4-β-D-glucanases (EG) that hydrolyze cellulose chains randomly and exo-1,4-β-D-glucanase (CHB) that hydrolyze cellulose from the ends of the cellulose chain. The hydrolysis products of these two kinds of cellulases are both cellobiose and glucose, the latter converted from cellobiose by β-glucosidases.1,2
In traditional processes, cellulase is used in fabric pretreatment. Extensive studies of cellulase hydrolysis kinetics were made using undyed fibers.3–5 The cellulase and dye interaction mechanism was studied by many researchers—dyes in the fiber exhibited varying effects on cellulase activity. Buschle-Diller's work showed that direct dyed fabric underwent equal or slightly greater cellulase hydrolysis than undyed fabric. 6 Eun's study suggested that direct, reactive, vat, and indigo dyes all inhibited cellulase reaction. 7 Paulo found that vat and sulfur dyes had a small effect on cellulase function, and that reactive dyes inhibited cellulase hydrolysis. 8 Our previous study found that sulfur dyes in the fibers gave significant cellulase inhibition. 9 The aim of this paper is to explore the mechanism of interaction between cellulase and sulfur dyed cotton fabric and determine its kinetics parameters.
Materials and Methods
Materials
Scoured 100% cotton knitting fabric (160 g/m2) was supplied by No.2 Knitting Mill. Colour Index (C.I.) Sulfur Black 1 (180%) was obtained from Tianjin Mastone Chemicals Co. Ltd. Other chemicals were purchased as chemical grade reagents from Model Chemicals. Acid cellulase L4 was provided by Shijiazhuang Mulsar Biochemicals.
Methods and Instrumentation
Dyeing was carried out in a rotary dyeing machine (Shanghai Realcolor Dyeing Tech. Co. Ltd.), and cellulase treatments were carried out in a water bath oscillator (Jintan Ronghua Instrument Manufacture Co. Ltd.).
Cellulase Activity Determination
Cellulase activity was determined by the filter paper assay (FPA) method, EG activity was calculated as the difference between total cellulase activity (FPAtot) and ExG activity (FPAsol). 10 Activity on carboxymethyl cellulose (CMC) was determined as described by Ghose. 11 β-glucosidase activity was determined using cellobiose as the substrate. 12
Dyeing Procedure
Cotton fabrics (10 g/piece) were introduced into dye baths containing 0.8 g/L Sulfur Black, 1.2 g/L sodium sulfate, and 1.2 g/L sodium sulfide. The dyeing started at 20 °C and a liquor to goods ratio (LR) of 20:1. The dye bath was raised to 90 °C over 20 min and maintained at this temperature for 60 min. The fabric was then rinsed in cold water and oxidized with 5 mL/L hydrogen peroxide (30%) and 5 mL/L acetic acid for 15 min at ambient temperature. The fabric was then soaped in 1 g/L non-ionic detergent and 5 g/L sodium carbonate solution for 15 min at 98 °C, rinsed in water, and dried at room temperature (RT).
Cellulase Treatment
Fabric samples were immersed in aqueous solutions containing acid cellulase (0.8–1.2 g/L) and buffered at pH 5 using acetic acid and sodium acetate. The bath bottles were set in an oscillator for various times (0–180 min) and temperatures (40–60 °C).
Hairiness Removal Percentages
A microscope camera was used to take photos of the fabric folded edge. The percentage of the pile was counted and removal percentage η was calculated using Eq. 1.
Y1 is the pile percentage after cellulase treatment and Y0 the pile percentage before cellulase treatment.
Reducing Sugar and Proteins Adsorption Determination
The quantity of reducing sugars in the cellulase treatment residual bath was determined according to the 3,5-dinitro-salicylic acid (DNS) method of Miller (1959) using glucose as a standard. 13 UV quantifies the amount of proteins absorbed into the fabric during the cellulase treatment process by the method of Bradford (1976) using bovine serum albumin as standard. 14
Weight Loss Percentage
Weight loss percentage (∆W) during cellulase treatment was calculated according to Eq. 2. 15
Wb is the fabric weight before treatment and Wa is the fabric weight after treatment.
Results and Discussion
Cellulase Activity versus Temperature
Cellulase activity was determined by measuring the glucose by the FPA method. The results were recorded in Table I. Cel-lulase activity increased when the temperature was increased from 40 °C to 60 °C. Most cellulase working temperatures are located in this range.
Cellulase Activity a at Various Temperatures
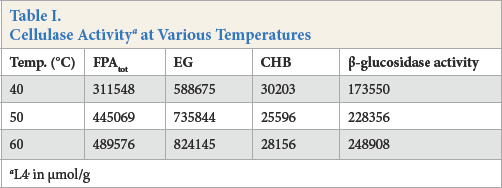
L4, in μmol/g
Cellulase Adsorption on the Fabric
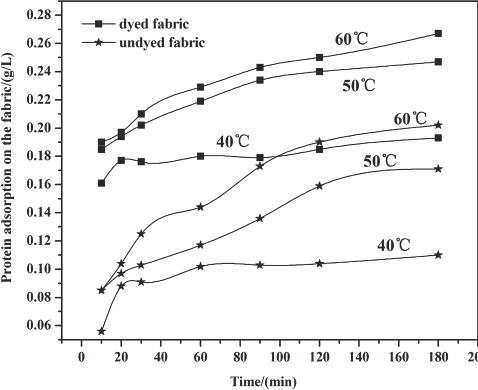
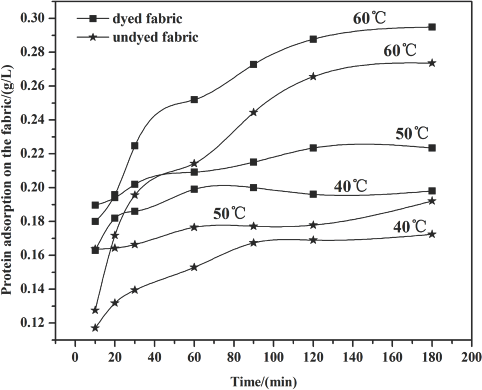
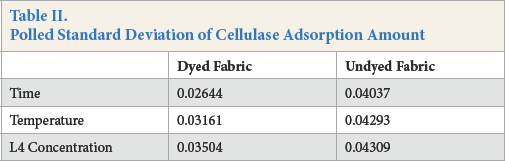
The amount of cellulase absorbed by the fabric was determined by protein detection during the cellulase treatment process using bovine serum albumin (BSA) as a standard. The results are given in Figs. 1–3 and Table II. The polled standard deviations of the cellulase adsorption are given.
Cellulase adsorption on the fabric at 0.8 g/L enzyme concentration.
Cellulase adsorption on the fabric at 1.0 g/L enzyme concentration.
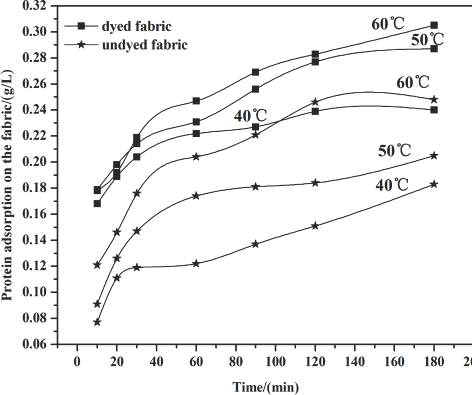
Cellulase adsorption on the fabric at 1.2 g/L enzyme concentration.
Polled Standard Deviation of Cellulase Adsorption Amount
Figs. 1–3 show that the amount of enzyme adsorbed on the fabric steadily increased under most circumstances as time increased during the treatment process. After 60 min, adsorption slowed down because part of the cellulase absorbed into the fiber desorbed from the fiber surface, and the availability of fiber sites for cellulase adsorption decreased over time as well.
Raising temperature levels led to an increase in the amount of protein adsorption. This effect may be a result of the stronger accessibility of the cellulase to the fiber, and the adsorption rate may also be higher than that at lower temperatures.
Compared with the undyed fabric, the higher protein uptake on the dyed fabric indicates that the sulfur dyes in the fiber did not affect enzyme adsorption to the fiber. The sulfur dye may exhibit an attraction to the enzyme, perhaps due to molecular interactions between dye and enzyme.
Hairiness Removal Percentage
The extent of microfibrils removal from the fabric surface is represented as hairiness removal percentage (η). A larger η value means more microfibrils were removed and that stronger cellulase biopolishing action occurred. The relationship between η values of dyed and undyed fabric with time and temperatures is shown in Fig. 4. Table III shows the polled standard deviation of hairiness removal percentage.
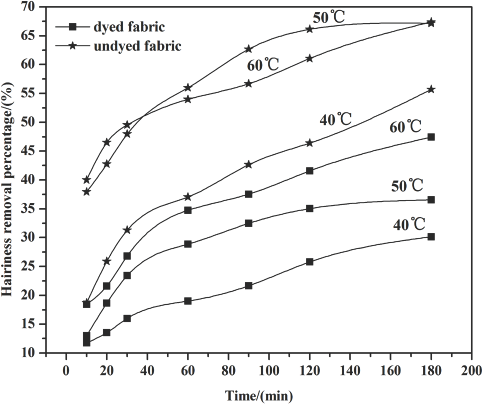
Hairiness removal percentage at 1.0 g/L cellulase concentration.
Polled Standard Deviation of Hairiness Removal Percentage
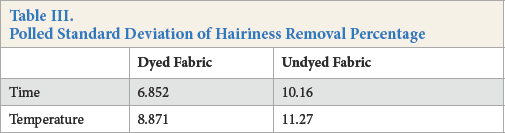
Fig. 4 shows that a significant increase in the hairiness removal percentage occurred from 40 °C to 60 °C. Higher hydrolysis activity occurred with increasing temperature, leading to a stronger effect on the fiber's surface pill. Cellulase adsorbed on the fiber increased when the temperature was raised, making more enzyme molecules involved in the de-pilling action. Also, the efficiency of cellulase hydrolyzing the β-1,4-glycosidic bond on the cellulose macromolecule increased, resulting in more microfiber fall of from the fiber zsurface, and a greater hairiness removal percentage.
Compared to the dyed fabrics, the undyed fabrics exhibited more efficient de-pilling under the same temperature. The reason the undyed fabric gave a higher hairiness removal percentage than the dyed fabric may be due to the dye obstructing the approach of the cellulase to the fiber. Moreover, the dyes on the fiber may have an inhibition effect on the cellulase activity.
With prolonged treatment time, the hairiness removal percentage rate gradually decreased, presumably as the interaction of the cellulase and the fabric weakened. This may be due to the reaction site being occupied as treatment time was prolonged, with no fiber sites left available for cel-lulase adsorption.
Reducing Sugar Production
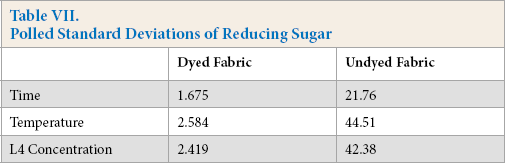
Cellulase activities were obtained under standard conditions where specific test substrates were used that only indicated the ability of cellulase to hydrolyze these specific substrates. When cellulase is used to treat cotton fabric, standard cel-lulase activity determinations could not describe the actual cellulase hydrolysis ability in the treatment process. The total reducing sugar generated during the treatment process can dynamically reflect the real reaction between cellulase and fabric; the more reducing sugar produced, the greater hydrolysis occurred. Tables IV–VI gives the reducing sugar amount of the residues. The polled standard deviations are given in Table VII.
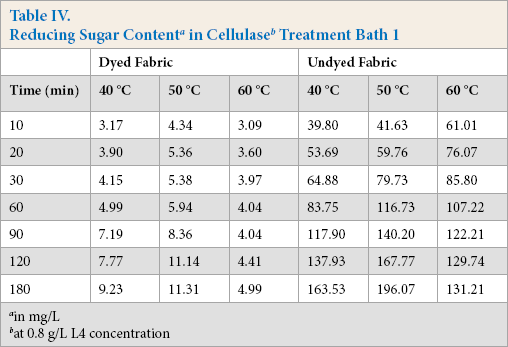
in mg/L
at 0.8 g/L L4 concentration
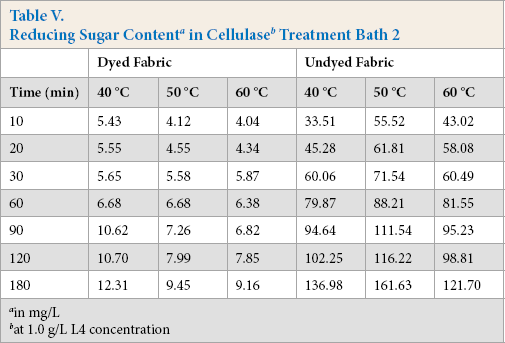
in mg/L
at 1.0 g/L L4 concentration
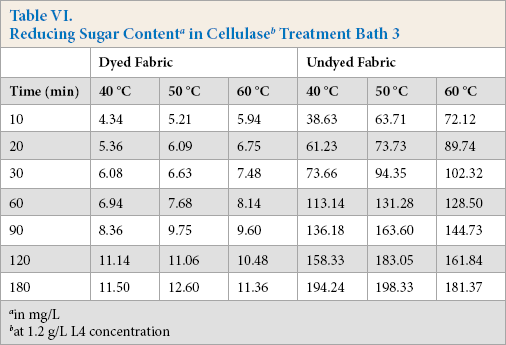
in mg/L
at 1.2 g/L L4 concentration
Polled Standard Deviations of Reducing Sugar
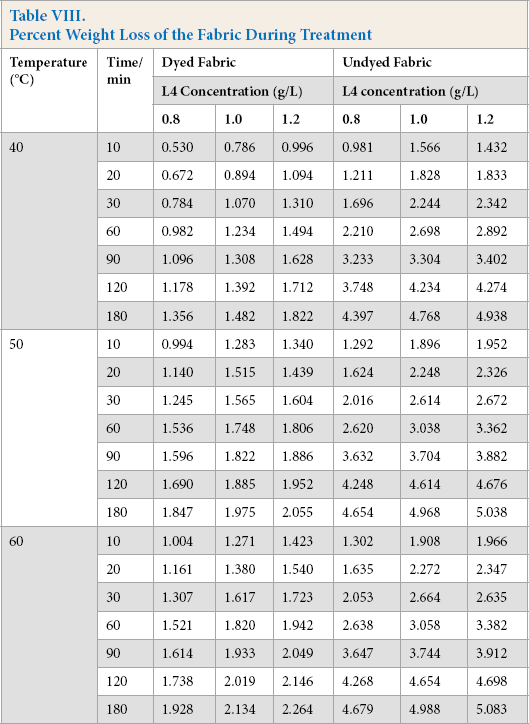
Percent Weight Loss of the Fabric During Treatment
Tables IV–VI show that the undyed fabric treatment bath had a greater reducing sugar content than that in the dyed fabric bath. It was concluded that the presence of the dyes on the cloth had a significant influence on the cellulose activity. Along with the protein adsorption and hairiness removal percentage results, the low reducing sugar content may be due to the presence of dyes on the fabric. It is well known that cellulase is inhibited by cellobiose, glucose, or both products. In this experiment, the cellulase activity was also inhibited by the dyes, and based on the results, inhibition of β-glucosidases activity was greater than the other compounds.
The effect of temperature on the reducing sugar content can also be obtained based on data in Tables IV–VI. The reducing sugar content was greatest around 50 °C, with lower contents at 40 °C and 60 °C. The higher reducing sugar content was due to the increased activity of the cellulase at the proper temperature. The enzyme adsorbed on the fiber surface of the fiber was also a main factor for the high reducing sugar content.
Comparing Tables IV–VI, use of high enzyme concentrations gives a greater reducing sugar content. Use of a greater enzyme concentration gives greater enzyme adsorption on the fiber surface than lower concentrations, resulting in the enzyme and the substrates reacting much more effectively.
Cellulase Kinetics
Based on the Michaelis-Menten models, cellulase hydro-lyzing cellulose can be represented by the following reaction scheme:

E is the enzyme, S is the substrate, ES is the enzyme-substrate complex, and P is the product.
According to the change of concentration during the enzymatic hydrolysis process, the Michaelis-Menten models can be expressed as follows:
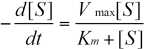
Vmax is the maximum reaction velocity and Km is the Michae-lis-Menten constant.
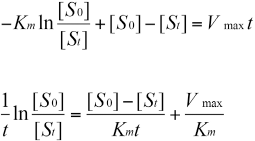
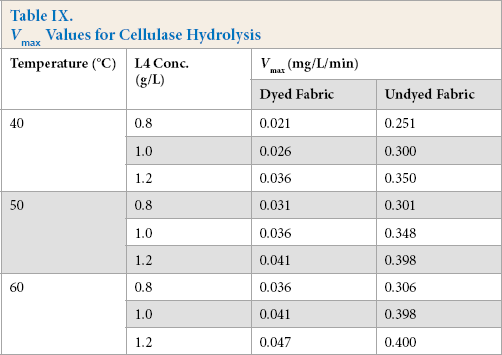
The integration of the equation is:
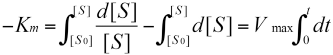
While if t = 0, [S] = [S0]; and if t > 0, [S] = [St]; the finally result of the equation is:
Select
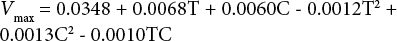
The weight loss data of cellulose-treated fabric after 0.5 h were selected to calculate the catalytic constants. Through data analysis, the Km value of dyed fabric is 51.81. The Vmax of cellulase hydrolysis at various temperatures and enzyme concentrations are given in Table IX.
Vmax Values for Cellulase Hydrolysis
Using Minitab to analyze the data in Table IX, the square of temperature and concentration, and interaction between temperature and enzyme concentration are all taken into account. The regression equation of dyed fabric is:
Additionally, the Vmax regression equation of undyed fabric is:
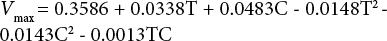
T is temperature C is cellulase concentration.
Based on the analysis results, for dyed fabric the significance values of the square of temperature and concentration, interaction between temperature and enzyme concentration are 0.268, 0.219 and 0.199, and for undyed fabric are 0.321, 0.335, and 0.897. All of these values are greater than 0.05, so the effect of the three factors can be ignored. Therefore, the final regression equation for the dyed fabric is:

And the final regression equation for the undyed fabric is:

The Vmax value for the undyed fabric was about 10× that of the Vmax for the dyed fabric. This indicates that the hydrolysis velocity decreased after dyeing by Sulfur Black 1, significantly reducing the efficiency of cellulase activity on the fabric.
Conclusions
Adsorption of acid cellulase L4 on fabric dyed with Sulfur Black 1 was greater than that on undyed fabric. This increased when the temperature was increased from 40 °C to 60 °C, however the hairiness removal percentage of the dyed fabric was much less than that for undyed fabric. This indicates that the sulfur dye in the fiber led to the reduction of cellulase efficiency, as determined by glucose content measurements during the treatment process.
Cellulase hydrolysis of cellulose occurs in a heterogeneous medium. The mechanism is a complex process. The Kmax value of cellulase hydrolysis dyed and undyed fabric were 51.81 and 49.97 respectively, which are very similar. The Vmax of undyed fabric was about 10× greater than that of dyed fabric. This means the hydrolysis velocity decreased after dyeing with Sulfur Black 1; this would significantly reduce the efficiency of cellulase activity on the fabric.
Footnotes
Acknowledgements
The work in this paper was financially supported by Hebei Natural Science Foundation (B2013208082). The authors are grateful to Mulstars Biochemicals and Mastone Chemicals.