
Abstract
Ultrasound-enhanced bioscouring process factors for greige cotton fabric are examined with custom experimental design using statistical principles. Optimal bioscouring conditions are determined for enzyme concentration, process time, ultrasonic power, and frequency. An equation is presented which predicts bioscouring performance based upon percent reflectance values obtained from UV-Vis measurements of ruthenium red stained fabrics. Significant material and engineering cost savings can be achieved through the adoption of optimized factors.
Introduction
The textile industry currently uses a caustic chemical process to scour greige cotton fabric. Tis method removes pectin and other materials from the fabric's surface and produces an alkaline waste stream that requires neutralization, costing additional expense and time. Research conducted by the Cotton Chemistry and Utilization Group at the Southern Regional Research Center in New Orleans, Louisiana has found an alternative to the existing process method. By combining ultrasonic energy and enzymes, an effective, environmentally-friendly process was developed that does not generate a hazardous waste stream.
The use of enzymes to scour greige cotton fabric, and the specific nature of the ultrasound-enzyme interaction, has been reported in detail elsewhere and will not be discussed here.1–7 The present research seeks to understand the relationship among bioscouring process factors. Specifically, the goal is to predict and optimize bioscouring performance based upon the factors of enzyme concentration, reaction time, ultrasonic frequency, and power. Additionally, this research is aimed at lowering processing costs. Using commercially-available greige cotton fabric, pectinase enzyme, a seven-frequency ultrasound generator, and response surface type regression analysis, the statistical significance of four process factors was determined and a mathematical expression for predicting bioscouring performance was presented. Furthermore, the best conditions for ultrasound-enhanced bioscouring of greige fabric were found and significant cost savings realized.
Experimental
Ultrasound Trials
McIlvaine's buffer solution (pH = 3.85) was prepared from a 0.1 M citric acid solution and a 0.2 M Na2HPO4 • 12H2O solution. McIlvaine's buffer (100 mL) and one drop of Triton X-100 were added to three 250-mL Erlenmeyer flasks. Desized (Optisize 160), single-filled, enameling duck cloth samples (7.0 oz/yard 2 , Schott Textiles Inc.) were cut in the general shape of a square or rectangle (350 ± 2 mg) and placed in each flask. The flasks were vigorously swirled to ensure the Triton X-100 was properly dissolved and the fabric samples were fully submerged in the buffer solution.
The ultrasound equipment consisted of a seven frequency multiSONIK-2 Ultrasonic Generator (Blackstone-Ney Ultrasonics) and controller. Pre-experimental preparations involved filling the 10-gallon ultrasonic tank with tap water, degassing for 15 min at a frequency of 140 kHz, and heating the tank to 45 ± 2 °C, which corresponds to the optimal temperature for maximum pectinase activity. The three 250-mL Erlenmeyer flasks containing 100 mL of McIlvaine's buffer, Triton X-100 surfactant, and the greige fabric samples were clamped into place in the 10-gallon ultrasound tank to a submerged depth roughly 1 in. from the top of the flask. Prior to enzyme addition, the experimental flasks were allowed to equilibrate to the tank's 45 °C temperature. Using the ultrasonic controller, the factors of frequency, power, and time were programmed for each experiment.
Once the experimental flasks equilibrated in the ultrasonic bath, a specified amount of Multifect Pectinase FE (Genencor) was pipetted into each flask and the ultrasound experiment was promptly started. A thermocouple system was installed in conjunction with the ultrasound instrument. Temperature readings were also taken regularly throughout the experiment using a Fisher Scientific digital thermometer. If necessary, the bath temperature could be adjusted using either the cooling system, which circulated room temperature (RT) water or the heating coil in the thermocouple system. Enzyme concentration ranged from 0 to 100 μL/100 mL buffer solution; experiment time ranged from 5 to 60 min; ultrasonic power ranged from 0 to 100%, which corresponded to 0 to 980 W; experimental frequency ranged from 0 to 270 kHz. The experimental set-up is shown in Fig. 1.
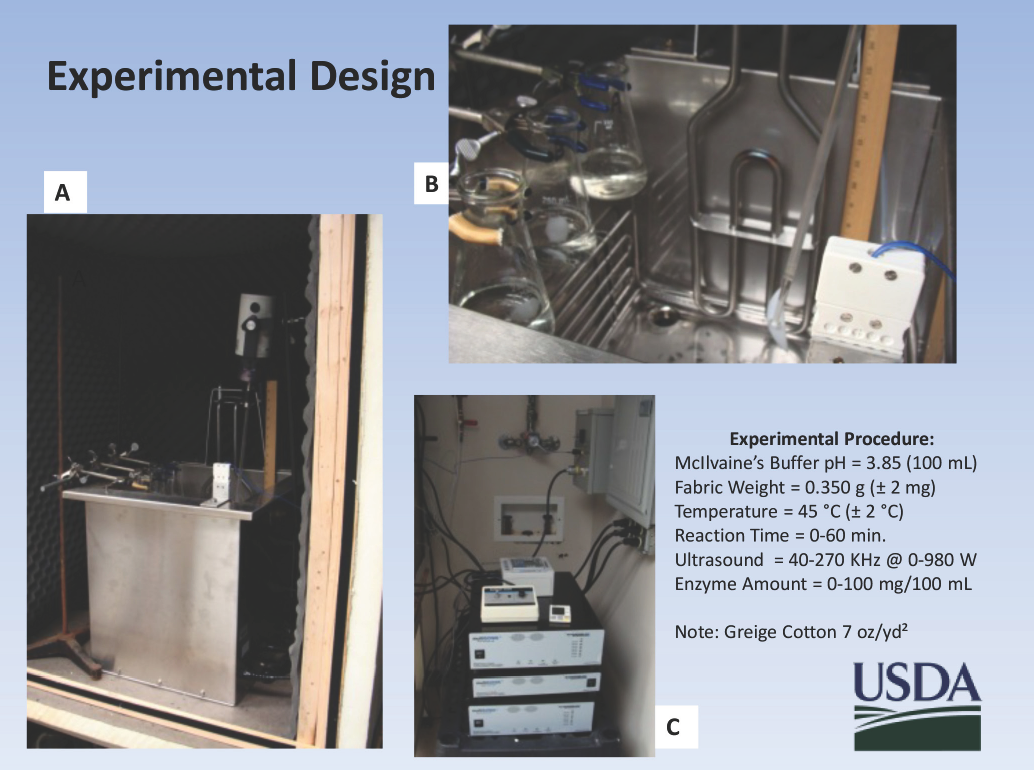
Experimental design. A) ultrasonic tank with overhead stirrer in sound attenuating enclosure; B) inside of tank with cooling coil, heating element, three flasks, and thermocouple shown; C) multi-frequency generator and programmable controls.
Following ultrasonic and enzymatic exposure, the three flasks were removed from the ultrasound tank and the bioscoured greige fabrics were placed into a 400-mL beaker containing boiling, deionized water to terminate enzymatic activity. After 6 min, the three fabric samples were removed, placed on a watch glass and put into a preheated oven (100 °C) to dry for 15 min. The experimental flasks containing the buffer solution were cooled to RT and their pH measured. Once removed from the drying oven, fabric samples were allowed to recondition prior to being reweighed.
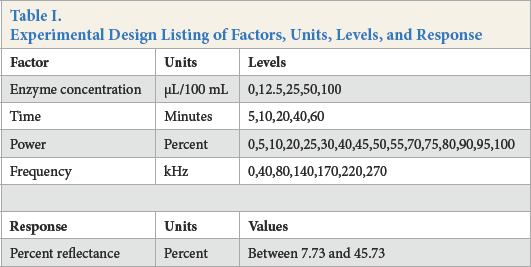
In this series of experiments, the process factors examined were enzyme concentration, experimental time, percent power, and ultrasonic frequency. A summary of the experimental design is found in Table I. A randomized incomplete block factorial design was implemented by Design Expert 9.0, such that all two-way interactions of the research factors were estimable, without confounding patterns present of the main effects, second-order terms, and two-factor interactions with higher order interactions. A subset of 40 factor combinations was repeated for 4 block replicates for 160 total experiments.
Experimental Design Listing of Factors, Units, Levels, and Response
Ruthenium Red Dyeing
A pH 6.0 McIlvaine's buffer solution containing 0.1 M citric acid and 0.2 M sodium phosphate dibasic solution was prepared for ruthenium red dyeing. The ratio used for fabric staining was 50 mg ruthenium red/100 mL buffer/g fabric.8,9 Theprocedure for fabric staining was as follows. Bioscoured fabric samples were weighed for a combined total weight and the amount of dye and buffer solution calculated according to the ratio given above. The crushed dye crystals were added to the buffer and heated to 50 °C while stirring. It was critically important that all dye crystals dissolved in solution prior to fabric addition. Once the 50 °C temperature was reached, fabric samples were submerged and soaked for 30 min. Following ruthenium red dyeing, bioscoured fabric samples were transferred to a boiling deionized water bath (100 mL/g fabric) for 10 min. Finally, the samples were removed from the boiling bath, rinsed 3 times in deionized water, and air dried at RT in a fume hood for 2 h on white sheets of absorbent paper towels, prior to UV-Vis spectro-scopic analysis.
UV-Vis Spectrophotometer
A Varian Cary 100 spectrophotometer, fitted with a Lab-sphere integrating sphere diffuse reflectance accessory, was used for percent reflectance measurements at 540 nm of the ruthenium red dyed fabrics. The diffuse reflectance accessory was run inside the sample compartment holder of the spectrophotometer and the instrument and computer were controlled using the Varian Scan software program. The spectrophotometer also used a photomultiplier tube detector with a spectral wavelength range of 200 to 800 nm. To perform a baseline correction, a Spectralon (PTFE) certified reflectance standard disk was placed over the open 70-mm port of the accessory, followed by scanning the specified wavelength range in reflection mode. Similarly, to collect spectral data on the bioscoured fabrics, the Spectralon disk was replaced with the individual bioscoured fabric samples over the open port followed by scanning the same wavelength range in reflection mode.
Statistical Analysis
Percent reflectance (pctR) results from UV-Vis spectra of bioscoured fabric samples were analyzed by Design Expert 9.0 (DE 9) from a block fractional factorial set of experiments. Regression models were ft, where pctR was the dependent response variable and the four factors of enzyme concentration, experimental time, ultrasonic power, and frequency were the independent classification variables. Initially, all linear, quadratic, cubic, two-way and three-way interaction terms were included in the regression model. A stepwise regression method was then used to reduce the model to include statistically significant factors and coefficients to estimate predicted responses of pctR. 10
Results and Discussion
Photospectroscopy
Typical greige cotton fabric has a pectin content of 0.9%, with low and high content ranging from 0.7% to 1.2%, respectively. 11 Previous research by Yachmenev et al. determined ultrasound-enhanced bioscouring effectiveness by measuring fabric wicking times and whiteness indices. 3 In the present research, after exposure to bioscouring conditions, the greige fabrics were dyed with ruthenium red stain and analyzed for remaining pectin content by UV-Vis spectrophotometer (Varian Cary 100). The pctR value at 540 nm was the measurement of the interaction of the hexava-lent cationic ruthenium red dye with the 6th carbon atom carboxyl functionality in the pectin molecule. 8
Fig. 2 illustrates the range of colors produced from the ruthenium red dyeing of greige cotton fabrics. As a general rule, the greater amount of pectin remaining on the fabric, the darker the ruthenium red-coordinated stain and the lower the pctR value. The greige cotton fabric that was not subjected to bioscouring treatment appeared dark red, indicating the presence of large quantities of carboxyl-ruthenium red coordinated pectin material (Fig. 2). After ultrasound-enhanced bioscouring, the red stain was considerably less, indicating a substantial quantity of pectin was removed. In the caustic treated sample, there was still a trace amount of red stain present, indicating not all the pectin was removed.
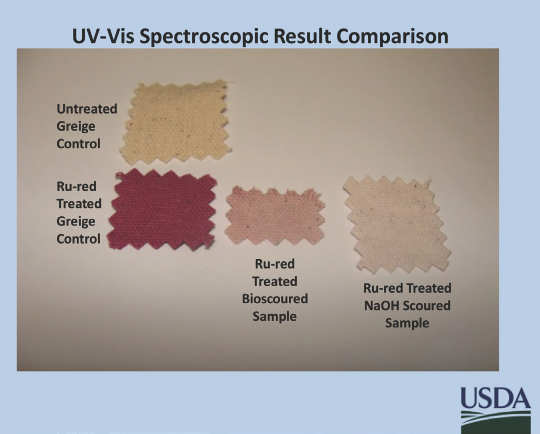
UV-Vis spectroscopic result comparison of untreated control samples and bioscoured and caustic treated samples.
The untreated dark red control sample had a percent reflectance value of 7.73 and the NaOH treated sample had a percent reflectance value of 45.73; therefore, the percent reflectance values obtained for all fabric samples in this series of experiments ranged between 7.73 and 45.73. A higher percent reflectance number was more desirable than a lower percent reflectance number—more pectin was removed at higher percent reflectance values. Fig. 3 depicts the UV-Vis spectra of 30 experiments performed for this project and represents a partial range of measured reflectance values at 540 nm after using various factor combinations.
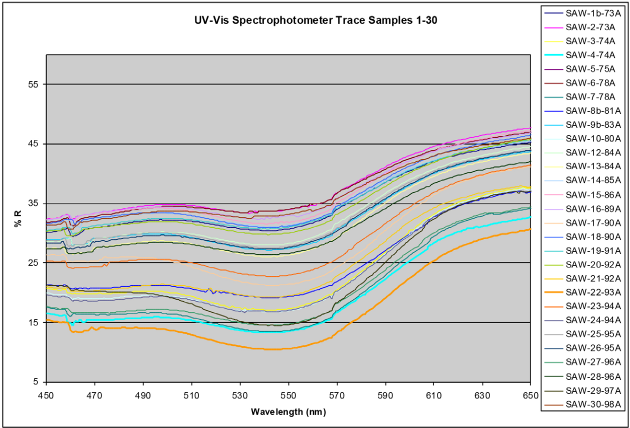
A graph illustrating the varying percent reflectance results from altering process factors in ultrasound-enhanced bioscouring.
Fractional Factorial Design, Model Selection, and Regression Analysis
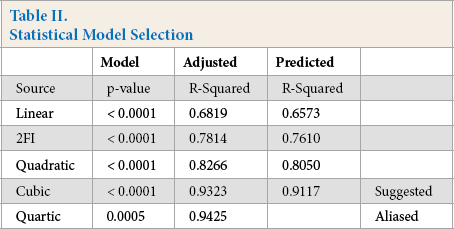
It was not practical to perform all 2800 possible combinations of process factors and, therefore, a block fractional factorial design was used. Experiments were selected and randomly performed in quadruplicate blocks of 40 experiments. The statistical model selected was based upon the highest adjusted R-squared value of ruthenium red stained fabrics, which yielded the highest predicted R-squared value. In this case, a cubic model had an adjusted R-squared value of 0.9323 and a predicted R-squared value of 0.9117 (Table II). The higher order quartic model was rejected since Design Expert 9.0 software could not generate coefficients for the predicted R-squared terms due to aliasing among the process factors.
Statistical Model Selection
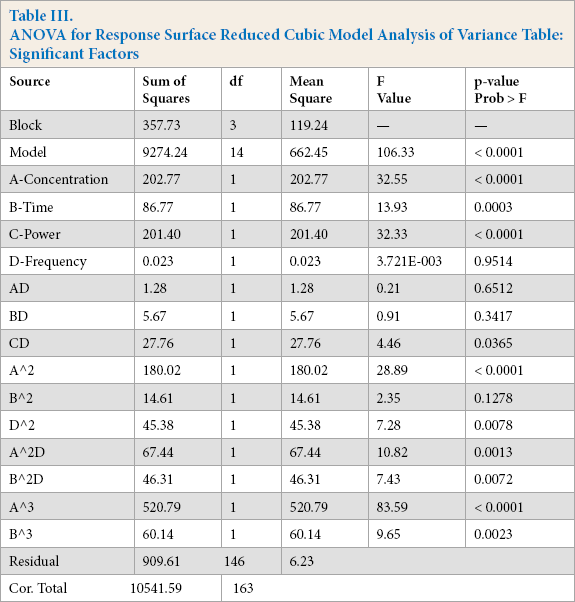
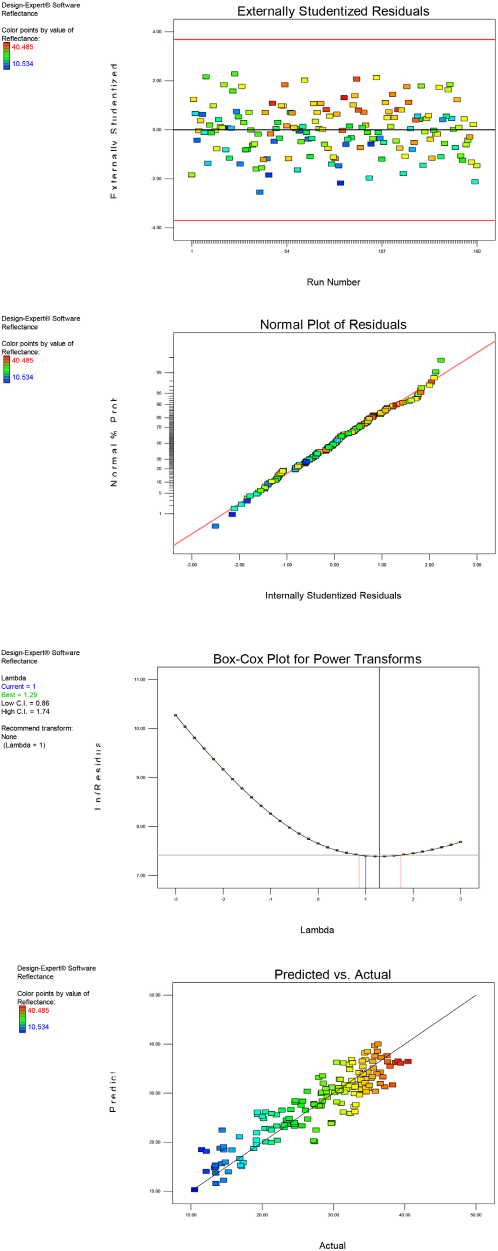
The relationship of the four factor conditions (input factors = enzyme concentration, time, power, and frequency) and the percent reflectance (output response = pctR) was assessed by regression analysis of the cubic model. From the regression output table (Table III), the cubic model was significant with an f-value of 106.33 and a p-value of < 0.0001. Concentration, time, and power were significant linear factors, while frequency was not significant as a linear factor. Other significant factors included the two-factor interaction of power and frequency. When concentration and frequency terms were squared, they were significant. When concentration and time factors were squared, they both demonstrated a significant interaction with the frequency factor. Finally, both concentration and time factors were significant when they were cubic. Data normality and multi-collinearity were assessed with externally studentized residuals, normal plot of residuals, and Box-Cox plot for power transformations. All confirmed that the data met the assumptions for cubic models and regression and can be found in the Supplemental Data section.
ANOVA for Response Surface Reduced Cubic Model Analysis of Variance Table: Significant Factors
Predicting Percent Reflectance
An equation was generated from the statistical analysis program which predicts percent reflectance (pctR) values based upon the four factors of enzyme concentration, time, power and frequency.
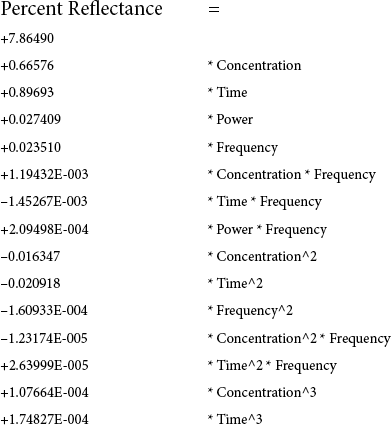
Whenever a higher ordered factor is significant, to preserve model hierarchy, the lower order factor was kept in the equation in addition to the higher order factor.
Process Factor Optimization
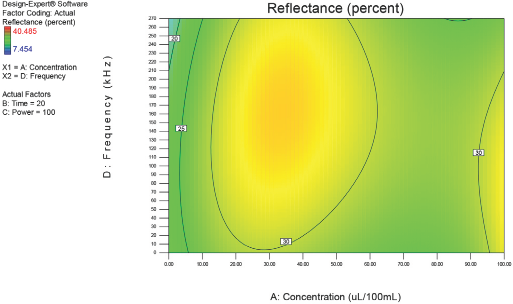
Figs. 4–10 depict the predicted percent reflectance values at ten minute intervals between 1 and 60 min for all possible frequencies (0–270 kHz) and enzyme concentrations (0–100 μL/100 mL buffer). From these figures, optimal processing conditions can be obtained. Beginning in Fig. 4 at 1 min, the area from 120 to 270 kHz and 20 to 50 μL/100 mL buffer has been identified as having a higher percent reflectance value (25) than the neighboring areas. As bioscouring experimental time progresses to 10, 20, and 30 min (Figs. 5–7), this area narrows to 110–210 kHz and 25–40 μL/100 mL buffer with a corresponding increase in percent reflectance value to 35. As time progresses through 40, 50, and 60 min (Figs. 8–10), the area of optimal bioscouring performance broadly expands and the predicted percent reflectance value surpasses 40. In Fig. 10, a fag on the graph marks the optimal conditions required (predicted) to obtain the maximal bioscouring of greige cotton. The value of 44.2752 means that the best possible outcome for bioscouring under the conditions outlined in these experiments will produce a predicted result which is 96.82% as good as that obtained from NaOH scouring (45.73) of the same greige cotton fabric [(44.28 / 45.73) × 100% = 96.83%].

Optimization of process factors at 1 min.
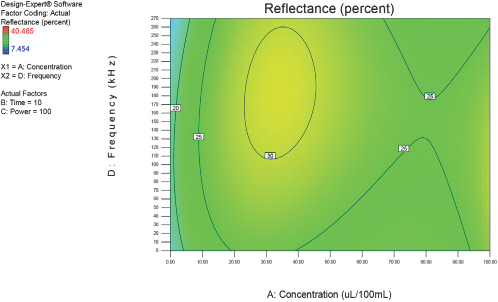
Optimization of process factors at 10 min.
Optimization of process factors at 20 min.
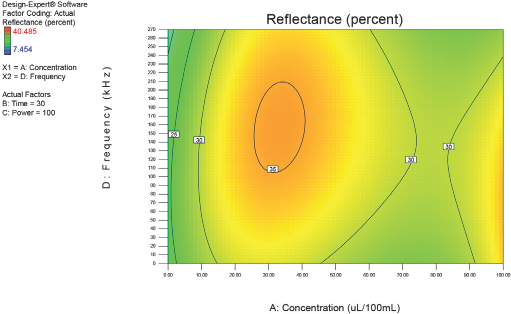
Optimization of process factors at 30 min.
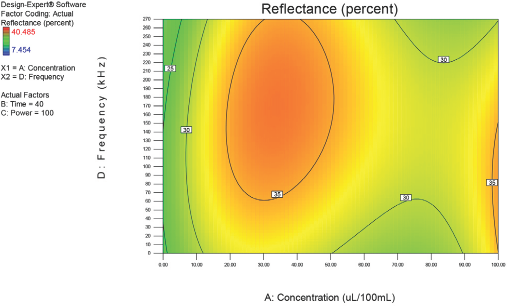
Optimization of process factors at 40 min.
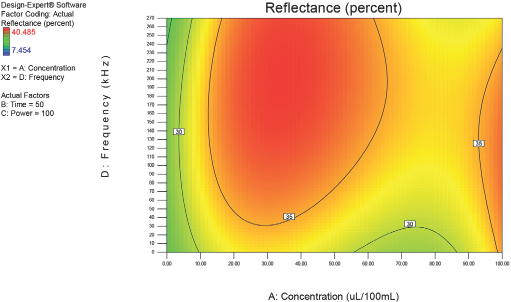
Optimization of process factors at 50 min.
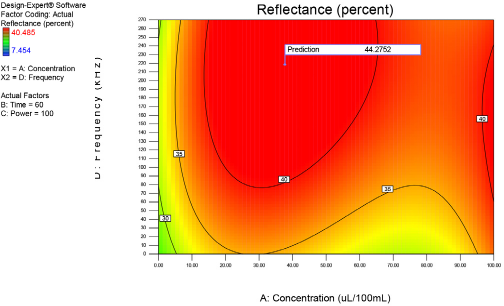
Optimization of process factors at 60 min.
The optimal bioscouring conditions identified by statistical analysis were as follows: Multifect Pectinase FE = 31 μL/100 mL buffer; Experimental Time = 60 min; Ultrasonic Power = 100% (980 W); and Ultrasonic Frequency = 220 kHz. Follow-up experiments yielded an ultrasound-enhanced bioscoured greige cotton fabric that had 98.73% of its pectin removed when compared to conventional NaOH scoured fabric, consistent with the predicted experimental value.
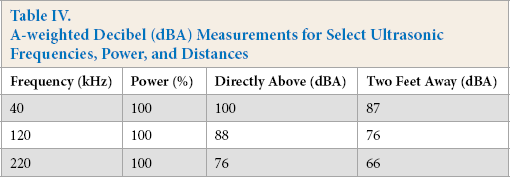
The optimal bioscouring ultrasonic frequency was 220 kHz. Tis is very important from a cost and an engineering point of view. One of the biggest obstacles to implementation of ultrasound in an industrial setting is coping with the noise level generated by the ultrasound equipment. Because of some noise levels, workers are required to wear hearing protection and undergo periodic hearing testing. Additionally, the costs associated with providing a sound-attenuating barrier around the equipment impede its industrial acceptance. All of this can be avoided if the ideal ultrasound frequency of 220 kHz is used in the bioscouring process. Tree ultrasonic frequencies were measured at two locations, directly above the ultrasound tank and at a distance of two feet (Table IV). An ultrasonic frequency of 220 kHz and 100% power has a decibel level of 76 dBA directly above the equipment and a decibel level of 66 dBA at a distance of two feet (Table IV). Both of these sound levels are below the threshold which the OSHA (85 dBA) standards identify as resulting in noise-induced hearing loss (NIHL). 12 To put it in perspective, 76 dBA is equivalent to listening to a vacuum cleaner at a distance of 10 feet. 66 dBA is approximately equal to listening to a normal conversation at a distance of 3 feet.
A-weighted Decibel (dBA) Measurements for Select Ultrasonic Frequencies, Power, and Distances
Ultrasound Frequency and Power in Bioscouring
By performing a simple mathematical calculation using the predictive equation above, it is apparent that the contribution of ultrasonic frequency and power in the bioscouring process was of major importance. If all significant factors containing ultrasonic frequency and power are equal to zero and the optimal enzyme concentration and time are equal to 31 μL/100 mL buffer and 60 min, respectively, then the predicted bioscouring percent reflectance value is equal to 32.28. By subtracting this value from the optimal value of 44.28, there is a difference of 12.00 in percent reflectance. Tis means that the contribution of ultrasound frequency and power accounted for a 37.18% improvement in bioscouring performance when compared to a process that uses enzymes alone.
Enzyme Concentration versus Frequency
Fig. 11 is a three-dimensional surface response graph generated from the same data as shown in the two-dimensional graph (Fig. 10). Several fags on the graph indicate percent reflectance values at different frequencies and enzyme concentrations. One trend is immediately apparent from the data: as frequency decreased and enzyme concentration increased, the percent reflectance value decreased. A lower ultrasonic frequency and higher enzyme loading actually resulted in poorer bioscouring performance. Obviously, from a cost perspective this is important, as significant savings can occur by the proper selection of ultrasonic frequency and by using a lower concentration of enzyme. The probable explanation for the observed trend is the larger size and the lower number of cavitation bubbles produced at lower frequencies. From a purely mechanical perspective, larger and fewer cavitation bubbles have less of an impact on the fabric surface and are less efficient in transporting enzymes and enzyme products to and from the fabric substrate.1–7
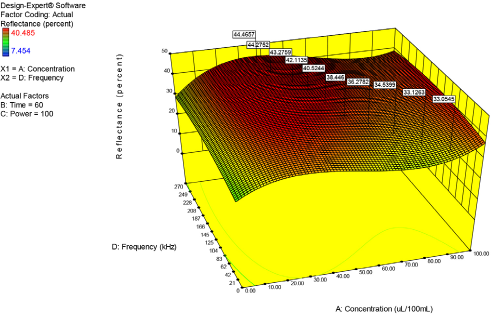
Concentration versus frequency. Note that decreasing ultrasonic frequency and increasing enzyme concentration resulted in a decrease in bioscouring performance.
Ultrasonic Power Consumption
From the list of significant factors in Table III, ultrasonic power was shown to be a first order linear factor. Ultrasonic power's linear trend is also shown in Fig. 12. For all concentrations of enzyme the trend was the same: the more power applied to the system, the greater the percent reflectance value. It is interesting to note that even a small application of ultrasonic power resulted in a noticeable improvement in bioscouring performance as depicted by the fag located at 37.511 (10% power). Recall from the above discussion that, with no ultrasound applied, the percent reflectance value was 32.28. Tis means, that with 10% ultrasonic power applied, there was a 16.21% improvement in bioscouring performance. Future studies of ultrasound power consumption should investigate this linear trend more closely. In the present study, power consumption was continuous for up to 60 min. It may be that pulsed ultrasound power is just as effective as continuous power, but for a shorter period of time and using less total energy. Unfortunately, pulsed ultrasound power cannot be generated using the equipment described in this series of experiments.
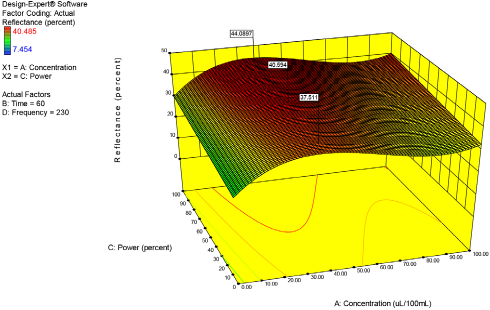
Concentration versus power.
Conclusion
Using statistical methods, bioscouring conditions for applying a combination of ultrasound and enzymes to greige cotton fabric were investigated. An equation was presented that predicted pectin removal based upon four process factors. The optimized bioscouring conditions of 100% ultrasonic power at 220 kHz for 60 minutes with 31 mg/mL of pectinase enzyme resulted in greater than 98% pectin removal compared to conventional sodium hydroxide treatment. The optimized frequency setting of 220 kHz means that this process can be incorporated in an industrial application without the need for expensive sound-attenuating barriers and worker hearing protection. Incorporation of ultrasound to the enzymatic bioscouring process improved bioscouring performance by over 37%, when compared to enzyme bioscouring without ultrasound. Given the environmental issues associated with caustic scouring of greige fabrics, the combination of ultrasound and enzymes in textile processing is an attractive, sustainable alternative to the conventional method.
Supplemental Data
Footnotes
The use of a company or product name is solely for the purpose of providing specific information and does not imply approval or recommendation by the United States Department of Agriculture to the exclusion of others.