
Abstract
To address reported problems in investigating photochromic dye fatigue, this paper describes a new method of “dissolved” photochromic organic dye analysis within polar silica matrices. Conditions under which a photochromic response occurs in a given material are defined by specifying the light source (irradiation wavelength) and exposure time that leads to photochromism. Fatigue, defined as poor lightfastness, is researched through consecutive cycles of exposure to the direct influence of a defined UV irradiation source. From the spectrophotometric graphic analysis in CIELAB, a conclusion can be made on the lifespan of photochromic textile products. This paper addresses issues regarding the rate of color development, and the controlled, predictable return to a colorless state, which is the base of any device working on the principle of reversibility.
Introduction
A textile substrate displaying photochromism is in fact a smart material, given the ability to “sense” stimulus within its immediate surroundings. Such a textile reacts and adapts to changing conditions via properties contained within its very core. Smart textile derives from the term smart material, defined in 1989.1 More precisely, a photochromic smart textile belongs to a group of passive smart textiles capable of sensing the environment. Defined as such, it can also be referred to as a sensor.
Phenomenon involving color change of chemical compounds are named according to the physical and/or chemical stimulus provoking it. Photochromism implies a mechanism of induced reversible change in the color of a chemical compound. This includes chemical bond breakage or changes in molecular conformations. Reversible changes between two states are followed by quite different and distinguishable absorption spectra as a direct result of electromagnetic irradiation (most often UV).
Based on these facts, photochromism at a supra molecular level is easily monitored; a simple reflectance spectrophotometer is needed for objective investigation.
The back reaction is induced either by a change in the spectra irradiating the compound, or termination of irradiation. In some photochromic compounds, the back reaction is induced by the introduction of heat.
Photochromic materials are most commonly used for ophthalmic lenses, security printing, optical recording 2 and switching, solar energy deposition, and biological systems.3-16 Photochromic organic counterparts used in textile technologies include disperse dyes, which have a certain affinity towards man-made, artificial fibers such as polyamide (PA), polyacrylonitrile (PAC), and polyester (PES).17,18 Additionally, a large number of matrices (carriers), which can be used to contain photochromic materials, have varied free surface areas that provide the space needed for chemical bond breakage. Conformational changes in photochromic compounds has also been studied.19,20
Matrices based on silica, inorganic-organic hybrid materials known as silica gels, are very important. Many papers deal with silica-gel synthesis and the resulting covalent bonding of spyroxazines and sol-gel precursors. 21
Appropriate lab models applying photochromic organic counterparts onto textile materials (via dyebath exhaustion,22,23 bulk dyeing, and application of microcapsules24,25) have been investigated.
In this paper, a newly developed analytical method allowing spectra of dissolved photochromic dyes to be measured is developed. In the method, silica gel plates were used for deposition of dye droplets, subsequently irradiated and measured using a reflectance spectrophotometer. A method for investigating fatigue in photochromic textiles is proposed. The resulting degree of fatigue occurring in a solution of photochromic dye can simply be translated onto textile materials.
Materials and Methods
Photochromic Dyes
Photochromic dyes of known chemical constitutions were obtained from Sigma-Aldrich and PPG Industries. The dyes were used as supplied. The chemical structures of dyes are given in Fig. 1.
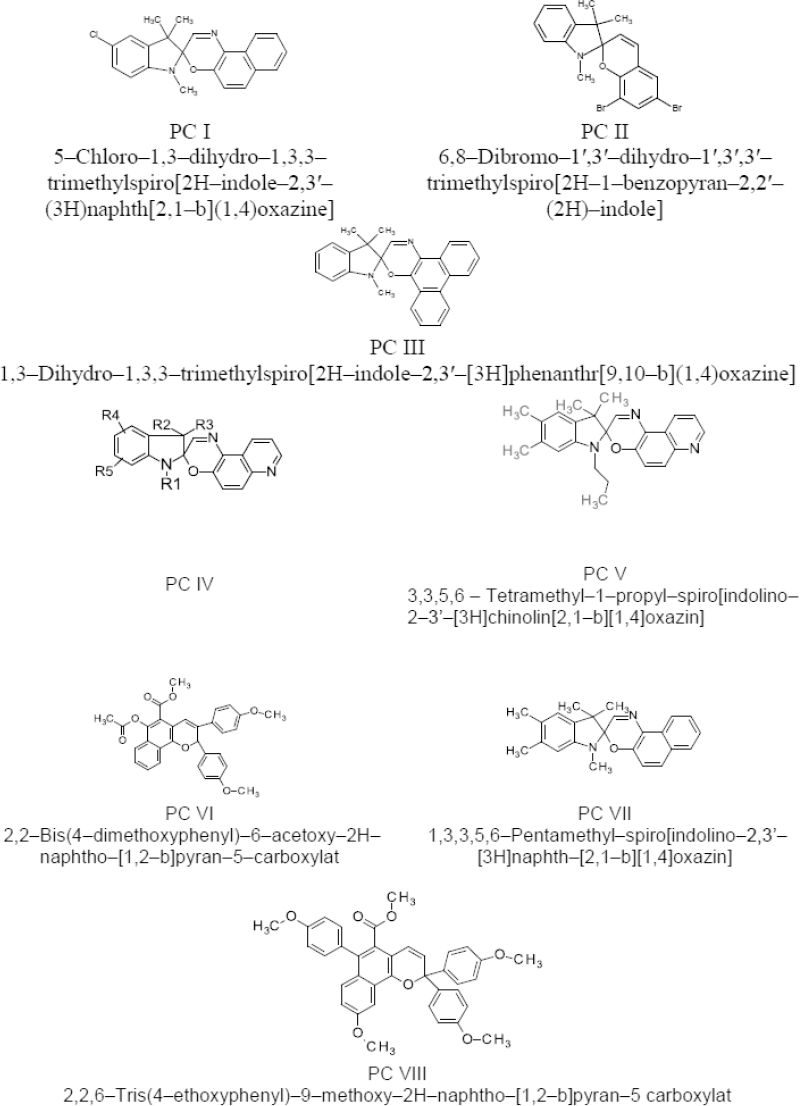
Chemical constitutions of photochromic dyes.
Ultraviolet Irradiation Chamber
For dye excitation, an ultraviolet (UV) chamber Solarscreen Test Chamber (STC-01) was used (Fig. 2). The instrument was designed and constructed in the Department of Textile Chemistry and Ecology in Zagreb, Croatia. Features of the chamber are given in Fig. 2 and the spectra of the lamp tubes in Fig. 3. Each of the lamps emitted a range of UV irradiation (e.g., mostly in the UV-A region of the UV irradiation spectra). The emission spectra of the tube irradiation was measured at the Institute of Physics in Zagreb using an optical fiber, relative for each of the wavelengths (λ) measured.
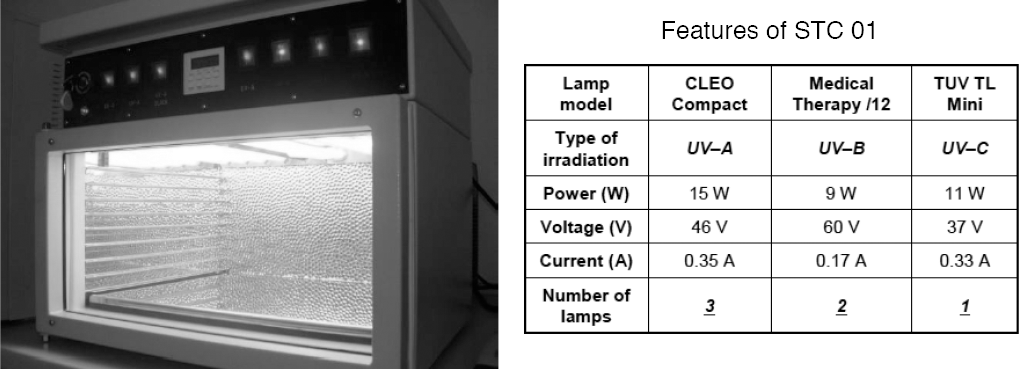
Solarscreen Test Chamber (STC-01).
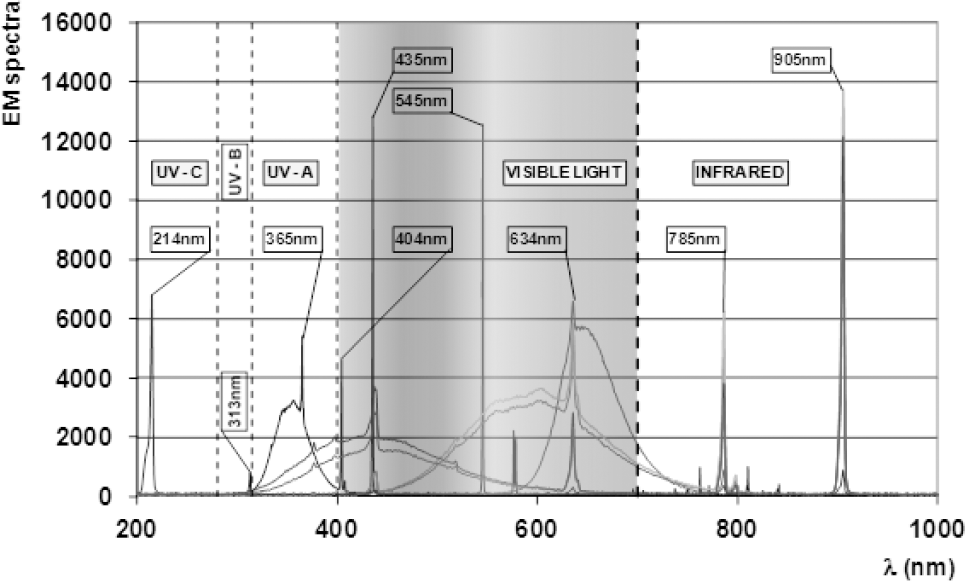
STC-01 lamp tubes emission spectra.
Dye Selection
Four structurally similar dyes were selected from a list of commercially available dyes for this experimental work. The selection of dyes was made according to thin layer chromatography (TLC) results based on their photochromic response (Fig. 4). The mobile phase used was a mixture of toluene, acetone, and ethyl methyl ketone in a 20:2:1.5 ratio.
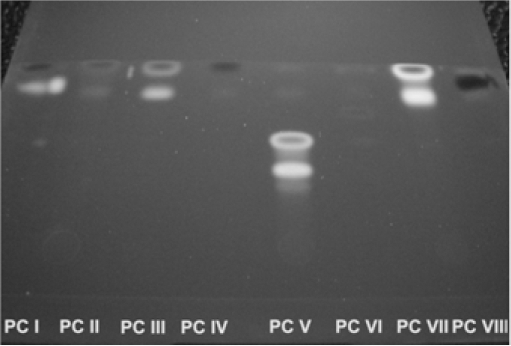
Chromatogram of model and commercial dyes.
Dye Stability and Predictability Principle
An analytical method was used to investigate the behavior of photochromic dye spots deposited onto polar surfaces such as silica gel (Si-gel) plates (TLC plates, SIL G-25). Based on reflectance spectrophotometry, the method can be used as an alternative to absorbance spectrophotometric analysis. As the surface of the substrate (an activated SiO2 matrix) is polar, colorimetric parameters obtained by reflectance spectrophotometry are the result of interactions between deposited dye molecules, solvent dispersant, and the SiO2 matrix. The analysis assumes the formation of a dye dispersion within the solvent (vehicle) rather than formation of a real solution. These spectrophotometric measurements were made in the presence of solvent, evaporation of which caused re-crystallization of the dye and the absence of photochromism.
Method
Each of the dyes investigated (PC IV-VIII) was dissolved in acetone (AC) at a concentration of 0.4 g/L. The pH of the solutions was set to 7 (neutral) and 4.5 (acidic) to investigate the influence of pH on stability and predictability. A micropipette was then used to deposit 18 μL of dissolved dye on top of the Si-gel plate. The plates were than dried at 105 °C and subsequently activated by ultraviolet irradiation inside the STC-01 chamber. The activation time was 60s.
To define stability of the colored form of the dye molecule, colorimetric (CIELAB) parameters were determined (between 300 nm and 700 nm) using a reflectance spectrophotometer (Datacolor SF 600) at predetermined time intervals (from 5s to 50s following UV irradiation exposure).
Dye-solvent systems of mathematically predictable photochromic behavior (i.e., linearly dependent back reactions into colorless state) were classified as an ideal base for security and anti-counterfeit devices.
Fatigue of Photochromic Polyamide (PA)
Fatigue is defined as a number of reversible cycles from a colorless to a colored state that a sample can undergo before reversibility of the phenomenon is lost. One possible way of minimizing fatigue is increasing the dye concentration on the substrate. Fatigue of photochromic dyes (PC IV-VIII) on textile materials was investigated on dyed PA fibers. Knitted PA samples were dyed on a Polycolor laboratory dyeing apparatus (Mathis). Dye concentrations were set within a 0.1% to 1% owf range, with a material to liquor ratio (LR) of 1:20 and pH 4.5 set using acetic acid. The duration and dyeing temperatures are given in Fig. 5.
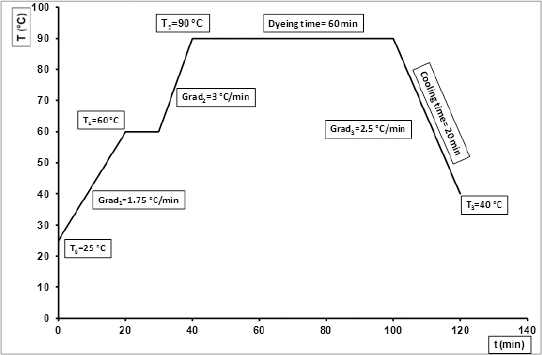
Dyeing process schematic.
Fatigue was measured according to the following method. Samples were irradiated by UV (inside STC-01) for a 60s time interval with corresponding spectra gathered immediately. Following a 10 min relaxation period and reversion to the colorless state, sample spectra were recorded again. This procedure was repeated for 20 consecutive cycles. Results were analyzed statistically using CIELAB colorimetric parameters L*, a*, and b*.
Statistical Analysis of CIELAB Parameters
Regression and Correlation Analyses
Regression and correlation analyses of the dyed PA samples were calculated using MS Excel. Color differences (ΔE) were statistically analyzed based on:
Overall ΔE values in between each of the UV exposure cycles inside the STC-01 chamber.
ΔE values between the sample not exposed to UV irradiation and the unexcited state (meaning 100% loss of UV conditioned coloration) sample that has been exposed n + 1 times to UV irradiation (0 ≤ n ≤ 20 cycles).
ΔE values between the sample exposed to UV irradiation for one cycle (for 60 s) and the excited state (UV conditioned coloration) sample that has been exposed n + 1 times to UV irradiation (0 ≤ n ≤ 20 cycles).
Results and Discussion
Dye Selection
Four dyes were selected according to the results of the thin layer chromatography shown in Fig. 4. Accordingly dyes PC I, III, V and VII showed similarities in photochromic response while being drawn up the plate via capillary action of a prepared mobile phase (mixture of toluene, acetone, and methyl ethyl ketone).
Stability and Predictability
This paper defines the stability of photochromic dyes as the time in which the color of the investigated materials remains visible following removal of the UV irradiation source. It implies formation of the merocyanine (MC) form of the dye molecule during UV radiation and subsequent return to the spiro (SP) form following removal of the UV irradiation source.
Due to the impossibility of investigating spectral characteristics of the investigated dyes by correlating values of absorption to dye concentration in the solution, an analytical method has been developed to allow the investigation of dye characteristics in a dye-solvent system. A key element of the developed method was the selection of a polar carrier (Si-gel matrix), which would allow monitoring of UV-induced changes. All measured changes, therefore, could be ascribed to properties’ characteristics of the investigated dye-solvent-matrix system.
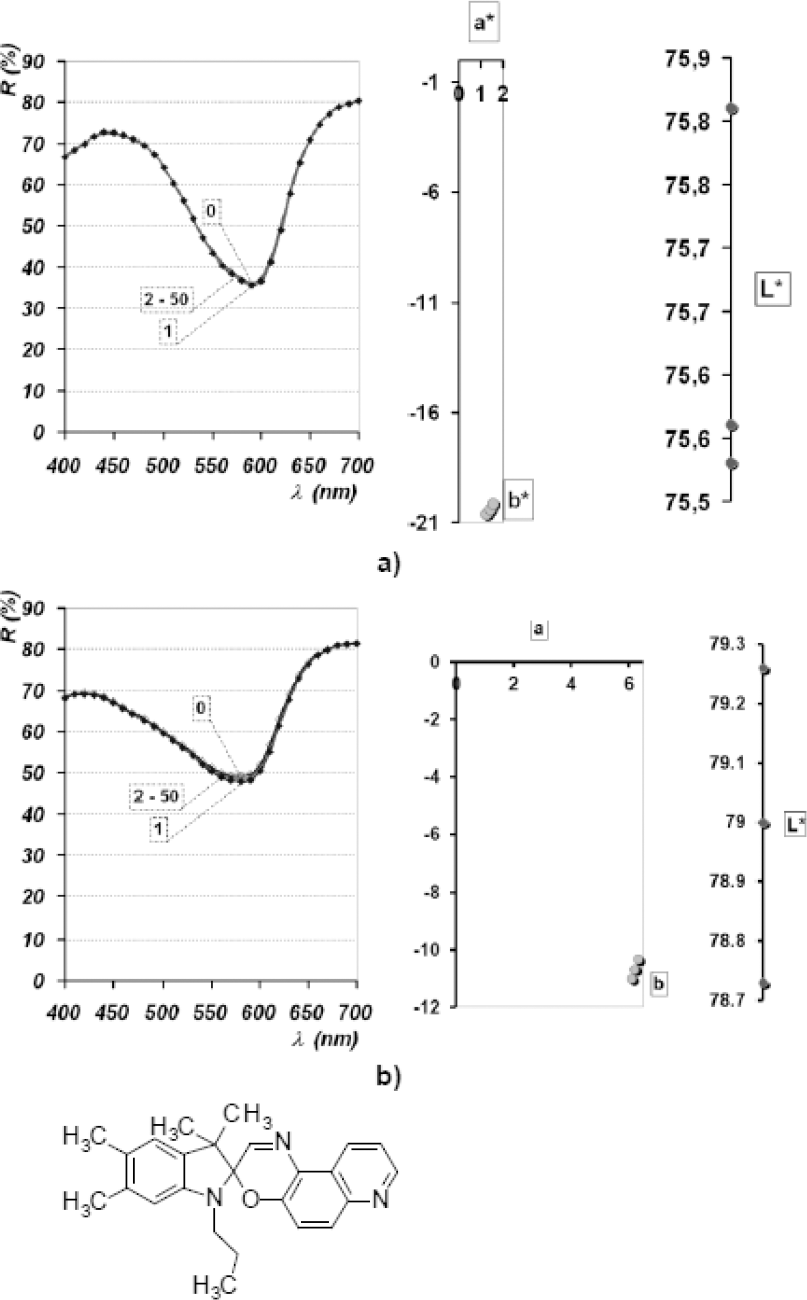
The obtained coloristic parameters were considered to be a direct measure of dye stability. For dye PC I under neutral pH conditions, deep colorations were obtained (with a chromacity value C* ≈ 20), while the MC form of the investigated spiroxazine dye was formed as a response to UV irradiation (Fig. 6). Measurement time intervals used in Figs. 6–9 are given in Table I. Upon removal of the UV source, a return reaction took place, implying formation of the SP form and reversion into the basic, unexcited state of the molecule. More significant changes during this reversion, in terms of color hue (h°), did not take place, which was confirmed through the obtained a* and b* values. Within all measured time intervals, the process of reversion had linear correlation and a high correlation coefficient. Lightness values (L*) ranged between 79 and 92, correlating to measured a* and b* values as lightness increased with loss of coloration. Setting the pH to 4.5, the reflectance value of the UV-irradiated spot increased significantly compared to that obtained by dissolving in AC at pH 7. Coloration loss (formation of SP form) was achieved in a significantly shorter time period. After only 15s, following UV source removal, reflectance values approached those of the unirradiated sample. Values of h° formed a line, while all coloristic parameters approached the ideal linear function with a high correlation coefficient (Fig. 6).
Measurement Time Intervals
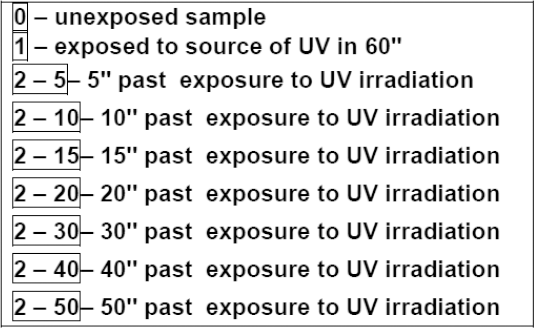
Reflectance spectra and L*a*b* diagrams of dye spots deposited onto Si plates of dye PC I dissolved in AC; a) pH neutral; b) pH 4.5.
Reflectance spectra and L*a*b* diagrams of dye spots deposited onto Si plates of dye PC III dissolved in AC; a) pH neutral; b) pH 4.5.
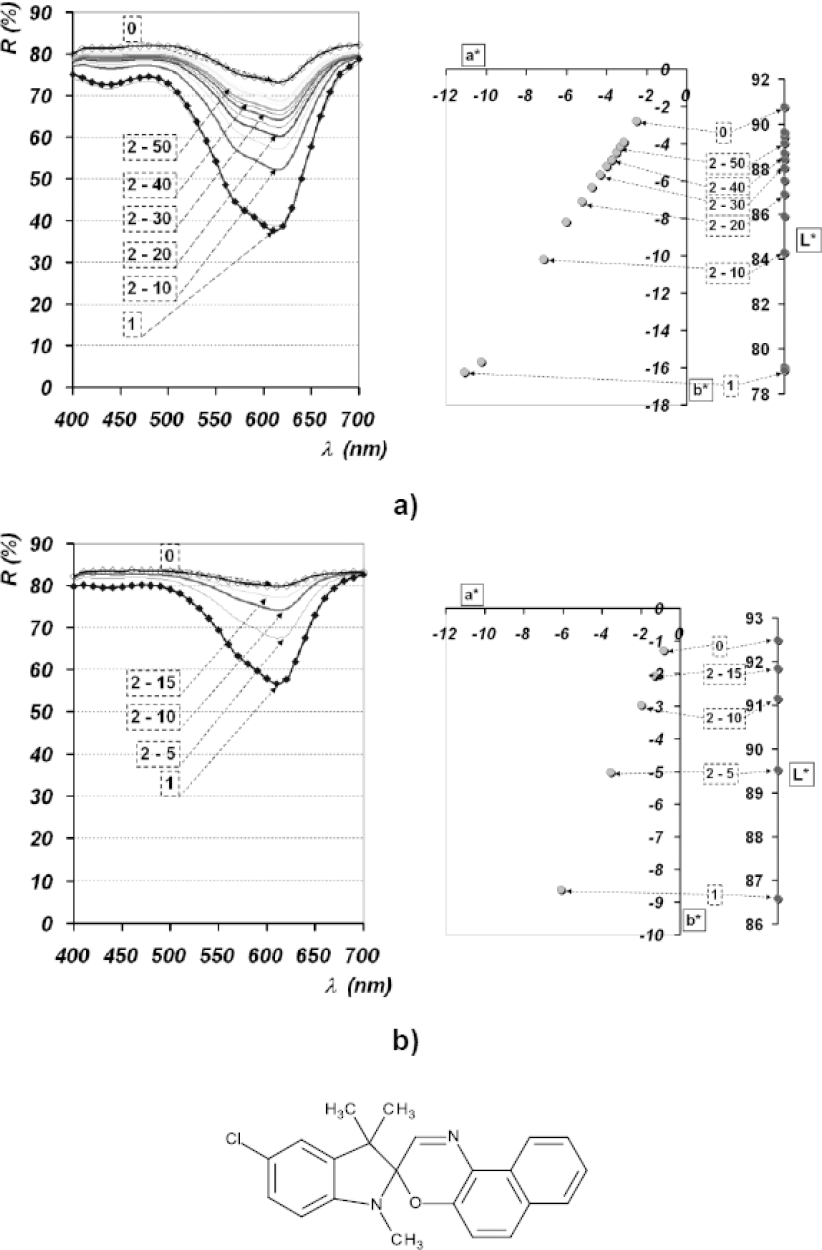
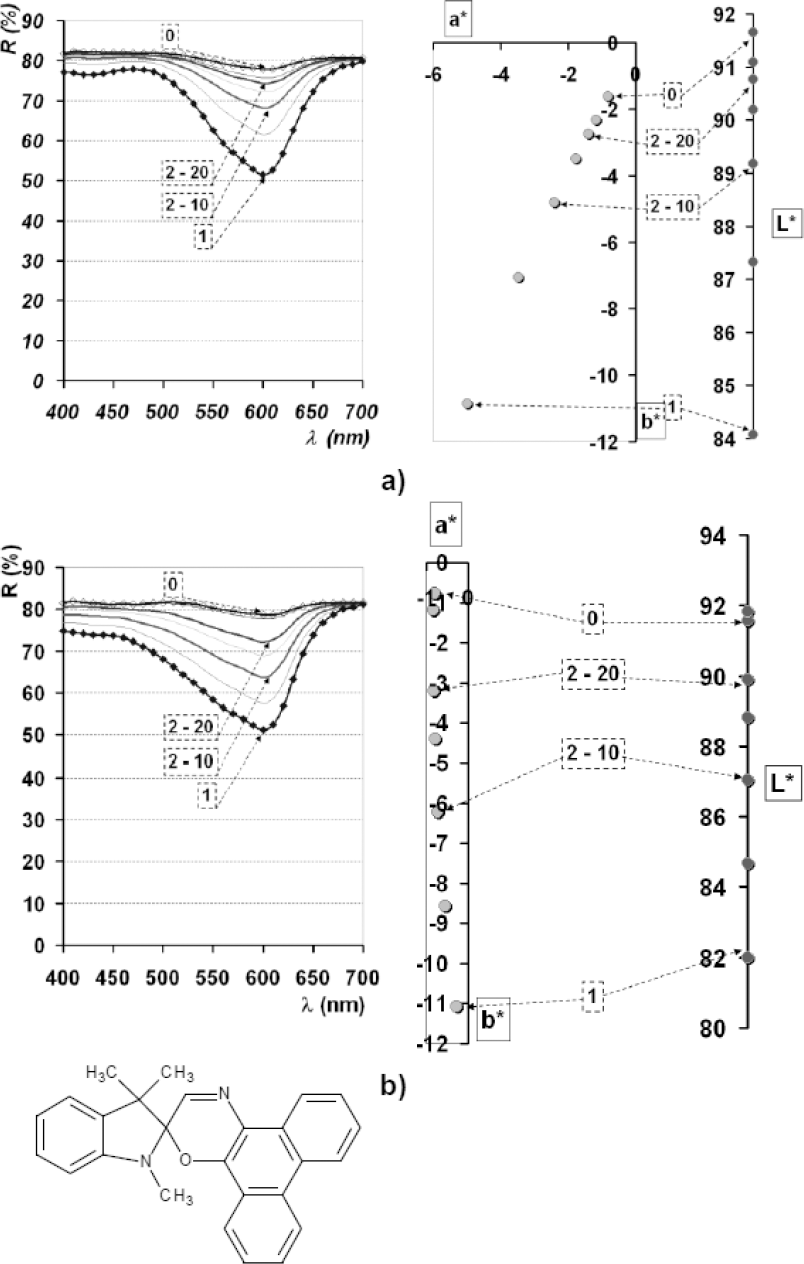
Reflectance spectra and L*a*b* diagrams of dye spots deposited onto Si plates of dye PC V dissolved in AC; a) pH neutral; b) pH 4.5.
Reflectance spectra and L*a*b* diagrams of dye spots deposited onto Si plates of dye PC VII dissolved in AC; a) pH neutral; b) pH 4.5.
Comparing the results with visual assessment, a slower rate of reversion from the MC to the SP form was noticed, implying the systems inertness. Also, values obtained at predetermined time intervals pointed to the property of “memory,” while a complete reversion into the basic, SP form did not take place (Fig. 6).
For spiroxazine dye PC III, similar behavior to that of PC I was observed (Fig. 7). Differences between these two dyes were in the reversion rate (faster for PC III). Within 20s after removal from the UV source, values of coloristic parameters approached those measured for the basic SP form. pH did not influence coloration depth, while C* values did not change significantly, although, the color hue (h°) shifted bathochromically The reversible reaction from the MC into the SP form was described by a linear function (Fig. 7).
For the commercially available PC V dye, a more significant photochromic effect was not observed (Fig. 8). However, the chromatogram shown in Fig. 8 points to a significant photochromic response of the dye containing the spiroxazine chromophore, with a fast rate of reversion from the MC to the SP form.
The spironaphtoxazine dye PC VII showed a significant photochromic response, as seen in the chromatogram (Fig. 9). The differences between reflectance values, before and after UV irradiation, were around ΔR = 27 (at λmim = 600 nm). Values of coloristic parameters pointed to unchanged h° values, while formation and loss of coloration were described by a line going through measured a* and b* parameters and the point of achromacity (a* = 0 and b* = 0). Setting the pH to 4.5 caused a hypsochromic shift.
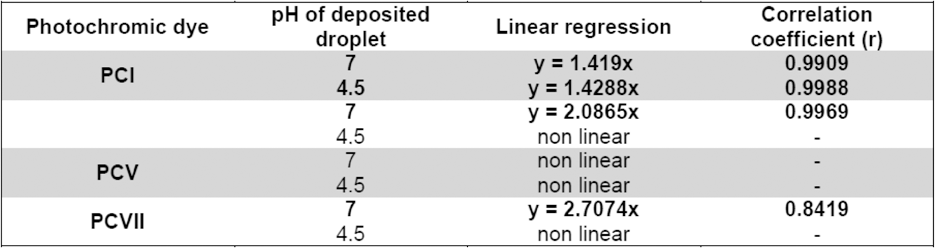
A summary of the regression and correlation results for dyes PC I, PC V, and PC VII at different pH values from the preceding experiments are given in Table II.
Summary of Regression and Correlation
Photochromic Fatigue
This part of the investigation describes the effect of applied photochromism and inherent photodegradation on the dyes tested. Considering the large amount of published research dealing with photodegradation of photochromic dyes in solution,26-28 the results in this paper deal with these issues on textile materials. Therefore, analysis of the results obtained following consecutive exposure of polyamide textile material to cycles of UV irradiation was performed.
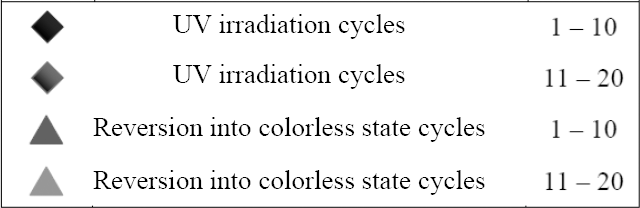
Generally, all investigated samples showed significant photochromism, regardless of the dye chemical structure or the concentration of dye in the dyebath. Being irradiated by UV in consecutive cycles (60s exposure), samples dyed with 0.1 g/L of dye in the dyebath were reported to be the most prone to photodegradation, as coloristic parameters were grouped as indicated in Table III. It can be concluded that samples irradiated between 11 and 20 cycles were less photochromic than those irradiated up to 10 times. This confirmed that dye photodegradation occurred at the molecular level.
Explanation of Symbols
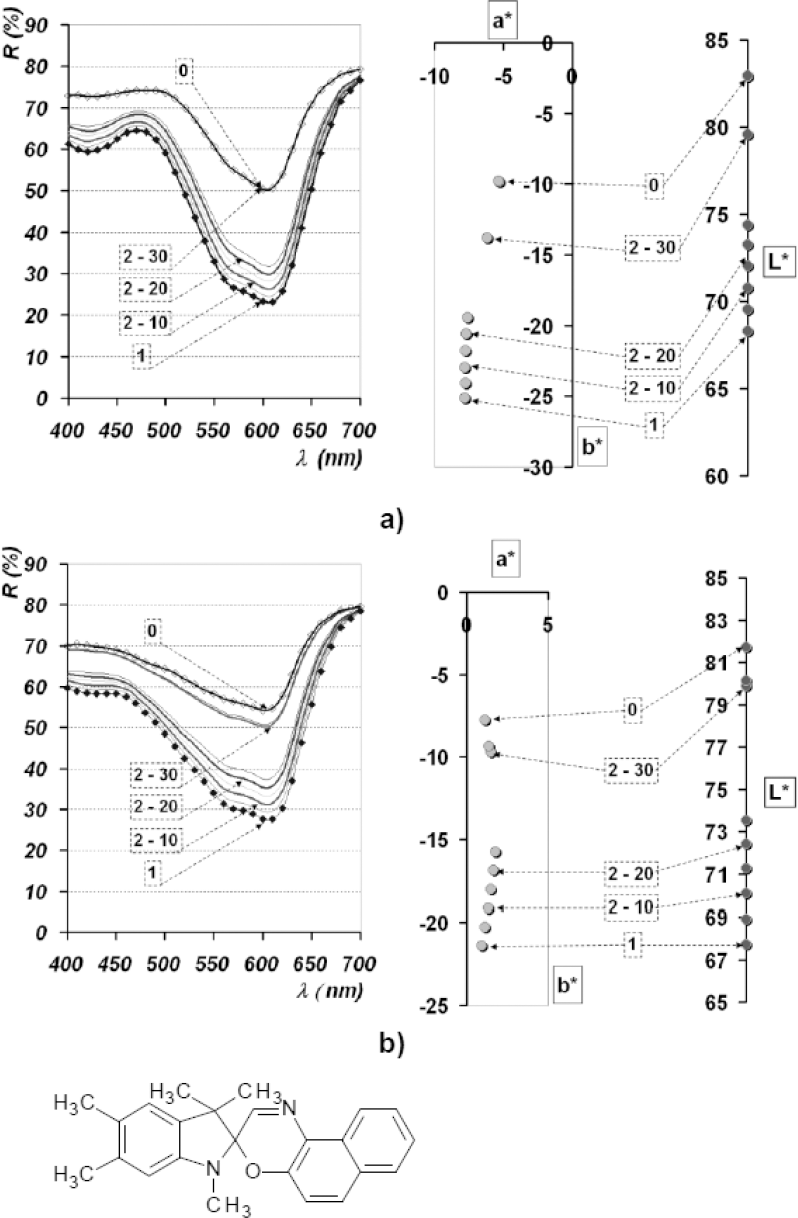
Samples dyed by the spironaphtoxazine dye PC V were of blue greenish hue, highly photochromic, and showed the largest chromacities of the colored state of the molecule (MC) for the smallest amount of dye (0.1 g/L) in the dyebath (Fig. 10).
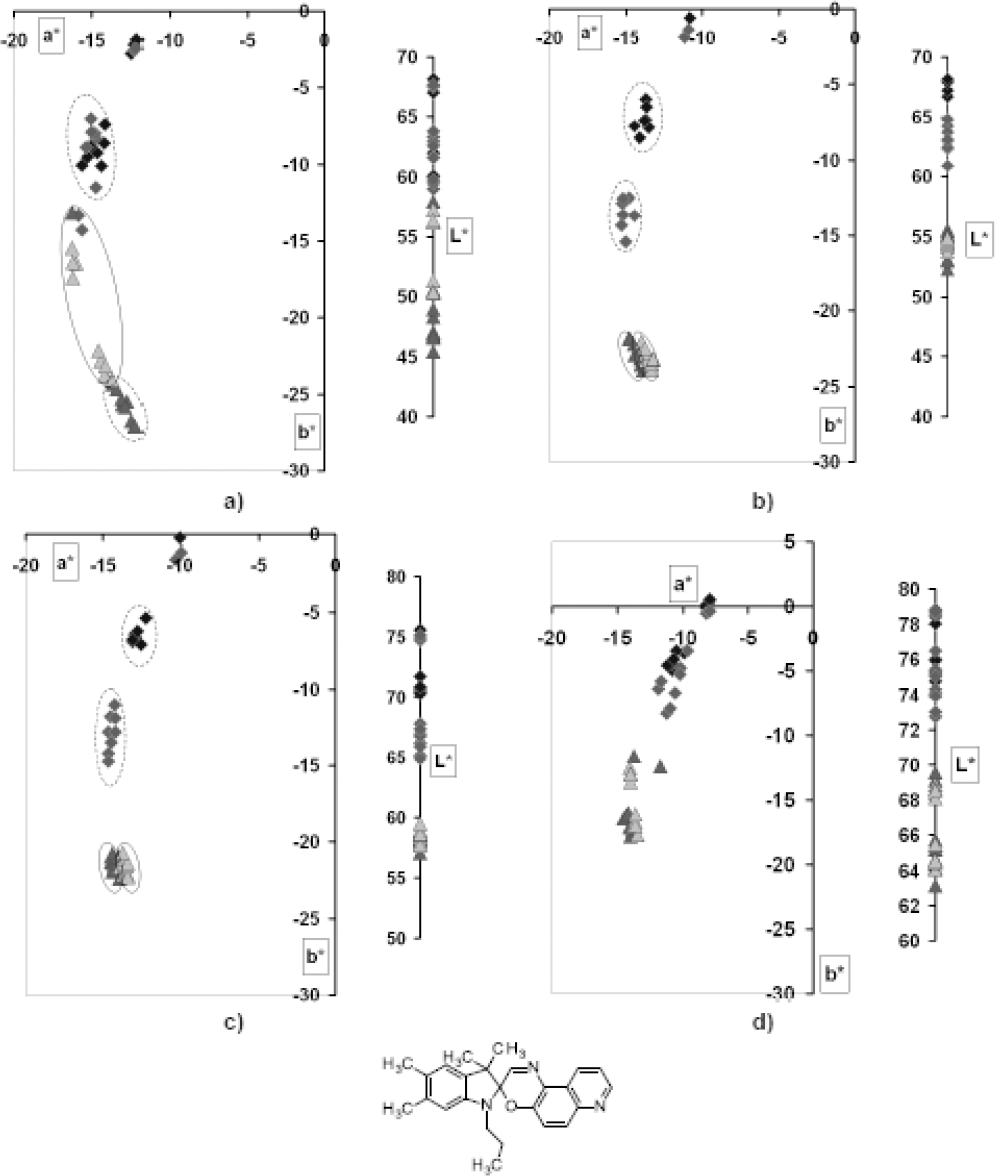
L*a*b* diagrams of photochromic PA dyed by PC V; variables were dye concentration and exposure cycle; a) Cb = 0.1%, b) Cb = 0.3%, c) Cb = 0.5%, d) Cb = 1%.
Similar to the PA samples obtained by dyeing with the PC V dye, samples obtained by dyeing with the spironaphtoxazine dye PC VII were of a blue greenish hue. Visible changes associated with photodegradation were noticed in hue and chromacity (Fig. 11). A more significant range of dye concentrations (0.1 g/L to 0.4 g/L) did not influence the measured coloristic parameters.
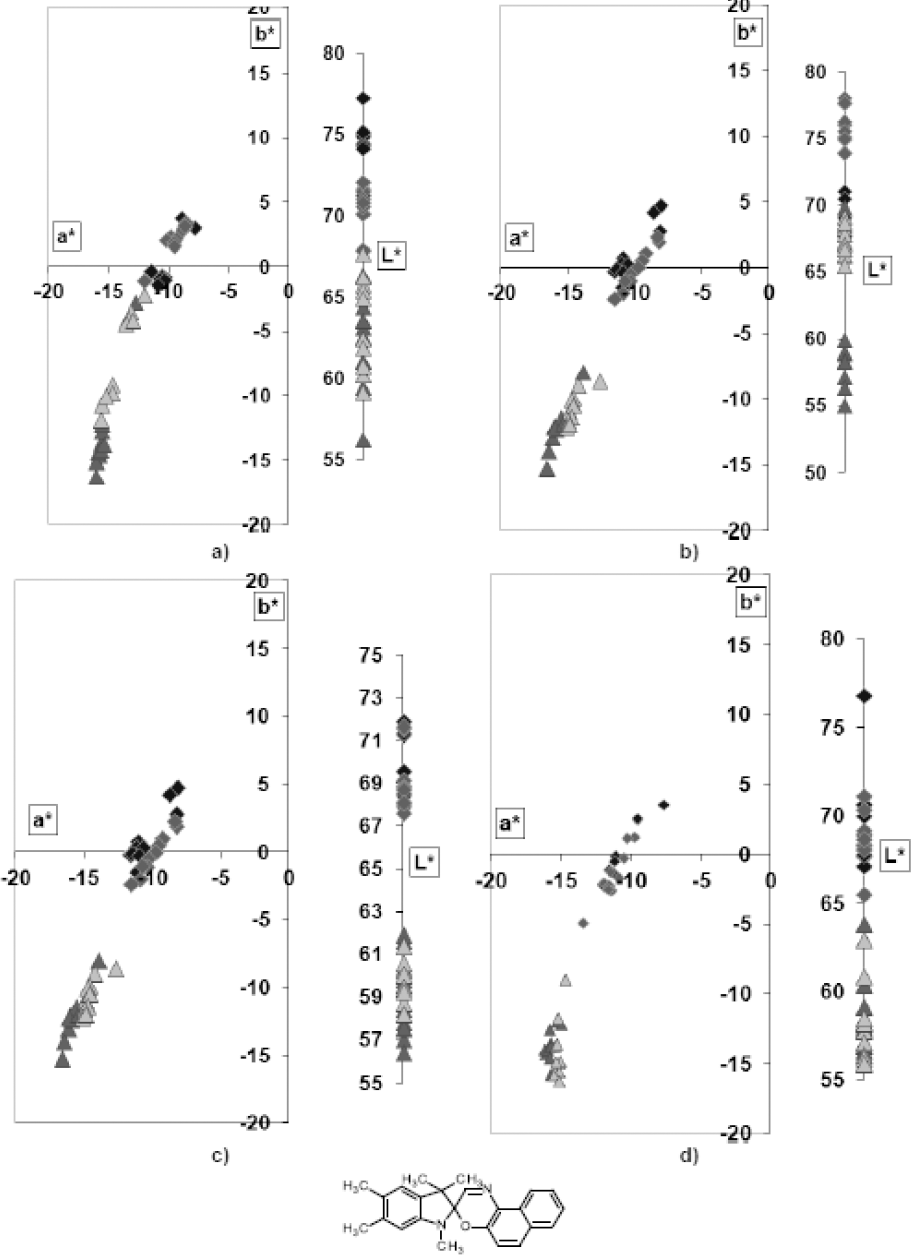
L*a*b* diagrams of photochromic PA dyed by PC VII; variables were dye concentration and exposure cycle; a) Cb = 0.1%, b) Cb = 0.3%, c) Cb = 0.5%, d) Cb = 1%.
Statistical Analysis
Polyamide fibers (PA) dyed using commercial photochromic dyes PC V and PC VII, were statistically analyzed (Figs. 12 and 13, respectively). Statistical methods were to mathematically confirm photochromic properties of the investigated samples.
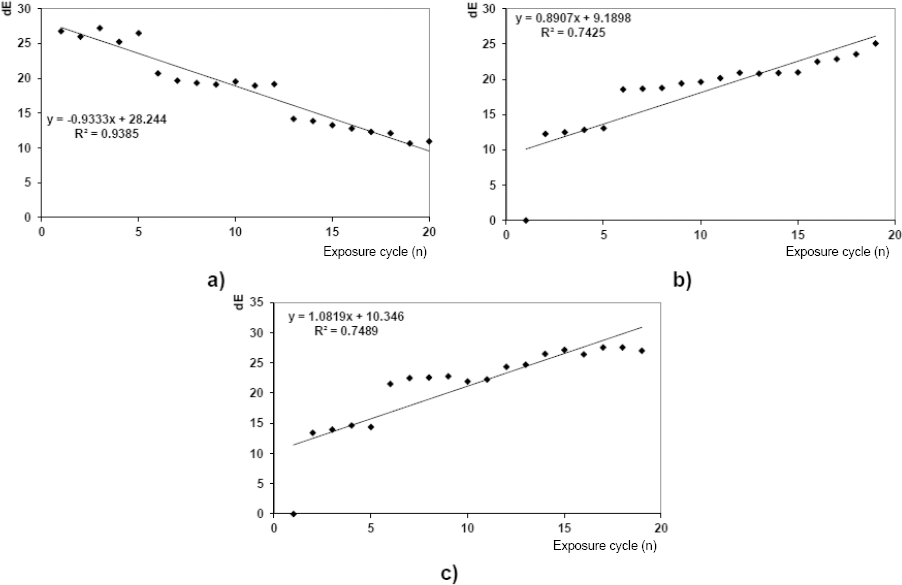
Regression and correlation of overall ΔE values for PA samples dyed by PC V (Cd = 1%); a) in between each UV irradiation exposure cycle, b) between the sample that was never exposed to UV irradiation and sample in its unexcited state, and c) between the sample exposed to UV irradiation only one time (for 60 s) and sample in its excited state.
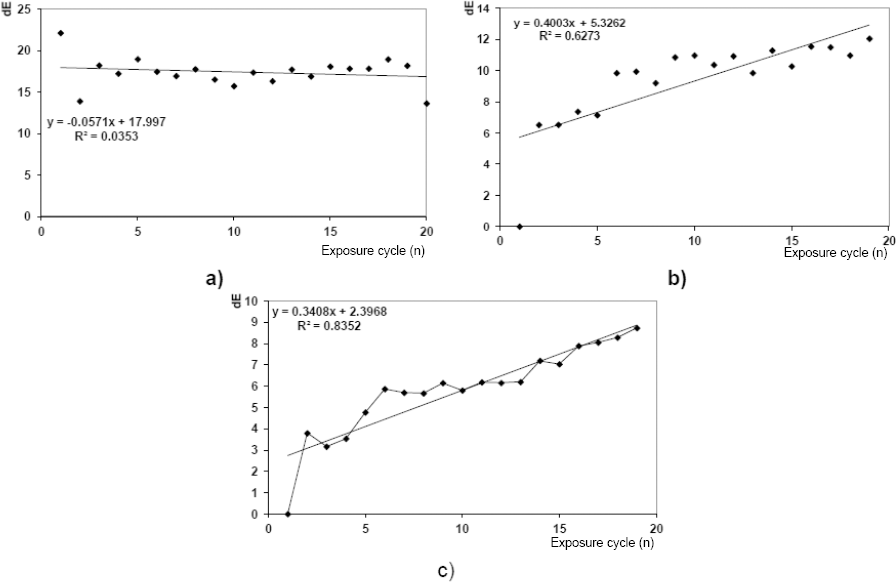
Regression and correlation of overall ΔE values of PA samples dyed by PC VII (Cd = 1%); a) in between each UV irradiation exposure cycle, b) between the sample that was never exposed to UV irradiation and sample in its unexcited state, and c) between the sample exposed to UV irradiation only one time (for 60 s) and sample in its excited state.
Correlation and regression analyses of photo chromic samples were used to determine whether photodegradation took place as a direct result of UV irradiation. The overall color difference value (ΔE) was used to determine the degree of photodegradation. Perfoming photodegradation studies and setting different measured values as reference standards and samples (ΔE = ΔESAMPLE - ΔESTANDARD equation), according to the method described in this paper, gave an indirect indication of the samples lifespan.
Overall color differences (ΔE) in between each exposure cycle to UV irradiation gave information as to whether photochromism remained active.
The smallest oscillations in ΔE values over all irradiation cycles were noticed for samples dyed at the lowest dye concentration in the dyebath. The ΔE value measured at the beginning of the measurement (i.e., between the sample which had not been irradiated by UV (standard) and a sample which had been irradiated only once (sample)) was two times less than those obtained by dyeing with larger amounts of dye in the dyebath.
Conclusion
The STC-01 UV chamber represents a major contribution to the development of instruments designed specifically to study photochromic responses from investigated materials. It allowed the analyst to view and perform spectrophotometric measurements at the same time. Potentially, it could be coupled with different types of portable spectrophotometers and thus reduce color loss caused by moving the sample from the chamber onto the measurement stage of a standalone spectrophotometer. With a defined source of UV irradiation emitted from the lamp tubes of the chamber, an analyst can determine which UV region caused the photochromic dye molecules to shift from the colorless SP form into the colored MC form. This technology may help in the development of anti-counterfeit and other security devices.
Dyes investigated in this paper were found to react best (according to their CIELAB parameters), to a source of UV-A irradiation. As the source of UV-A irradiation was a lamp with significant emission peaks in both UV and visible light regions (365, 404, 435, and 545 nm), it was inconclusive whether photochromism was induced solely by UV, and what level of UV was required to initiate a reaction. Resolving these ambiguities remains the focus of future work.
Another major contribution of the paper is the analytical method based on reflectance spectrophotometry, in which dye-solvent interactions, assuming inertness of the matrix (in this case Si-plate) were investigated. The method was qualitative and would need further development to establish dependencies between the obtained CIELAB values and dissolved dye concentration. Nevertheless, the method was found to be a quick and easy way of confirming photochromic properties of spironaphtoxazine dyes (PC I and III). Coupled with spectrophotometric measurement, CIELAB graphs were obtained. CIELAB values of the investigated spironaphtoxazine dyes PC I and III indicated that these dyes would be suitable for a device based on photochromism. Unfortunately, the same conclusion could not be made for the spirobenzopyran dye PC V on account of its unpredictability (Fig. 7).
Use of the Si-matrix proved the existence of a “memory effect” in deposited photochromic dyes, (exhibited by the time interval required to revert into a colorless SP state). The increased memory effect of the PC III dye was ascribed to the higher number of conjugated double bonds present in the colored MC form.
The behavior of the dyes studied was proven to correlate that of typical disperse dyes, as photochromism was conditioned by the presence of solvent in the case of the Si-matrix. The half life of the colored (MC) form of the spironaphtoxazine dye on the Si-matrix was found to be ∼20 seconds, which implied the existence of a certain “memory” effect.
Based on the pitch of the regression trends and correlation analysis of color differences (ΔE = ΔESAMPLE - ΔESTANDARD) between the PC V and PC VII dyed PA fiber samples that were n + 1 times exposed and the samples exposed n times to a UV irradiation source, existence of a certain level of photodegradation was shown. The described statistical approach and analysis was an indirect indicator of the life span of the photochromic material.
If ideal photochromism is defined by a clearly visible color change from colorless to colored, then according to the ΔE values shown in Figs. 12 and 13, PC V was a better choice for PA substrate dyeing than PC VII. However, the observed ΔE values and the differences among them implied a level of fatigue that compromised important properties of photochromic systems (i.e., predictability and controllability). That being said, the observed ΔE values for both dyes did not indicate their preclusion for use in a way described in this paper. This conclusion was based on a small number of cycles (20) and should be confirmed through further research.