
Abstract
Several autoinflammatory disorders such as Muckle-Wells syndrome are characterized by mutations in the NALP3/cryopyrin gene. NALP3 and NALP1 proteins can assemble to inflammasomes that activate caspase-1, resulting in the processing of proinflammatory cytokines IL-1β and IL-18. The present study was designed to determine which cells and tissues express NALP1 and NALP3. Monoclonal antibodies were developed and their use revealed distinct distribution profiles of NALP1 and NALP3. Granulocytes, monocytes (very weakly), dendritic cells, and B and T cells all express NALP1 and NALP3. Highest levels of NALP1 are found in T cells and Langerhans cells. Furthermore, NALP1 is present in glandular epithelial structures such as stomach, gut, lung, and, surprisingly, in neurons and testis. In contrast to NALP1, NALP3 shows a more restricted tissue distribution with expression mainly in non-keratinizing epithelia in the oropharynx, esophagus, and ectocervix. Moreover, NALP3 expression is found in the urothelial layer in the bladder. Likewise, a difference in subcellular distribution between NALP1 and NALP3 is observed because NALP1 is localized mainly in the nucleus, whereas NALP3 is predominantly cytoplasmic. We propose that the presence of NALP3 in epithelial cells lining the oral and genital tracts allows the rapid sensing of invading pathogens, thereby triggering an innate immune response.
I
Little continues to be known about the natural stimuli that lead to the assembly and activation of inflammasomes. Similar to Toll-like receptors, activation of inflammasomes is proposed to occur by recognition of ligands through leucine-rich repeats (LRRs) present in the NALP proteins. The only bacterial components reported to activate the NALP3 inflammasome are RNA and peptidoglycan, a cell wall constituent present in both Gram-positive and -negative bacteria (Martinon et al. 2004; Kanneganti et al. 2006), whereas flagellin appears to activate the IPAF protein (Molofsky et al. 2006; Ren et al. 2006). In addition to these bacterial PAMPs, endogenous danger signals released from dying cells such as gout-associated uric acid crystals, calcium pyrophosphate dihydrate crystals found in pseudogout, or ATP activate caspase-1 in a NALP3-dependent manner (Mariathasan et al. 2006; Martinon et al. 2006).
Excessive or uncontrolled IL-1β production is harmful to the host and is therefore tightly controlled. Mutations in the gene coding for NALP3 have been associated with several autoinflammatory disorders such as Muckle—Wells syndrome, familial cold urticaria, and chronic infantile neurological cutaneous and articular autoinflammatory disease (Hoffman et al. 2001; Aganna et al. 2002; Kastner 2005). These disorders are characterized by recurrent episodes of fever and serosal inflammations due to increased production of IL-1β (Agostini et al. 2004). They can be successfully treated with the natural IL-1 inhibitor IL-1ra (Anakinra) (Hawkins et al. 2004; Goldbach-Mansky et al. 2006).
Although several studies have investigated the role of NALPs using biochemical or genetic approaches, data on cell type and tissues that express these proteins are still conspicuously lacking. Based on the frequency of Expressed Sequence Tag (EST) clones and tissue Northern blots, NALP1 appears to be expressed rather ubiquitously (Chu et al. 2001; Hlaing et al. 2001), whereas NALP3 expression is more restricted. Mostly peripheral blood leukocytes, in particular neutrophils, the skin, and the eye, were reported to express NALP3 mRNA (Hoffman et al. 2001; Anderson et al. 2004), consistent with its role as a pro-inflammatory protein.
To study the expression of both NALP1 and NALP3 proteins in various human tissues, we developed a panel of monoclonal antibodies (MAbs) directed against NALP1 and 3. Tissue distribution of NALP1 and 3 shows a distinct and non-overlapping distribution, suggesting different roles in separate cell types.
Materials and Methods
Generation of MAbs
Cloning of NALP1 and 3 was described previously (Agostini et al. 2004). cDNAs encoding the full-length NALP 1 and 3 proteins were used for transient expression in 293T cells. For the production of MAbs, GST-fusion proteins were expressed in E. coli and isolated by means of glutathione-Sepharose columns. MAbs were generated in Balb/c mice according to standard protocols and identified by screening culture medium of the hybridomas by means of ELISA plates coated with the recombinant NALP1 and 3 proteins, respectively. Selected anti-NALP1- and −3-producing hybridomas were subcloned by three cycles of limiting dilution. MAbs were purified from conditioned medium by protein G-Sepharose affinity chromatography. MAbs used in this study [MAb to NALP1 (Nalpy1–4) and MAb to NALP3 (Nalpy3-b)] are now commercially available from Alexis Biochemicals (Lausen, Switzerland).
Immunohistochemical Analysis
Slides with sections of formalin-fixed, paraffin-embedded normal human tissues were obtained from the tissue bank of the Department of Pathology, University Medical Center Utrecht, The Netherlands. All tissues were sampled from surgical specimens within 2 hr of resection. Tissues were processed routinely by fixation in 10% formalin for 18 hr and subsequently embedded in paraffin and/or directly snap frozen in liquid nitrogen. Four-μm-thick sections were mounted on poly-L-lysine- coated slides. Cytospins of NALP1, NALP3, or mock-transfected 293T cells (see below) were fixed in 10% formalin for 1 hr.
The following protocol was used for staining on formalin-fixed, paraffin-embedded slides and the cytospin preparations. Endogenous peroxidase activity was blocked by incubation for 30 min with 0.3% (v/v) H2O2 in methanol (not for the cytospin preparations). Tissue sections and cytospins were subjected to antigen retrieval by boiling in 0.01 M sodium citrate, pH 6, for 15 min in a microwave oven and incubated with the different primary antibodies for 1 hr at room temperature. Slides were then incubated with biotinylated goat anti-mouse antibodies (diluted 1:250; Vector Laboratories, Burlingame, CA) for 45 min washed and incubated with streptavidin-peroxidase (diluted 1:400; Immunotech, Beckman-Coulter, Fullerton, CA). Bound antibodies were visualized by incubation with diaminobenzidine/H2O2. Slides were counterstained with hematoxylin and mounted.
For fresh frozen tissues, the following protocol was used. Slides or cytospins were fixed with acetone for 10 min and incubated for 1 hr at room temperature with the different primary antibodies. Thereafter, preparations were fixed with 4% buffered formaldehyde for 10 min and then developed with powervision anti-mouse peroxidase-conjungated antibody (diluted 1:100; Klinipath, Duiven, NL) for 45 min. Bound antibodies were visualized as described for the paraffin sections. Between each separate step, slides were washed with PBS. Negative control slides were stained with mouse IgG of the appropriate subclass.
Transfection and Immunoblotting
Cells (2 × 10⁵ 293T) were grown in 25 cm2 culture flasks for 24 hr in DMEM with 10% heat-inactivated FBS, antibiotics, and glutamine. Medium was refreshed just prior to transfection with 3.8 μg isolated pCR3–NALP1wt or pCR3-NALP3wt. Control cells were transfected with an empty pCR3 vector. Transfection was performed with FuGENE 6 transfection reagent (Roche Molecular Biochemicals; Indianapolis, IN). FuGENE 6 transfection reagent (μl) to plasmid DNA (μg) was used at a ratio of 5:1. At 48 hr after transfection, cells were detached with PBS, 2.5 mM EDTA, and washed twice with PBS. An aliquot of the cells was resuspended in PBS plus 1% (w/v) BSA and used to prepare cytospins. The remaining cells were lysed in lysis buffer (PBS, 1% w/v, NP-40) at a concentration of 3 × 10⁶ cells/ml. After lysis for 30 min on ice, the lysate was cleared by centrifugation and stored at −20C until further use. Cell lines (Jurkat, THP-1) and primary cells used were similarly lysed.
About 15 μg of cell lysate from transfected 293T cells was resolved by electrophoresis on a 10% SDS-polyacrylamide gel under reducing conditions. After electrophoresis, proteins were transferred to nitrocellulose membranes by electrophoretic blotting. Membranes were then blocked for 1 hr in blocking buffer (5% w/v skim milk powder, 0.5% w/v BSA, and 0.1% v/v Tween-20 in PBS). Subsequently, membranes were incubated for 2.5 hr or overnight with either MAb NALP1 Y1–4 (1 μg/ml) or MAb NALPY3b (5 μg/ml) diluted 1:1000 in blocking buffer, followed by horseradish peroxidase-conjugated rabbit anti-mouse Ig (Jackson ImmunoResearch Laboratories; West Grove, PA). Bound antibodies were visualized with a chemiluminescence development reagent (ECL system; Amersham, Uppsala, Sweden) according to the manufacturer's instructions.
Results
Characterization of MAbs Raised Against Human NALP1 and NALP3
MAbs were generated against human recombinant NALP1 (aa 1–98, pyrin domain) and the short form of NALP3 lacking the LRRs (Martinon et al. 2001). In the overlapping region, the identity of the sequences is 4%. Three MAbs against NALP1 (NALP1 Y1–2, NALP1 Y1–3, NALP1 Y1–4) and four MAbs against NALP3 (NALP3a, NALP3b, NALP3c, NALP3d) specifically recognized the respective antigens (Figure 1 and data not shown). Of those, NALP1 Y1–4 and NALP3b gave the strongest and most specific signal in Western blots when tested on cell extracts from cells that overexpressed the respective proteins (Figure 1) and for this reason were primarily used in this study. NALP1 Y1–4 recognized a 160-kDa band in lysates of NALP1-transfected 293T cells, whereas no such band was detected in NALP3-transfected 293T cells. MAb NALP3b reacted with a 120-kDa and a 75-kDa band in NALP3 and NALP3short (NALP3s, lacking the LRRs)-transfected 293T cells, respectively, and did not show reactivity against NALP1-transfected cells.
Immunocytochemistry with transfected 293T cells supported specificity of the MAbs. The three NALP1 MAbs showed strong reactivity to 293T cells transfected with the full-length NALP1 cDNA but not against NALP3-transfected 293T cells. A representative staining is depicted for the MAbs NALP1 Y1–4 (Figure 1). All four MAbs against NALP3 showed a strong cytoplasmic reactivity with NALP3-transfected but not with NALP1-transfected 293T cells (Figure 1). In contrast to NALP1, NALP3 staining showed a coarse granular aspect. No nuclear staining was observed in NALP1-or in NALP3-transfected cells. Mock-transfected cells showed no staining with either antibody (not shown).
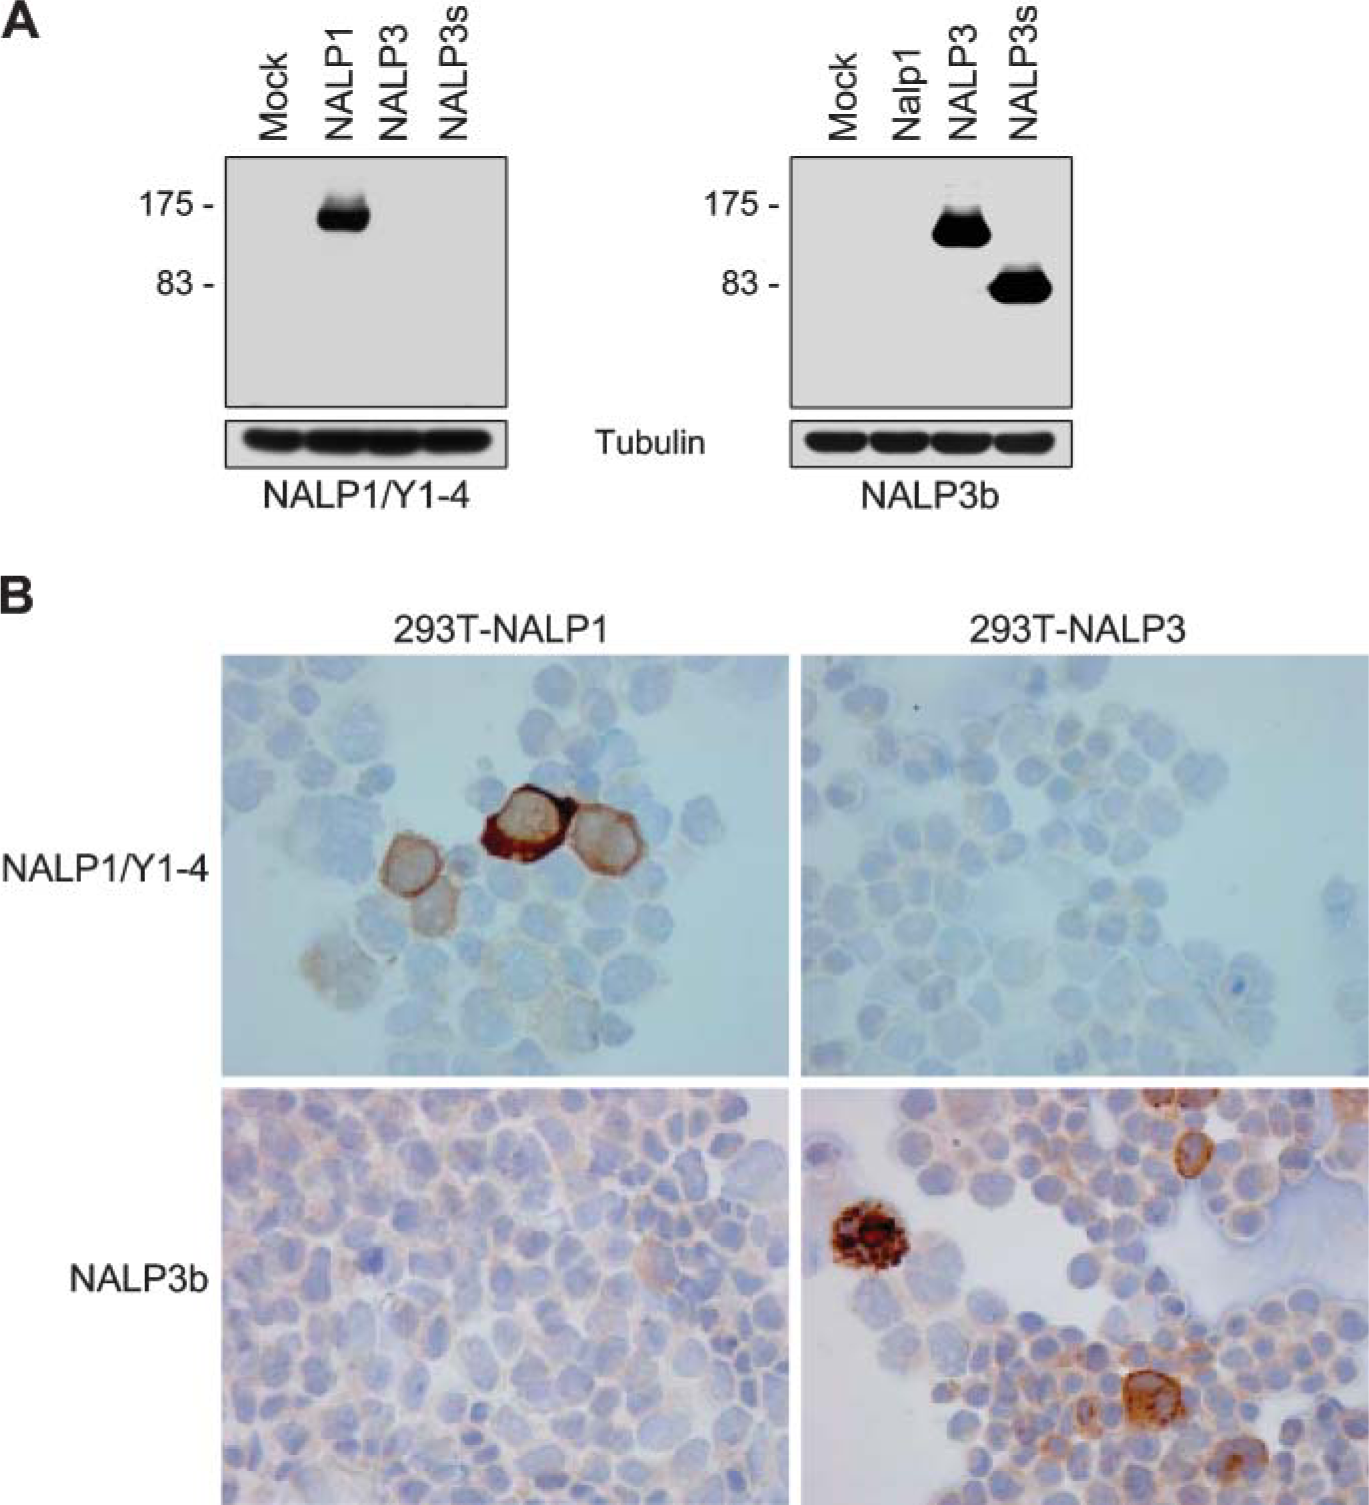
Reactivity of anti-NALP1 and NALP3 monoclonal antibodies (MAbs). (
NALP1 and NALP3 Proteins Are Abundantly Expressed in Myeloid Cells and Lymphocytes
Previous studies have shown a widespread expression of NALP1 mRNA in many tissues such as heart, thymus, spleen, and intestine (Chu et al. 2001; Hlaing et al. 2001). Particularly strong expression was reported for granulocytes and the peripheral blood mononuclear fraction. High mRNA levels in neutrophils and macrophages were also found for NALP3 (Anderson et al. 2004). We could confirm this expression pattern at the protein level. The THP1 cell is of monocytic origin and both NALP1 and NALP3 cells were highly expressed (Figure 2). For NALP1, the presence of five isoforms has been reported. The shorter forms lack several LRRs. Two bands of NALP1 at an apparent molecular size of ∼160 kDa and 70 kDa were detectable (Figure 2). The high molecular weight band migrated slightly faster than the corresponding control NALP1 containing 12 LLRs, suggesting that it may correspond to one of the isoforms described that lacks LRRs (Hlaing et al. 2001). In contrast, the 70-kDa band is too small to match one of these isoforms and either corresponds to a processed form of the 150-kDa form or, alternatively, to an as yet undescribed NALP1 isoform that most likely lacks all LRRs. A species of similar size has been previously detected in the thymus (Chu et al. 2001). Interestingly, only the short form was present in Jurkat T cells, whereas both forms are detectable in THP1 cells.
Two major bands were also detectable in cell lines when blots were assayed with the NALP3b MAb. The lower band migrating at 75 kDa at most likely corresponds to NALP3short (which lacks all the LRRs) (Martinon et al. 2001) as it comigrates with NALP3-short overexpressed in 293T cells. The high molecular band (130 kDa) often migrated as a doublet, suggesting that it corresponded to the long isoform of NALP3 and to the isoform DEL4 that lacks two LRRs (O'Connor et al. 2003).
Both NALP1 and NALP3 were also abundantly expressed in primary immune cells (Figure 2). Purified neutrophils, monocytes (very weakly), dendritic cells (DCs), and B and T lymphocytes all expressed NALP1. In contrast to cell lines, however, the 150-kDa species of NALP1 was the most detectable, whereas in the case of NALP3, the short form (NALP3s) was predominant. Surprisingly, a band migrating slightly faster than NALP3s was exclusively detectable in DCs.
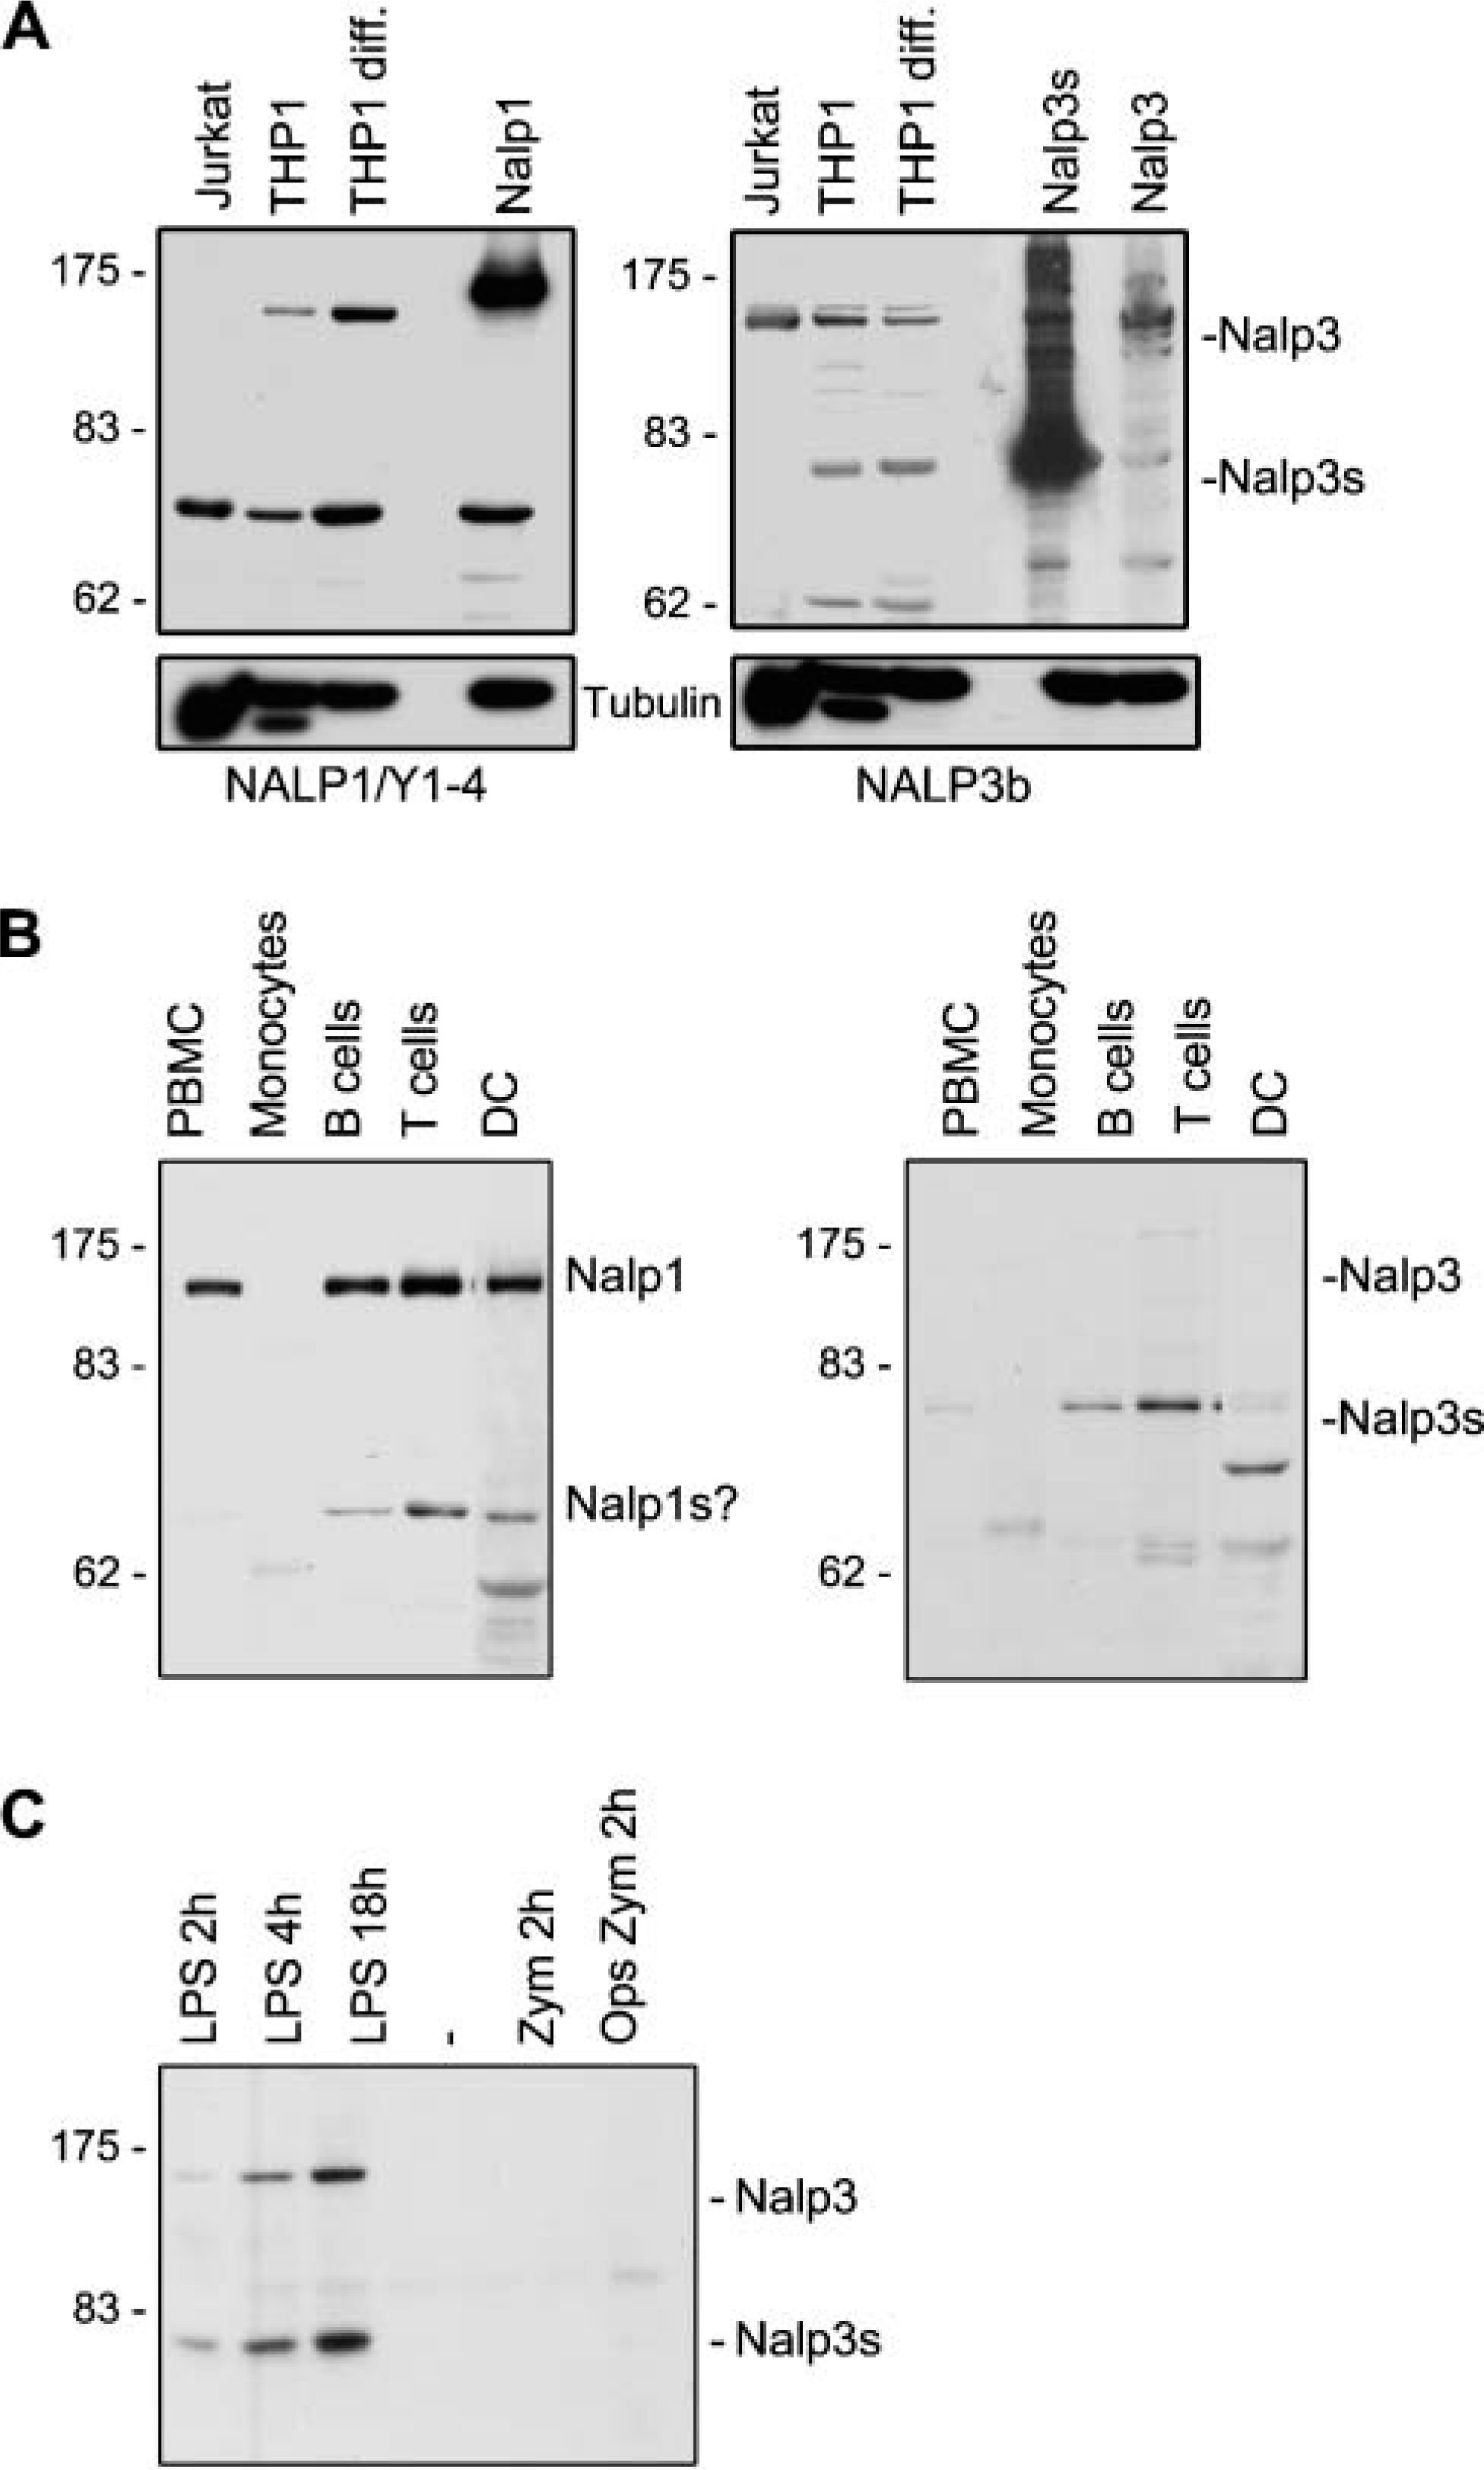
Expression of NALP1 and NALP3 isoforms in granulocytes and monocytes. Various cell lines (
In mice, NALP3 mRNA is highly inducible by lipopolysaccharides (LPS) in bone marrow-derived macrophages (Sutterwala et al. 2006). In accordance with this observation, we found expression of NALP3 protein in human neutrophils only when cells were activated with LPS (Figure 2). Both NALP3 forms were induced.
NALP1 Is Highly Expressed in the Lymphoid Tissue by T-Lymphocytes, Macrophages and DCs and Shows a Cytoplasmic-Nuclear Distribution
MAbs were tested for their ability to detect NALP 1 in fresh-frozen or paraffin-embedded human tissues. NALP1 Y1–4 showed a strong reactivity on paraffin-embedded tissues after antigen retrieval. On fresh-frozen samples, NALP1 Y1–4 also showed, albeit weak, staining (data not shown).
Analysis of NALP1 tissue distribution (Figure 3) by immunohistochemistry showed that in lymphoid organs like tonsil, lymph node, and spleen a strong nucleocytoplasmic staining for NALP1 was present in mononuclear cells in the T-cell areas, whereas cells in the B-cell areas (lymph node follicle) were negative. T cells present in organ-associated lymphoid tissues like mucosal-associated lymphoid tissues were also positive for NALP1 as indicated by NALP-1-positive intra-epithelial lymphocytes present in the villi of the small intestine (Figure 3). Interestingly, certain macrophages were positive, such as alveolar macrophages in the lung (Figure 3), whereas others were negative (starry sky macrophages in the follicular center, Kuppfer cells in the liver). Most DCs such as germinal center (Figure 3) and interstitial DCs were NALP1 negative. However, Langerhans cells present in the mucosa (data not shown) as well as in the skin did express NALP1 (Figure 3).
Three NALP3 MAbs (NALP3a, NALP3b, and NALP3c) were tested for their reactivity with formalin-fixed, paraffin-embedded tissues as well as with fresh frozen tissues. All three MAbs reacted mainly with fresh frozen tissue of which NALP3b displayed the strongest staining. However, in contrast to NALP1, lymphoid tissues and skin stained negatively for NALP3 (data not shown). Considering the positive staining of immune cells for NALP3 in Western blots, it appears that the NALP3b antibody is suitable for the detection of moderate to high levels of NALP3.
NALP1 Is Expressed in Glandular and Columnar Epithelial Structures
NALP1 showed strong staining in epithelial cells lining the glandular epithelium such as present in the gastrointestinal tract (stomach, small intestine, colon), the respiratory tract (trachea and bronchi), and the endometrial (Figure 4) and endocervical glands, gallbladder, prostate, and breast (not shown). Staining was predominantly cytoplasmic, although scattered nuclear staining was observed. All these glandular epithelia were NALP3 negative.
NALP1 Expression in Brain and Testis
NALP1 was also highly expressed in the brain, whereas no signal was found for NALP3 (Figure 5). Bearing in mind the NALP1 expression in macrophages, we expected that microglial cells would be the brain cells expressing NALP1. Moreover, microglia cells have been reported to secrete IL-1β, at least in culture (Yao et al. 1992). Unexpectedly, however, neurons, in particular pyramidal ones, and oligodendrocytes stained positive for NALP1, whereas microglia were negative. In contrast to epithelial cells, but in agreement with lymphocytes, staining of NALP1 was clearly nuclear (Figure 5). Testis was another tissue that was NALP1 positive but lacked NALP3 expression (Figure 5). Cells expressing NALP1 were identified as spermatogonia, the germ cells that are involved in spermatogenesis and primary spermatocytes (arrows). Secondary spermatocytes, spermatids, and spermatozoa were negative. Sertoli cells, which support the spermatogonia, were negative as well.
NALP3 Is Primarily Expressed by Non-keratinizing Squamous Epithelium Lining the Mucosal Sites
NALP3 showed a more restricted tissue distribution with staining predominantly in stratified non-keratinizing squamous epithelium such as oral, esophageal, and ectocervical mucosa (Figure 6, right panel) and in the Hassall's corpora in the thymus (not shown). Also, the stratified epithelium covering the bladder and ureter (transitional mucosa) expressed NALP3 (Figure 6). Staining was always cytoplasmic. In contrast to NALP3, stratified epithelium such as non-keratinizing squamous and transitional epithelium were negative for NALP1 (Figure 6, left panel). Interestingly, in contrast to keratinocytes in non-keratinizing epithelia, keratinocytes present in the skin showed scarcely detectable NALP3 staining (Figure 6). Also, for NALP1, a very weak staining was observed in keratinocytes of the epidermis as well, but much weaker compared with the Langerhans cells present (Figure 6, arrow).
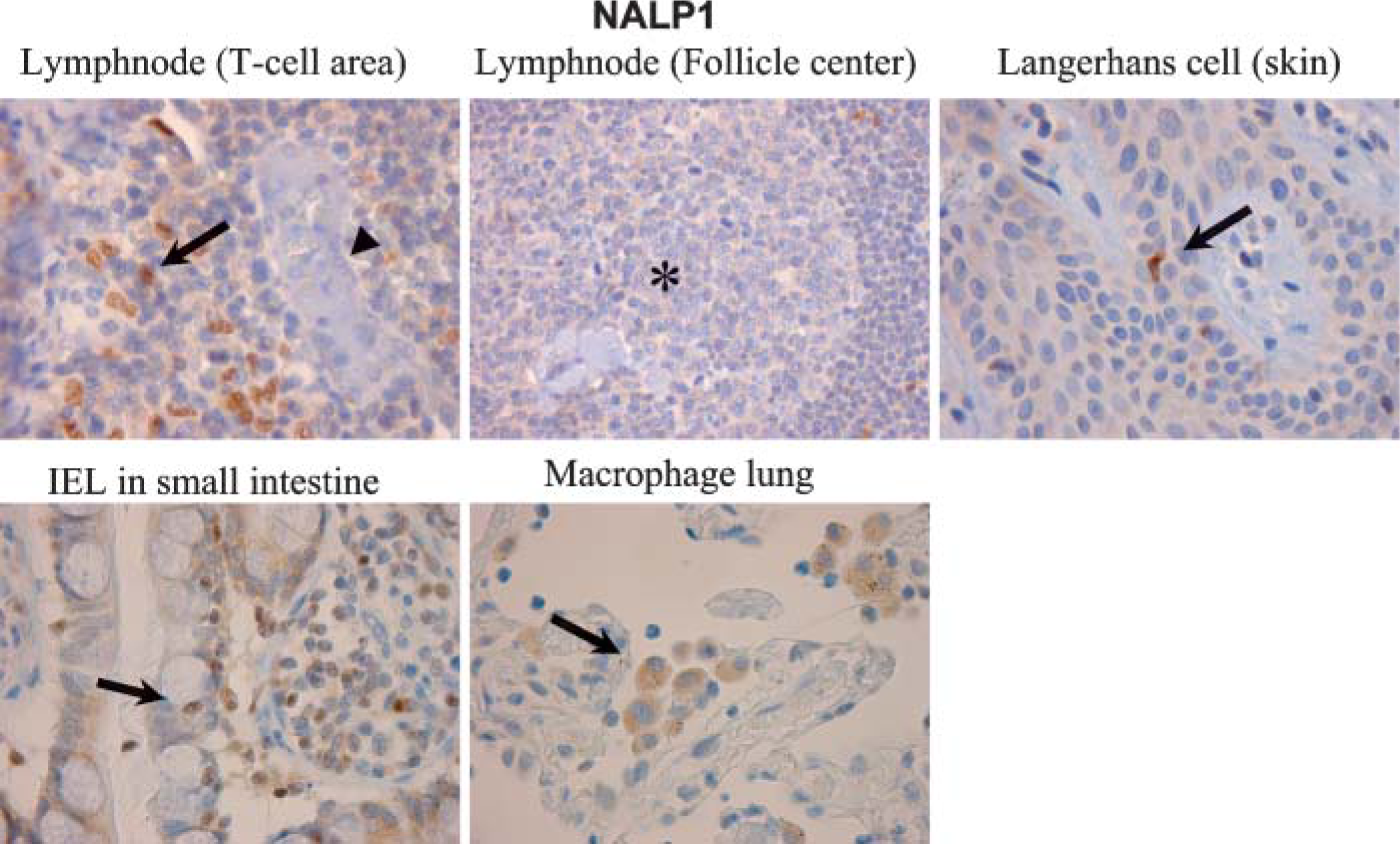
NALP1 expression in lymphoid tissues and macrophages. NALP1 is expressed in mononuclear cells in the T-cell areas in primary lymphoid organs (lymph node and tonsil) as well as in T cells present in peripheral lymphoid tissues such as the intra-epithelial lymphocytes (IEL) in the small intestine. NALP1 is also expressed by Langerhans cells in the skin and by alveolar macrophages present in the lung. Arrow, NALP1-positive cells; arrowhead, NALP1-negative high-endothelial venule in the T-cell area; asterisk, NALP1-negative germinal center.
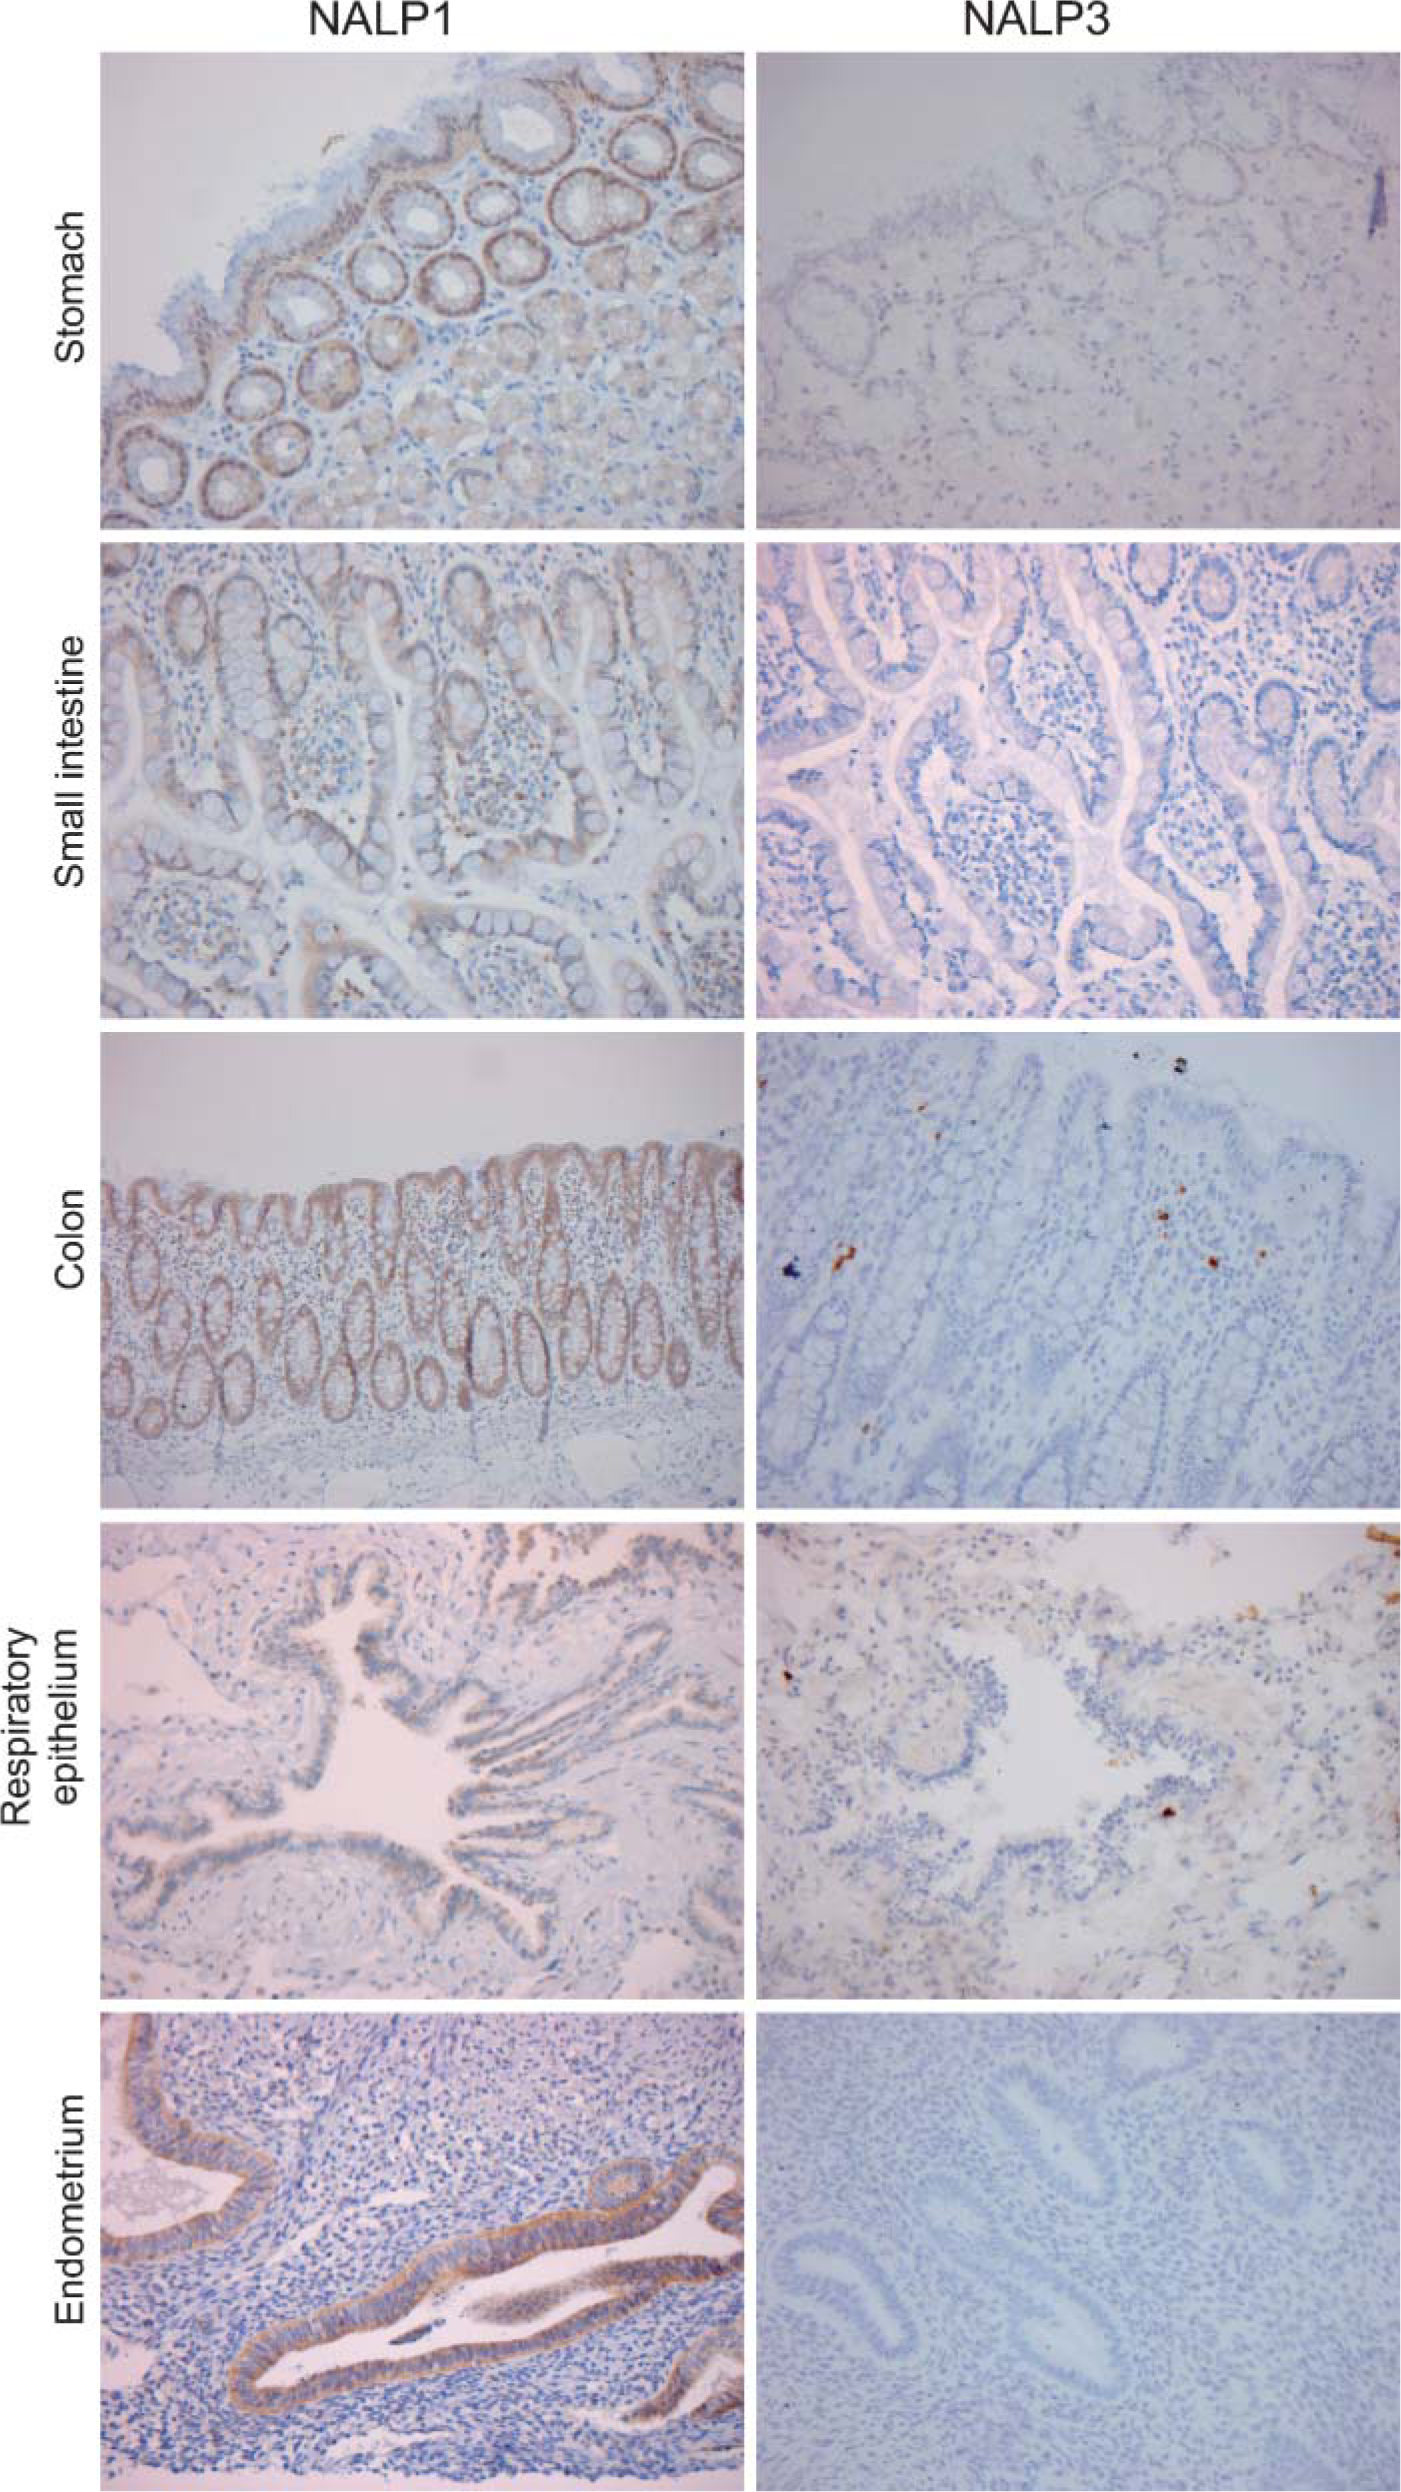
Glandular epithelium lining the alimentary, reproductive, and respiratory tract expresses NALP1 but not NALP3. The following tissues were stained for NALP1 (left panel) and NALP3 (right panel): stomach, small intestine, colon, respiratory epithelium covering the bronchial tree, and endometrium. Tissue sections were stained with the MAbs NALP1/Y1–4 and NALP3a, respectively, as described in Materials and Methods and counterstained with hematoxylin.
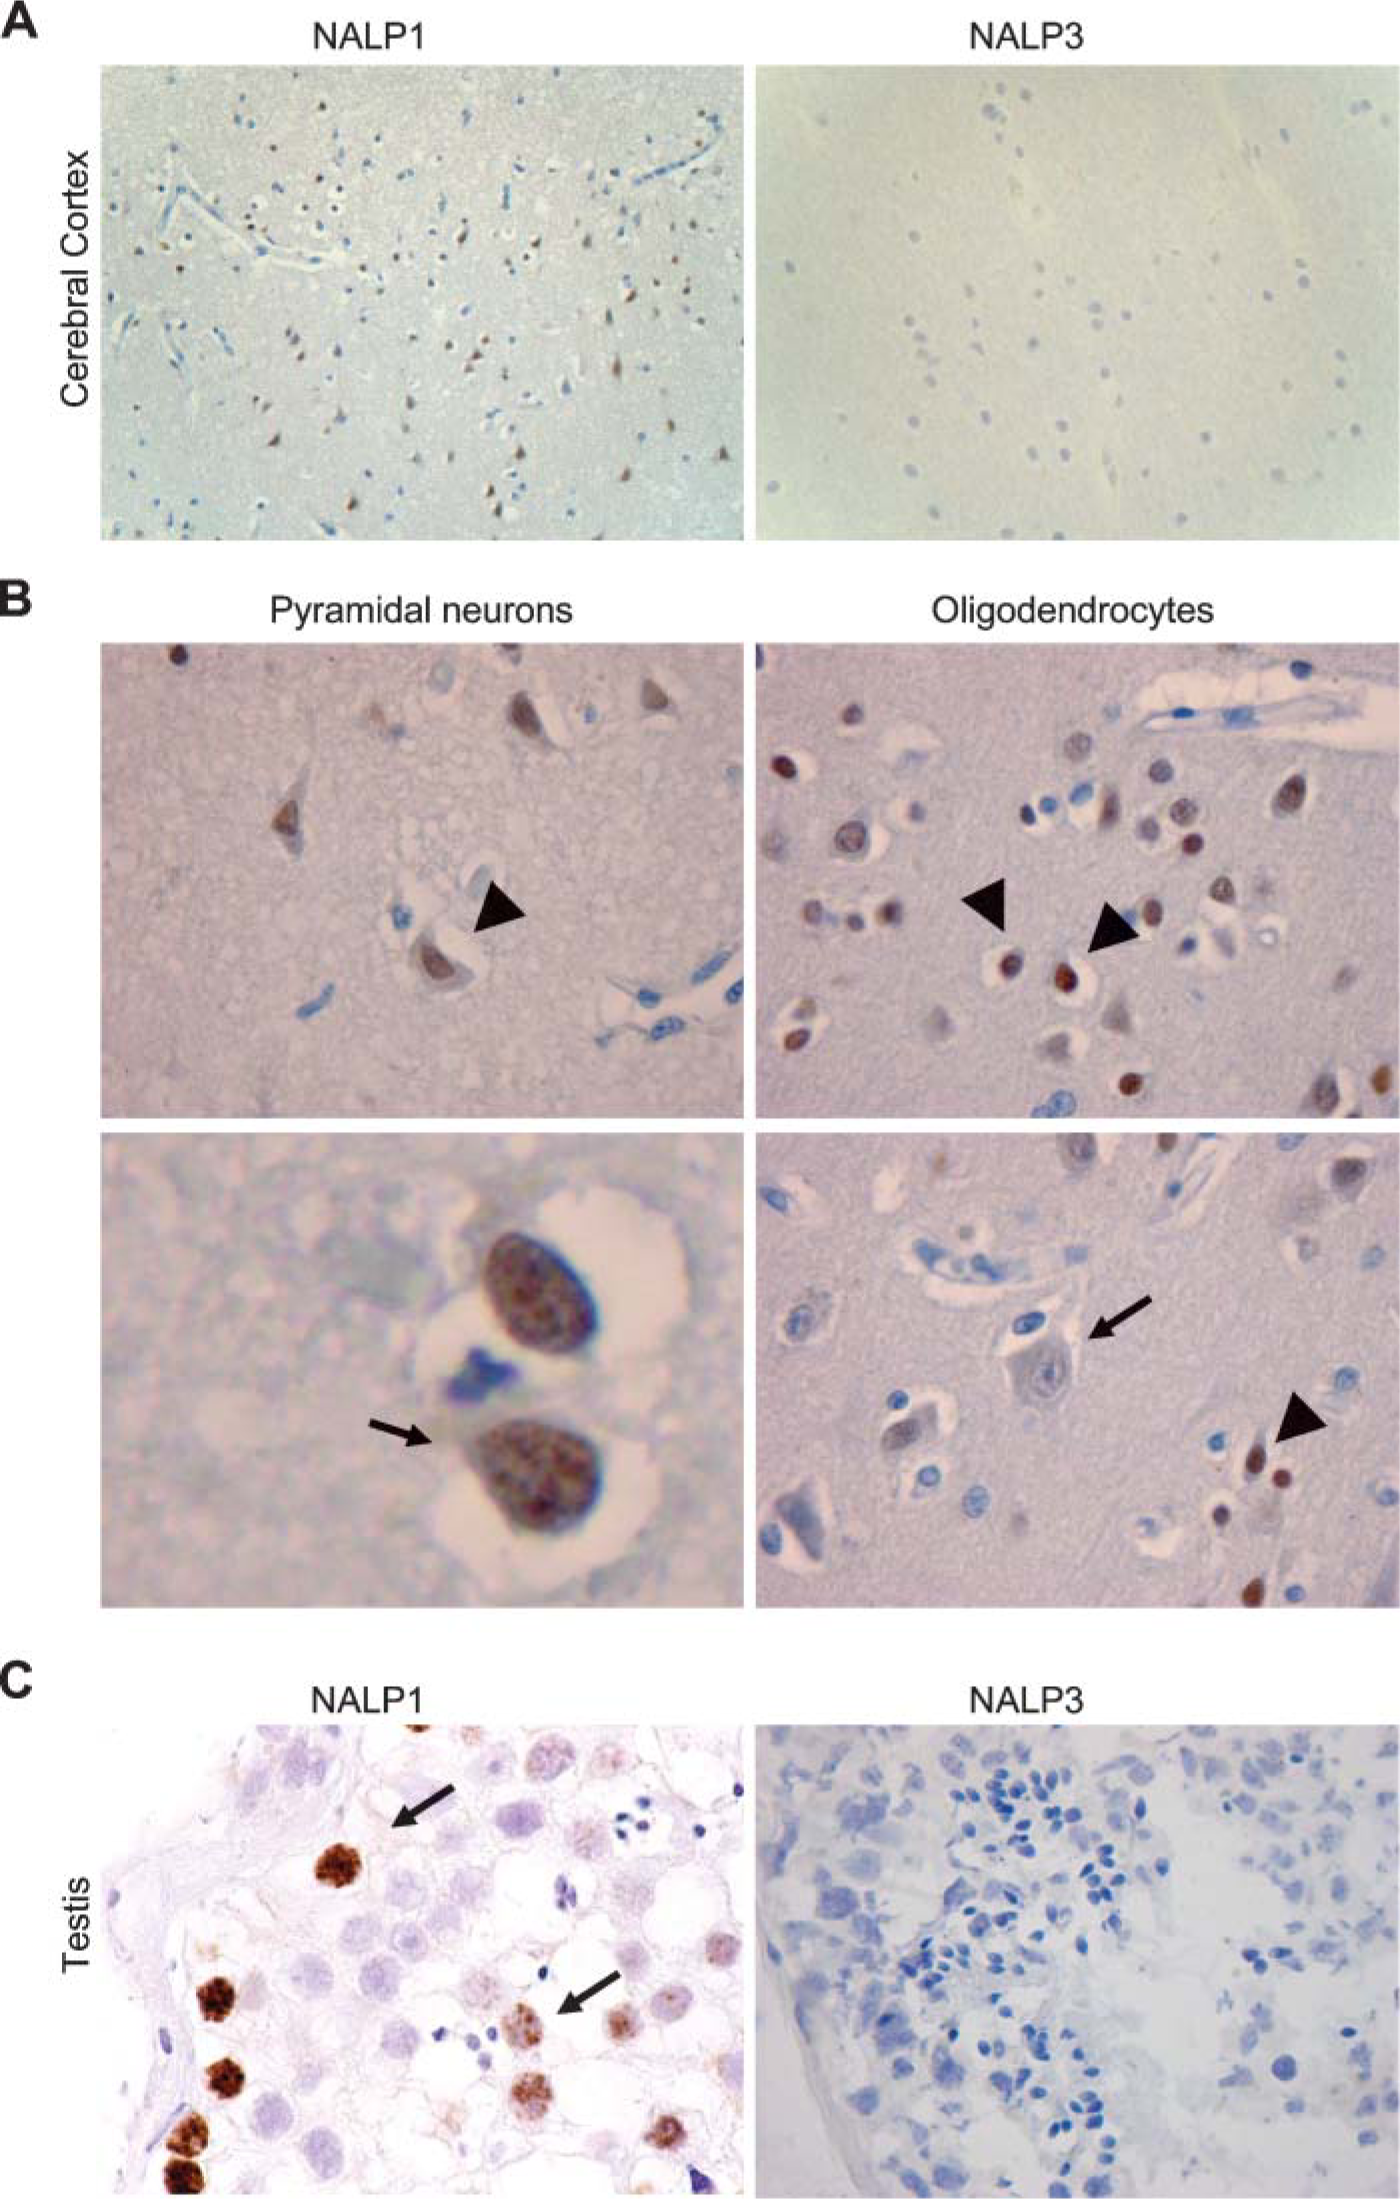
NALP1 is expressed in the brain and in the testis and shows a nuclear subcellular distribution. (
Discussion
Little continues to be known about the expression of components of the NALP inflammasomes. ASC, which is also an essential component of the inflammasome, has a quite widespread expression (Masumoto et al. 2001). Highest ASC expression was reported for the anterior horn cells of the spinal cord; trophoblasts of the placental villi; tubule epithelium of the kidney; epithelial cells of the colon; seminiferous tubules and Leydig cells of the testis; hepatocytes and interlobular bile ducts of the liver; squamous epithelial cells of the tonsil and skin; hair follicle, sebaceous, and eccrine glands of the skin; and peripheral blood leukocytes. Expression in epithelial cells and peripheral blood mononuclear cells (PBMCs) coincides well with the expression pattern found for NALP3, suggesting that a functional inflammasome can be formed in these cells and tissues. It appears from our study that NALP3 is not only expressed in granulocytes and PBMCs as expected, but also in epithelial cells at even higher levels. In immune blood cells, robust expression of different NALP3 isoforms is detected in neutrophils, monocytes, and DCs, which are known to be high producers of IL-1β. Interestingly, expression of NALP3 in neutrophils requires stimulation. Of note, mostly the short form of NALP3 was detected in primary cells, whereas the long form was prevalent in the T-cell line Jurkat and the monocytic cell line THP.1. A form even shorter than NALP3s is present in DCs. Due to the specificity of the MAb used, we believe that this band is specific and either represents an as yet undescribed isoform or a proteolytically cleaved fragment of the longer isoforms. However, a nonspecific reactivity of the antibody cannot be ruled out with certainty. At least in cell lines, the high molecular 130-kDa species was often migrating as a doublet, suggesting that NALP3 is either posttranslationally modified or one of the two bands corresponds to NALP3, which lacks two or four LLRs (O'Connor et al. 2003). The significance of these various NALP isoforms is currently not known.
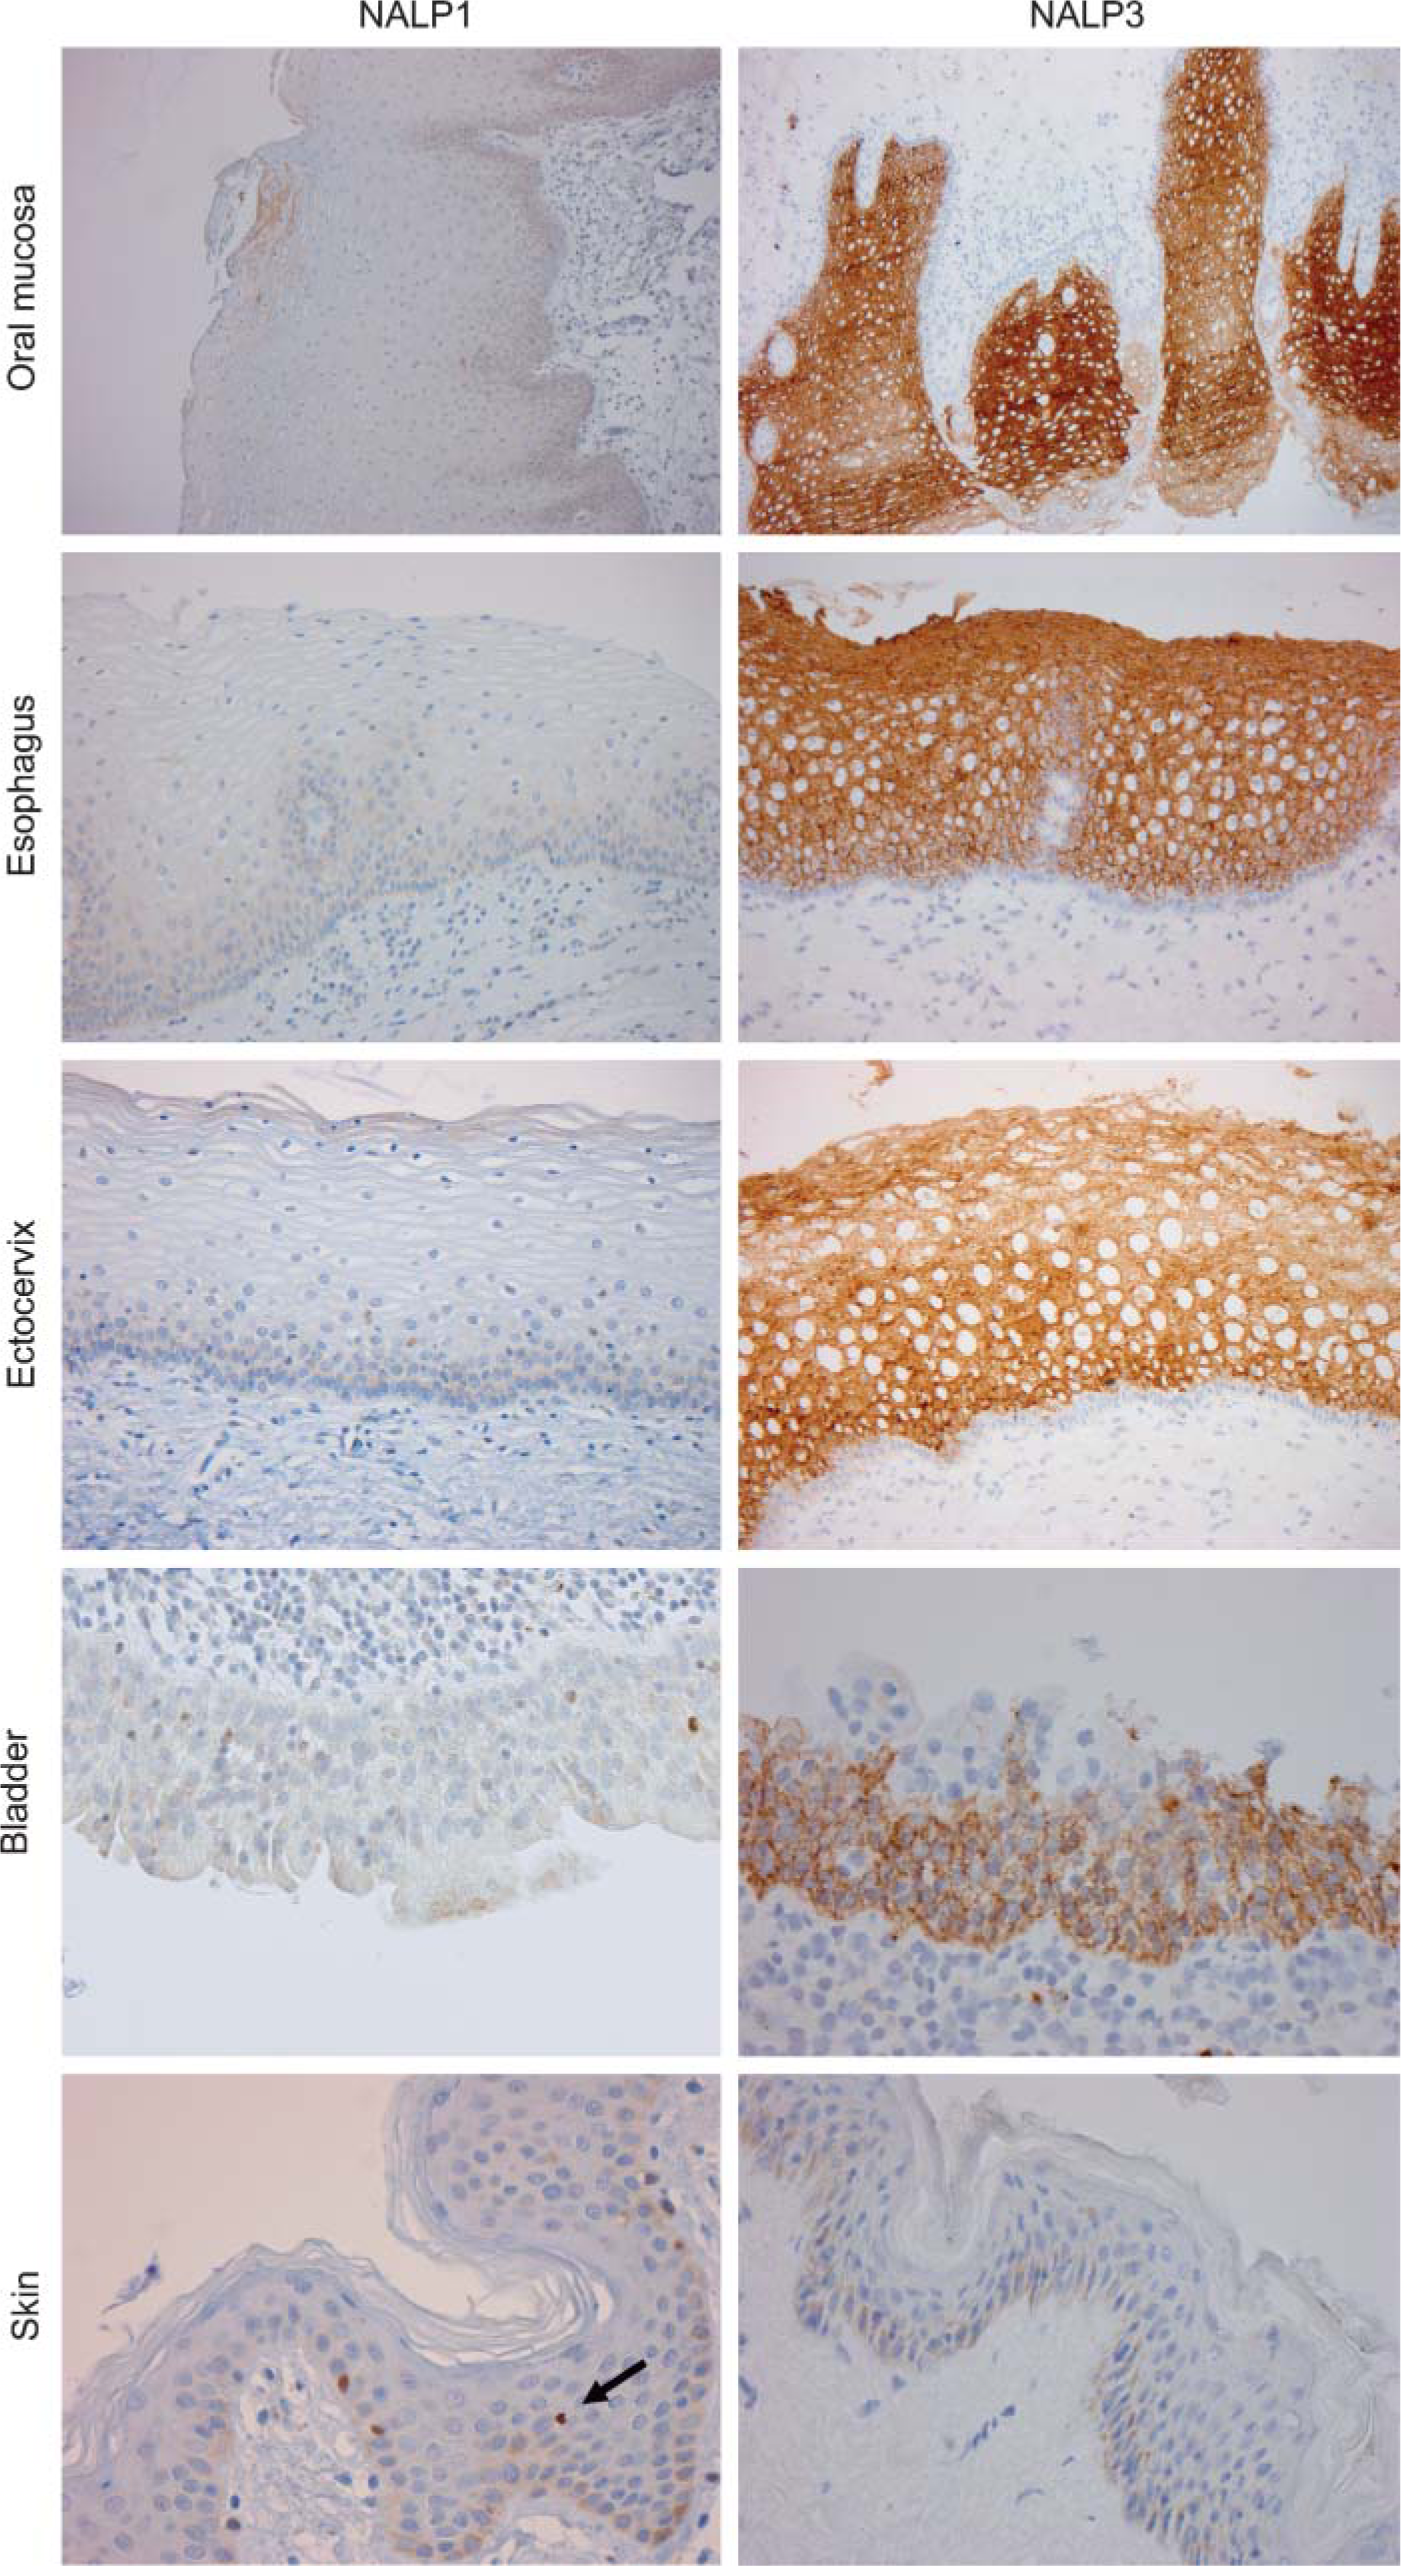
NALP3, but not NALP1, is strongly expressed by keratinocytes and transitional epithelium. Sites covered with non-keratinizing squamous epithelium (oral cavity, esophagus, and ectocervix) or with transitional epithelium (bladder) were stained for NALP1 (left panel) and NALP3 (right panel). Strong cytoplasmic NALP3, but not NALP1, expression was observed in these epithelia. The lowest panel shows NALP staining of keratinizing squamous epithelium of the skin. Arrow indicates a NALP1-positive Langerhans cell as internal positive control.
Good NALP3 expression was also seen in B and T lymphocytes. Expression of NALP3 in other than granulocytes and PBMCs was restricted to keratinocytes from the stratified non-keratinizing mucosa that covers the oral cavity and esophagus, as well as part of the female reproductive tract (ectocervix and vagina) and to the stratified transitional epithelial cells found in the urinary tract. Moreover, keratinocytes of the skin also stained, albeit much weaker, positive for NALP3. Together the expression pattern of NALP3 suggests that the NALP3 inflammasome plays a critical role in the first line of defense against invading pathogens and possibly allergens. In line with this, defense against pathogenic bacteria such as Listeria or Salmonella is dependent on an intact inflammasome (Mariathasan et al. 2004). Agents that cause contact hypersensitivity are largely inactive in mice lacking NALP3 (Gaide O, et al., unpublished data).
Alveolar macrophages, which are very important for pulmonary innate immune responses against invading inhaled pathogens, are positive for NALP1. Pathogenesis of Bacillus anthracis, the bacterium that attacks alveolar macrophages and causes anthrax, is dependent, at least in mice, on the activation of the NALP1b inflammasome. This leads to uncontrolled caspase-1-mediated IL-1β maturation and subsequent cell death (Boyden and Dietrich 2006). It is noteworthy that NALP1 is expressed in human alveolar macrophages, suggesting its involvement also in human anthrax pathogenesis.
Although NALP1 and NALP3 expression more or less overlaps in blood immune cells, expression in epithelial cells is quite different. Whereas NALP1 is almost completely absent from stratified epithelial tissue, it is highly expressed in simple columnar epithelial such as those lining the digestive tract (stomach, small intestine, colon). Moreover, the respiratory tract (lung) and the endometrium are positive. This may suggest that the NALP1 inflammasome is an important danger-sensing platform in these tissues. High levels of NALP1 were also detected in the testis, more precisely in spermatogonia. Although there is evidence for IL-1β expression in spermatagonia and its involvement in spermatagonia differentiation (Huleihel et al. 2003), the role of NALP1 in this process remains to be demonstrated.
High NALP1, but not NALP3, levels were found in the brain, in particular in pyramidal neurons and oligodendrocytes, but not microglial cells. This hints to the possibility that microglial cells, which share properties with tissue macrophages, are not the main source of IL-1β in the brain. Indeed, hypothalamic neurons and “microglial-like cells” were found to stain positively for IL-1β in lesions from patients with Alzheimer's disease. Il-1β has been proposed to be implicated in the pathogenesis of several neurological diseases including Alzheimer's disease, traumatic brain injury, epilepsy, Parkinson's disease, and stroke (Allan et al. 2005). Moreover, the highly selective IL-1 receptor antagonist (IL-1ra) protects against ischemic cerebral injury in a range of experimental settings, and IL-1ra also causes a marked reduction in transient cerebral ischemia (Emsley et al. 2005).
NALPs are thought to be cytoplasmic proteins. However, for at least one member of the family, CIITA, there is evidence for cytoplasmic-nuclear shuttling because CIITA acts as a coactivator of transcription factors that are required for expression of the MHC class II genes (LeibundGut-Landmann et al. 2004). It is thus possible that other members of the NLR family, such as NALP1, have nuclear functions as well that are independent of its role in the inflammasome. Indeed, NALP1 was detected in the nucleus of neurons and lymphocytes. Interestingly, this nuclear localization was dependent on the tissue/cell type. This may be the result of tissue-specific cofactors or tissue-specific splicing of the molecule resulting in small, diffusible isoforms. Future studies are needed to show the significance of this observation.
Footnotes
Acknowledgements
This work was supported by grants from the Swiss National Science Foundation and the Commission of Technology and Innovation.
We thank neuropathologist Wim Spliet for assistance in the screening of the stainings of the central nervous system. We thank Saskia Lippens and Helen Everett for critical reading of the manuscript.