
Abstract
The major copper influx transporter, copper transporter 1 (hCTR1), controls the cellular accumulation of cisplatin in mammalian cells. The goal of this study was to determine the pattern of hCTR1 expression in normal and malignant human tissues. Tissue arrays were stained with an antibody specific for hCTR1 using standard immunohistochemical techniques. Particularly strong staining was noted in the α cells of the pancreatic islets, enteroendocrine cells of the gastric mucosa and bronchioles, C cells of the thyroid, and a subset of cells in the anterior pituitary. Frequency and intensity of hCTR1 staining in malignant tissues reflected the levels found in their normal tissue counterparts. For example, neither normal prostate nor prostate cancers expressed hCTR1, whereas it was commonly expressed in both normal colonic epithelium and in colon carcinomas. Strong staining was observed in a limited number of cases of carcinoid tumors, Ewing's sarcoma, and undifferentiated carcinomas. Although all tissues require copper, expression of hCTRI was highly variable among normal tissues and among the major human malignancies, with the highest levels found in enteroendocrine cells. No hCTR1 expression was found in several common types of cancer, suggesting that hCTR1 expression is not commonly enhanced by transformation.
C
Level of hCTR1 expression is important in part because hCTR1 influences the cellular pharmacology of the Pt-containing chemotherapeutic drug cisplatin (DDP). There are numerous similarities between the cellular accumulation of DDP and Cu. Both are highly polar, and their uptake is influenced by factors known to affect transporter-mediated processes (Gately and Howell 1993; Pena et al. 1999). Furthermore, acquired DDP resistance is often accompanied by resistance to other metalloids (Tobey and Tesmer 1985; Romach et al. 2000) and specifically by resistance to Cu (Katano et al. 2002; Safaei et al. 2004). Both yeast and mammalian cells lacking CTR1 have reduced DDP uptake and increased resistance to the cytotoxic effect of the drug (Ishida et al. 2002; Lin et al. 2002). Absence of CTR1 in yeast also impairs uptake of several DDP analogs including carboplatin, oxaliplatin, and AM0473 (Lin et al. 2002). The observation that uptake of DDP is increased in cells engineered to overexpress hCTR1 (Holzer et al. 2004b), and that exposure to DDP rapidly downregulates hCTR1 expression in human ovarian cancer cells provides further evidence that hCTR1 modulates the cellular pharmacology of DDP (Holzer et al. 2004a). Thus, level of hCTR1 expression is a candidate biomarker for the prediction of tumor cell sensitivity to the Pt-containing drugs.
We report here an immunohistochemical (IHC) study of the expression of hCTR1 in the major human organs and types of malignancies. hCTR1 was not uniformly expressed in all tissues; its expression was limited to only a subset of tissues and often to specific cell types within a tissue. hCTR1 expression was found in malignancies arising from normal tissues that expressed this protein, but not in malignancies originating from tissues that did not.
Materials and Methods
Reagents
Normal and malignant tissue arrays were purchased from Cybri (Frederick, MD), the Cooperative Human Tissue Network (Nashville, TN), and Imgenex (San Diego, CA). For immunofluorescent staining, human pancreas tissue from Umea University Hospital was used with approval from the regional ethical committee. Platinol-AQ was a gift from Bristol-Myers Squibb (Princeton, NJ). The polyclonal anti-rabbit antibody used for IHC staining was generated by immunizing rabbits with a peptide containing amino acids from the C terminus of hCTR1 by Novus Biologicals (Littleton, CO). Fluorescein isothiocyanate-conjugated goat anti-rabbit antibody was obtained from Jackson ImmunoResearch Laboratories (West Grove, PA). Guinea pig anti-human insulin and guinea pig anti-human glucagon were obtained from Linco Research (St Charles, MO). Anti-guinea pig Texas Red and fluorescein-conjugated antibodies were obtained from Vector Laboratories (Burlingame, CA). Horseradish peroxidase-conjugated goat anti-rabbit secondary antibody was purchased from Jackson ImmunoResearch Laboratories. All other chemicals and reagents were obtained from Fisher Scientific (Tustin, CA).
IHC Staining
In preparation for staining, slides were deparaffinized with three 10-min soaks in xylene and hydrated through two 5-min immersions in graded alcohol (100% ethanol followed by 95% and then 70% ethanol) followed by three rinses with 0.1% Triton-X in PBS. Heat-induced antigen retrieval was performed by heating in citrate buffer, pH 6, followed by three washings with 0.1% Triton-X in PBS. Endogenous peroxidases were blocked by immersion of the slides in 0.3% hydrogen peroxide for 30 min followed by three washings with 0.1% Triton-X in PBS. IHC staining was performed according to the protocol outlined in the Catalyzed Signal Amplification System (cat. #K1500; DAKO, Carpinteria, CA). Briefly, blocking of endogenous biotin was performed by first overlaying the slides with 0.1% avidin for 15 min and washing three times with 0.1% Triton-X in PBS. Slides were then overlaid with 0.01% biotin for 15 min followed by another three washes with 0.1% Triton-X in PBS. Nonspecific protein binding was blocked by immersion of the slides in 1% BSA in PBS for 20 min. Slides were incubated with anti-hCTR1 antibody (Novus Biologicals) at a dilution of 1:200 in 1% BSA in PBS overnight at 4C. As a negative control, parallel arrays were incubated with non-immune rabbit IgG1 sera (prediluted; DAKO). As a technical positive control, slides were incubated with anti-vimentin antibody (prediluted, cat. #V1613; DAKO). Further controls were performed using a 1:50 dilution of immunizing peptide (1 mg/ml) to compete out the anti-hCTR1 antibody, resulting in a negative stain. Additional controls included staining of cell blocks prepared from cell lines lacking hCTR1 expression or which were molecularly engineered to overexpress hCTR1. Staining was scored on a 1 to 5 scale with that number being multiplied by the fraction of cells in the section that exhibited staining. Tissues with scores >0.3 were deemed positive.
Immunofluorescent Staining
In preparation for staining, slides were deparaffinized with three 10-min soaks in xylene and hydrated through two 5-min immersions in graded alcohol (100% ethanol followed by 95% and then 70% ethanol) followed by three rinses with 0.1% Triton-X in PBS. Antigen retrieval was performed by microwaving the slides twice for 5 min in citrate buffer, pH 5, followed by three washings with 0.1% Triton-X in PBS. Endogenous peroxidases were blocked by immersion of the slides in 0.3% hydrogen peroxide for 30 min followed by three washings with 0.1% Triton-X in PBS. IHC staining was performed according to the protocol outlined in the Catalyzed Signal Amplification System (cat. #K1500; DAKO). Briefly, blocking of endogenous biotin was performed by first overlaying the slides with 0.1% avidin for 15 min and washing three times with 0.1% Triton-X in PBS. Slides were then overlaid with 0.01% biotin for 15 min followed by another three washes with 0.1% Triton-X in PBS. Nonspecific protein binding was blocked by immersion of the slides in 1% BSA in PBS for 20 min. Slides were incubated with anti-hCTR1 antibody (Novus Biologicals) at a dilution of 1:200 in 1% BSA in PBS overnight at 4C. Slides were then washed three times with 0.1% Triton-X in PBS and incubated with a 1:100 dilution of fluorescein anti-rabbit IgG in 1% BSA/PBS for 30 min in the dark followed by another three washes with 0.1% Triton-X in PBS. Slides were then blocked with 10% normal horse serum in PBS for 30 min followed by incubation with either a 1:1000 dilution of anti-insulin antibody or anti-glucagon antibody (both from Linco Research) in 10% normal horse serum in PBS for 2 hr at room temperature or overnight at 4C. Slides were then rinsed twice for 5 min in PBS and incubated at a 1:100 dilution of Texas Red anti-guinea pig IgG in 10% normal horse serum in PBS for 30 min followed by an additional two washings of 5-min each with PBS. Slides were then mounted in aqueous mounting medium and stored in the dark.
Results
Characterization of the hCTRI Antibody
Specificity of the polyclonal antibody generated to the C-terminal end of hCTR1 was documented by staining human cell lines known to express varying levels of hCTR1. Fixed and paraffin-embedded cell blocks were prepared from human ovarian carcinoma A2780 cells and the A2780/hCTR1 subline that had been stably transfected with an hCTR1 expression vector (Holzer et al. 2004b). As shown in Figure 1A, A2780 cells expressed a moderate level of hCTR1, and staining was blocked by coincubation of the antibody with the peptide that was used as the immunogen. The A2780/hCTR1 cells expressed a much higher level of hCTR1, and this staining was also eliminated by coincubation with the immunizing peptide demonstrating the specificity of the antibody. Sections of the cell blocks of these two cell lines were included as controls when staining all other tissues in this study.
hCTRI Expression in Normal Human Tissues
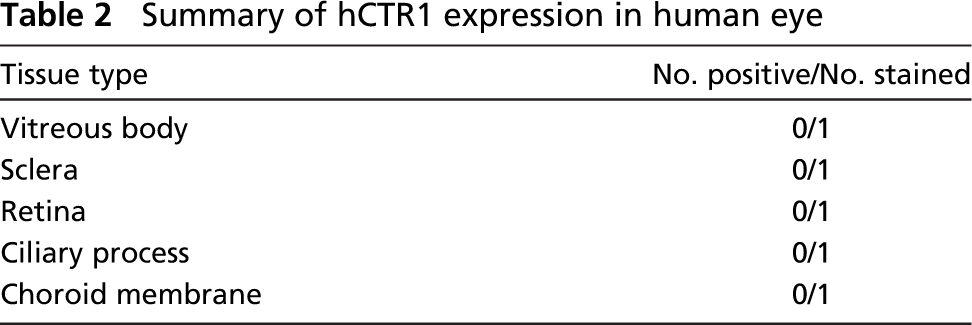
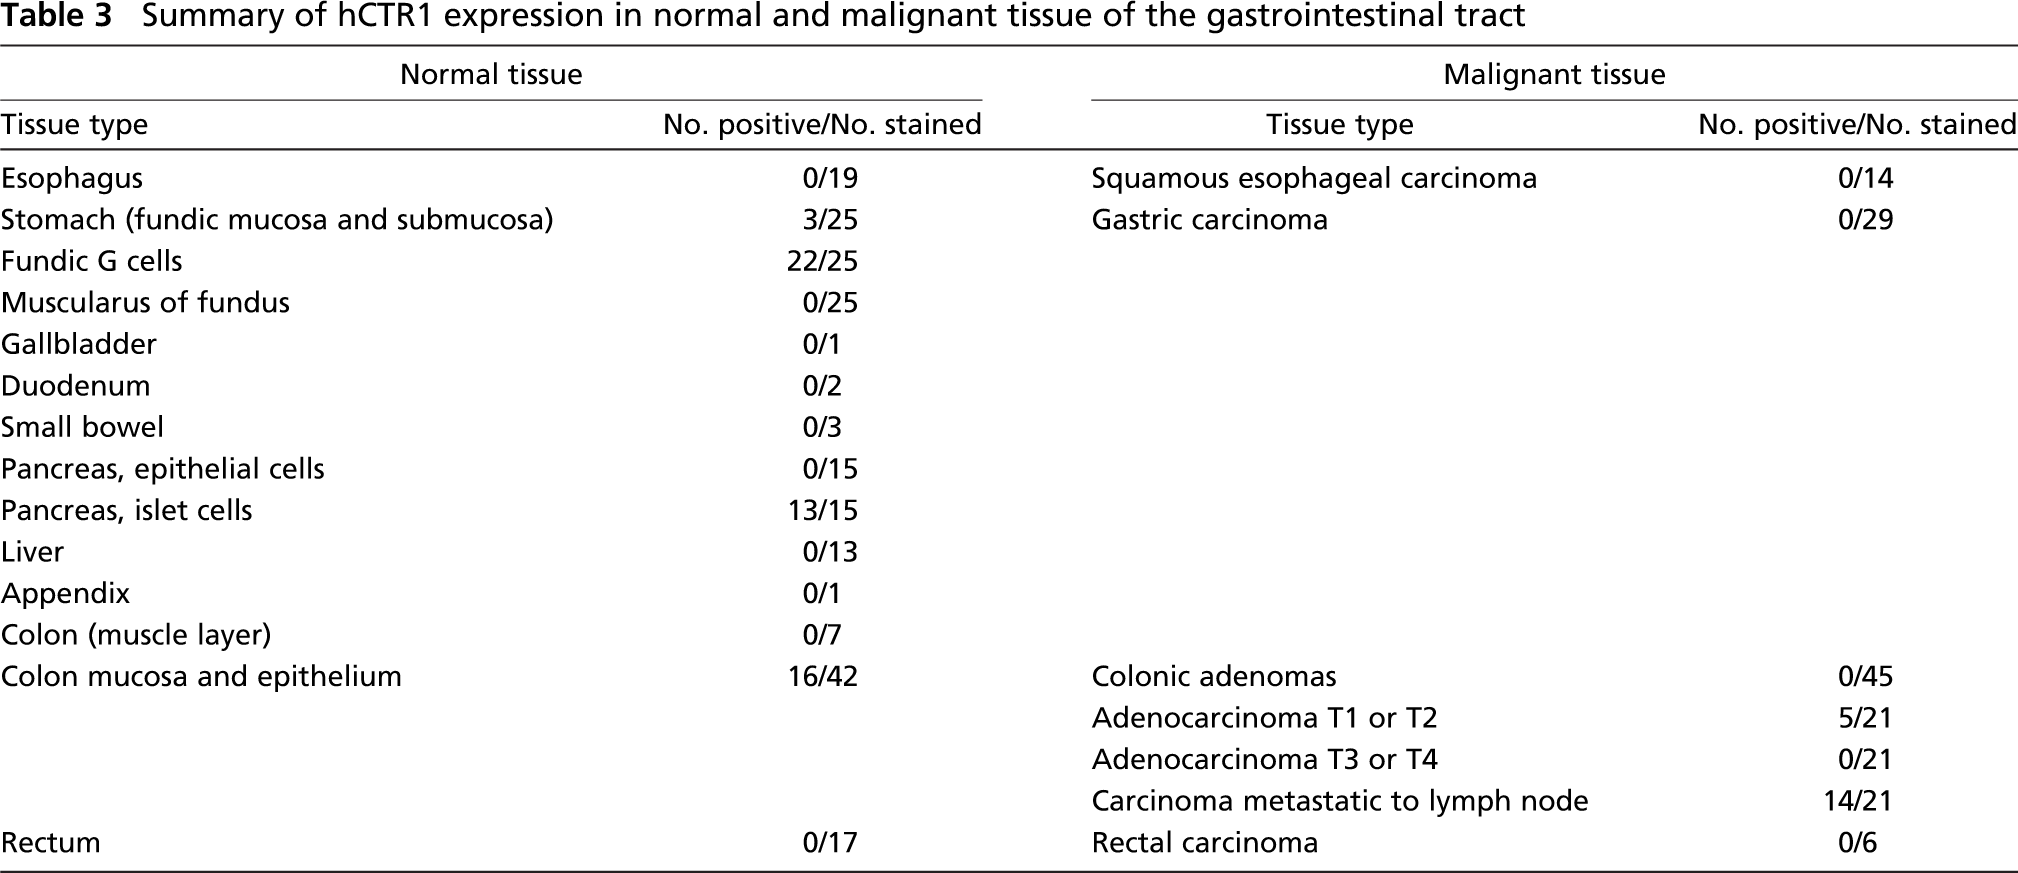
Arrays containing a wide range of tissues from various normal organs were stained with the polyclonal hCTR1 antibody to assess the level of hCTR1 expression. Results of the staining are summarized in Tables 1–5, and representative images of stained tissues are presented in Figures 1B and 1C and Figure 2. hCTR1 expression was most prominent in the pancreatic islets, parafollicular C cells of the thyroid, rare gastrin (G) cells of the stomach mucosal glands, rare neuroendocrine cells of the bronchial epithelium, and autonomic ganglia as described further below. In the brain, hCTR1 staining was found in the choroid plexus, a subset of the cells in the anterior pituitary, and in the hypothalamus. Expression of hCTR1 was also found in the adrenal medulla and the autonomic ganglia (Figure 1B), but hCTR1 expression was not observed in any component of the eye. In the gastrointestinal tract, hCTR1 expression was observed in the G cells of the gastric mucosa in 22/25 samples, as shown in Figure 2. hCTR1 was not expressed in the esophagus, gallbladder, duodenum, or small bowel, but expression was detected in some samples of normal colonic epithelium (Figure 1C); interestingly no staining was detected in the rectal epithelium. Most samples of normal breast epithelium expressed readily detectable levels of hCTR1 in the ducts and lobular cells (Figure 1C). Based on a prior report that hCTR1 mRNA could be detected in the liver by Northern blot analysis (Zhou and Gitschier 1997), it was anticipated that the liver would stain for hCTR1, but no staining was observed in 13 samples. None of the 15 samples of pancreas expressed hCTR1 in the epithelial cells, but 13 of these samples that included an islet demonstrated strong staining of the islet cells. Islets were stained with additional antibodies specific for α and β cells. As shown in Figure 3, α cells of the pancreatic islet stained positively for hCTR1 (Figure 3A), whereas β and Δ cells did not (Figure 3B and data not shown). No staining was observed in the larynx, and the only cell types that stained in the lung were the neuroendocrine cells of the bronchioles and alveolar macrophages. hCTR1 was diffusely expressed in all seven samples of splenic tissue, with intense staining of the splenic nodules and the peri-arterial lymphoid sheath. Only one of five normal lymph nodes demonstrated any staining. hCTR1 was expressed in five of eight samples of cardiac muscle as well as in skeletal muscle. All samples of normal kidney expressed hCTR1 but only in the distal tubular epithelial cells (Figure 1B). No staining was observed in any component of the prostate or bladder. hCTR1 was expressed in the epithelial cells in only 1/19 thyroid samples; however, in all samples the parafollicular cells, otherwise known as C cells of the thyroid, stained intensely for hCTR1 (Figure 2). No staining was observed in the ovarian surface epithelium, but hCTR1 was expressed in oocytes and corpus lutea. Among the uterine tissues no staining was observed in the myometrium or the cervix, but hCTR1 expression was found in two of the three samples of endometrium. No staining was observed in any component of the testis, but hCTR1 was expressed in the seminal vesicles, epididymis, and vas deferens. No staining was observed in the skin, skin appendages, melanocytes, or blood vessels including arterioles. Thus, hCTR1 is not uniformly expressed in all tissues, and even within a single tissue its expression was often restricted to a limited number of cell types.
Summary of hCTR1 a expression in the brain neuroectodermal tissues
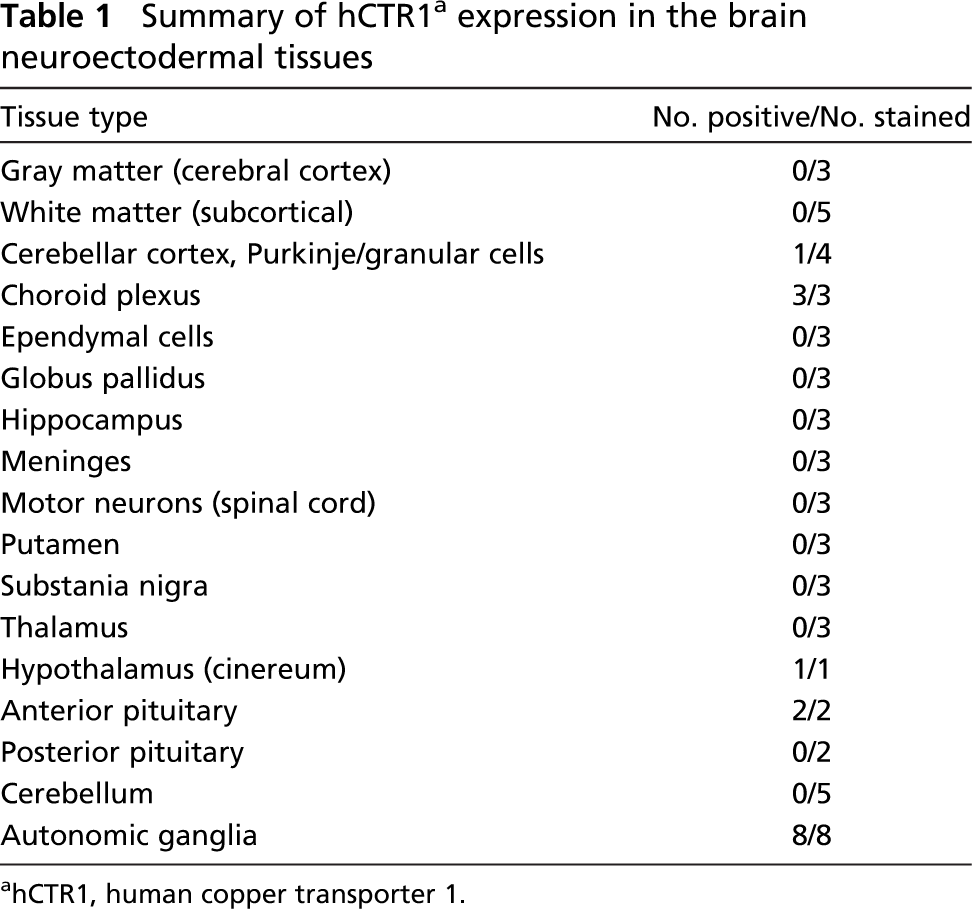
hCTR1, human copper transporter 1.
hCTRI Expression in Human Malignant Tissues
Tissue arrays containing various types of human tumors were also stained for hCTR1 to determine whether there were major differences in expression in the malignancies compared with the normal tissue from which they originated. The results are summarized in Tables 3–5. There were several cases where hCTR1 was expressed in both normal tissue and its malignant variant, although in most cases the frequency and level of expression were lower in the malignant samples. Whereas hCTR1 was expressed in ~40% of normal colon epithelial samples, no staining was found in 45 colonic adenomas, and only 5/42 samples of primary colonic adenocarcinoma expressed hCTR1. However, 14/21 samples (66%) of colon adenocarcinoma metastatic to lymph nodes expressed hCTR1. Whereas hCTR1 was expressed in most samples of normal breast ductal and lobular epithelial cells and in 12/14 samples of ductal carcinoma in situ, it was found in only 5/14 samples (35%) of invasive ductal carcinomas and in none of the seven samples of lymph node metastases. This suggests that hCTR1 expression may be lost as breast cancer progresses. hCTR1 expression was found in all 19 samples of normal renal tubular epithelium but in only 2/11 samples of renal cell carcinoma.
hCTR1 staining was evident in only one of five normal lymph node samples, and it was also found in only a minority of cases of Hodgkin's disease and non-Hodgkin's lymphomas. There were also a number of other types of tumors that expressed hCTR1. Despite the fact that normal melanocytes did not stain, staining was observed in 3/22 melanomas. All three cases of carcinoid and the one case of Ewing's sarcoma available stained strongly for hCTR1, as did all four cases of undifferentiated carcinoma.
Summary of hCTR1 expression in human eye
There were a number of tissues in which hCTR1 was not expressed in either normal or malignant cells arising from that tissue. This included the rectal epithelium, esophagus, lung, liver, cervix, prostate, and ovary. Although the extent of sampling is limited, there were no cases where hCTR1 expression was clearly higher in the malignant tissue than in the normal tissue from which it arose, with the exception of the one case of testicular carcinoma available for study.
Discussion
All cells require Cu for the function of key enzymes including cytochrome c oxidase, Cu, Zn-superoxide dismutase, lysyl oxidase, dopamine β-hydroxylase, tyrosinase, and multicopper ferroxidases such as ceruloplasmin. Because Cu is a highly polar ion that does not diffuse across cell membranes, transporters are required to bring Cu into the cell. CTR1 has been identified as the major Cu influx transporter in mammalian cells, and studies in which both alleles of mCTR1 have been knocked out have shown it to be essential to murine embryonic development. Given the importance of this protein for development in mice and the requirement of every human tissue for Cu, one might have expected to find hCTR1 expressed monotonously in all human tissues. However, the current study demonstrated that hCTR1 is detectable by IHC staining in only a limited subset of normal tissues and often in only specific types of cells within the tissue. Why hCTR1 expression is not detected in all normal tissues is unclear. Low-level expression of hCTR1 may be sufficient to serve the Cu acquisition needs of most tissues, and such low-level expression may not be detectable by IHC staining using archived paraffin-embedded material in which degradative changes inevitably occur. Alternatively, there may be other Cu transporters that serve the needs of most tissues for Cu, and the higher level expression of CTR1 observed in some tissues and types of cells may reflect an unusually high Cu requirement or another non-Cu-related function of hCTR1.
In the case of S. cerevisiae, two Cu transporters have been identified, yCTR1 and yCTR3, both of which have high affinity for Cu (Labbe et al. 1997). In mammalian cells, several other classes of transporters have been identified that can potentially bring Cu into the cell (Zhou and Gitschier 1997; Moller et al. 2000); however, only hCTR1 has actually been shown to be critical for Cu uptake. Although mCTR1 is required during embryonic development, as evidenced by the fact that CTR1-/- knock out mice die in utero between days E7 and 8 (Kuo et al. 2001; Lee et al. 2001), mouse somatic cells are not entirely dependent on CTR1. Mouse embryo fibroblasts in which both alleles of CTR1 have been knocked out are viable and can be grown in tissue culture even in the absence of supplemental Cu (Lee et al. 2002b).
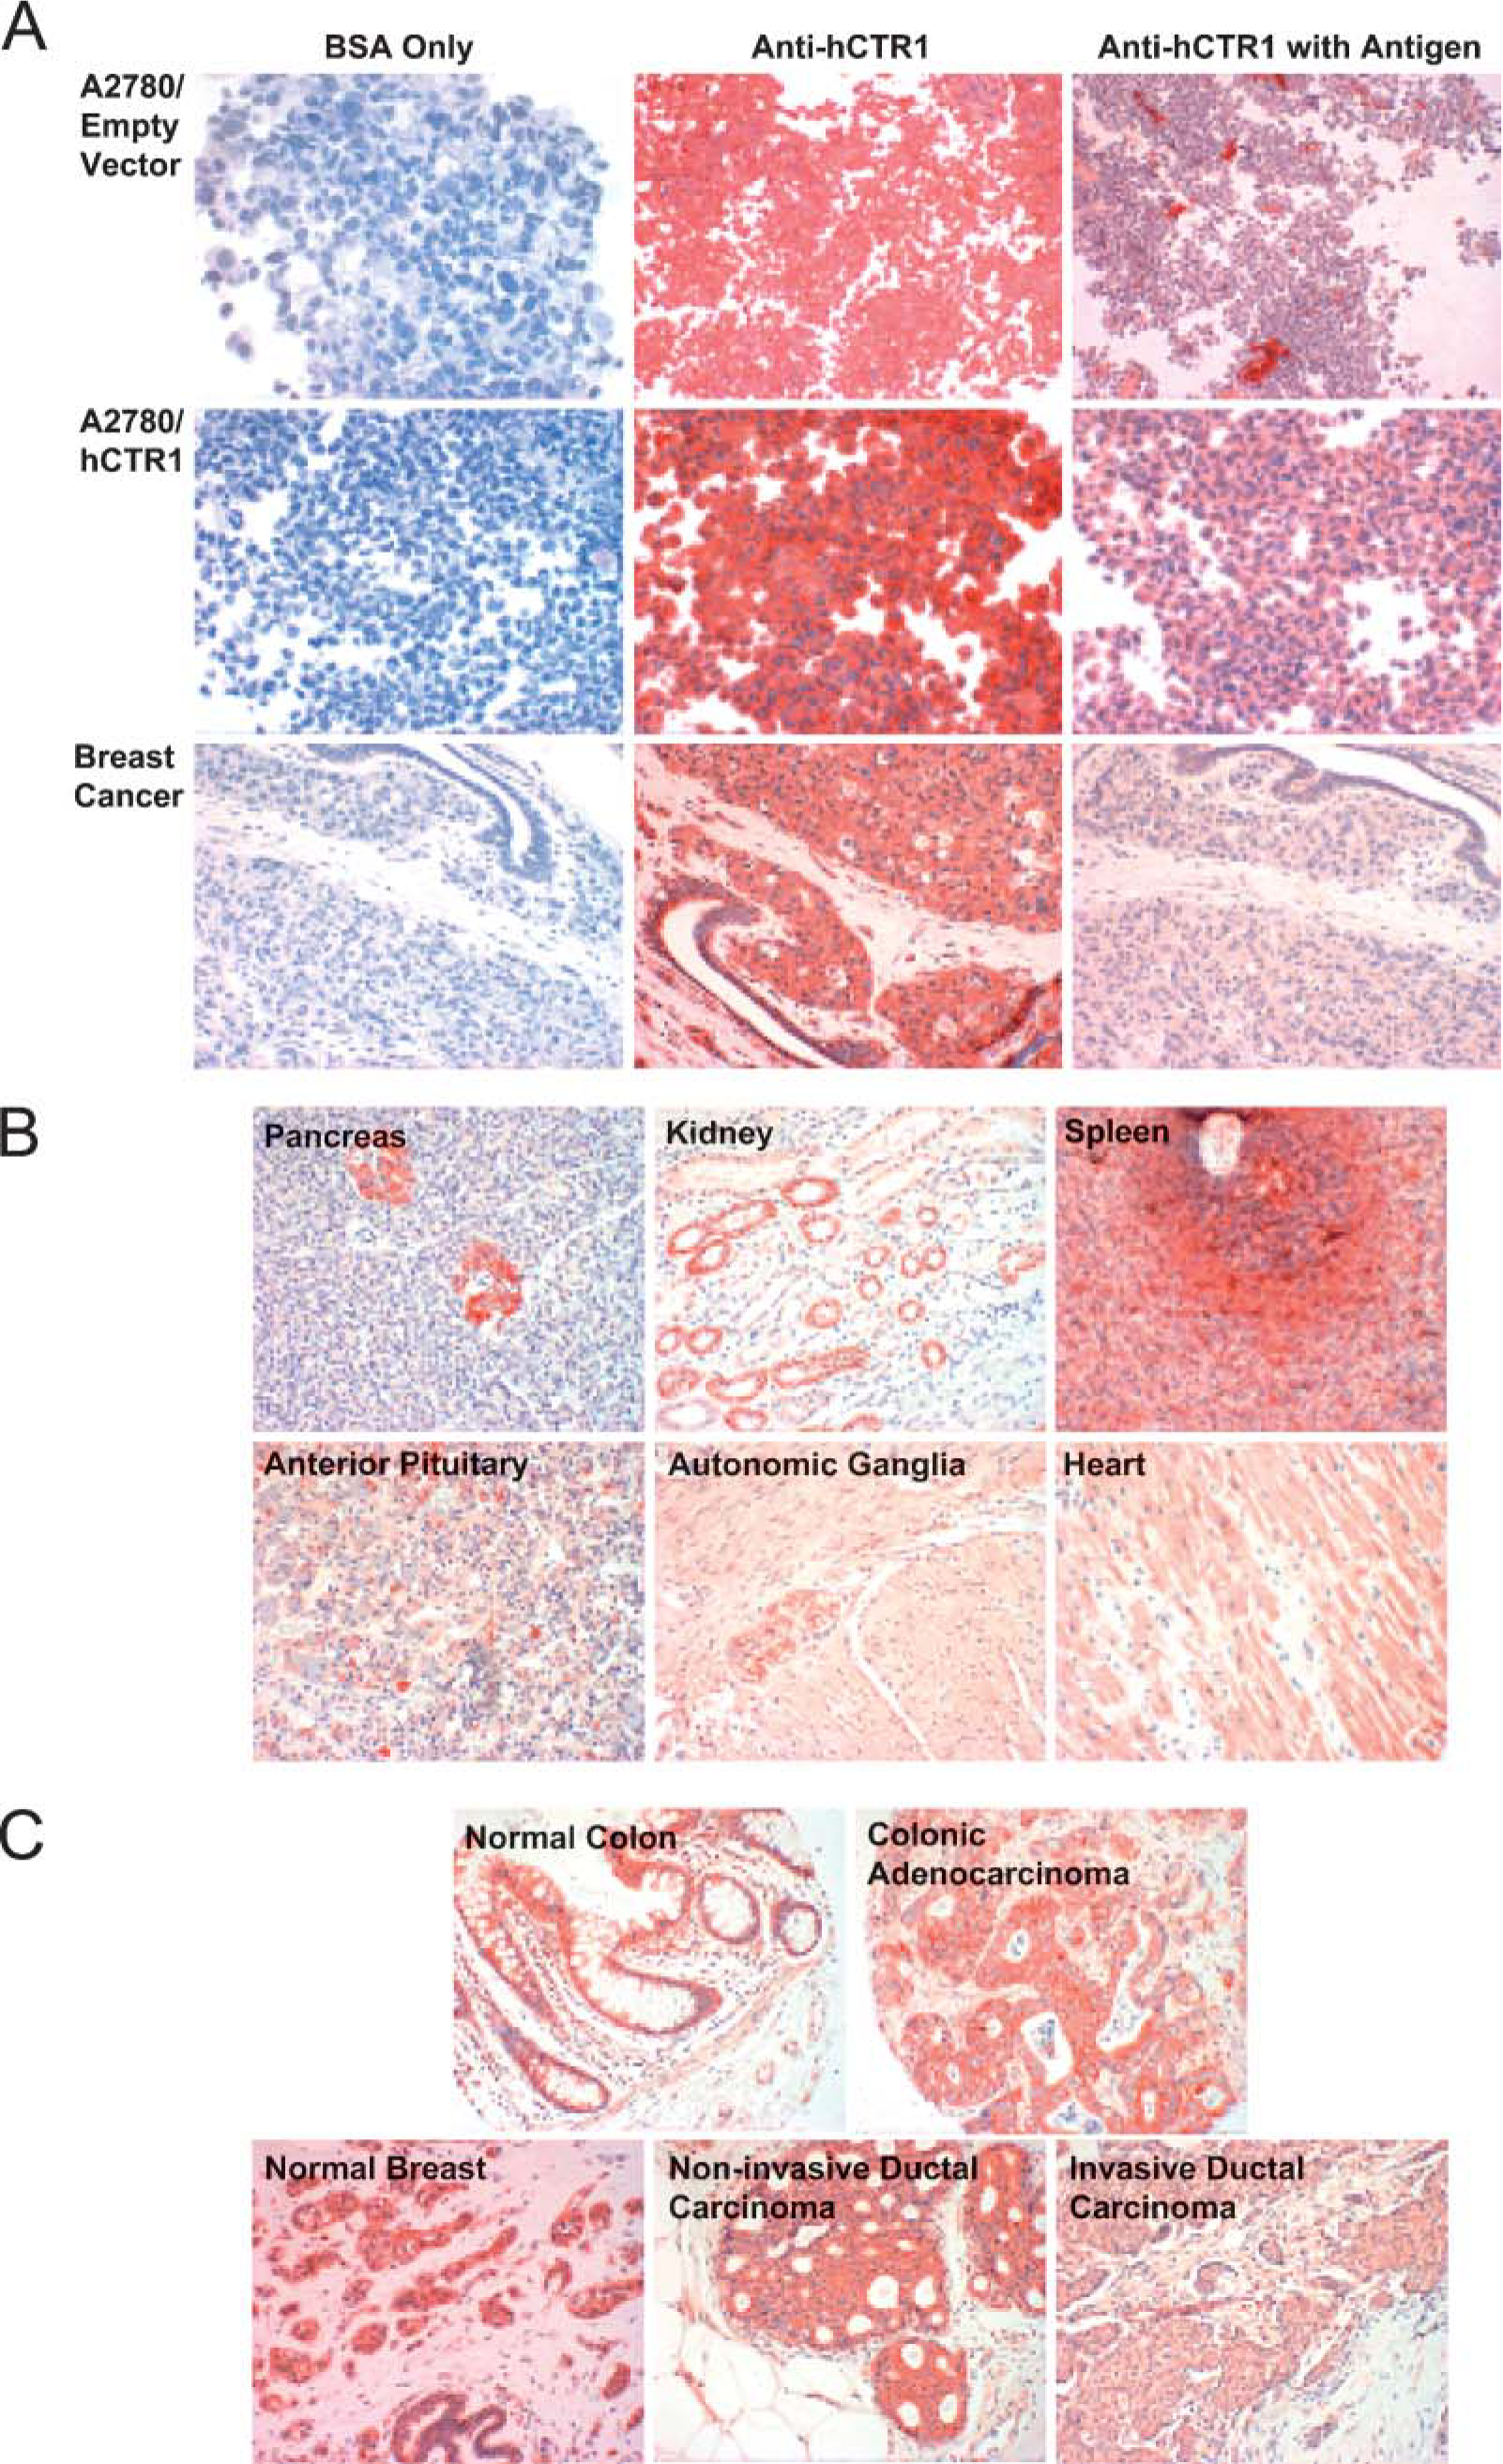
Immunohistochemical staining for human copper transporter 1 (hCTR1) in normal and malignant human tissues. (
Summary of hCTR1 expression in normal and malignant tissue of the gastrointestinal tract
Summary of hCTR1 expression in normal and malignant respiratory, reproductive, and genitourinary tracts
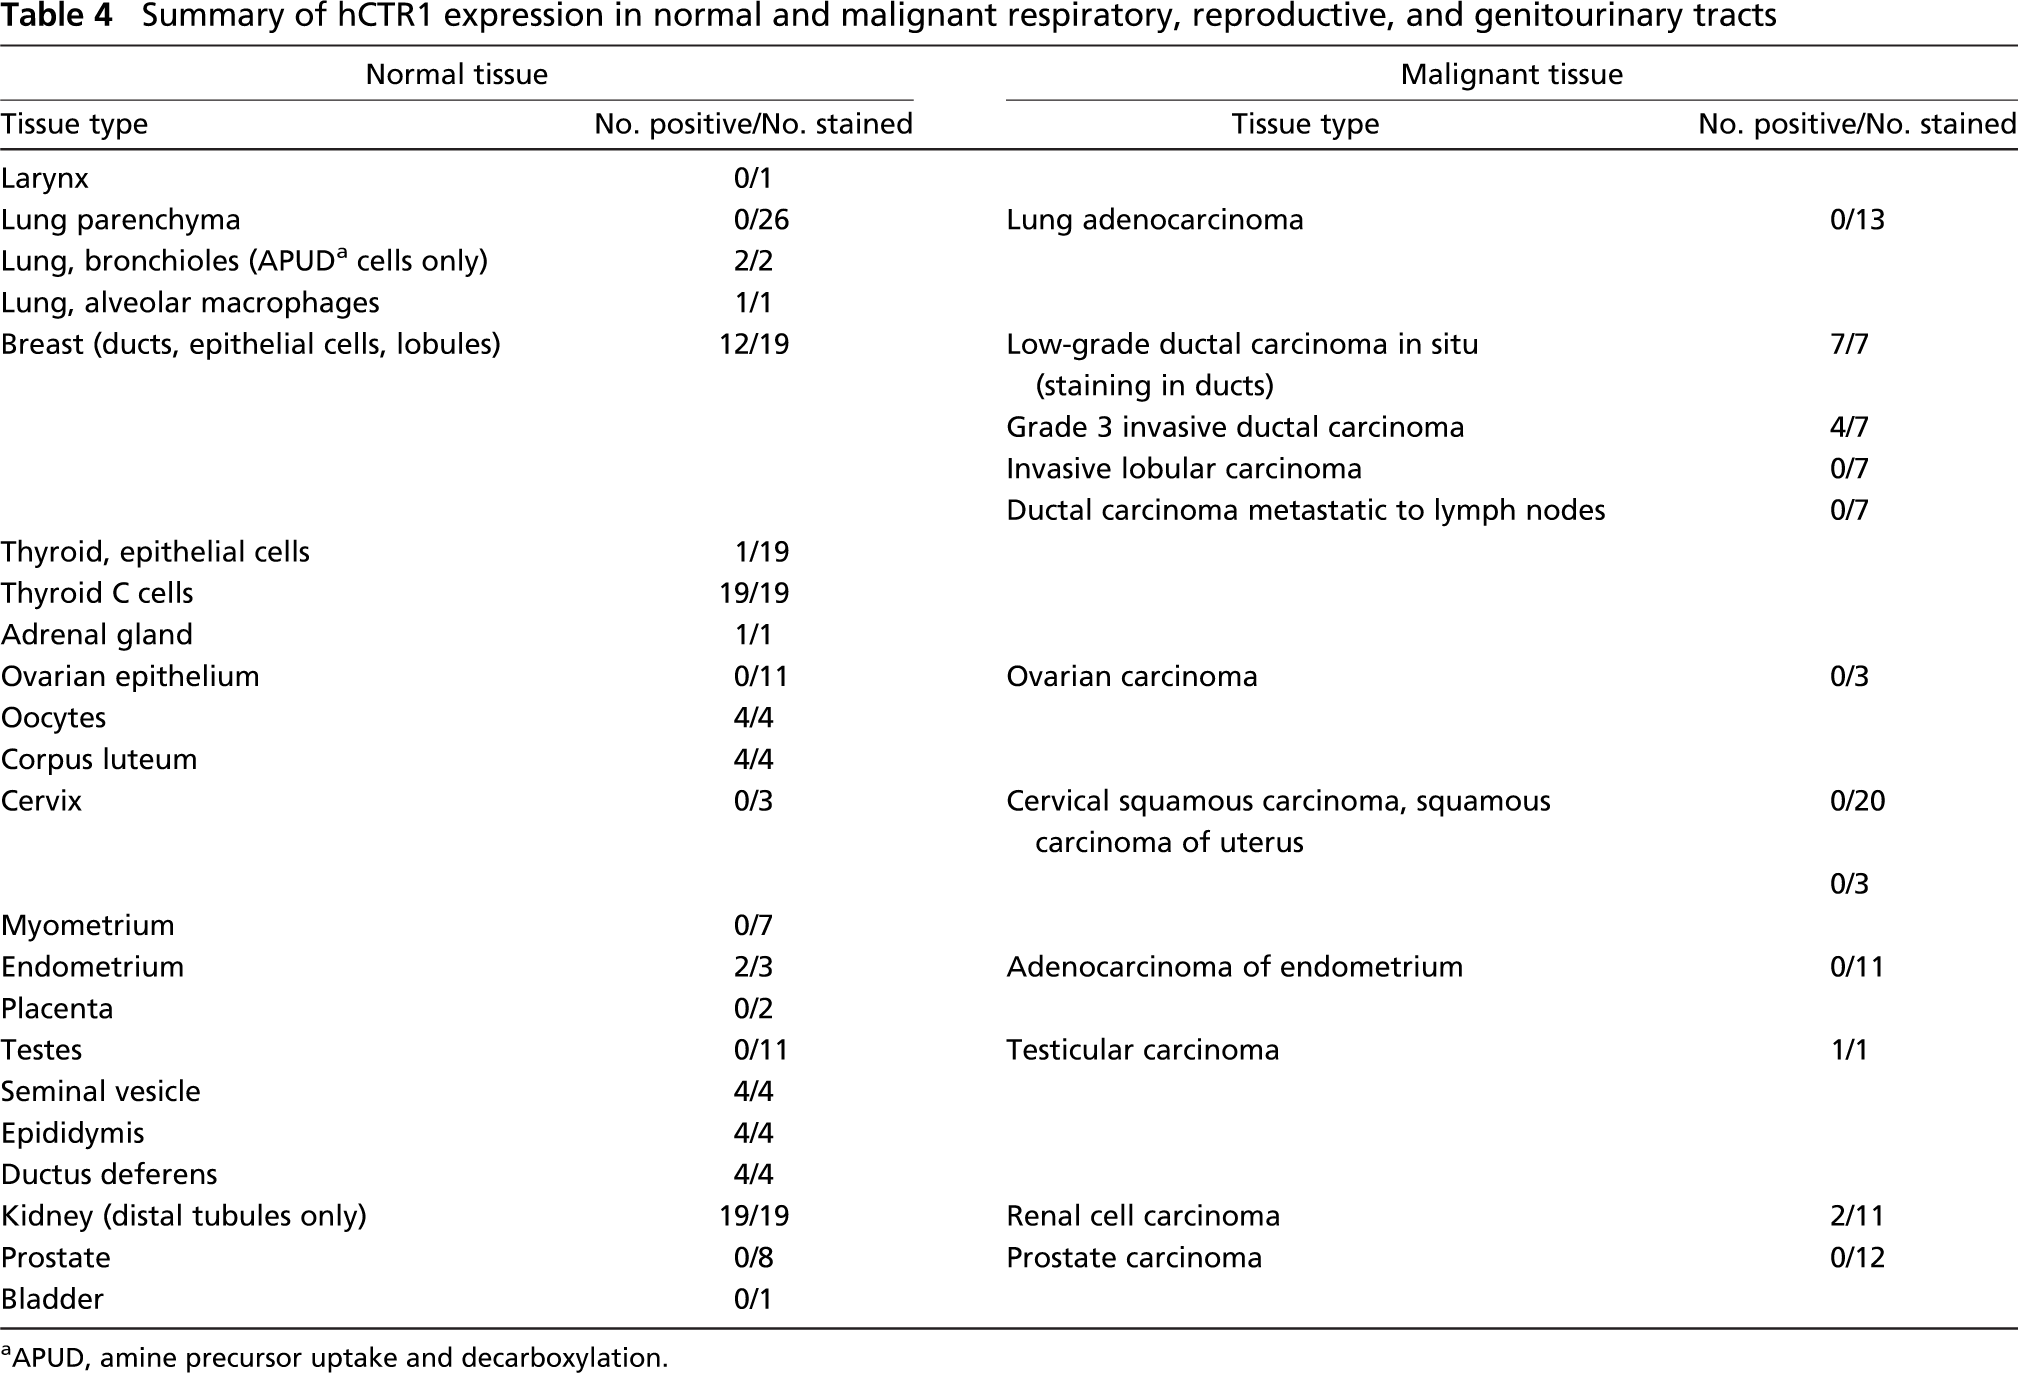
APUD, amine precursor uptake and decarboxylation.
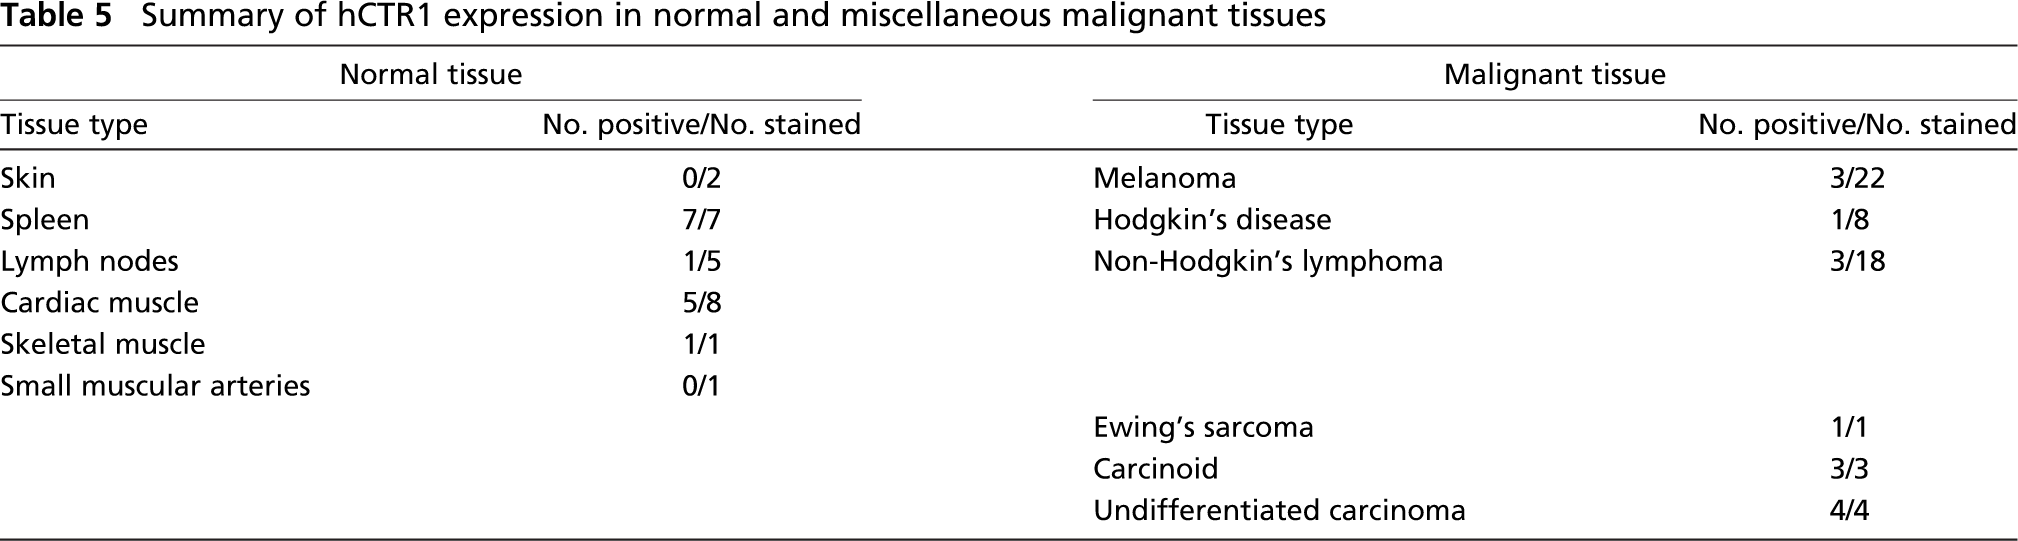
Summary of hCTR1 expression in normal and miscellaneous malignant tissues
It is important to note that many types of cells that stained strongly for hCTR1 are of enteroendocrine origin, and in many cases they fall into the family of amine precursor uptake and decarboxylation (APUD) cells. Additionally, APUD cells of the bronchiolar epithelium, parafollicular cells of the thyroid, and G cells of the stomach were also found to express high levels of hCTR1 (Ross et al. 2003). The best example is the pancreatic islets where the α cells responsible for secreting glucagon have high levels of hCTR1 expression, but the insulin-producing β cells do not. No specific relationship between the unique biochemical features of APUD cells and Cu metabolism has been identified. One possibility is that APUD cells require a specific Cu-dependent enzyme or process to manage the production and secretion of their various hormones and thus secondarily require a lot of Cu to service these enzymes (Petris 2004). Another possibility is that hCTR1 or Cu itself is involved in a critical step in the vesicle secretory process. This may also explain the expression of hCTR1 in only the distal tubules of the kidney, as they express many secretory systems as well. Cardiac cells may express hCTR1 due to the increased energetic needs of those cells. Cu is required for the proper function of cytochrome oxidase, which is an essential complex of the electron transport chain involved in the generation of ATP.
For the most part, frequency and intensity of hCTR1 staining in malignant tissues reflected the levels found in their normal tissue counterparts. The only example where a tumor arising from a non-expressing tissue expressed hCTR1 was testicular cancer, and in this study only one sample was available. Thus, unlike many other genes, expression of hCTR1 does not appear to be frequently upregulated by the transformation process. Among the tumors arising from normal tissues that expressed hCTR1, in the case of gastric carcinoma only, none of the tumor samples available for study expressed any hCTR1. Breast and colon cancers were of particular interest. Whereas hCTR1 was expressed in >60% of normal breast epithelia, only 18% of invasive breast cancers stained for hCTR1. In the case of colon carcinoma, although the frequency of staining in primary tumors was low, most metastases in lymph nodes stained strongly. Thus, it appears that the host tissue environment of the tumor cell may have a strong influence on the expression of hCTR1.
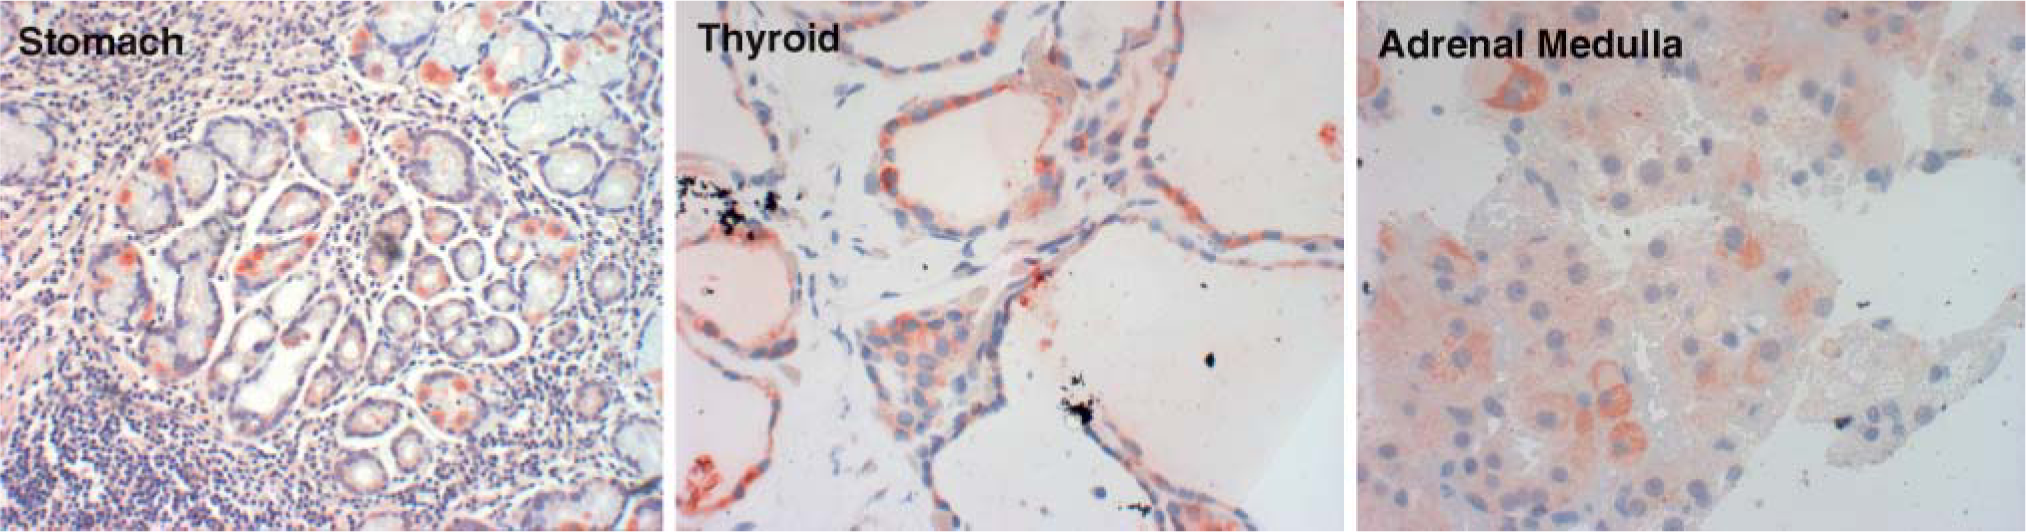
hCTR1 expression in normal human tissue possessing enteroendocrine cells. hCTR1 expression in gastrin cells of the stomach, C cells of the thyroid, and adrenal medulla.
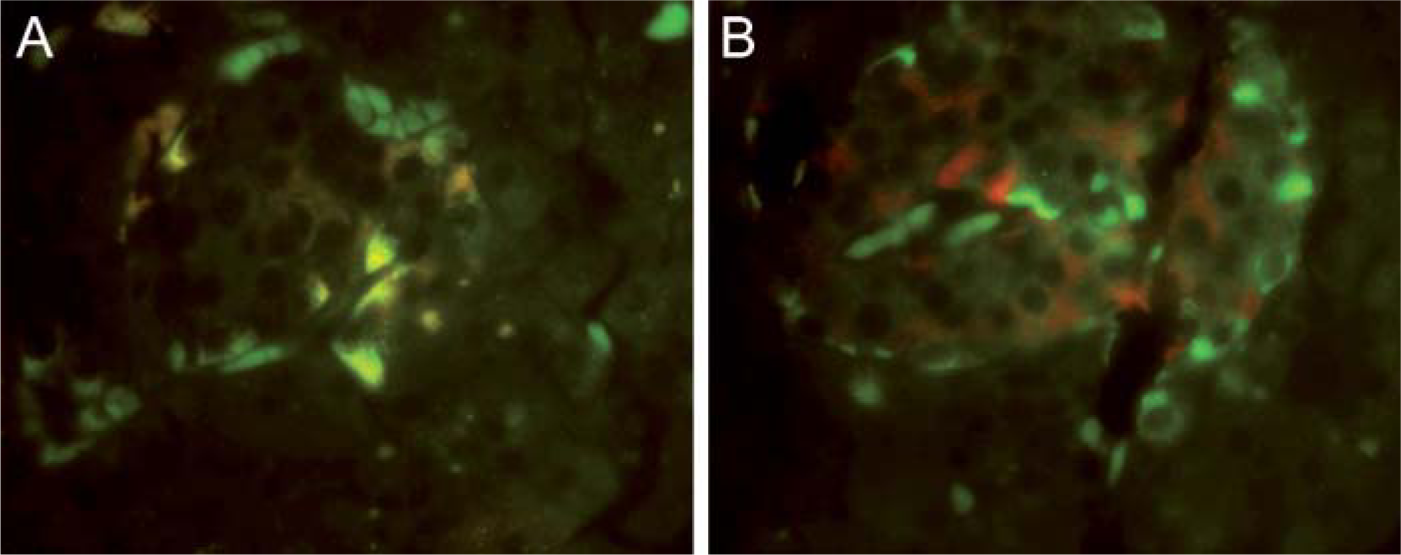
hCTR1 expression in cells of the pancreatic islet. (
Consistent with the fact that several types of APUD cells stained strongly in normal tissues, all three carcinoid tumors available exhibited strong staining. Despite not clearly being of APUD origin, the one case of Ewing's sarcoma stained intensely. Although cytogenetics and molecular methods are under development, it remains a challenge to distinguish between Ewing's sarcoma and related malignancies such as adult neuroblastoma, malignant small-cell tumor of the thoracopulmonary region (Askin's tumor), paravertebral small-cell tumors, and atypical Ewing's sarcoma. Whether IHC staining for hCTR1 can distinguish between these malignancies will require study of additional cases of Ewing's sarcoma as well other primitive tumors of neuroectodermal origin.
CTR1 clearly regulates the accumulation of DDP in several types of cells in vitro, and the question of whether hCTR1 expression is associated with clinical responsiveness to DDP is of substantial clinical importance. Among the types of tumors analyzed in this study, testicular and ovarian carcinomas are generally the most sensitive to cisplatin-containing regimens; however, the number of cases available for examination in this study was inadequate to permit identification of any association between hCTR1 expression and responsiveness. It is noteworthy that 5/12 patients with APUD tumors were reported to have attained a response when treated with a cisplatin-containing regimen (Sridhar et al. 1985) Thus, a particularly high-level expression of hCTR1 may, in fact, be a useful marker for DDP responsiveness. This potential association merits further investigation.
Footnotes
Acknowledgements
Supported in part by Grant CA-95298 from the National Institutes of Health, Grant DAMD17-03-1-0158 from the Department of Defense, and a grant from the Clayton Foundation for Medical Research.
The authors acknowledge Laarni Gapuz and the University of California San Diego, Moores Cancer Center immunohistochemistry core for technical assistance and Anette Berglund for assistance with the immunofluorescence staining. We also thank Claudette Zacharia for administrative assistance and the Biomedical Sciences Graduate Program for student support.