
Abstract
Transmissible spongiform encephalopathies (TSEs or prion diseases) are characterized by a constellation of typical though variable pathological changes in the brain. Deposition of disease-associated abnormal prion protein (PrPSc) is the pathological feature of TSEs most consistent and accessible for quantification. However, the evaluation of PrPSc deposits detected by immunohistochemical techniques has been traditionally based on arbitrarily assigned semiquantitative scores. This approach is limited by its subjectivity and bias, yielding considerable variability. In this study, we used MetaMorph 6.1 image analysis software for quantitative analysis of immunostained PrPSc deposits in the CNS of hamsters infected with the 263K strain of scrapie agent. Computerized morphometric analysis (CMA) allowed unambiguous detection of even minimal amounts of immunostained PrPSc. CMA values for intensity of staining and area stained correlated well with semiquantitative scores, providing reproducible quantitative data and objective criteria for analyzing PrPSc deposition. CMA provides a simple and reliable method for improved and consistent diagnosis of TSEs that may also be used to quantify other immunostained biomarkers.
Keywords
T
TSEs are characterized by a constellation of typical though variable pathological changes in the brain including vacuolation (spongiform changes), loss of neurons, and proliferation and hypertrophy of astrocytes, without inflammation or primary demyelinization, and accumulation of an abnormal form of the prion protein (designated “scrapie-type” PrP or PrPSc). PrPSc (sometimes called PrPres) is characterized by a loss of normal solubility in detergent-salt solutions and a relative resistance to digestion by the proteolytic enzyme proteinase K. The normal cellular form of PrP is called PrPC or PrPsen, because of its sensitivity to proteinase K digestion. In almost all cases of TSE in animals and humans, PrPSc is detectable in the brain parenchyma. Furthermore, the abnormal prion protein is considered to be the most probable cause of the other neuropathological changes in brains of animals and humans with TSEs (DeArmond 2004).
PrPSc is often detected by Western immunoblotting (Bellon et al. 2003; Bolton et al. 1982; Minor et al. 2004) or ELISA-based tests (Bellon et al. 2003; Safar et al. 2000; Safar et al. 2005), using proteinase K-treated extracts of unfixed tissue. When TSE has not been suspected in life, frozen brain tissue is usually not retained at autopsy, and PrPSc must be sought in fixed, paraffinembedded tissue. Successful detection of PrPSc by immunohistochemical (IHC) techniques in sections of fixed brain tissue depends on a number of factors including the amount of PrPSc present, the number and sites of areas examined, treatment of the tissue (fixation and antigen retrieval techniques), and properties of the anti-PrP antibody selected—especially the PrP epitopes with which the antibodies react. Postmortem interval appeared to have little effect on IHC results in brains of cattle with bovine spongiform encephalopathy (Debeer et al. 2001). Where histopathological changes are pronounced and substantial amounts of PrPSc are present in tissue, there is generally little difficulty in diagnosing TSEs. However, in cases in which neuropathological findings are minimal or atypical and IHC detection of PrPSc is equivocal, it would be desirable to have objective criteria to facilitate more consistent diagnosis of TSEs. Several groups proposed procedures to reduce the variability of IHC for detecting PrPSc (Bell et al. 1997; Van Everbroeck et al. 1999); however, no standard method has been universally accepted.
The evaluation of PrPSc deposition in tissues by IHC has traditionally been based on arbitrarily assigned semiquantitative scores. The data generated by such subjective estimations have most often been expressed by grading immunostaining on a rough numerical scale, with “—” meaning no staining and “+ + +” or “+ + + +” indicating a very strong positive signal. This approach is useful but inherently limited by observer subjectivity and bias, yielding considerable variability, particularly when tissue sections show minimal staining. Because the development of digital microscopic image analysis, substantial efforts have been made to correlate the evaluations made by experienced pathologists with quantitative values (Kohlberger et al. 1997, 1999; Chantrain et al. 2003; Ruifrok et al. 2003). Computerized image analysis has become popular in cancer research as a promising method to improve diagnosis and characterization of tumors (Kohlberger et al. 1997, 1999; Hannen et al. 2001). Efforts have also been made to use it in the diagnosis of TSEs (Sutherland et al. 1994, 1996a, b; Sutherland and Ironside 1994; MacDonald et al. 1996; Nailon and Ironside 2000). Encouraged by those studies, we sought to develop an automated image analysis system to facilitate objective and consistent diagnosis of TSE in tissue specimens based on detection of PrPSc by IHC. Our initial efforts, reported here, used a wellstudied experimental model of scrapie in hamsters to validate the method in a system in which conditions of infection and detection techniques can be carefully controlled.
Materials and Methods
TSE Agent
The TSE agent employed was the hamster-adapted 263K strain of scrapie agent (Kimberlin and Walker 1977) as 10% (w/v) homogenate of brain from terminally ill hamsters. The homogenates were clarified by low-speed centrifugation.
Animals and Inoculations
Anesthetized Golden Syrian hamsters (LGV/LAK; Harlan Madison, Indianapolis, IN) were inoculated intracerebrally with 0.03 ml of homogenate through a 28-gauge needle introduced into the left frontal region (as approved by the FDA CBER Institutional Animal Care and Use Committee). The anesthetic was Isoflurane (NLS Animal Health; Owings Mills, MD) enriched with oxygen. Control animals were similarly inoculated with clarified 10% normal hamster brain homogenate. Scrapie-infected hamsters at terminal stage of the disease, showing signs of advanced encephalopathy (ataxia, incoordination, and inability to eat or drink), were euthanized by carbon dioxide asphyxiation. Control animals remained well.
Tissue Collection
We euthanized clinically ill and control hamsters, removed brains using separate disposable instruments and fixed the brains in 10% buffered formalin. The brain tissue was divided using a previously described brain dissection scheme (Fraser and Dickinson 1968), slightly modified as shown in Figure 1. The tissue was then dehydrated and embedded in paraffin.
Immunohistochemistry
Formalin-fixed paraffin-embedded 5 μm thick brain tissue sections were mounted on CSS-100 silylated slides (Cel Associates, Inc.; Pearland, TX) that bind sections covalently by Schiff base aldehyde-amide chemistry (www.cel-1.com). The sections were then deparaffinized and rehydrated in graded alcohols to distilled water. To enhance antigen retrieval (Van Everbroeck et al. 1999), sections were subjected to hydrated autoclaving for 20 min at 121C in DAKO Target Retrieval Solution (DAKO Corp; Carpinteria, CA) followed by immersion in 95% formic acid for 5 min at room temperature (RT). The sections were then incubated with a 25 μg/ml solution of proteinase K (proteinase K, DAKO Corp, Carpinteria, CA) in TBS for 20 min at RT. The primary anti-PrP antibody used was the 7G5 mouse monoclonal antibody (Kascsak et al. 1993) that reacts exclusively with hamster PrP (reactive epitope YRPVDQYNN (Rubenstein et al. 1999)). The sections were incubated with 7G5 antibody at dilution 1:50 for 1 hr at RT. A biotinylated horse anti-mouse secondary antibody and avidin-biotin-alkaline-phosphatase complex (Vectastain ABC-AP Kit; Vector Laboratories, Burlingame, CA) were used. PrPSc was visualized with Vector Red alkaline phosphatase substrate according to kit directions. The sections were then counterstained with hematoxylin, dehydrated, and permanently mounted. We included a known positive infected brain and several negative controls in each run, including scrapie-infected hamster brain sections incubated with a 1:50 dilution of normal mouse IgG (Vector Laboratories Inc; Burlingame, CA) in place of primary mouse anti-PrP antibody, and sham-inoculated uninfected hamster brain sections incubated with 7G5 antibody. Incubation times, reagent volumes, and washing steps were optimized using an automated stainer (DAKO Corp.). The use of silylated slides significantly diminished tissue loss during the harsh pretreatment steps.
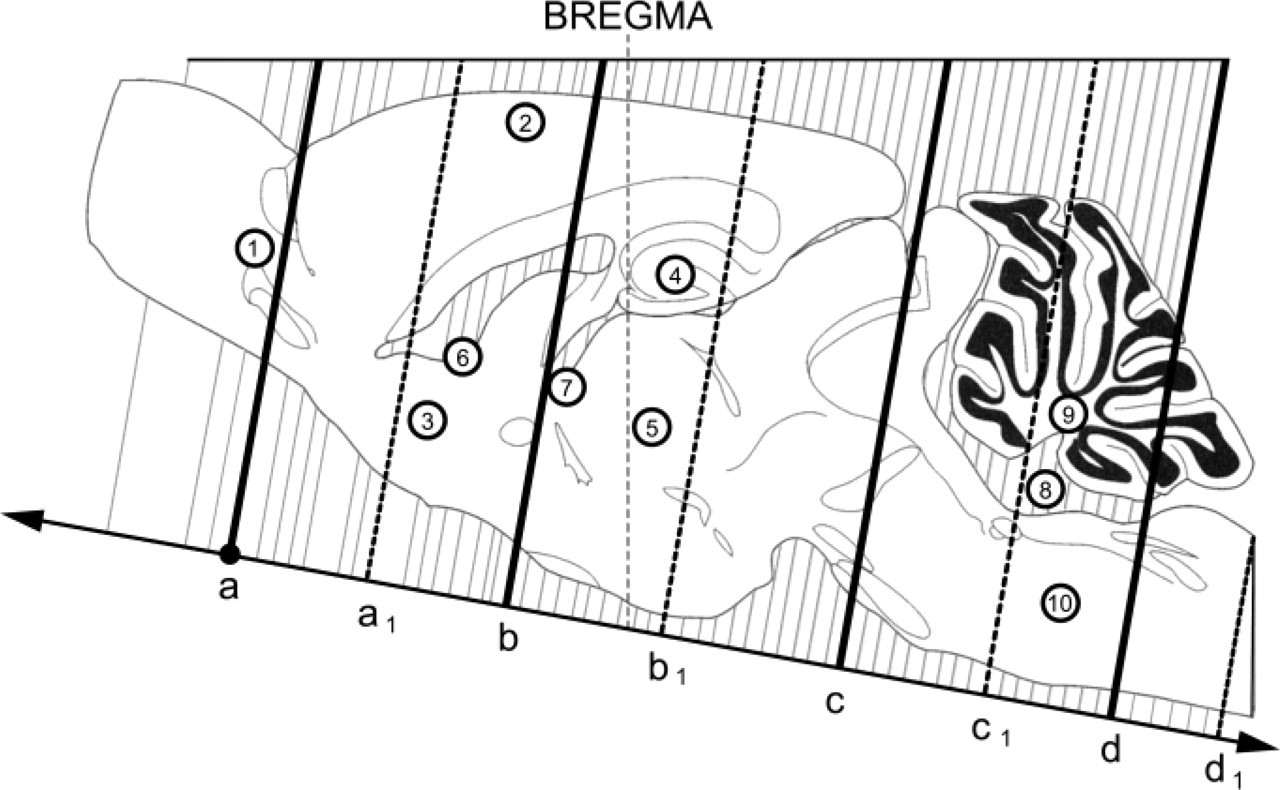
Scheme of dissection of hamster brain showing locations of coronal sections used to evaluate PrPSc immunostaining (modified with permission of the publisher from the atlas of Morin and Wood (2001). The drawing traces the outline and major structures of a parasagittal section 0.8 mm from the midline. Bregma represents the difference in angle of the plane of coronal sections versus the dorsoventral coordinate in a flat-skull orientation. The solid lines (a-d) depict the approximate location of four coronal sections along the rostrocaudal axis used to divide the hamster brain into five pieces. These pieces of hamster brain then underwent paraffin embedding. The dashed lines (a1-d1) show the approximate location of four additional coronal sections selected after sectioning of paraffinembedded brain tissue blocks. The arrows show the direction of sectioning. Two sections from locations depicted by each line (a-d1) were examined. The circled numbers show ten anatomic areas analyzed: (1) olfactory ventricles; (2) neocortex; (3) striatum; (4) hippocampus; (5) thalamus; (6) lateral ventricles; (7) third ventricle; (8) fourth ventricle; (9) cerebellum; (10) brain stem.
Semiquantitative Evaluation of PrPSc Detected by IHC
We recorded visual impressions of the intensity of PrPSc immunostaining in sections from 10 regions of the hamster brain: olfactory ventricles; neocortex; striatum; hippocampus; thalamus; cerebellum; brain stem; and the apical and basal aspects of ependymal linings of the lateral, third, and fourth ventricles; examining two coronal sections from each region (Figure 1, a-d1). First, we identified the topographical localization of PrPSc within the tissue of each anatomic region and recorded the patterns of accumulation of PrPSc. Then we scored intensity of PrPSc immunostaining using a conventional semiquantitative four-point scale (0, no staining; +, weakly positive staining; ++, moderately positive staining; +++, strongly positive staining).
Digital Image Acquisition
Digital images of microscopic fields of brain tissue (X40 plan objective and X10 ocular lenses) were acquired with a Nikon Eclipse E600 microscope, Nikon Digital Still Camera DXM1200 and ACT-1 software (Nikon Corp.; Tokyo, Japan), inserting an NCB11 color-balancing filter and two neutral-density filters (ND8 and ND32 with transmission rates of 12.5% and 3%, respectively) into the optical path to improve color balance and brightness; camera settings were at maximal sensitivity and 1/400 sec exposure time. We performed white balancing for all live images before acquisition. The final magnification of microscopic fields was X400, at which one pixel had an area of 0.054 μ2. Digital images were saved in 24-bit color TIFF format.
Image Analysis
We analyzed images using a Dell Dimension 8200 eight-bit computer and Dell 1702FP Flat Panel Color Monitor (Dell Computer Corporation; Round Rock, TX), with MetaMorph 6.1 software (Universal Imaging Corp.; Downingtown, PA). The images of microscopic fields of brain tissue from scrapie-infected and sham-inoculated hamsters, as well as other negative control images were thresholded with the command <Set Color Threshold> using the hue-saturation intensity (HSI) color model. The HSI model (Castleman 1998; Ma and Lozanoff 1999) defines a color based on its hue (the dominant wavelength of transmitted light), saturation or “purity” (the amount of admixed white light) and intensity or brightness (the reciprocal function of optical density). For a single analysis, an eight-bit computer assigns one of 28 integral values (256 possible integers, from 0 to 255) to each pixel.
Automated Discrimination of PrPSc Immunostaining
Ten digital images were acquired from high-power fields (X400) in each of 10 affected anatomical brain regions corresponding to each of the four semiquantitative intensity scores previously assigned by visual microscopic observation (0 to +++). To determine threshold values that discriminated PrPSc immunostaining from the counterstain and background, the red-green-blue (RGB) color mode values were converted to HSI values using MetaMorph 6.1 image analysis software (Universal Imaging Corp.), because unconverted RGB values are known to correlate poorly with human recognition of colors in transmitted-light microscopy (Fermin and Degraw 1995; Kohlberger et al. 1997,1999; Castleman 1998; Ma and Lozanoff 1999; van Der Laak et al. 2000; Hannen et al. 2001; Johansson et al. 2001; Ruifrok et al. 2003). The HSI system is thought to offer a much closer approximation to the behavior of human color vision than do untransformed RGB values (Kohlberger et al. 1997).
We next defined the “negative-chromaticity subdomain” (i.e., HSI threshold values range that included every pixel in the digital image of the negative control tissue section). First, we examined a set of 10 negative-control images from brain tissue sections of sham-inoculated animals. This kind of negative control should have contained any residual normal PrPC not entirely digested by proteinase K at the concentration used. Second, we evaluated 10 negative control images from brain tissue sections of scrapie-infected animals processed with the same IHC protocol but in which the primary mouse anti-PrP antibody was replaced with normal mouse IgG. To select the inclusive HSI threshold value range we used the MetaMorph <Set Color Threshold> command. For every pixel in an image, the values of hue, saturation, and intensity are transformed independently to one of 256 integral values from 0 to 255, and a range of values to be counted as “data of interest” can be selected for each parameter. Figure 2 shows the MetaMorph 6.1 window display during selection of the HSI value range for the negative control image of cerebellum of sham-inoculated hamster brain. The inclusive threshold value range for hue was increased until all pixels present in the image were included. Threshold values for saturation and intensity; however, we allowed to include the entire range of all possible values (0–255) present. The thresholded image in Figure 2 displays each pixel transmitting light of HSI properties within the selected threshold range by overlaying with operator-selected orange “pseudocolor.” For this particular image, the selected inclusive threshold range of 0–185 for hue and 0–255 for both saturation and intensity appeared to include every pixel. Nevertheless, the percentage of thresholded area to whole area of the image was calculated to confirm the accuracy of inclusive threshold range selected. The exact HSI threshold range for the negative control image was defined when the percentage of thresholded area was 100%, meaning that all color information associated with the negative control section fell within the defined HSI negative-chromaticity subdomain (Figure 2).
We calculated a mean hue range of 0 to 180 with a standard deviation of the upper bound of ×5 for a set of 20 negative control images (data not shown) and defined a hue threshold range of 0–185 (mean plus one standard deviation for the upper limit). Hence, the chromaticity subdomain for negative control images was defined (hue 0–185, saturation 0–255, and intensity 0–255).
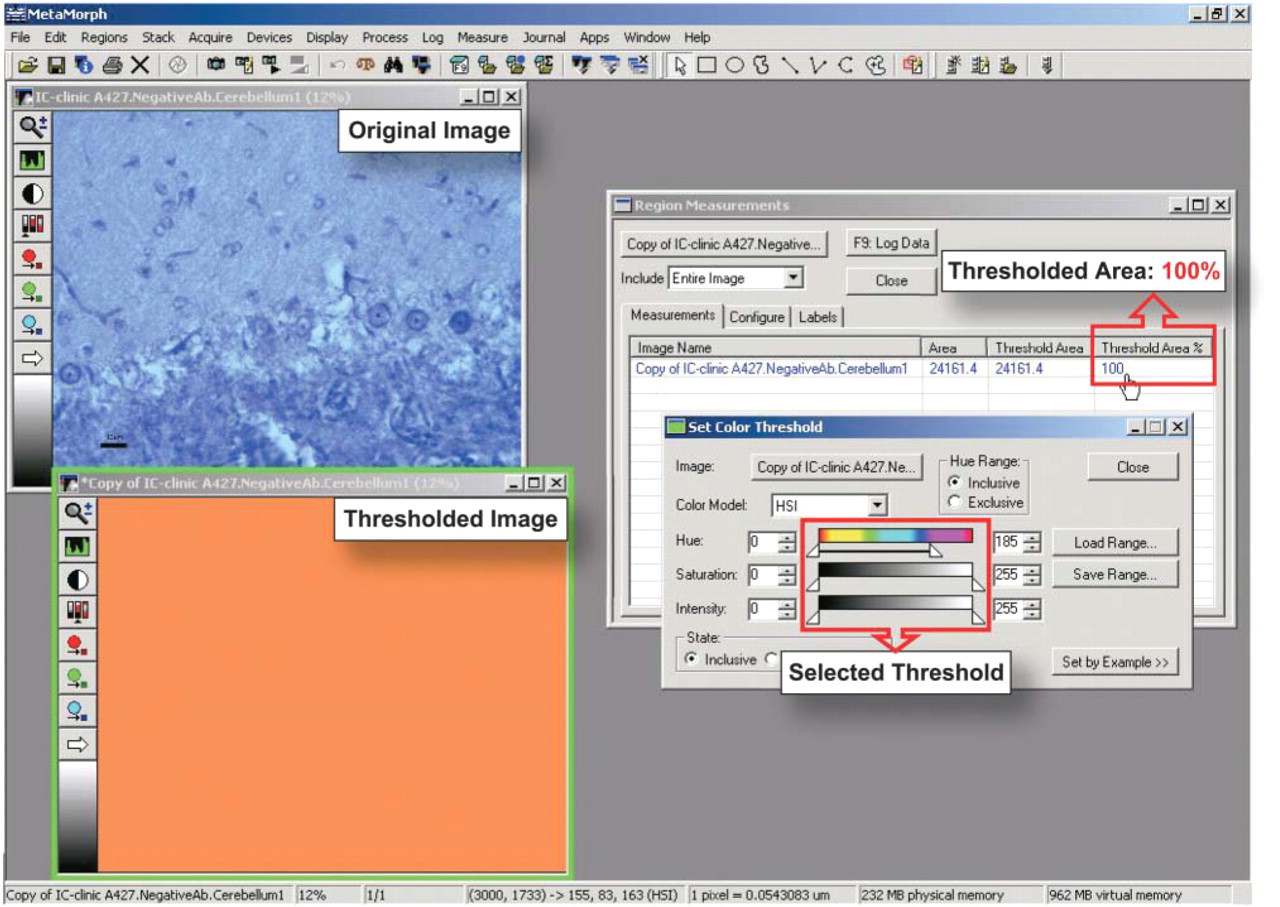
The MetaMorph 6.1 window display during selection of the threshold hue-saturation-intensity (HSI) values for a negative control image as described in the text. The original image to be analyzed represents section of cerebellum of scrapie-infected hamster brain (X400) incubated with normal mouse IgG in place of primary mouse anti-PrP antibody. The <Set Color Threshold> dialog box shows selected threshold values for hue (0–185), saturation (0–255), and intensity (0–255). The thresholded image displays each pixel transmitting light of the selected HSI properties by applying an overlay of investigator-selected orange color. We confirmed the accuracy of the inclusive HSI threshold ranges selected for this negative-control image by calculating the percentage of thresholded area of the image. The <Region Measurements> dialog box shows the area of the original image (24,161.4 μ2), thresholded area (24,161.4 μ2) and the percentage of the thresholded area to whole area of image (100%).
The next step was to define similarly a positive-chromaticity subdomain—a set of HSI threshold value ranges selected such that no pixel with the negative-control hue would confound the identification of positively stained areas. It was reasonable to assume that a subdomain selected from the hue range remaining after subtracting the negative control range should carry color information for a stain of another hue not present in the negative control. In our experiments, to visualize PrPSc we used Vector Red chromogen that produces a magenta-red colored product. Because all negative-control pixels had hue values ranging from 0 to less than 185, we set hue thresholds for positive pixels at 185–255 (Figure 3). Threshold values for saturation and intensity we again allowed to include the entire possible ranges of 0–255. When we applied this positive threshold value range to negative-control images, as predicted, no pixels were identified. Thus we defined the positive-chromaticity subdomain for PrPSc immunostaining in the threshold range of hue 185–255, saturation 0–255, and intensity 0–255. The hue threshold value ranges defined in this way unambiguously discriminated each pixel as either negative or positive without any need to threshold for saturation. Intensity must be displayed over its entire range of values to evaluate the optical density of immunostaining and could not be thresholded.
Statistical Analysis
The JMP statistical analysis package (SAS Institute, Inc.; Cary, NC) was used to calculate the Pearson simple correlation between thresholded area and total integrated optical density of PrPSc deposits, and the standard deviations of the distributions within different size categories of positively stained objects. The analytical routines contained in the MetaMorph 6.1 package were used to calculate the variance of optical density within PrPSc deposits of different sizes and in different anatomical areas.
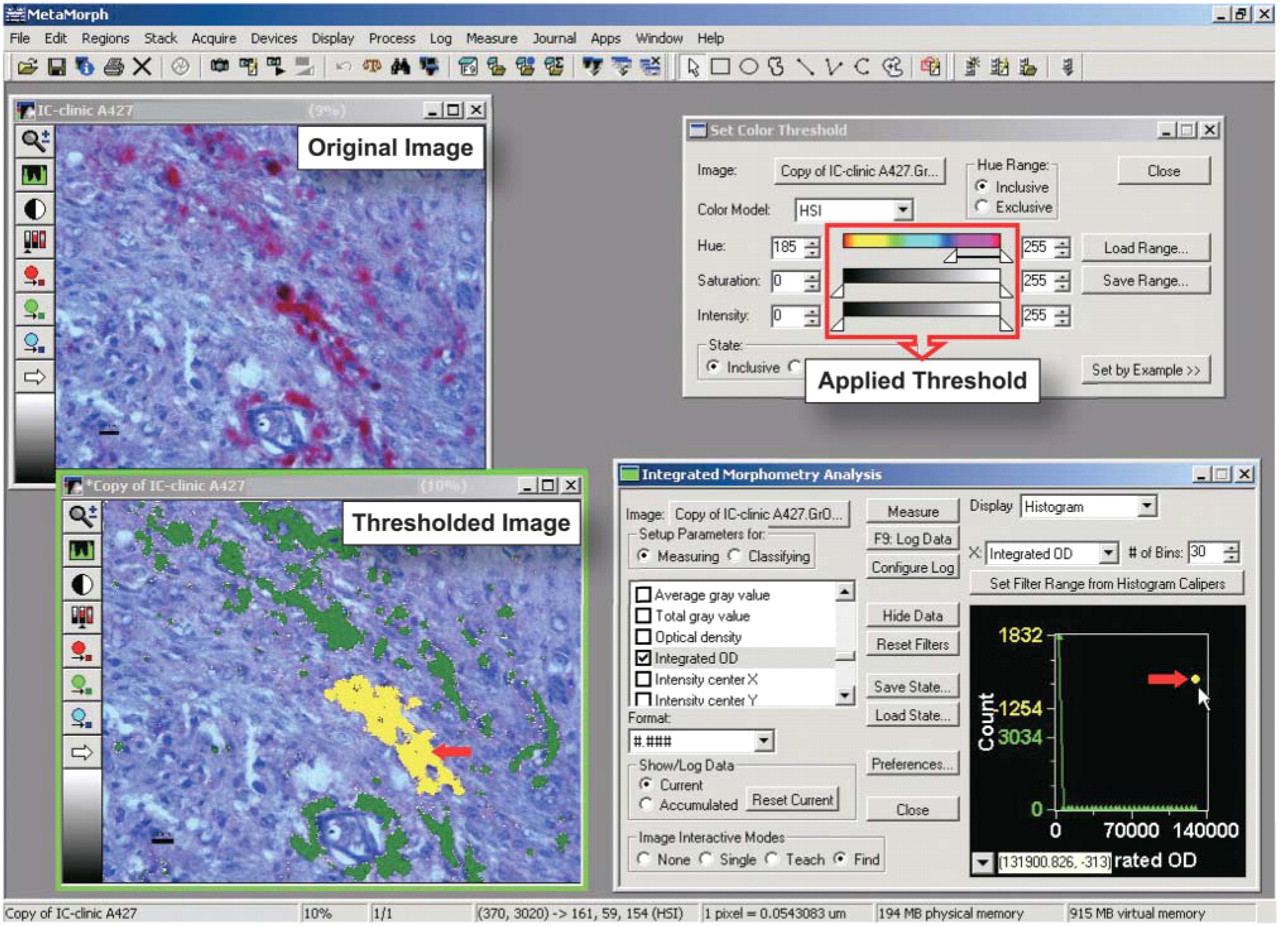
MetaMorph 6.1 window display during analysis of strong (+++) PrPSc immunostaining in the anterior olfactory nucleus of a scrapie-infected hamster brain. Here the <Set Color Threshold> dialog box shows threshold values for hue (185–255), saturation (0–255), and intensity (0–255) that discriminated specific PrPSc immunostaining (magenta-red color produced by Vector Red chromogen) from the blue hematoxylin counterstaining and background. Both original and thresholded images are shown. The <Integrated Morphometry Analysis> dialog box displays the integrated optical density (IOD) of all thresholded objects grouped in the histogram by their increasing density. We set the <Find> image interactive mode to display the objects having IOD selected from the histogram in the thresholded image. The yellow pseudo-color overlay highlights the objects with maximal IOD, both in the histogram and in the thresholded image (red arrows); the green overlay displays the other thresholded objects (of lower IOD).
Results
Qualitative and Semiquantitative Evaluation PrPSc Immunostaining
In this study, we performed visual qualitative evaluations of the tissue localization and patterns of accumulation of PrPSc, and we assigned semiquantitative scores for intensity of PrPSc immunostaining. Based on our multiple observations, we identified 10 major anatomic structures of hamster brain that consistently contained deposits of PrPSc after intracerebral inoculation with scrapie agent: (1) periependymal zone of olfactory ventricles, (2) neocortex, (3) striatum, (4) hippocampus, (5) thalamus, periependymal zones of (6) lateral ventricle, (7) third ventricle, and (8) fourth ventricle, (9) cerebellum, and (10) brain stem. Analyses of the topographical localizations of PrPSc deposits within the affected brain regions revealed four major patterns: parenchymal, subpial, perivascular, and periependymal types (Figure 4). The parenchymal pattern was a diffuse fine deposition of PrPSc in the neuropil. A second pattern (subpial pattern) was deposition of PrPSc in subpial spaces of the central nervous system. Deposits of PrPSc within perivascular spaces (perivascular pattern) were also observed frequently in brains of hamsters infected with scrapie. A fourth distinct pattern observed consistently was deposition of PrPSc in subependymal spaces of the ventricular system of the brain. It may be noteworthy that deposits of PrPSc were often seen on the luminal surface of ventricular walls, suggesting association with cilia of ependymal cells. The cytoplasm of ependymal cells nevertheless appeared to be intact. Based on the features described here, we defined this fourth pattern of PrPSc deposition as periependymal (Figure 4D). The patterns of accumulation of PrPSc itself were presented as diffuse, punctate, or synaptic-like immunostaining; scattered granular; and coarse deposits often forming amorphous masses. To evaluate the intensity of PrPSc immunostaining, we assigned semiquantitative scores using the grading scale described in Materials and Methods. Figure 5 displays representative brain tissue fields corresponding to each semiquantitative score (0, +, ++, and +++).
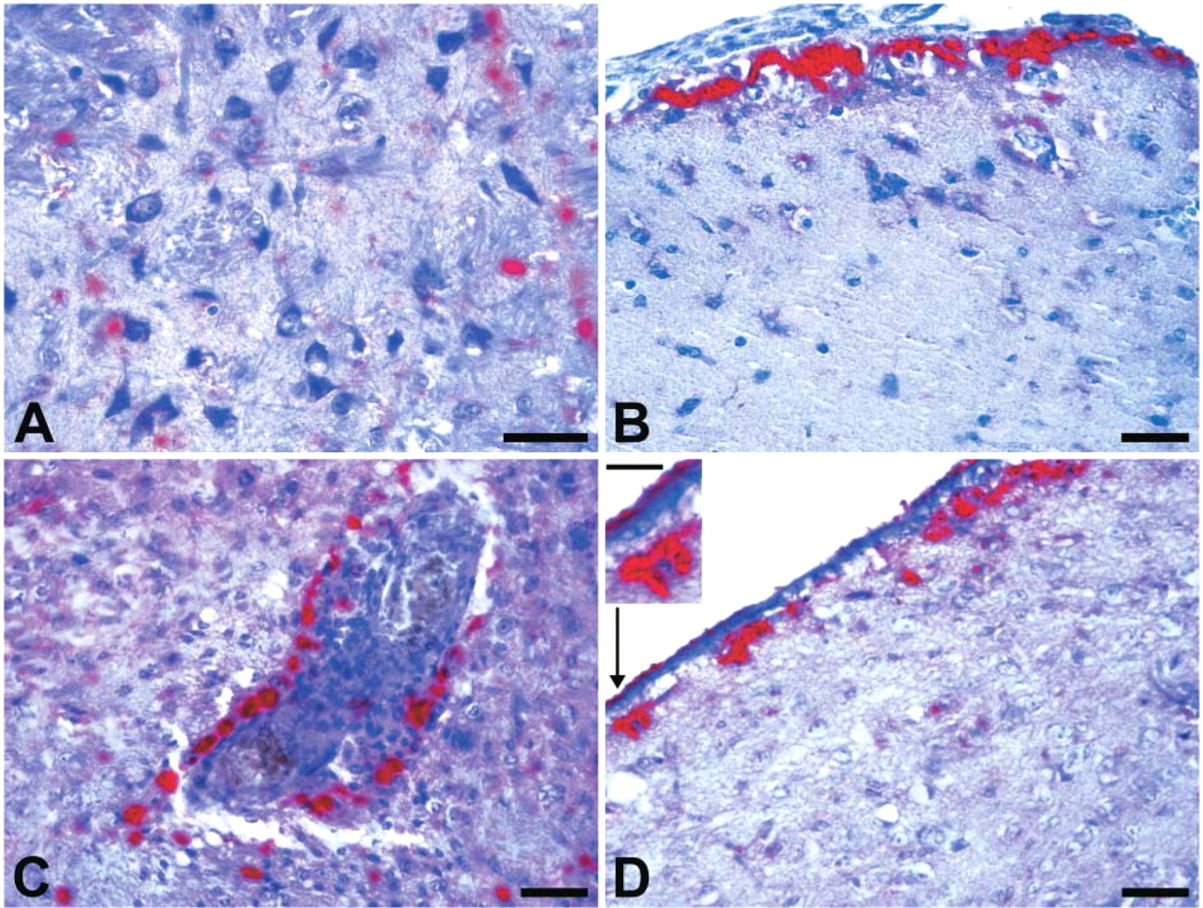
Topographical localization of PrPSc deposits in brain tissue of scrapie-inoculated hamsters. (
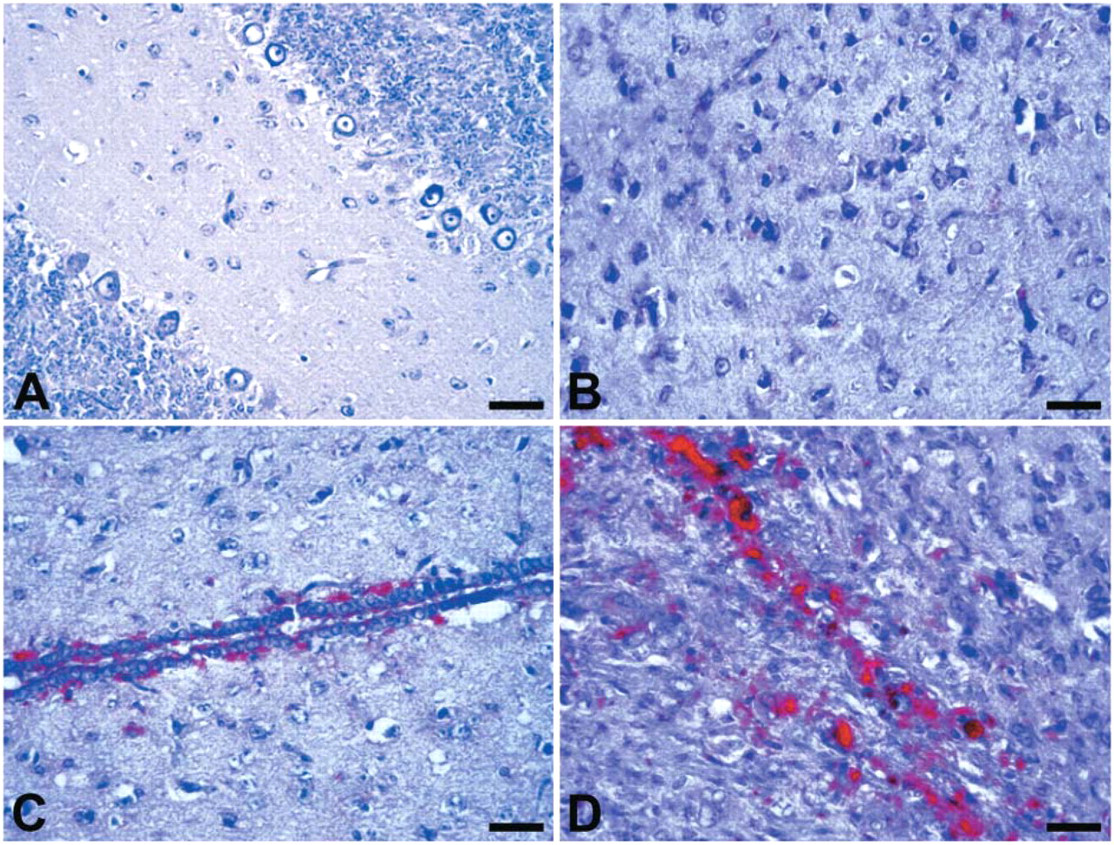
The representative brain tissue fields corresponding to each semiquantitative score of PrPSc immunostaining. (
Computerized Morphometric Analysis of PrPSc Immunostaining
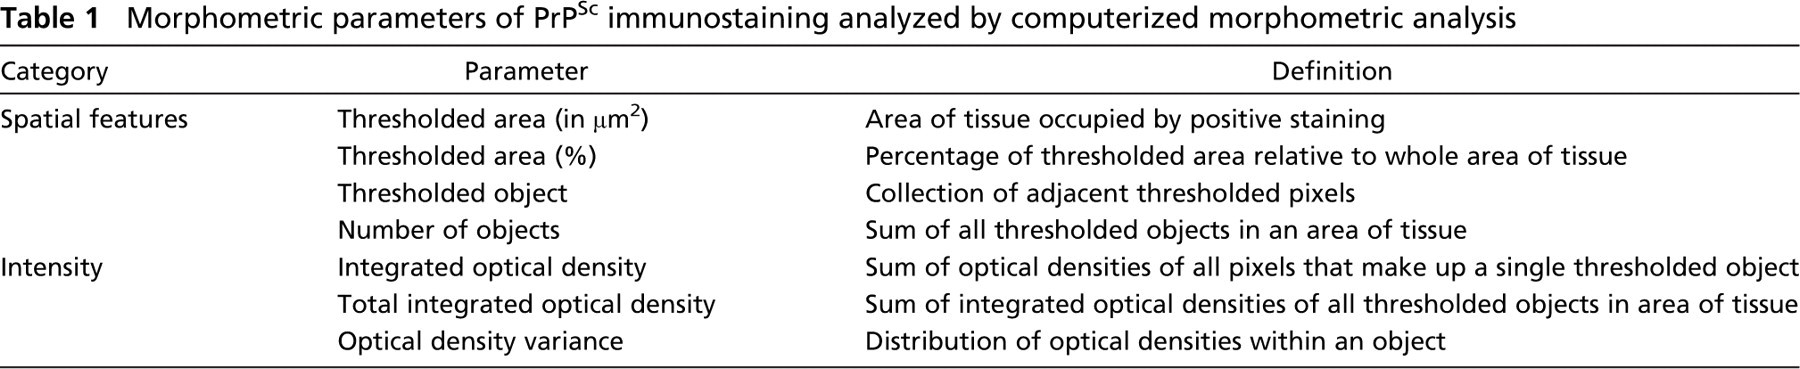
We analyzed thresholded PrPSc immunostaining in scrapie-infected tissue sections using the <Integrated Morphometry Analysis> tools of MetaMorph 6.1 (Figure 3). Two general morphometric categories were analyzed to characterize PrPSc immunostaining: spatial features and intensity. The definitions for morphometric parameters measured are given in Table 1. The intensity of PrPSc immunostaining was evaluated by measuring the optical density expressed as the inverse logarithm of the grayscale transmittance of each thresholded pixel.
Morphometric parameters of PrPSc immunostaining analyzed by computerized morphometric analysis
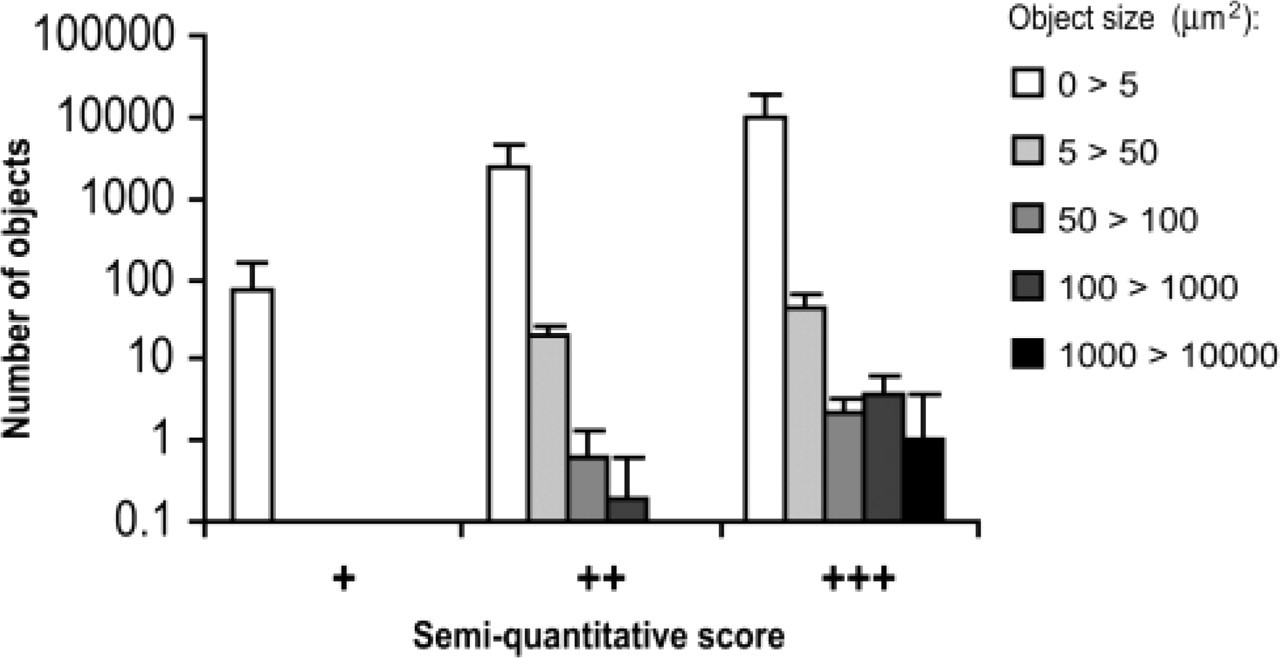
Distribution of PrPSc deposits based on the number of objects and their size in affected areas of scrapie infected hamster brain. Histogram displays the number of positively stained objects (PrPSc deposits) of different size within images of brain tissue fields corresponded to each semi-quantitative score (+, ++, +++). The error bars represent the numbers of PrPSc deposits of defined size ranges for set of 10 images of affected tissue fields.
As noted previously, we observed four distinct patterns of PrPSc accumulation in brains of scrapie-infected hamsters distinguished by sizes and shapes of the stained deposits (diffuse, punctate, scattered granular, and coarse deposits). However, different affected areas of brain tissue with PrPSc immunostaining that had been assigned moderate (++) and strong (+++) semiquantitative scores all contained mixed patterns. The areas of tissue with weak (+) semiquantitative scores demonstrated uniform patterns of diffuse PrPSc immunostaining. We performed computerized morphometric analysis (CMA) of patterns of PrPSc accumulation using images of brain tissue fields corresponding to each semi-quantitative score. The distribution of PrPSc deposits based on the number of objects and their size in affected brain areas versus semiquantitative scores is plotted in Figure 6. The images of affected tissue fields with weak PrPSc immunostaining (+) were comprised of small uniformly stained objects, each less than 5 μ2 in area. In images with moderate immunostaining (++), all four staining patterns of PrPSc accumulation were present; diffuse immunostaining was still predominant, but objects of larger sizes (5–1000 μ2) were also found. Finally, images with strong immunostaining contained a fifth population of large objects with areas of 1000–10,000 μ2, represented by coarse confluent PrPSc deposits often forming amorphous masses.
We also performed analysis of the distributions of optical density within PrPSc deposits of different sizes. The <Integrated Morphometry Analysis> tool of MetaMorph 6.1 measures the optical density variance by assigning values from 0 to 1.0, where variance approaches zero for objects of uniform density. All PrPSc deposits found in different areas of scrapie infected hamster brain demonstrated very uniform distribution of optical density (<0.01) regardless of the object size (data not shown).
The data generated by CMA also allowed us to analyze the relationship between a spatial parameter (the positive thresholded area) and the intensity of PrPSc immunostaining expressed as total integrated optical density (IOD) (Figure 7). The areas of scrapie-infected hamster brain tissue occupied by PrPSc immunostaining had a linear relationship with the IOD of PrPSc deposits (Pearson simple correlation, r = 0.9920). Interestingly, when the quantitative data obtained from the analysis of 30 images of different affected areas (3 images per area) were plotted on the chart, they appeared to be grouped into two distinct clusters (A and B, Figure 7). The first cluster contained only data from images corresponding to weak (+) PrPSc immunostaining. A second cluster included data from images corresponding to both moderate (++) and strong (+++) scores. The difference in quantitative data (thresholded area and IOD) between these two clusters was about three orders of magnitude. Hence, the quantitative data for PrPSc immunostaining generated by CMA correlated well with visual semiquantitative scores but were more informative, providing objective criteria that discriminated the extent and intensity of PrPSc immunostaining in scrapie-affected tissue.
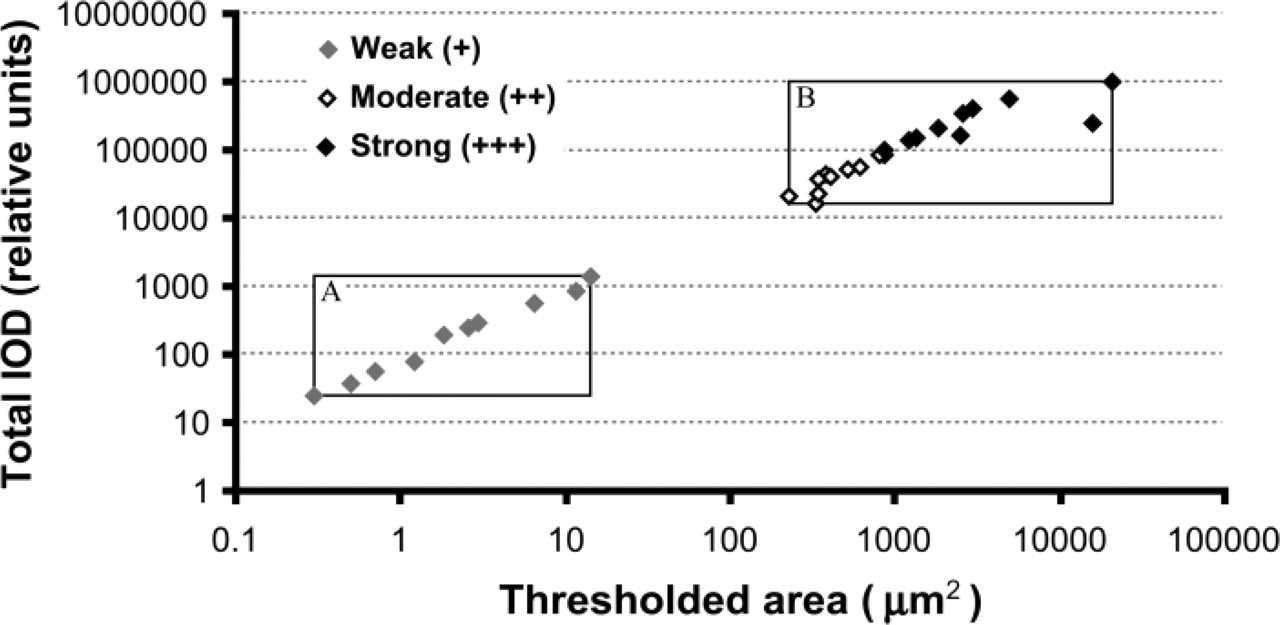
Correlation between area of the image occupied by PrPSc immunostaining (thresholded area) and total integrated optical density (IOD) of PrPSc deposits. The images corresponded to each semiquantitative score of PrPSc immunostaining are shown by filled diamonds in gray and filled and open diamonds in black (see legends). Squares outline two distinct clusters of quantitative data of PrPSc immunostaining. Square A contains only data from images corresponded to weak (+) immunostaining. Square B includes data from images corresponded to both moderate (++) and strong (+++) immunostaining.
Discussion
This study describes a novel method for quantitative computer-assisted image analysis of IHC-stained PrPSc. Our goal was to develop objective quantitative criteria that reliably identified brains of hamsters experimentally infected with a laboratory strain of scrapie agent. Having done that, we plan to apply the method to other tissues, other animal TSE infections, and, eventually, to human TSEs. To develop an objective method, we first standardized the IHC procedure for PrPSc to reduce variability and inconsistency in evaluations of tissue specimens. We used a combination of pretreatments previously reported to improve PrPSc detection (Sigurdson et al. 1999,2001; Van Everbroeck et al. 1999; Debeer et al. 2001).
Evaluation of immunostaining usually includes both spatial characterization and semiquantitative grading of intensity and amount of staining. In this study, we recorded anatomic localizations, patterns of PrPSc immunostaining, and visual estimates of the intensity of staining. Although experienced observers are probably quite accurate in localizing areas of immunostaining and patterns, their semiquantitative estimates of intensity or amount of staining are inherently limited by individual subjectivity and bias, leading to variation in readings by the same observer at different times as well as interobserver disagreement.
Since its early development, digital microscopic image analysis has offered the potential for improving the objectivity of microscopic observations and quantifying the results of IHC. Substantial efforts have already been made to convert the evaluations of experienced pathologists into quantitative values in cancer research (Kohlberger et al. 1997,1999; Chantrain et al. 2003; Ruifrok et al. 2003). One research group has attempted to develop computerized methods to quantify spongiform changes (Sutherland and Ironside 1994), amyloid plaque formation (Sutherland et al. 1994), and nonplaque PrPSc (MacDonald et al. 1996; Sutherland et al. 1996a,b; Nailon and Ironside 2000) in brain and other tissues of patients with Creutzfeldt-Jakob disease. Unfortunately, those studies, although of great interest, used custom-designed software and analyzed monochrome images of diaminobenzidine visualized immunostaining that may be poorly quantifiable (Bigini and Mennini 2004). In this study, PrPSc immunostaining was visualized with Vector Red alkaline phosphatase substrate, reported to yield excellent quantitative microdensitometric evaluation of intensity of immunohistochemical staining (Ermert et al. 2001). In an attempt to develop a technically simple, reliable, and reproducible method to analyze deposition of PrPSc in tissues infected with prions, we used the commercially available MetaMorph 6.1 image analysis software. Consistent with a previous report, we found that MetaMorph software provided objective criteria useful to detect and quantify immunohistochemical staining (Chantrain et al. 2003). Our study demonstrated that thresholding of PrPSc immunostaining based on the HSI color model unambiguously and correctly discriminated sections of brain positive for PrPSc from negative control specimens. The concordance between areas of brain tissue identified as positive or negative for PrPSc content by blinded observers and by quantitative image analysis of spatial parameters of PrPSc immunostaining was perfect. However, interobserver disagreement in evaluation of borderline cases when tissue sections show minimal staining might be a problem. In our study, the computerized morphometric analysis allowed us to detect unambiguously even minimal amounts of immunostained PrPSc present in infected tissue. Although the fact that CMA was performed on previously selected tissue fields corresponding to each semiquantitative score suggests a potential source of bias, the repeated finding of similar results for 10 brain areas most often affected is reassuring.
The quantitative analysis of spatial parameters provided useful characterization of patterns of PrPSc deposition in brains of scrapie-infected hamsters. Within affected brain regions, PrPSc was present in small deposits less than 5 μ2 in area and coalescent deposits as large as 10,000 μ2. Interestingly, the measurement of optical density of immunostained objects demonstrated that in brain tissue of hamsters inoculated intracerebrally with 263K strain of scrapie agent PrPSc accumulated in aggregates of very uniform density. The distributions of pixel optical densities in PrPSc aggregates, regardless of object size, was very uniform without concentrating on the periphery or in the center of the object. The integrated optical density of PrPSc deposits reflected the intensity of positive immunostaining as a reciprocal function and was related directly to the area of brain tissue occupied by PrPSc immunostaining, so that either the total area strained or the total intensity of stain measured at the selected hue threshold range could be used to quantify PrPSc deposition. Both the quantification of area stained and integrated optical density of PrPSc immunostaining in selected fields correlated well with subjective evaluations by two independent observers. Other studies have also compared computerized image analysis with conventional semiquantitative scoring and concluded that the former had higher objectivity and reproducibility (Kohlberger et al. 1997,1999).
CMA of PrPSc immunostaining would be of greatest practical help to improve the diagnosis of TSEs when tissue is obtained during the preclinical incubation period or relatively early in disease. That would be important in itself and important for helping to assure the suitability of potential donors of human cadaveric tissues and sources of animal tissue used as ingredients and reagents in the manufacture of biological products. We plan to apply the quantitative morphometric analysis of PrPSc to evaluate brain and other tissues from humans and animals with TSEs with the goal of developing quantitative objective criteria that are sufficiently sensitive, specific, and reproducible to assist both in diagnosis of disease and in regulatory decision making.
Footnotes
Acknowledgements
The authors of this article have no duality of interest to declare. No endorsement by the FDA of the results or interpretation of this work or of any product used in the work is intended or should be inferred.
We thank Dr. Richard Kascsak and colleagues (Institute for Basic Research in Developmental Disabilities, Staten Island, NY) who kindly provided us with the 7G5 mouse monoclonal antibody. We thank Drs. Gerald Feldman and Jacqueline Muller, FDA, for helpful review of the manuscript.