
Abstract
We have previously shown methacarn to be a versatile fixative for analysis of proteins, DNA, and RNA in paraffin-embedded tissues (PETs). In this study we analyzed its suitability for quantitative mRNA expression analysis of microdissected PET specimens using a real-time RT-PCR technique. Fidelity of expression in the methacarn-fixed PET sections, with reference to dose-dependent induction of cytochrome P450 2B1 in the phenobarbital-treated rat liver, was high in comparison with the unfixed frozen tissue case, even after hematoxylin staining. RNA yield from methacarn-fixed PET sections was equivalent to that in unfixed cryosections and was also not significantly affected by hematoxylin staining. Correlations between the expression levels of target genes and input amounts of extracted RNA in the range of 1–1000 pg were very high (correlation coefficients >0.98), the regression curves being similar to those with unfixed cryosections. Although cell numbers should be optimized for each target gene/tissue, ≥200 cells were necessary for accurate measurement in 10-μm-thick rat liver sections judging from the variation of measured value in small microdissected areas. These results indicate high performance with methacarn, close to that of unfixed tissues, regarding quantitative expression analysis of mRNAs in microdissected PET-specimens.
Keywords
T
For histological assessment, tissue fixation and subsequent paraffin embedding are routinely employed because of the ease of handling tissues and subsequent staining, as well as the good preservation of morphology. Usually, formaldehyde-based fixatives, such as buffered formalin, are used for this purpose. However, with such crosslinking agents there is limited performance in terms of the yield and quality of extracted RNA (reviewed by Srinivasan et al. 2002), protein (Ikeda et al. 1998; Shibutani et al. 2000), and genomic DNA (Srinivasan et al. 2002), with consequent difficulty in the analysis of microdissected, histologically defined tissue areas. Extraction efficiency and quality of molecules are critical for analysis in microdissected cells. Recently, we found that methacarn, a non-cross-linking organic solvent fixative (Puchtler et al. 1970), meets critical criteria for analysis of RNAs, proteins, and DNAs in microdissected defined areas of paraffin-embedded tissue (PET) sections by simple extraction protocols (Shibutani et al. 2000; Shibutani and Uneyama 2002; Uneyama et al. 2002). With regard to RNA expression analysis using RT-PCR, long RNA fragments as well as rare RNA species can successfully be amplified from methacarn-fixed PET sections (Shibutani et al. 2000).
For RNA expression analysis in microdissected tissue samples, PCR-based techniques are suitable because of their sensitivity with samples having as few as 10 copies of a specific transcript. In this study we examined the suitability of methacarn fixation for measurement of mRNA expression levels in microdissected PET specimens using real-time PCR (Higuchi et al. 1992, 1993). For this purpose, we assessed (a) fidelity of mRNA expression in comparison with unfixed frozen tissue, (b) abundance of amplifiable mRNAs in comparison with unfixed cryosections, (c) linearity between the input amount of extracted total RNA and the expression level, (d) effect of tissue staining with hematoxylin, and (e) cell numbers required for practical measurement of mRNA expression in hematoxylin-stained tissue.
Materials and Methods
Animals and Experimental Design
Sprague-Dawley rats from Charles River Japan (Kanagawa, Japan) were used. They were maintained in an air-conditioned animal room (temperature 24 ± 1C; relative humidity 55 ± 5%) with a 12-hr light/dark cycle and allowed ad libitum access to feed and tap water. All animals, including pregnant rats, were housed individually in polycarbonate cages with wood chip bedding.
To measure the dose-dependent induction of cytochrome P450 (CYP) 2B1 mRNA in the liver by treatment with sodium phenobarbital (PB; Wako Pure Chemical Industries, Osaka, Japan), female rats received daily IP injections of PB at doses of 0 (vehicle saline), 1.25, 5, 20, or 80 mg/kg body weight/day for 3 days and were sacrificed 24 hr after the last injection. The highest dose was selected according to the PB-specific enzyme induction protocol described by Kocarek et al. (1998). For practical assessment in microdissected areas, region-specific expression of mRNAs was measured in the hypothalamic medial preoptic area (MPOA) in male and female pups at postnatal day 10, the time point for the late stage of brain sexual differentiation in rats (Rhees et al. 1990a, b).
All animals used in the present study were sacrificed by exsanguination from the abdominal aorta under ether anesthesia. The animal protocols were reviewed and approved by the Animal Care and Use Committee of the National Institute of Health Sciences, Japan.
Tissue Fixation
Methacarn solution consisting of 60% (v/v) absolute methanol, 30% chloroform, and 10% glacial acetic acid was freshly prepared before fixation and stored at 4C until use. At autopsy, livers were removed and 3-mm-thick slices or 5 × 5 × 3 mm-sized tissue blocks were prepared from the left lateral lobe and fixed in methacarn for 2 hr at 4C with gentle agitation. Whole brains of rat pups were also removed and subjected to methacarn fixation. For embedding, liver slices/blocks and coronal brain slices, including the hypothalamus, were dehydrated three times for 1 hr in fresh 99.5% ethanol at 4C, immersed in xylene for 1 hr and then three times for 30 min at room temperature (RT), and immersed in hot paraffin (60C) four times for 1 hr, for a total of 4 hr. Embedded tissues were stored at 4C for up to 6 months until tissue sectioning. Unfixed liver tissue samples, either 3 × 3 × 1 mm or 5 × 5 × 3 mm, were also prepared from portions adjacent to the tissue samples for methacarn fixation and immersed in RNAlater (Ambion; Austin, TX) overnight at 4C, or embedded in Tissue-Tek 4583 OCT compound (Sakura Finetek Japan; Tokyo, Japan) by quick freezing on dry ice. They were stored at −80C until direct extraction of RNA or sectioning before RNA extraction, respectively. For immunohistochemical analysis of MPOA in pups, brains were immersed in 10% neutral buffered formalin (pH 7.4) overnight at RT with gentle agitation. Coronal brain slices that included the hypothalamus were then routinely embedded in paraffin.
Preparation of Tissue Specimens and Microdissection
For assessment of dose-dependent induction of CYP2B1 in the rat liver by PB treatment, methacarn-fixed PETs were sectioned at 10 μm and mounted on 2.5-μm PEN-foil film (Leica Microsystems; Tokyo, Japan) overlaid on a glass slide that had been treated with 3% H2O2 for 10 min, rinsed with absolute ethanol, and then dried in an incubator overnight at 37C. The sections were deparaffinized by immersion in xylene twice for 2 min, followed by 99.5% ethanol once for 30 sec. Sections were either unstained or stained with Tissue Tek Hematoxylin 3G (Sakura Finetek Japan) for 10 sec, rinsed briefly with water, and air-dried. For assessment of linearity between the input amounts of total RNA and expression levels of target genes, as well as for estimation of the relative abundance of amplifiable mRNAs, series of 20 10-μm-thick sections were prepared from 5 × 5 × 3-mm unfixed frozen tissues and methacarn-fixed PETs and were collected into 1.5-ml tubes. Integrity of extracted total RNA was also examined in these preparations by judging the resolution of rRNAs in agarose gel. In this experiment, effect of fixation itself on the integrity was also examined with fresh-frozen sections fixed with methacarn for 10 min at 4C. For preparation of tissue sections and hematoxylin staining, RNase-free ultrapure water, prefiltrated with a Gengard filter attached to an Elix 3 ultrapure water system (Millipore; Billerica, MA) was employed. Whole tissue areas of methacarn-fixed PET sections were dissected together with PEN-foil film and collected into 1.5-ml tubes for the dose-dependent expression analysis. With microdissected small tissue areas, hematoxylin-stained 10-μm-thick sections were used and circles of 30-, 50-, and 100-μm radius were microdissected from mid-zonal areas of hepatic lobules using PALM Robot-MicroBeam equipment (Carl Zeiss; Tokyo, Japan). In addition, for assessment of the relationship between the cell number and the amount of extracted total RNA, square areas of 250 × 250, 500 × 500, and 1000 × 1000 μm were also microdissected.
For microdissection of MPOA, 6-μm-thick sections between pairs of 20-μm-thick sections were prepared from methacarn-fixed rat brain PETs. The 20-μm sections were mounted on PEN-foil film. As shown in Figure 1, localization of the sexually dimorphic nucleus of the preoptic area (SDN-POA), identified as an intensely stained cellular region, was determined under microscopic observation of 6-μm-thick sections stained with hematoxylin and eosin, and the bilateral portions of the MPOA (1000 × 600 μm) containing SDN-POA were microdissected from the adjacent unstained 20-μm-thick sections. Because of sexual dimorphism in the volume of SDN-POA, six to ten sections in males and four to six sections in females were used for microdissection.
RNA Extraction
Quantitative mRNA expression analysis of target genes was performed with a real-time RT-PCR system. In cases of unfixed frozen liver tissue blocks (3 × 3 × 1 mm), whole tissue sections of liver PETs, and microdissected MPOAs from the brain PET sections, total RNA was extracted using RNA STAT-60 (Tel-Test “B” Friendswood, TX), precipitated with isopropanol in the presence of 2 μg/ml glycogen as a carrier, and reconstituted with 10 μl of ultrapure water treated with diethylpyrocarbonate (Ambion). Unfixed frozen tissue blocks were disintegrated in RNA STAT-60 solution with a Mixer Mill MM300 (QIAGEN; Tokyo, Japan) before extraction. For liver tissue sections of 5 × 5 mm from 5 × 5 × 3-mm unfixed frozen tissues and methacarn-fixed PETs, total RNA was extracted with RNeasy Mini (QIAGEN) according to the manufacturer's protocol, and the final elution volume was set at 30 μl. Contaminating genomic DNA was digested with DNase I (Ambion) at the end of the extraction according to the manufacturer's protocol. One μl of isolated RNA was labeled with a RiboGreen RNA Quantitation kit (Molecular Probes; Eugene, Oregon) and concentrations were estimated with a fluorescence spectrophotometer F2500 (Hitachi; Tokyo, Japan) in 1 ml of total volume with water.
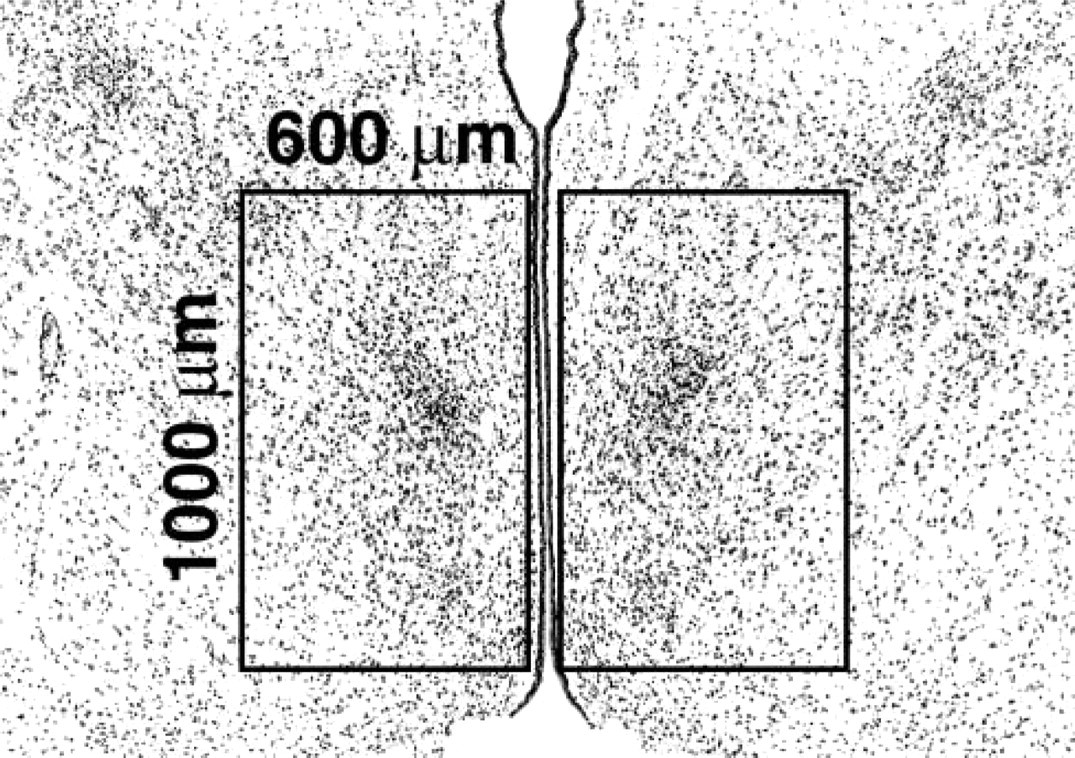
The microdissected area for expression analysis in the MPOA of rat pups at postnatal day 10. The intensely stained cellular regions near the center of each rectangle area are SDN-POAs.
In cases of small tissue areas microdissected from liver PET sections, RNAqueous-Micro (Ambion) was used for total RNA extraction and the final elution volume was set at 20 μl. Contaminating genomic DNA was digested with DNase I included in the kit and the final volume was set to be 25.3 μl.
Real-time RT-PCR
When two-step real-time RT-PCR was planned, RT was performed using 1 μl (200 U) of SuperScript II RNase H Reverse Transcriptase with 2 μl of 50 μg/ml random hexamers, 1 μl of 10 mM dNTP mix, 2 μl of 10 × PCR buffer, 1.2 μl of 50 mM MgCl2, 2 μl of 0.1 M dithiothreitol, 1 μl of RNase inhibitor, and 9.8 μl of RNA solution in a 20-μl total reaction volume (all reagents were purchased from Invitrogen; Carlsbad, CA). After treatment with 1 μl of RNase H, 1 μl of RT product was subjected to real-time PCR in a 25 μl of total reaction volume with the ABI PRISM 7700 Sequence Detection System (Applied Biosystems Japan; Tokyo, Japan) using either QuantiTect SYBR Green PCR Kit (QIAGEN) or TaqMan Universal PCR Master Mix (Applied Biosystems Japan). With this two-step RT-PCR, mRNA expression levels of CYP2B1, estrogen receptor (ER)α, ERβ, γ-aminobutyric acid transporter type 1 (GAT-1), and glyceralde-hyde-3-phosphate dehydrogenase (GAPDH) were measured. Primer Express software (Version 2.0; Applied Biosystems Japan) was used for the design of primer sequences and TaqMan probes. For expression analysis of GAPDH, either SYBR Green or TaqMan probe system was applied. In the latter case, TaqMan Rodent GAPDH Control Reagents (Applied Biosystems Japan) were used. The sequences of primers and probes are listed in Table 1.
With the SYBR Green detection system, mRNA levels of CYP2B1, ERβ, GAT-1, and GAPDH were measured (1 μl of RT product, 12.5 μl of 2 × QuantiTect SYBR Green PCR Master Mix, and 300 nM of primers in a 25-μl total reaction volume). Cycle parameters in this system were as follows: initial activation at 95C for 15 min; 50 cycles of 15 sec at 94C, 30 sec for annealing, and 30 sec at 72C. Annealing temperatures for CYP2B1, ERβ, GAT-1, and GAPDH were 53C, 54C, 54C, and 59C, respectively. With the TaqMan probe detection system, mRNA levels of ERα and GAPDH were measured (1 μl of RT product, 12.5 μl of 2 × TaqMan Universal PCR Master Mix, 900 nM of primers, and 250 nM of TaqMan probe in a 25-μl total reaction volume). Cycle parameters with this system for both genes were: single step of 50C for 2 min, initial activation at 95C for 10 min; 50 cycles of 15 sec at 95C and 60 sec at 60C.
When RT and following real-time PCR were intended to be performed sequentially in one tube, one-step kits, such as the QuantiTect SYBR Green RT-PCR Kit (QIAGEN; for CYP2B1) and the QuantiTect Probe RT-PCR Kit (QIAGEN; for GAPDH) were used with 5 μl of total RNA in a 50-μl total reaction volume according to the manufacturer's protocols. Cycle parameters for CYP2B1 were similar to the above described two-step case, and a RT step at 50C for 30 min was preceded for the initial activation step at 95C for 10 min. In the case of GAPDH, cycle parameters were as follows: single step of 50C for 30 min; single step of 95C for 15 min; and 50 cycles of 94C for 15 sec followed by 60C for 60 sec.
Sequences of primers and probes used for real-time RT-PCR
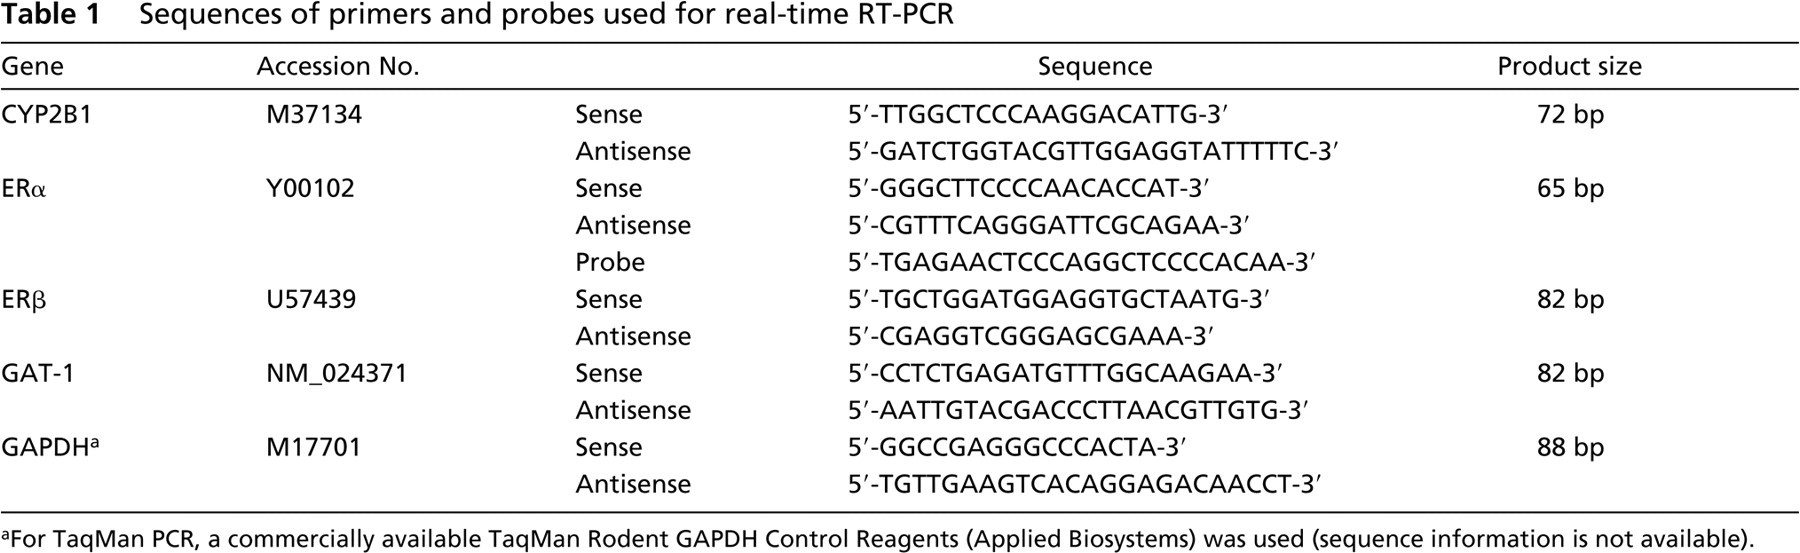
For TaqMan PCR, a commercially available TaqMan Rodent GAPDH Control Reagents (Applied Biosystems) was used (sequence information is not available).
As a negative control for RT, reverse transcriptase (–) mock RT samples were included in each PCR experiment.
Immunohistochemical Analysis
Because ERα mRNA is differentially expressed in the MPOA depending on the gender, the corresponding protein expression was also examined immunohistochemically. A series of five 3-μm-thick sections were prepared at 30-μm intervals through the MPOA and the first of each series was stained with hematoxylin and eosin. These sections were examined microscopically and one showing the maximum size of SDN-POA was identified and selected for IHC with ERα in each animal. Deparaffinized and hydrated sections were treated with microwaving for 9 min in 0.01 M citrate buffer (pH 6.0) and treated with 1% periodic acid solution for 10 min. After incubation with mouse anti-ERα monoclonal antibody (Novocastra Laboratories, Newcastle upon Tyne, UK; × 40 dilution), immunodetection was performed using a VECTASTAIN Elite ABC KIT (Vector Laboratories; Burlingame, CA) with a standard protocol using diaminobenzidine as chromogen. The sections were then counterstained with hematoxylin. Digital photomicrographs at a magnification of ×180 were taken with a Fujix Digital Camera system (Fujifilm; Tokyo, Japan), and the numbers of immunostained nuclei within the MPOA (600 × 1000-μm areas) were counted using MacSCOPE (version 2.65; Mitani, Fukui, Japan).
Statistical Analysis
Comparison of data of mRNA expression levels and ERα-immunoreactive cell numbers in MPOA was performed with the Student's t-test after confirmation of equal variance of values. Pearson's correlation coefficients were calculated between the input amounts of RNA and the target gene expression levels in the validation studies in the liver and MPOA. Variability was expressed as coefficient of variation (CV).
Results
Integrity of Total RNA
Figure 2 shows the integrity of extracted total RNA from methacarn-fixed PET sections. Judging from the resolution of 18S and 28S rRNAs, integrity of total RNA was well preserved in the methacarn-fixed frozen sections (Figure 2, Lane 2) similar to that from unfixed frozen sections (Figure 2, Lane 1). In the methacarn-fixed PET sections (Figure 2, Lane 3), integrity of both rRNA bands was largely retained, but slight reduction of the band intensity of 28S rRNA was also observed as well as a slight increase of background smearing at the position below the 28S band.
Fidelity of mRNA Expression
Figure 3 shows data for mRNA expression in unfixed frozen tissue and methacarn-fixed PET sections, unstained or stained with hematoxylin. Dose-dependent induction of CYP2B1 mRNA was evident in the livers of rats treated with PB for 3 days. In the unfixed tissue, a clear dose-dependent induction of CYP2B1 was detected, and expression levels relative to that at 80 mg/kg PB were 27.5, 4.95, 1.10, and 0.33%, at 20, 5, 1.25, and 0 mg/kg, respectively. Similar dose-dependent expression was observed in the methacarn-fixed PET sections irrespective of staining with hematoxylin, although slight suppression was noted at doses of 1.25 and 0 mg/kg. With regard to variability, there was a maximal 47% difference between the values in each RT sample at 80 mg/kg PB (unstained sections). The relative expression levels at 20, 5, 1.25, and 0 mg/kg PB were 38.6, 7.27, 0.21, and 0.06% in unstained sections and 18.1, 2.49, 0.01, and 0.02 in hematoxylin-stained sections, respectively. Reverse transcriptase (–) mock RT samples did not show any amplification on the PCR.
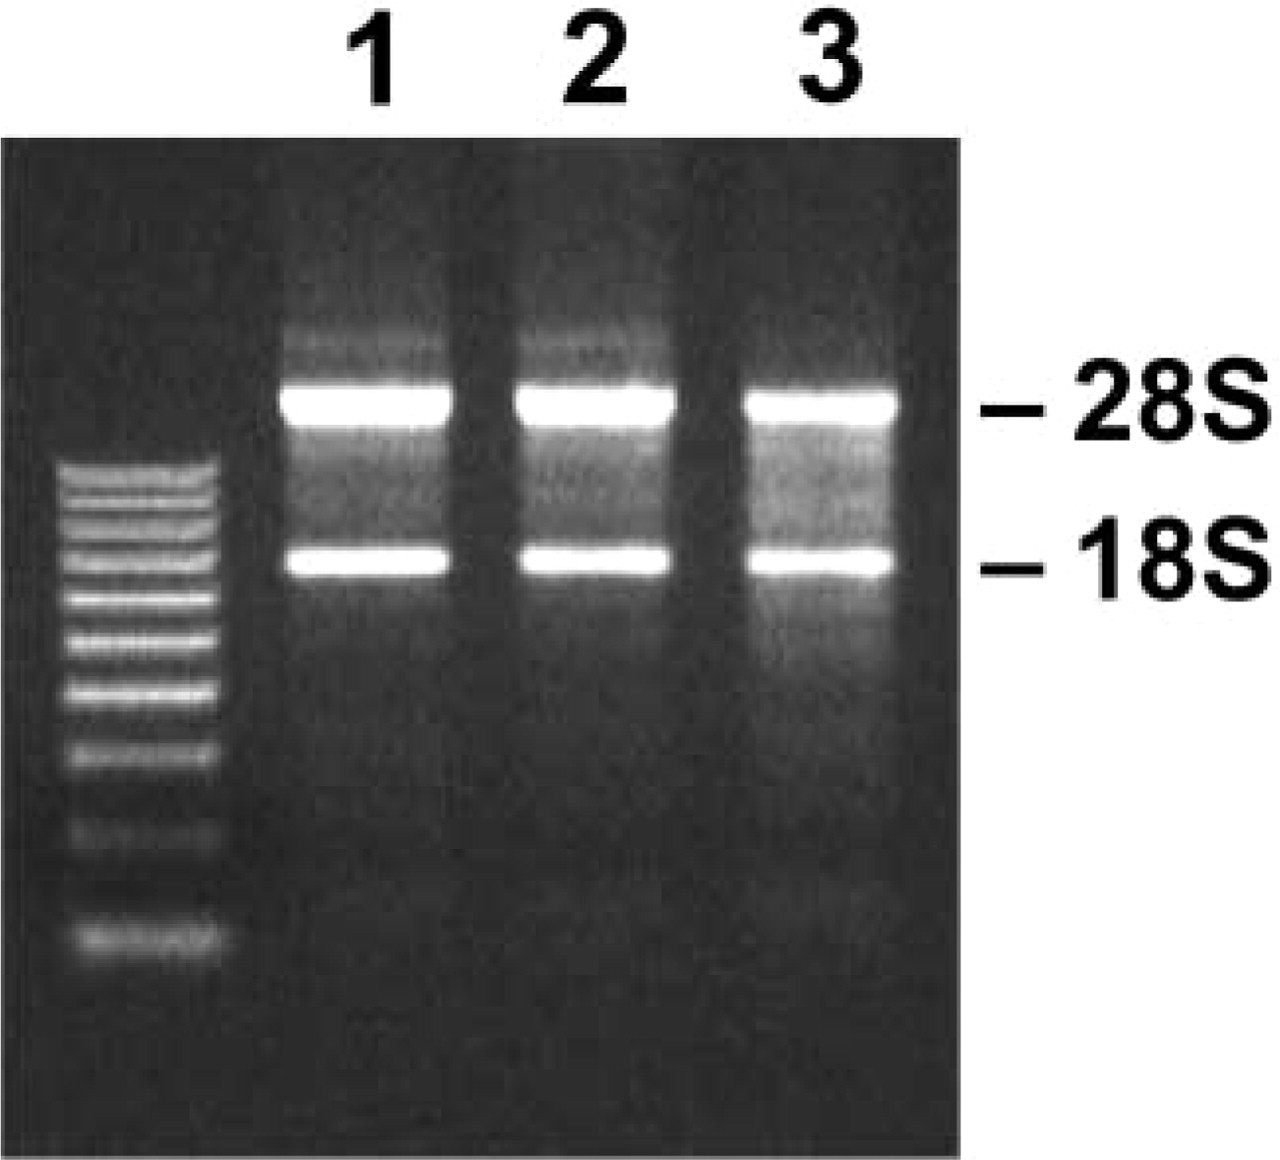
Integrity of total RNA extracted from methacarn-fixed rat liver PET sections. One-μg total RNA samples were resolved in a 1.0% agarose gel and visualized with ethidium bromide. Lane 1, unfixed frozen sections; Lane 2, methacarn-fixed frozen sections; Lane 3, methacarn-fixed PET sections.
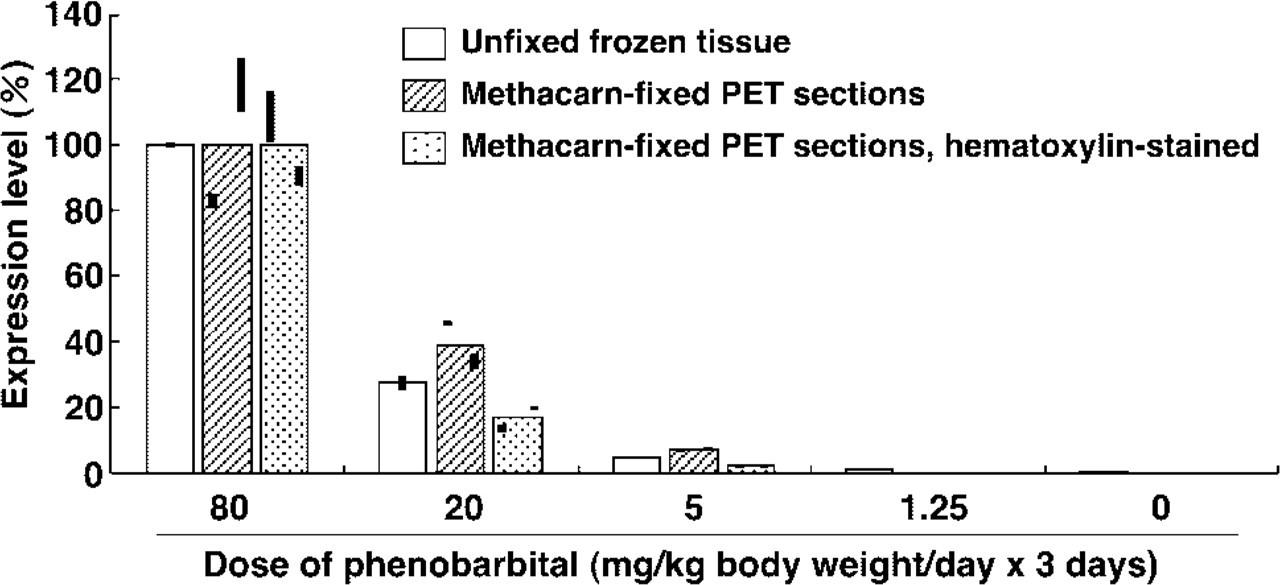
Comparison of gene expression pattern between the unfixed frozen tissue and stained or unstained methacarn-fixed PET sections. For analysis of dose-dependent CYP2B1 expression in the rat liver by PB, one animal was examined at each dose, and therefore the tissue source was set to be identical between preparations at each dose level. In the unfixed frozen tissue, RT was performed with 2 μg of total RNA. For methacarn-fixed PET sections, RT was performed with 335 ng of total RNA. Real-time PCR was performed in duplicate on each RT product. The upper and lower ends of the bars on each column of the graph represent the expression levels measured in duplicate from the same cDNA template.
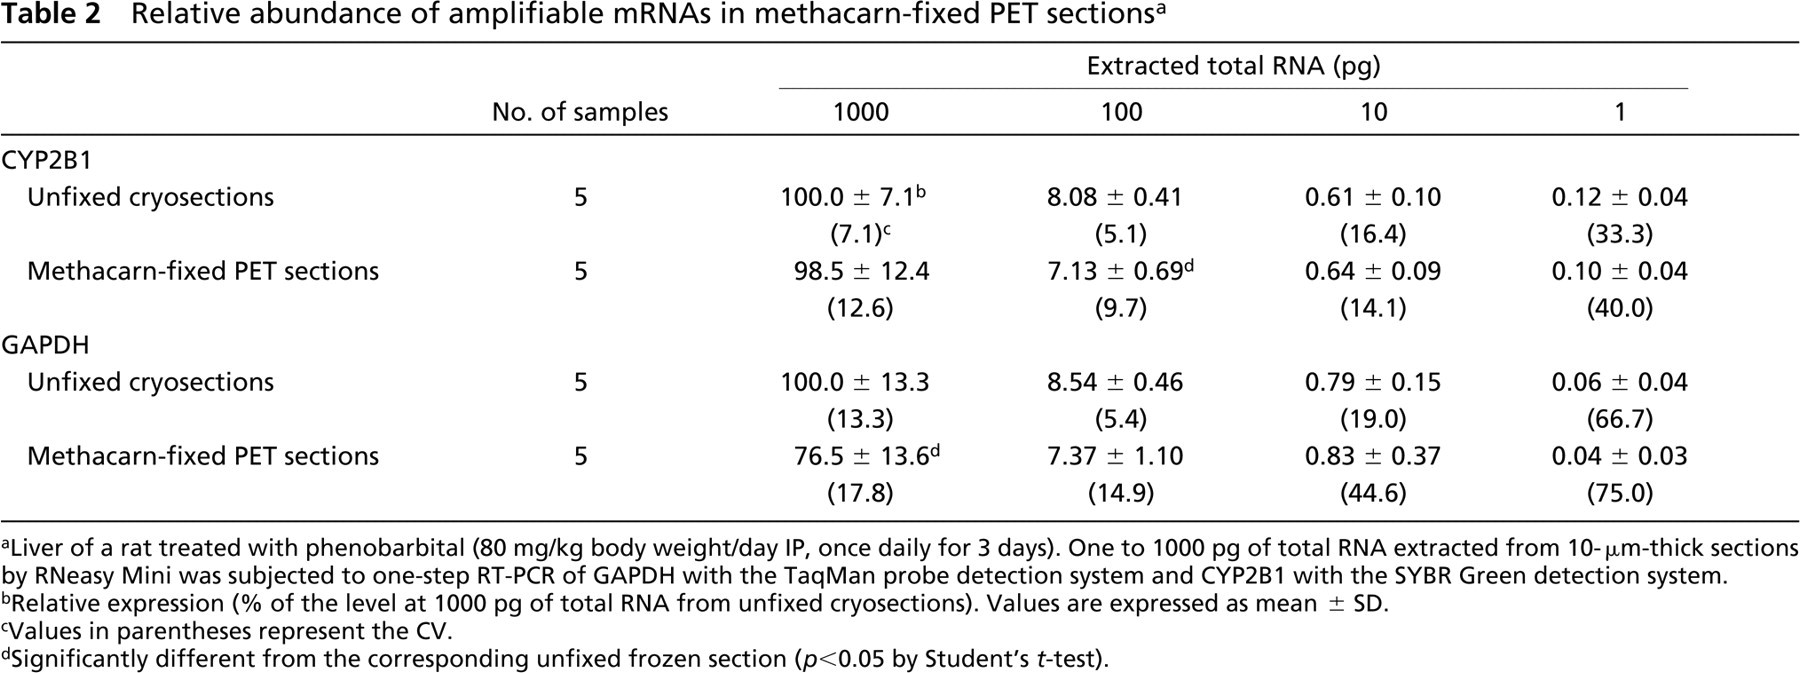
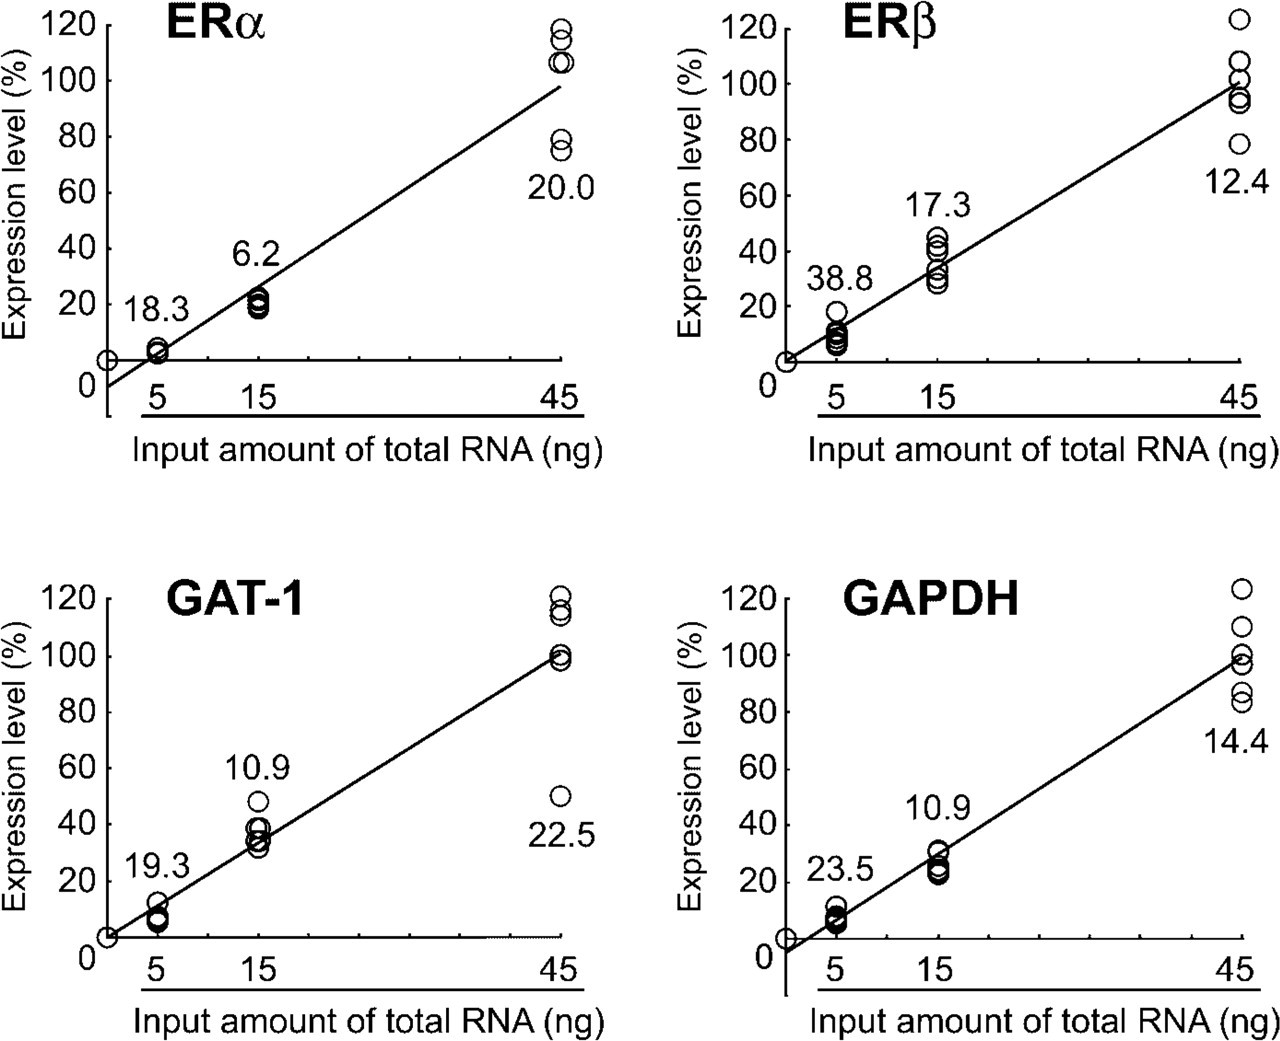
Relative Abundance of Amplifiable mRNA Molecules
To examine the relative abundance of amplifiable mRNA molecules in the methacarn-fixed PET sections, gene expression levels were compared with those in unfixed cryosections using liver of a rat treated with PB at 80 mg/kg body weight/day for 3 days. RNA yields from unfixed cryosections and methacarn-fixed PET sections were determined to be 35.4 ± 11.3, and 42.1 ± 6.0 ng/mm2 area in 10-μm-thick sections, respectively (n = 5). With extracted total RNAs in the range of 1–1000 pg, relative expression of CYP2B1 and GAPDH was determined (Table 2). Although expression signals for both genes could be detected with 1 pg total RNA, values varied when input amount of total RNA was decreased in both tissue section preparations. With 100 and 1000 pg of total RNA, variability of expression data, as judged by the values of CV, was reduced in both unfixed and methacarn-fixed PET sections, with a small reduction of amplifiable mRNAs for both genes in the latter compared with unfixed cryosections (88.2∼98.5% for CYP2B1 with statistical difference of p <0.05 at 100 pg; 76.5∼86.3% for GAPDH with p<0.05 at 1000 pg).
Relative abundance of amplifiable mRNAs in methacarn-fixed PET sections a
Liver of a rat treated with phenobarbital (80 mg/kg body weight/day IP, once daily for 3 days). One to 1000 pg of total RNA extracted from 10-μm-thick sections by RNeasy Mini was subjected to one-step RT-PCR of GAPDH with the TaqMan probe detection system and CYP2B1 with the SYBR Green detection system.
Relative expression (% of the level at 1000 pg of total RNA from unfixed cryosections). Values are expressed as mean ± SD.
Values in parentheses represent the CV.
Significantly different from the corresponding unfixed frozen section (p <0.05 by Student's t-test).
Linearity Assessment of mRNA Expression with Input Amount of Total RNA
Figure 4 shows comparisons of regression curves between cryosections and methacarn-fixed PET sections from the liver of a PB-treated rat, based on the data shown in Table 2. In the methacarn-fixed PET sections, the linearity between input amounts of total RNA and expression levels was very high for both CYP2B1 and GAPDH genes and the curves were almost identical with those for unfixed sections. The correlation coefficients in the analysis of CYP2B1 and GAPDH with unfixed frozen sections were 0.997 and 0.990, respectively. Similarly, correlation coefficients in the methacarn-fixed PET sections were 0.991 and 0.982, respectively.
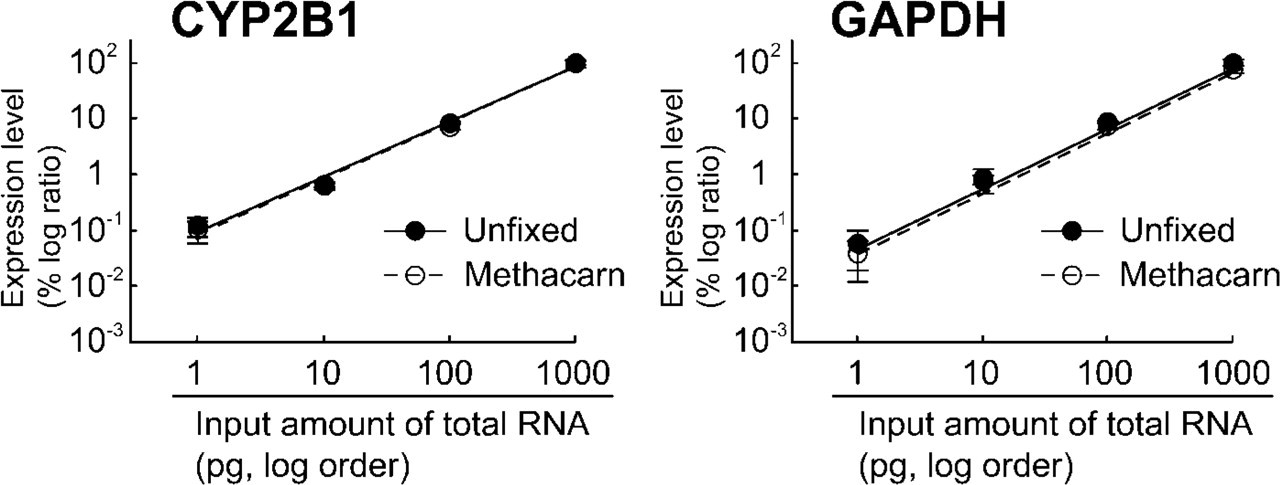
Variability of the mRNA expression data during the processes of RT and after real-time PCR was assessed for four genes with the same RNA sample derived from the MPOA of a male rat on postnatal day 10 (Figure 5). With the total RNA in the range of 5–45 ng, variability in the expression for each gene expressed as CV was mostly within 20%. In addition, high correlation of the expression levels to the input amount of total RNA was observed for all genes examined (0.972, 0.985, 0.965 and 0.985, respectively, for ERα, ERβ, GAT-1, and GAPDH).
Linearity assessment of mRNA expression in the methacarn-fixed PET sections with the input amount of extracted total RNA in the range of 1–1000 pg. Expression levels of CYP2B1 and GAPDH were analyzed with one-step real-time RT-PCR. Relative expression levels were calculated when the values for the 1000 pg template RNA was accounted as 100% (mean ± SD; n = 5). Pearson's correlation coefficients between the input amount of RNA and the expression of CYP2B1 or GAPDH were 0.997 and 0.990 in the unfixed frozen sections, and 0.991 and 0.982 in the methacarn-fixed PET sections.
Variability of mRNA expression during the processes of RT and real-time PCR in the microdissected MPOA from methacarn-fixed, paraffin-embedded rat brain tissue. Total RNA extracted from microdissected specimens of MPOA from one male pup was divided to make triplicate samples for each of 5, 15, and 45 ng. RT was performed in a 20 μl of total volume. With 1 μl of RT product in duplicate, real-time PCR was performed for each gene utilizing the TaqMan probe detection system (ERα) or SYBR Green detection system (ERβ, GAT-1, and GAPDH). Relative expression levels were calculated when the values of the 45 ng template RNA was accounted as 100% (n = 3). The values in the reverse transcriptase (–) mock RT product using 45 ng total RNA was used as those for zero template. Open circles represent expression levels in each sample. Numerical values in the graphs represent the CV of three samples in duplicate. Pearson's correlation coefficients between the input amount of total RNA and expression level of target gene were 0.972, 0.985, 0.965 and 0.985 for ERα, ERβ, GAT-1 and GAPDH, respectively.
Relative Abundance of mRNAs in the Hematoxylin-stained Sections
Table 3 shows the relative abundance of mRNA molecules retained in the hematoxylin-stained, methacarn-fixed PET sections in comparison with the unstained sections. RNA yields of unstained or hematoxylinstained sections (ng/section, 10 μm in thickness) were 873 ± 276 (n = 6), and 1136 ± 354 (n = 5), respectively. Expression levels of CYP2B1 and GAPDH were examined with 1 or 10 ng of template total RNA. After hematoxylin staining, 0–20% reduction was observed in the relative abundance of amplifiable mRNAs for the genes, with statistical difference in CYP2B1 (p <0.05). The 1/10 reduction of the input amount of RNA (from 10 to 1 ng) reduced the expression levels of both CYP2B1 and GAPDH proportionally to ∼1/10, irrespective of the tissue staining.
Gene Expression Analysis in the Microdissected MPOA of Rat Pups
Because sexual dimorphism in the expression of ERα in the developing rat MPOA has been demonstrated by IHC (Yokosuka et al. 1997), expression level of ERα mRNA was examined in the microdissected MPOA of rat pups at postnatal day 10 (Figure 6), along with the ERβ mRNA expression level, for which no substantial sexual dimorphism in the MPOA was found both by IHC and in situ hybridization (Orikasa et al. 2002). Expression of ERα mRNA in females was higher than that in males (Figure 6), even when the expression level was normalized to the GAPDH value. The ERβ mRNA expression level, on the other hand, did not differ between males and females. IHC of ERα in the brains at the same age demonstrated intense nuclear staining in the hypothalamic brain region (Figure 7A). Numbers of ERα-immunoreactive nuclei counted in the MPOA corresponding to the area used for mRNA expression analysis (600 × 1000 μm) were higher in females than in males (Figures 7A and 7B).
Relative abundance of mRNAs in unstained and hematoxylin-stained, methacarn-fixed PET sections a
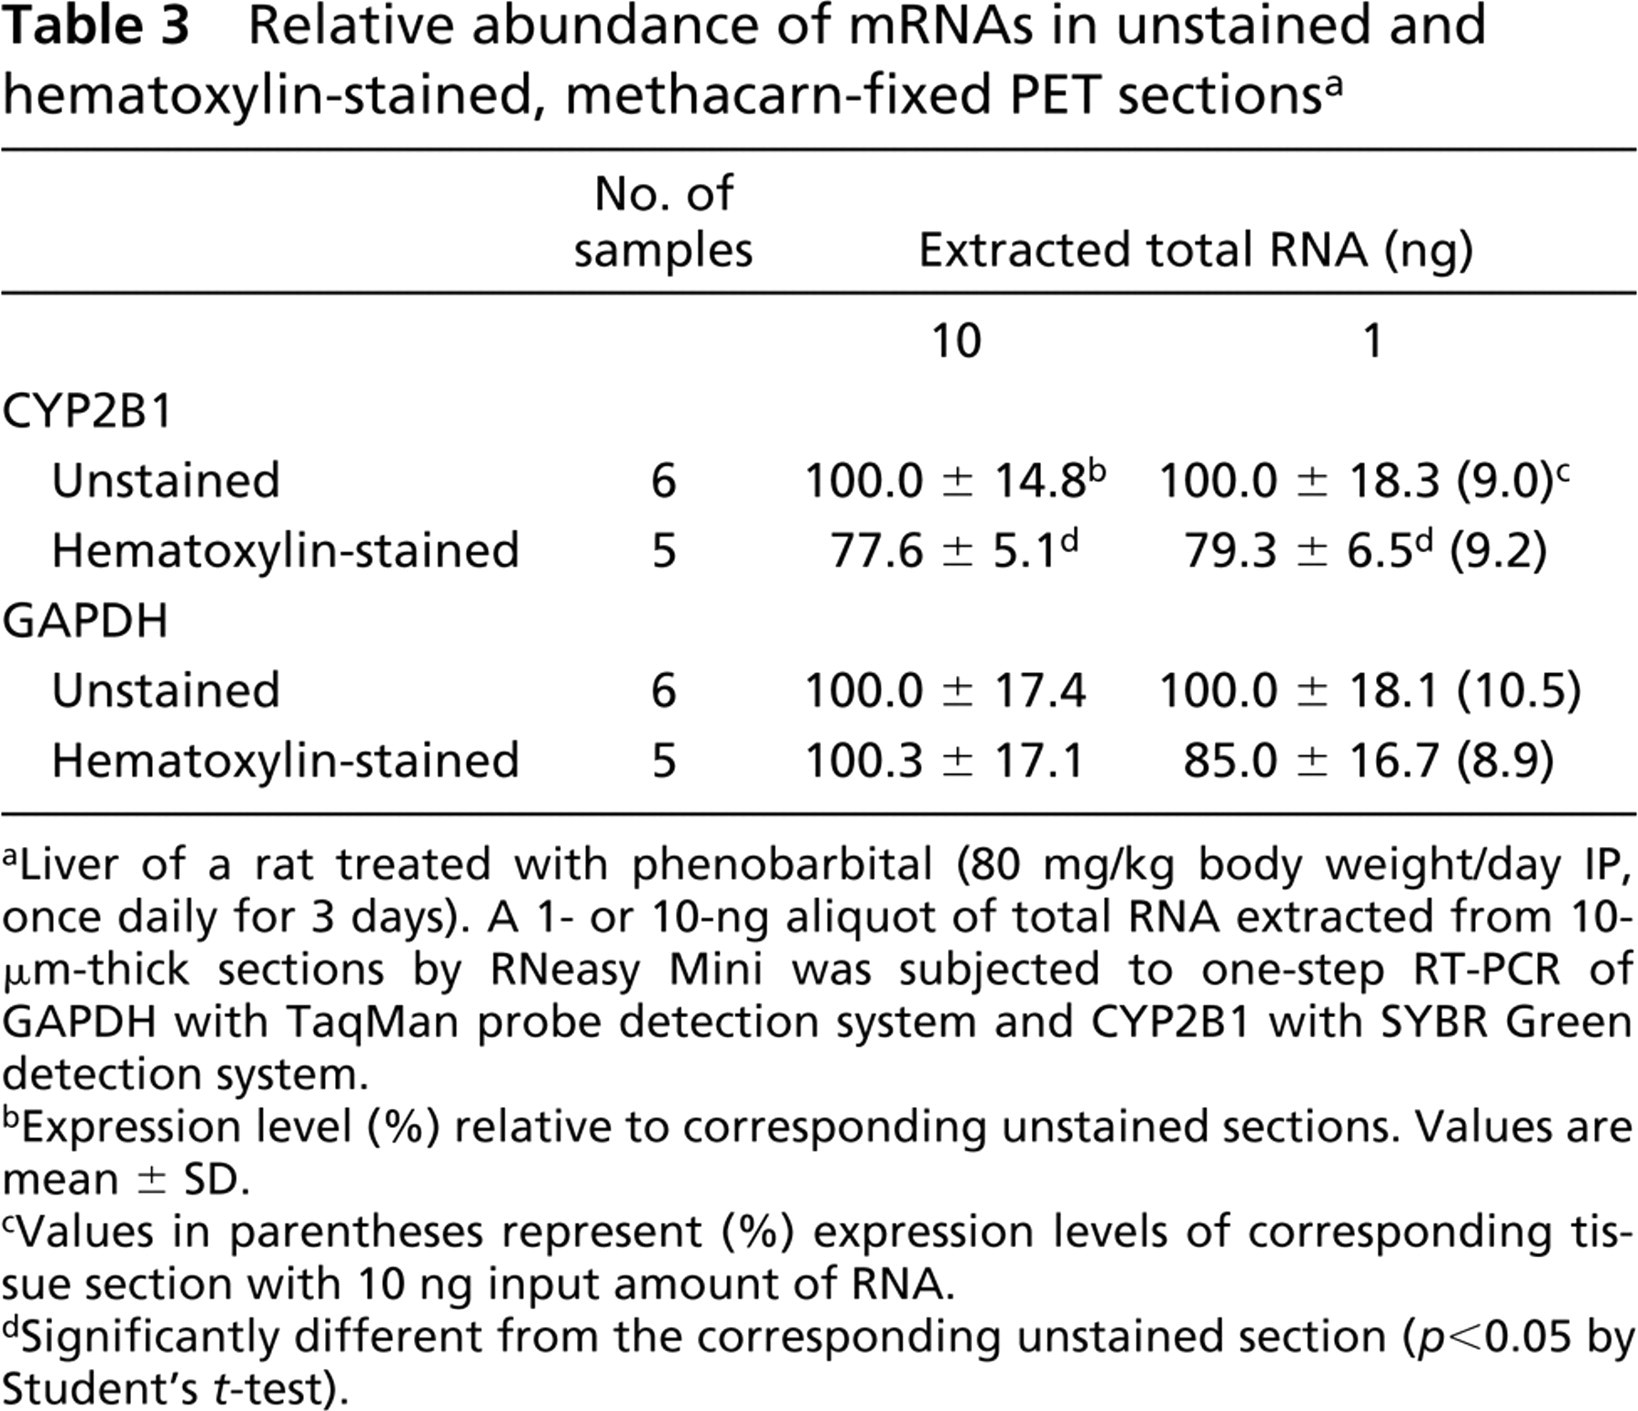
Liver of a rat treated with phenobarbital (80 mg/kg body weight/day IP, once daily for 3 days). A 1- or 10-ng aliquot of total RNA extracted from 10-μm-thick sections by RNeasy Mini was subjected to one-step RT-PCR of GAPDH with TaqMan probe detection system and CYP2B1 with SYBR Green detection system.
Expression level (%) relative to corresponding unstained sections. Values are mean ± SD.
Values in parentheses represent (%) expression levels of corresponding tissue section with 10 ng input amount of RNA.
Significantly different from the corresponding unstained section (p <0.05 by Student's t-test).
Cell Numbers Required for mRNA Expression
To determine the cell numbers required for quantitative measurement of mRNA expression in methacarn-fixed PET sections, hematoxylin-stained 10-μm-thick liver sections of a rat treated with 80 mg/kg PB were used and tissue areas up to 100 μm in radius were randomly microdissected from the mid-zonal areas of liver lobules. One-step real-time RT-PCR for CYP2B1 and GAPDH was performed. Table 4 shows the difference in the threshold cycle (CT: fractional cycle number at which the fluorescent signal passes the fixed threshold) between the microdissected samples and standard samples, showing the lower limit within the dynamic range of amplification in each gene. For CYP2B1 expression, one or more circle tissues of 100 μm in radius, corresponding to >52 ± 3 liver cells (n = 10), showed a CT within the dynamic range of amplification. For GAPDH expression, most tissue-samples of more than 50 μm in radius showed a CT within the dynamic range of amplification. Data variability between samples of identical tissue size was expressed as CV for the “difference in CT.” With both genes, variability of data was decreased with an increase in the area of microdissected tissue, and less variable data were obtained with samples corresponding to the 208 cell/area. Variability between samples was greater with CYP2B1 compared with GAPDH.
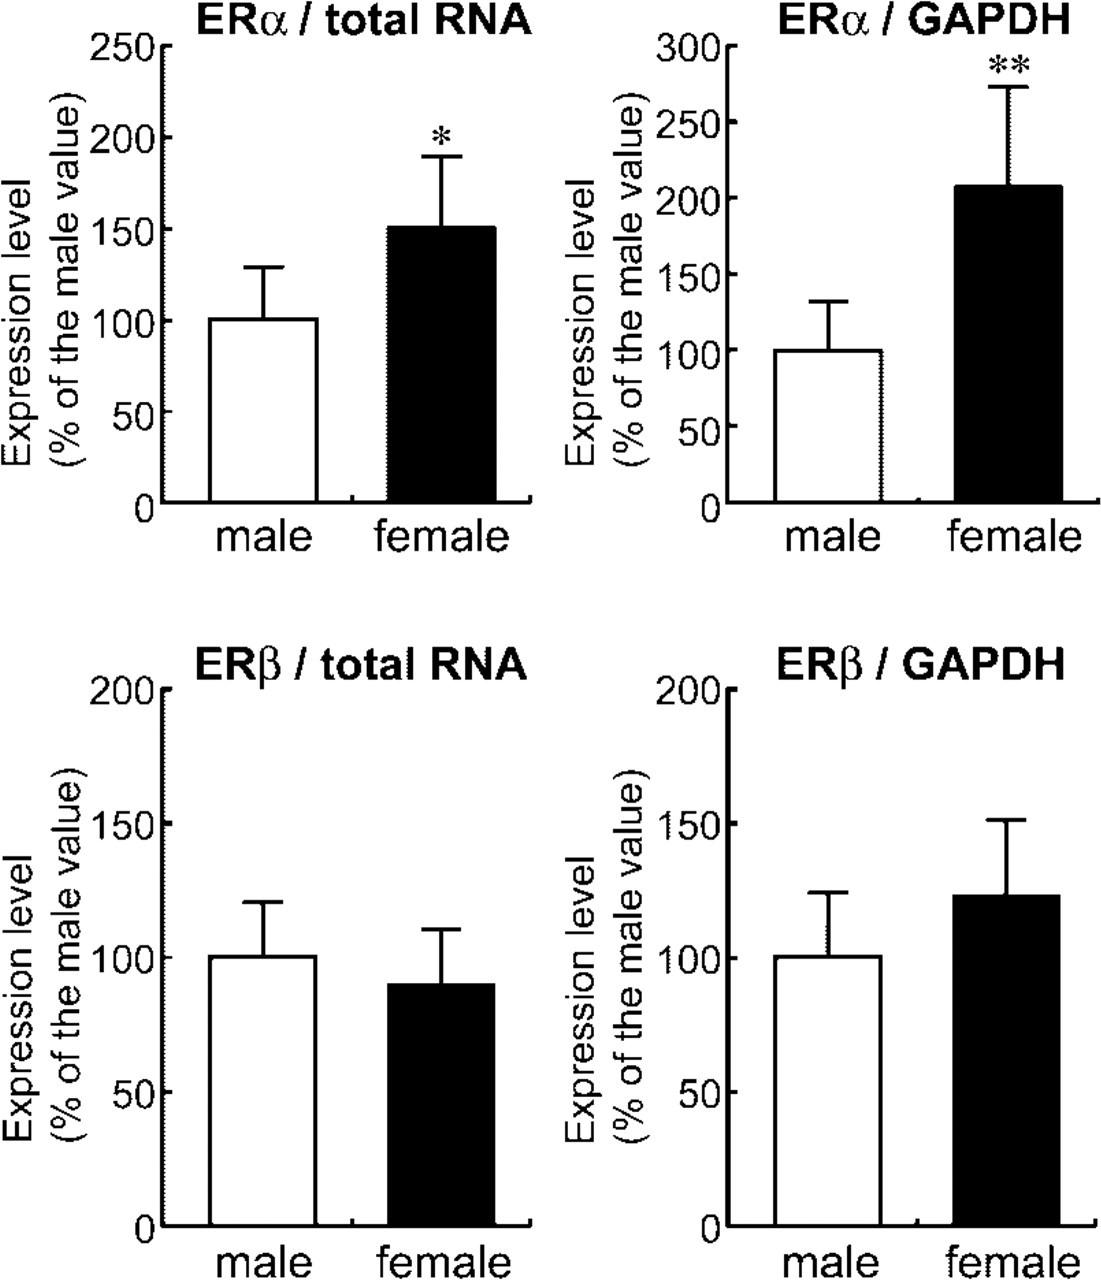
Measurement of mRNA expression levels of ERα and ERβ in the MPOA of male and female rat pups at postnatal day 10 using methacarn-fixed PET specimens. Numbers of animals examined were 5 for males and 6 for females. RT was performed with 24 ng of total RNA in a 20-μl total volume. With 1 μl of RT product, realtime PCR of each gene was performed. The values of ERα and ERβ were normalized for the amount of total RNA (left panels) or the expression level of GAPDH (right panels), and expressed as mean + SD. ∗∗, ∗: Significantly different from the male expression levels (∗p <0.05, ∗∗ p <0.01 by Student's t-test).
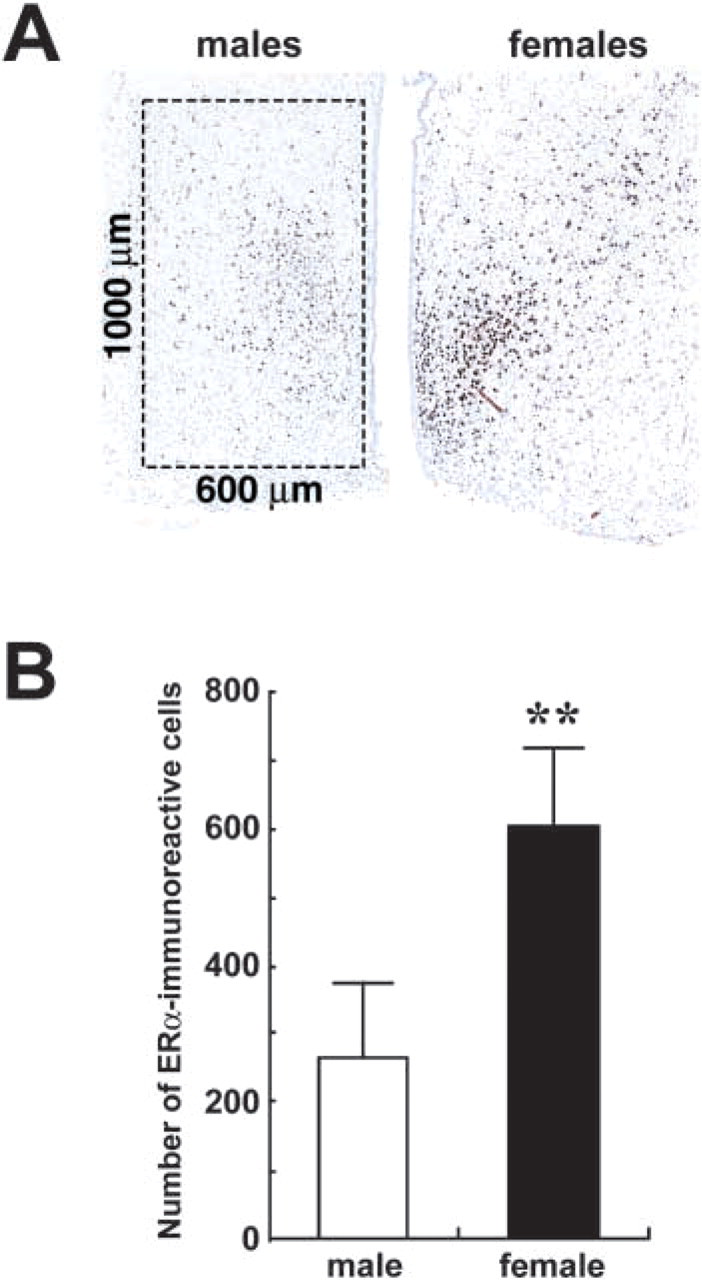
Sex difference of the ERα-immunoreactive cell population in the MPOA of rat pups at postnatal day 10. (
Total RNA Yields in the Microdissected Tissue Areas
Table 5 shows RNA yields for microdissected unit areas of hematoxylin-stained rat liver PET sections. With increase in tissue size, RNA yield was proportionally increased. Because 1 ng/ml is the lower detection limit of RNA quantitation with RiboGreen fluorescent dye (manufacturer's instructions), in the rat liver a 250 × 250-μm area (corresponding to 104 cells) was the detection limit of RNA quantitation.
Discussion
Methacarn is an organic solvent fixative and therefore would not be expected to modify nucleotides or polypeptides as reported for crosslinking fixatives, such as formaldehyde (reviewed by Srinivasan et al. 2002). Previously, we have found that methacarn fixation followed by paraffin embedding does not affect the integrity of extracted total RNA, but results in halving of the RNA yield from unfixed frozen samples (Shibutani et al. 2000). However, we could here extract total RNA from methacarn-fixed rat liver sections with an efficiency equivalent to that with unfixed cryosections. Although we could not identify the reason for the observed difference between the previous and present studies, the tissue condition (tissue blocks in the previous study vs sectioned tissues in the present study), normalization of RNA yield (wet weight vs unit area), or extraction tool (RNASTAT-60 utilizing isopropanol precipitation for RNA isolation vs RNeasy Mini utilizing selective binding properties of silica gel-based membrane for RNA isolation) might have exerted an influence. We also observed only a small reduction in the relative abundance of amplifiable mRNAs retained in the methacarn-fixed PET sections compared with unfixed cryosections. Slight reduction of the integrity of extracted total RNA in the methacarn-fixed PET sections may be parallel to the results of the relative abundance of amplifiable mRNAs. On the other hand, methacarn itself does not appear to affect the quality of RNA molecules because fixation of fresh frozen sections for 10 min with this solution well preserved the integrity of total RNA in the present study. Considering the advantages in tissue handling during sectioning and after microdissection steps with PET specimens, as well as the disadvantages with unfixed frozen tissue in terms of tissue handling and instability of RNA molecules in sectioned specimens, methacarn fixation in combination with paraffin embedding has clear benefits for mRNA expression analysis of micro-dissected specimens.
Generally speaking, tissue staining with hematoxylin appears to affect both extraction efficiency and PCR amplification of genomic DNA (Murase et al. 2000; Serth et al. 2000), although in the present study the influence of brief staining with hematoxylin was marginal. Polynucleotides in tissue sections fixed with organic solvent fixatives, such as Carnoy's solution or methacarn, may be released into solution during IHC or ISH (Urieli-Shoval et al. 1992; Uneyama et al. 2002). However, methacarn-fixed PET sections could quickly be stained with hematoxylin in a period of 1–10 sec (Uneyama et al. 2002), and this might have contributed to the limited loss of extractable RNA after hematoxylin staining in the present study. We also observed only slight reduction (0–20%) in the relative abundance of amplifiable mRNAs after hematoxylin staining. We previously noted that staining with hematoxylin and eosin affected PCR of genomic DNA in methacarn-fixed PET sections, despite no deterioration of the integrity and yield of extracted DNA (Uneyama et al. 2002). Hematoxylin has been reported to influence divalent cations (Mg2+) that are important for maintaining Taq DNA polymerase activity (Chen et al. 1996), and this was reported to be apparent when manually dissected large tissue samples are subjected to PCR analysis (Burton et al. 1998; Murase et al. 2000). However, such an inhibitory effect might be negligible when microdissected small tissue specimens are analyzed (Ehrig et al. 2001). In line with the present study results, hematoxylin staining did not affect RT-PCR when microdissected small tissue specimens were analyzed in a previous study (Imamichi et al. 2001).
Difference in the CT of real-time amplification in the microdissected samples from those of the lower limit of amplification in the standard samples a
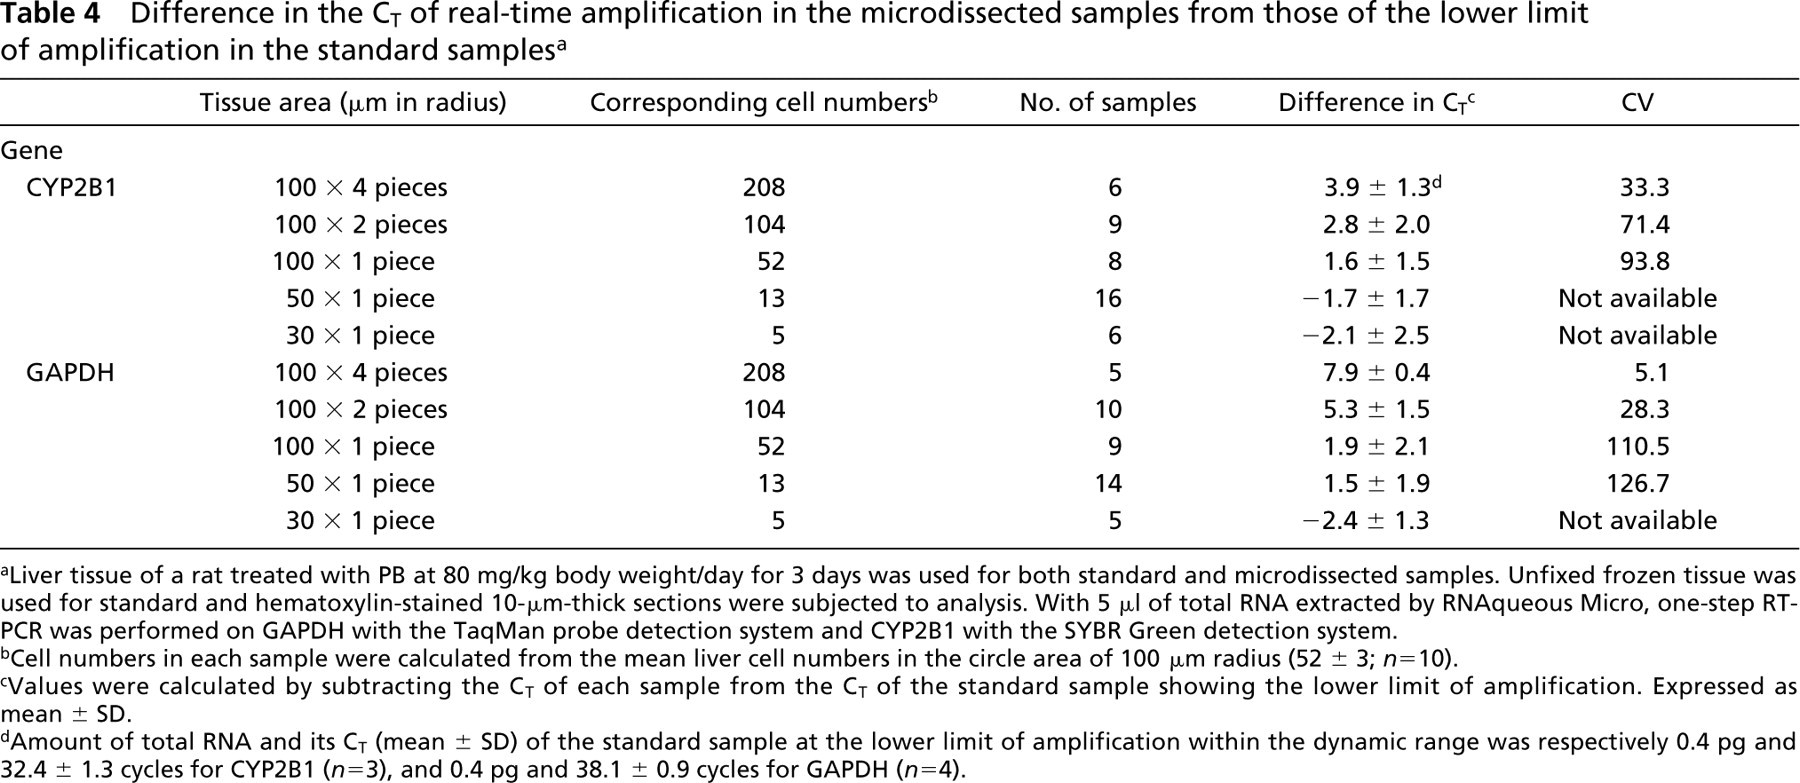
Liver tissue of a rat treated with PB at 80 mg/kg body weight/day for 3 days was used for both standard and microdissected samples. Unfixed frozen tissue was used for standard and hematoxylin-stained 10-μm-thick sections were subjected to analysis. With 5 μl of total RNA extracted by RNAqueous Micro, one-step RT-PCR was performed on GAPDH with the TaqMan probe detection system and CYP2B1 with the SYBR Green detection system.
Cell numbers in each sample were calculated from the mean liver cell numbers in the circle area of 100 μm radius (52 ± 3; n = 10).
Values were calculated by subtracting the CT of each sample from the CT of the standard sample showing the lower limit of amplification. Expressed as mean ± SD.
Amount of total RNA and its CT (mean ± SD) of the standard sample at the lower limit of amplification within the dynamic range was respectively 0.4 pg and 32.4 ± 1.3 cycles for CYP2B1 (n = 3), and 0.4 pg and 38.1 ± 0.9 cycles for GAPDH (n = 4).
The cell number required for mRNA expression analysis in microdissected tissue specimens is primarily dependent on the expression level of the target genes of interest. In the case of cyclin D1 in primary tumor tissues, Specht et al. (2002) reported that transcripts could be measured in a minimum of 20 microdissected tumor cells from formalin-fixed PET specimens with an improved extraction protocol and the TaqMan PCR method in combination, but they also found 2000 cells to be suitable to obtain reproducible real-time PCR results. Although the expression values did not greatly vary (CV <20) from 100 pg of total RNA in the present experiment examining relative abundance of amplifiable mRNAs (Table 2), ∼200 cells (corresponding to 2 ng based on the RNA yield data in Table 5) can be considered as a minimum for the practical expression analysis of mRNA species, judging from the very small variation of difference in CT values of GAPDH gene with the corresponding tissue size (100 μm in radius × 4 pieces) reflecting homogeneity in the expression between samples as well as very small technical variation (Table 4). Expression levels of CYP2B1 varied between samples, even with a tissue area of 208 cells. With PB treatment, graded expression of CYP2B1 in the liver lobule occurs in the rat, with pronounced induction in the periportal region (Bühler et al. 1992). In the present study, mid-zonal areas of hepatic lobules were subjected to analysis, and therefore the variability of CYP2B1 expression in each sample might rather reflect a local event due to the graded expression profile of the transcript within this area.
In the present study, the concentration of total RNA was measured by RiboGreen fluorescent dye, with 1 ng as the lower detection limit in a 1-ml assay volume, and we could obtain ∼1 ng of total RNA from 100 microdissected liver cells. If normalization of mRNA expression level to the input amount of total RNA is intended, a total of 3 ng or more (corresponding to >300 cells in a 10-μm-thick section of the rat liver) would be necessary for measurement of RNA concentration (1 ng) and after real-time RT-PCR of several genes (2 ng) under the present experimental conditions. If a fluorescence microplate reader is available, the total volume for assay of total RNA concentration could be minimized. As another normalization method, the expression level of a reference gene can be used. Housekeeping genes, such as GAPDH in the present study, are usually selected for this purpose. However, disadvantages with a single housekeeping gene were recently reported (Lee et al. 2002; Tricarico et al. 2002), and sexual dimorphism exists in GAPDH expression in several brain regions of developing rats (Perrot-Sinal et al. 2001). Sexual dimorphism of ERα expression in MPOA was apparent here, irrespective of the normalization method.
Total RNA yields in microdissected unit areas of methacarn-fixed rat liver PET sections a
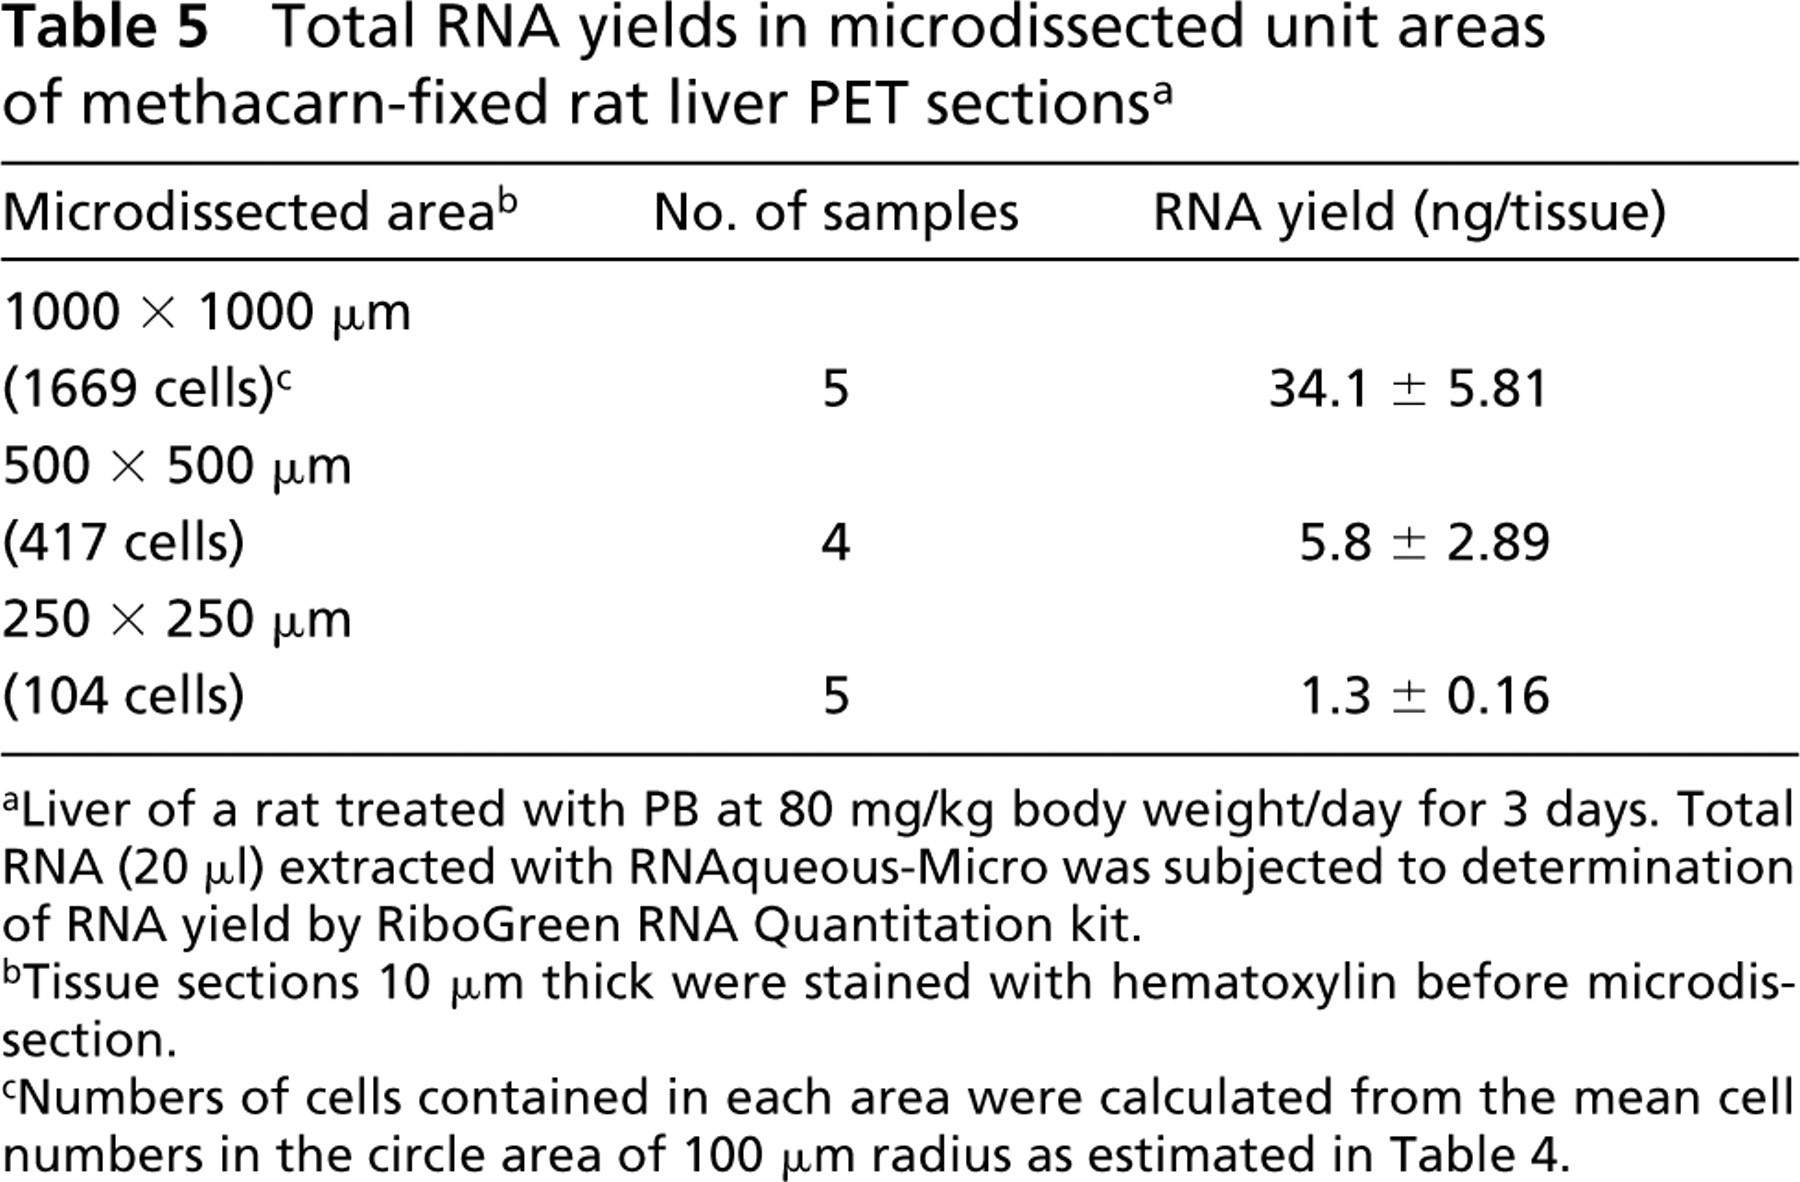
Liver of a rat treated with PB at 80 mg/kg body weight/day for 3 days. Total RNA (20 μl) extracted with RNAqueous-Micro was subjected to determination of RNA yield by RiboGreen RNA Quantitation kit.
Tissue sections 10 μm thick were stained with hematoxylin before microdissection.
Numbers of cells contained in each area were calculated from the mean cell numbers in the circle area of 100 μm radius as estimated in Table 4.
In conclusion, we have now demonstrated that methacarn-fixed PET allows practical mRNA expression analysis in microdissected areas with real-time RT-PCR after hematoxylin staining. Although recent studies have also demonstrated good performance of mRNA expression measurement with microdissected formalin-fixed PETs (Specht et al. 2001, 2002), formaldehyde causes modification of nucleotides and therefore a high frequency of non-reproducible sequence alteration and amplification of only short fragments (reviewed by Srinivasan et al. 2002), suggesting limited utility for molecular analysis. Considering the availability for both DNAs and proteins in PET sections (Shibutani et al. 2000; Shibutani and Uneyama 2002; Uneyama et al. 2002), methacarn should prove to be a versatile tool for multipurpose analysis of target genes in specific cell populations. We are now applying methacarn for global gene expression analysis using a microarray technique with microdissected PET specimens. The question of how long molecules are retained intact in methacarn-fixed PET should now be addressed. Although we do not have data for archival tissues stored for several years/decades, mRNA levels could be measured with methacarn-fixed PET that had been prepared 6 months previously in the present study.
Footnotes
Acknowledgements
Supported in part by Health and Labor Sciences Research Grants (Research on Food and Chemical Safety) from the Ministry of Health, Labor and Welfare of Japan.