
Abstract
Chicken red blood cells (CRBCs) are widely used as standards for DNA content determination. Cytogenetic data have shown that the Z sex chromosome is approximately twice as large as the W, so that the DNA content differs to some extent between male (ZZ) and female (ZW) chickens. Despite this fact, male and female CRBCs have been indiscriminately used in absolute genome size determination. Our work was conducted to verify whether the DNA content differences between male and female
T
Chicken red blood cells (CRBCs) have been used as cytometry internal or external standards mainly owing to their known genome size, availability, homogeneous nuclei suspension, and tolerance of very long storage at low temperatures (Greilhuber et al. 2007). Using CRBC as cytometry standard, genome size was measured in plants (Johnston et al. 1999; Bennett et al. 2003; Roux et al. 2003), animals (Tiersch et al. 1989; Nakamura et al. 1990; Fritz et al. 1994; Capparelli et al. 1997; Bennett et al. 2003), and humans (Palissot et al. 1996).
Different 2C DNA content mean values have been reported for CRBCs, such as 2.50 pg (Rasch et al. 1971), 2.33 pg (Galbraith et al. 1983), 2.50 pg (Tiersch et al. 1989), and 2.47 pg (Tiersch and Wachtel 1991). Other studies reported CRBC 2C genome size for each sex separately. De Vita et al. (1994) found 2C = 2.50 pg (male), Johnston et al. (1999) reported 2C = 2.54 pg (male, “Leghorn” Texas A&M University), 2C = 3.01 pg (male, “Leghorn” Arizona), and 2C = 2.48 pg (female, “Rhode Island”). Using chickens from three inbred lines and one hybrid, Nakamura et al. (1990) reported a mean value of 2C = 2.49 pg for males and 2C = 2.43 pg for females.
Some authors have proposed that intraspecific variations in the nuclear DNA content could be attributed to the particular methodologies used for genome size estimation (Vindeløv et al. 1983; Doležel and Bartoš 2005). However, the presence of heteromorphic sex chromosomes (Z and W) in birds could be responsible for this variation in genome size (Tiersch et al. 1989).
On the basis of cytogenetic analyses, Kaelbling and Fechheimer (1983), Bloom et al. (1993), Ladjali-Mohammedi et al. (1999), and Masabanda et al. (2004) showed that the Z chromosome of chickens is approximately two times larger than the W chromosome, a size difference that could bias the genome size estimation when CRBCs are used as cytometry standards (Vindeløv et al. 1983).
Our work was conducted to verify whether the DNA content differences between male and female
Materials and Methods
Biological Material
Chickens (
The project was conducted under the supervision of the Universidade Federal de Viçosa Animal Care and Use Committee, which has adopted animal care and use guidelines governing all animal use in experimental procedures.
Nuclei Slide Preparation
Blood from healthy male and female chickens was collected by wing vein puncture, immediately transferred to 5-ml tubes containing sodium heparin (Vacutainer; Becton Dickinson, Franklin Lakes, NJ), and stored at 4C. Air-dried smears (Hardie et al. 2002) was the slide preparation method adopted. On each slide, male and female samples of CRBC were placed separately at opposite ends. Three slides were mounted from male and female CRBCs processed strictly in parallel. In this procedure, three female and three male chickens were used.
Chromosome Slide Preparation
Chromosomal preparations were performed from bone marrow of one female and one male chicken after in vivo colchicine treatment, as describe by Macgregor and Varley (1988). Bone marrow cells were collected from both femora by flushing in 0.075 M KCl (Merck KGaA; Darmstadt, Germany), and cells were centri-fuged at 100 × g for 5 min. After centrifugation, bone marrow cells were treated with 0.075 M KCl (Merck), incubated at 37C for 10 min, and centrifuged at 100 × g for 5 min. The supernatant was poured out, and the pellet was fixed with cold methanol-acetic acid (Merck) 3:1 (v/v). Fixation was repeated twice, with an interval of 10 min, and the last fixation step was carried out for 30 min at 4C. The pellet was resuspended in fresh fixative, and two to three drops of the fixed material were dripped onto a clean slide and placed on a hot plate to dry.
Feulgen Reaction
All slides were stored in 70% ethanol (Merck) at −20C for 24 hr. The Feulgen reaction was performed according to Haroske et al. (2001), Abreu et al. (2008), and Clarindo and Carvalho (2009), with modifications. The slides were postfixed in 4% formaldehyde solution (Merck) for 60 min, washed in distilled water, air dried, and hydrolyzed in 5 M HCl (Merck) for 10–60 min at 25C. After the hydrolysis step, slides were stained with Schiff's reagent (Merck) for 12–24 hr at 4C. Finally, slides were washed three times for 3 min in 0.5% SO2-water (Merck) and in distilled water.
Microscope Instrumentation and Image
Analysis System
The images were captured with a monochromatic charge-coupled device digital video camera of 12-bit gray and a frame-grabber card (Photometrics CoolSNAP Pro-Roper Scientific; Tucson, AZ). This camera was assembled on a trinocular photomicro-scope (Olympus BX-60; Center Valley, PA) equipped with: a source of stabilized light; UPlanFI objective, magnification x40, with 0.75 numeric aperture; PlanApo × 100 oil immersion objective with 1.40 numeric aperture; aplanat achromat condenser with aperture 1.4; and neutral density filter (ND6). The video camera was further coupled to a Pentium 4 HT computer (Dell Optiplex GX 620; Round Rock, TX) with the Image Pro-Plus 6.1 software (Media Cybernetics; Bethesda, MD).
The 12-bit gray images of each nucleus and metaphase were captured using the tools of the Image Pro-Plus 6.1 software. The Z and W chromosome images were selected, segmented, and cut using the digital tool to mount as ZZ and ZW standard pairs.
Calibration and Setup of the Image Analysis System
Nuclei images were captured with UPlanFI objective magnification x40 and chromosomes with PlanApo x100. The Köhler method was applied for these objectives. This method was used in each slide capture session to obtain an optimal light path and consequently reduce stray light.
Spatial calibration was performed using a slide micrometer scale (Olympus) and tools from the Image Pro-Plus 6.1 analysis system. This procedure established the conversion unit from pixel to micrometer.
Likewise, density calibration was accomplished using a slide containing male or female CRBC nuclei. Immersion oil [neutral density (ND) = 1.525] (Carl Zeiss; Toronto, Canada) was added between slide and coverslip. The maximum optical density (OD) range was determined on the basis of captured nuclei images, employing the microscope light intensity knob and the histogram live window (gray scale) of the Image Pro-Plus 6.1 analysis system.
The ND filters (ND6 0.15, 0.30, 0.40, 0.60, 0.90, and 2.50; Edmund Industrial Optics, Barrington, NJ) were used to fit the curve of integrated optical density (IOD). Each filter was coupled on a field diaphragm. The diaphragm iris was closed to a slightly larger size than the image size. OD range was determined by opening the software histogram live window and adjusting the microscope light intensity knob. The highest gray level (peak moves to the right) was slightly lower than the maximum value on the gray scale. A series of empty images were captured, interposing each one of these filters (or in combinations, to generate other OD values) over the interference filter in the light path. Then, a step-tablet with the standards neutral density filters set was mounted to calibrate the OD scale. This step-tablet and a software density calibrating tool were used to fit the curve of intensity to optical density, and save it in preferences. This calibration process should be made to each particular objective.
After system setup, calibration and evaluation of the image analysis system were accomplished based on three tests:
Stability: this test comprised the time that the image analysis system needed to become stable from the moment it was connected (Vilhar and Dermastia 2002). Images of one pixel and male and female CRBC nuclei, positioned in the center of the field (frame coordinates x150, y150), were captured at intervals of 4 min, over a period of 88 min. These images were used for measurement of OD and IOD values, respectively, and the light source variations were evaluated.
Linearity: this test was performed following the method described by Chieco et al. (2001), Hardie et al. (2002), and Vilhar and Dermastia (2002). Images of each stage of the linear 11 stepped density filter (Edmund Industrial Optics) were captured. The IOD value of each captured image was determined using the density command of the software. These values were compared, by linear regression, with the IOD certified by Edmund Industrial Optics for each step.
Uniformity: the same CRBC nuclei images (four nuclei) were grabbed from 16 distinct and well-distributed regions of the field of view (a grid with four horizontal lines and four vertical lines). These images were used for measuring the IOD values. The coefficient of variation (CV) was calculated for the 64 IOD values (Puech and Giroud 1999; Vilhar et al. 2001).
Experimental Design and DNA
Content Determination
From each of three slides, 12 frames were captured of both male and female CRBCs. Each frame ranged from 60 to 110 nuclei samples. These 12-bit digital images were saved, and the nucleus was segmented using software tools. Because the pixels do not have an intrinsic value, the spatial and OD calibrated values were automatically applied to them by the software tool look-up table. The software algorithm automatically multiplied the nuclear area (μm2) by the average OD, resulting in IOD the formula (Hardie et al. 2002; Vilhar and Dermastia 2002)

where IOD = nuclear or chromosomal IOD value, IFi = intensity of the foreground (nuclear or chromosomal) pixel; and IBi = intensity of the background (clear area) pixel.
Because the sequenced genome size (1C) of female

where 1Cs = 1C nuclear DNA content of the sample; 1Cp = 1C nuclear DNA content of the standard; IODs = nuclear IOD value of the sample; and IODp = nuclear IOD value of the standard.
In addition to the nuclear genome size, the IOD of the Z and W chromosomes was also measured to determine the difference between them. Using a digital tool, the sex chromosomes were selected and paired. Ten ZW and ten ZZ chromosomes were processed and analyzed by ICM as described above.
Statistical Analysis
The mean genome size values were statistically analyzed by ANOVA and Duncan's method. This analysis was carried out in the statistical program Genes (Cruz 2001). The IOD values, obtained from all nuclei analyzed (2238 for female and 2048 for male), were plotted using the software SPSS 13 for Macintosh.
Results
In this study, quality control of the ICM instrumentation was conducted prior to DNA content measurements. These procedures comprised the stability, linearity, and uniformity tests. From the stability test application, it was observed that the background pixel OD values and IOD values of the CRBC nuclei images were stabilized after 12 min. After this warming-up time of the system, the IOD values were calculated. These values were 0.018 ± 0.001 for the pixel and 0.414 ± 0.001 for the nucleus.
A linear correlation, showing
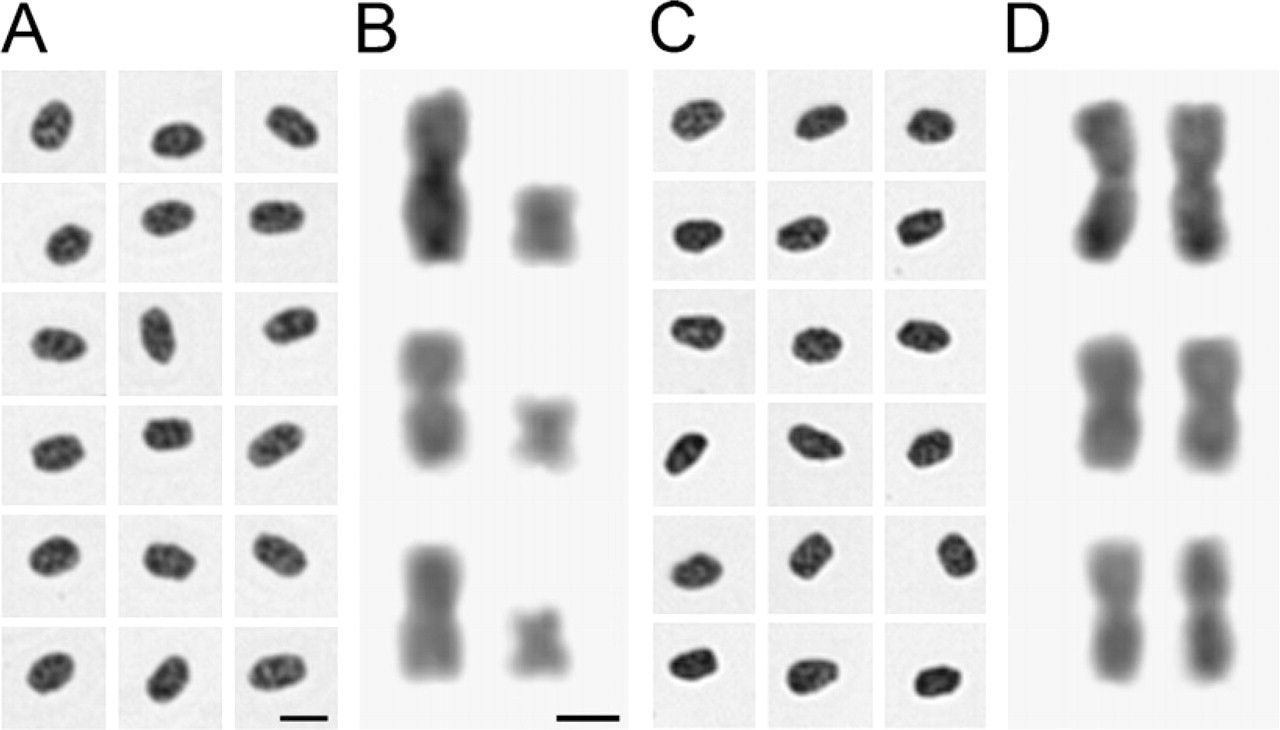
Slide preparation techniques provided well-flattened nuclei and chromosomes with little or no cytoplasmic background and without chromatin deformations. Additionally, the chromosomes showed without overlaps. Fixation followed by postfixation led to well-preserved nuclei and chromosomes (Figure 1).
Based on the DNA hydrolysis curve (data not shown), it was shown that it was the treatments of HCl hydrolysis and Schiff's reagent staining that provided nuclei and chromosomes stoichiometrically stained: for nuclei preparations, 5 M HCl solution for 60 min (25C) and Schiff's reagent for 12 hr (4C) (Figures 1A and 1C); for chromosomal preparations, 5 M HCl solution for 18 min (25C) and Schiff's reagent for 12 hr at 4C (Figures 1B and 1D). Residual background noises were completely removed by HCl hydrolysis during the Feulgen procedure.
According to the International Chicken Genome Consortium (2004), the 1C sequenced female haploid genome of the chicken has 1.05 Gpb, which corresponds to 2.15 pg (by applying Formula 2, described in the Materials and Methods section). We used this value to calculate the DNA content in picograms, independently of other values related in the literature. Using female CRBC nuclei as an internal standard (mean IOD = 7.13, SD ± 0.42, 2C = 2.15 pg), the calculated 2C genome size of male chickens was 2.24 pg (mean IOD = 7.43, SD ± 0.38, C = 1.12 pg, equivalent to 1.095 × 10⁹ bp) [(Table 1); also shown in the frequency distribution histograms of IOD values (Figure 2)]. Statistical analysis confirmed that the 2C genome size of female chickens (2.15 pg) is smaller than that of males (2.24 pg). The CV, measured in the nuclei IOD analysis, was less than 2.6%.
ICM was also applied for IOD measurement of the Z and W chicken sex chromosomes. The Z mean IOD was 0.42 ± 0.05 (index = 3), and the W mean IOD was 0.14 ± 0.06 (index = 1.0). Therefore, the heteromorphism in the sex chromosomes was resolved by ICM.
Discussion
For accurate DNA C value estimation, the microscope instrumentation and the image analysis system were calibrated before each capture session, as recommended by Hardie et al. (2002). According to Vilhar and Dermastia (2002), several aspects of image acquisition and processing need to be considered to provide accurate measurements. Applying the standardization procedures, it is possible to detect systematic errors in the measurement methods and optimize DNA ICM.
In the stability test, we verified that the microscope instrumentation and image analysis system need 12 min to become stable. The light source stabilization provides the constant illumination crucial to avoiding gray value fluctuations (Vilhar and Dermastia 2002).
Female (
Nuclear DNA content of
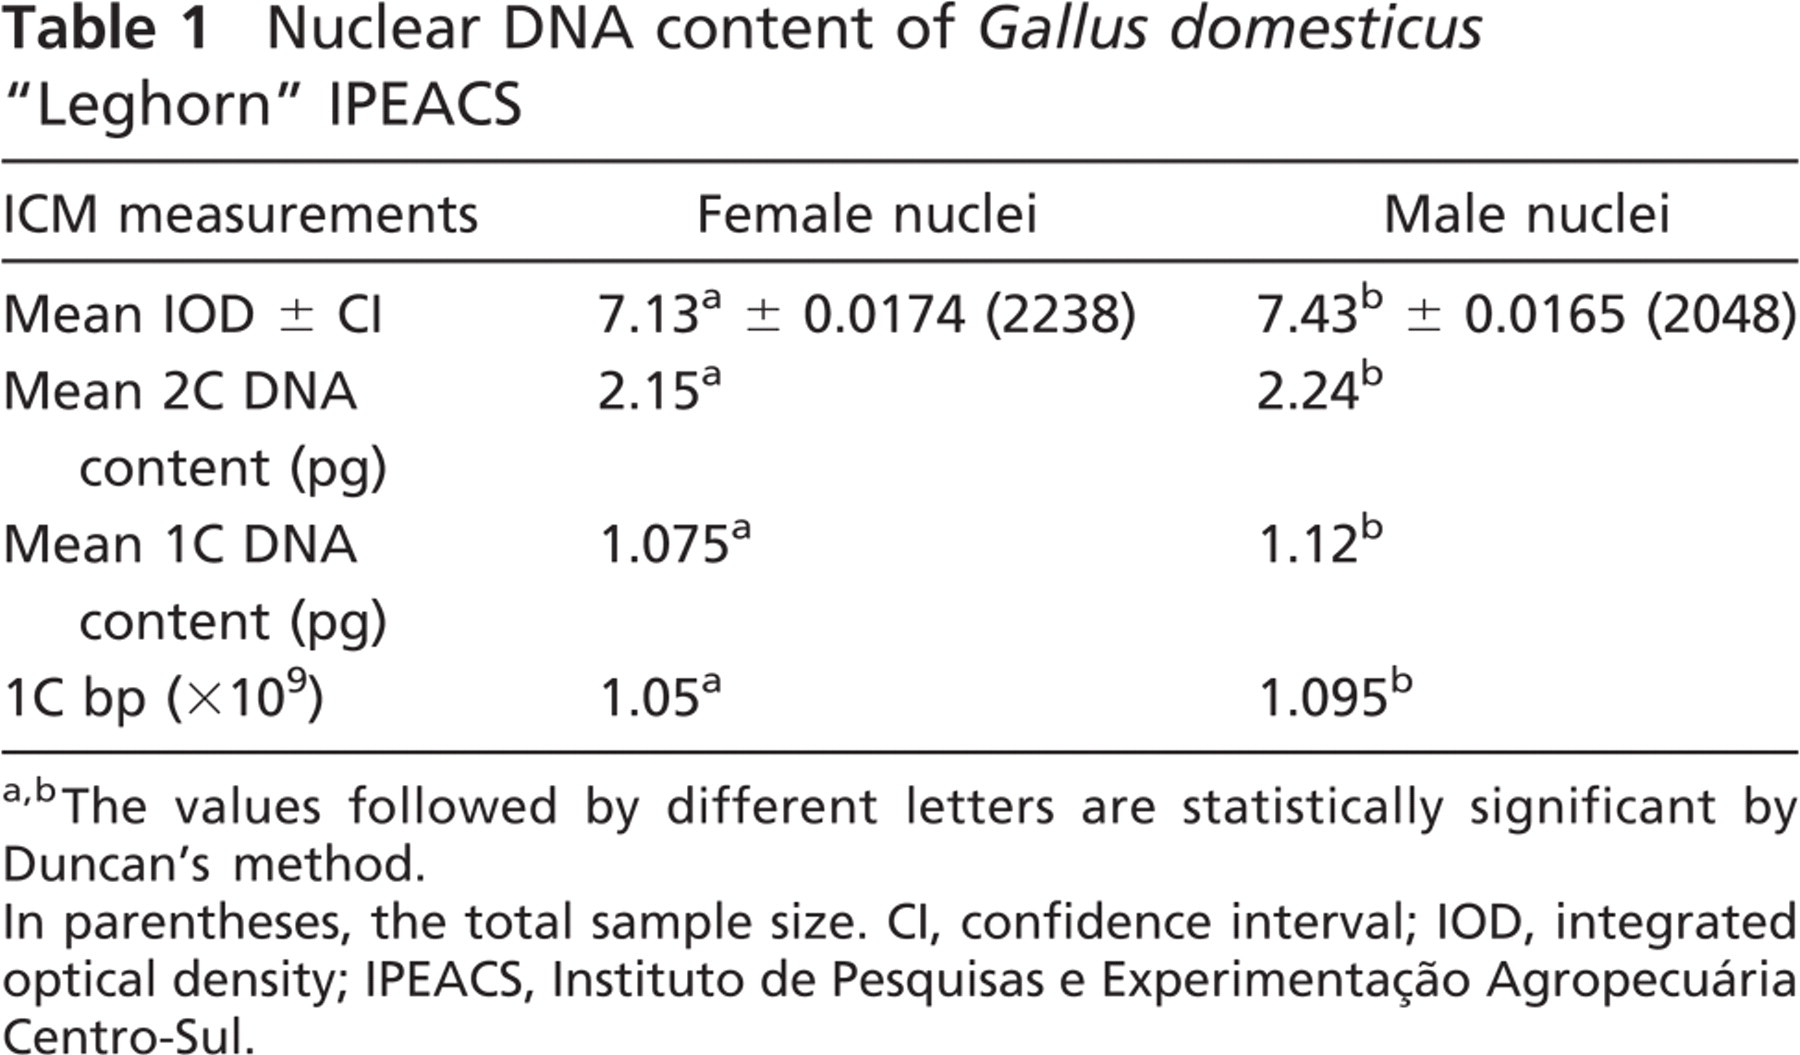
The values followed by different letters are statistically significant by Duncan's method.
In parentheses, the total sample size. CI, confidence interval; IOD, integrated optical density; IPEACS, Instituto de Pesquisas e Experimentação Agropecuária Centro-Sul.
According to Puech and Giroud (1999), the linearity must be experimentally checked for each individual camera. This test showed a linear correlation between calculated and certified IOD values. The values (
In the uniformity evaluation of the IOD measurements over the entire field of view, we found that the CV of IOD values for 64 nuclei was below 1%. According to medical ICM standards (Böcking et al. 1995; Hardie et al. 2002; Vilhar and Dermastia 2002), a CV lower than 3% is acceptable. This instrumentation quality control, in our laboratory conditions, represents a major advance in the standardization of ICM.
The fixation procedure contributed to the maintenance of chromosome integrity. This procedure avoided any ICM bias by providing high chromatin stability. Clarindo and Carvalho (2009) and Rosado et al. (2009) reported that the fixation procedure is crucial for ICM success because it contributes to maintaining nuclei and chromosome integrity, avoiding any bias by providing high chromatin stability. This fact corroborates the finding of nuclei and chromosome resistance to the Feulgen treatment shown in Figure 1.
Because the effective time and concentration of HCl hydrolysis were strictly tested and monitored, the nuclei and chromosomes apparently showed regular and stoichiometric Feulgen staining. An adequate protocol is a key step for supplying adequate nuclei and chromosome ICM (Vilhar et al. 2001; Clarindo and Carvalho 2009). Chieco and Derenzini (1999), Greilhuber (2005), and Abreu et al. (2008) related that hydrolysis is the most critical step in ICM, requiring meticulous determination of the appropriate concentration of HCl, incubation time, and optimal temperature (Greilhuber and Temsch 2001) to ensure the stoichiometric DNA staining with Schiff's reagent. During the hydrolysis step, residual cytoplasmic background noises were removed, increasing the precision of the nuclei and chromosome digital segmentation by image analysis.
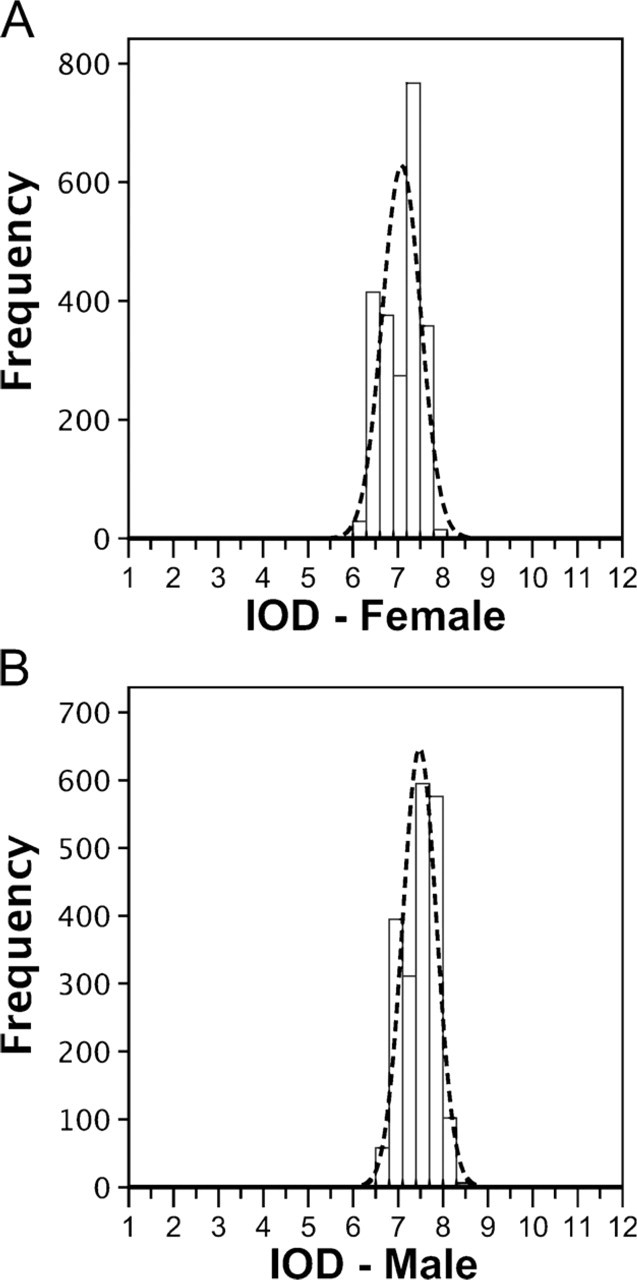
Histograms showing the frequency distribution of integrated optical density (IOD) values obtained from female (
ICM was performed to verify the DNA content differences between male and female chicken nuclei and ZZ/ZW chromosomes. An important problem reported in genome size estimation studies is the presence of different values of DNA content attributed to the same reference standard (Rasch et al. 1971; Galbraith et al. 1983; Tiersch et al. 1989; Nakamura et al. 1990; Tiersch and Wachtel 1991; De Vita et al. 1994; Johnston et al. 1999). This problem became evident when the absolute DNA content was estimated for roosters and hens. Using the value 2C = 2.49 pg for males (Nakamura et al. 1990), it was estimated that 2C = 2.39 pg for females. If, however, 2C = 3.01 pg for roosters is used (Johnston et al. 1999), the value for hens is 2C = 2.88 pg.
The estimated 2C genome size for female and male chickens was 2.15 and 2.24 pg, respectively. Therefore, male 2C content is 0.09 pg (C = 0.045 pg, equivalent to 0.044 × 10⁹ bp, 4.20%) larger than that in females. These female and male chicken 2C genome size values are lower than those reported in other FCM (Tiersch et al. 1989; Nakamura et al. 1990; Tiersch and Wachtel 1991; De Vita et al. 1994; Johnston et al. 1999) and chemical estimates (Rasch et al. 1971; Galbraith et al. 1983). This difference can be attributed in part to underestimated values of DNA content in bps, as reported for the genome of
CV, measured in the nuclei IOD analysis, was less than 2.6%; this result is consistent with ICM medical parameters, which accept CV values below 5% (Böcking et al. 1995; Haroske et al. 1998,2001). These low CV values showed the accuracy of the ICM for detection of small differences in DNA content. Doležel and Göhde (1995) reported that CV values smaller than the DNA content difference are required for discrimination of the samples.
The DNA content difference between male and female genome size of 4.20% is higher than the 3.70% reported by Vindeløv et al. (1983) using FCM. These authors, separately running samples of one male and one female individual, mention that there is no firm proof that the differences found are sex related. They argue that the results were obtained from a single individual, and that the FCM methodology can be influenced by fluctuations in the equipment between different processes or by changes in the calibration level of the flow cytometer channels.
Other results were shown by Nakamura et al. (1990). These authors compared samples from three inbred strains (one male and one female from each strain) and an F1 hybrid (eleven males and seven females) running separately in FCM. They calculated a mean 2C value considering all samples and found a difference of 2.7% between male and female DNA content. The CVs were not mentioned.
In the present work, it was possible to associate cytogenetic analyses and ICM to directly analyze sex chromosomes. The use of these techniques allowed us to determine mean IOD for Z (0.42) and W chromosomes (0.14). These values indicate that the Z metaphasic chromosome has 200% the DNA content of the W. Therefore, the heteromorphism in the sex chromosomes was also resolved by ICM. On the basis of nuclei and sex chromosome IOD values, the IOD referent to only autosomal chromosomes was found. The male showed a mean IOD value equivalent to 6.59 and the female a mean IOD value equivalent to 6.57, a difference of 0.3%. This result clearly shows that the nuclei genome size difference (4.2%) is attributable to DNA content heteromorphism of the Z and W chromosomes.
Our results showed that the Z chromosome is 200% larger than the W. Other works concerning DNA content of chicken chromosomes have been performed. On the basis of the data of Bloom et al. (1993), who used chromosome area parameters from images cut out of photomicrographs, we calculated a difference of 273% between the Z and W chromosomes. From the results of Smith and Burt (1998), who worked with a laser scanning confocal microscope, the difference corresponds to 200%.
In conclusion, the results showed that ICM was suitable for resolving the DNA content differences between male and female nuclei and sex chromosomes of
Footnotes
Acknowledgements
The authors are grateful to the Conselho Nacional de Desenvolvimento Científico e Tecnológico and to the Fundação de Amparo à Pesquisa do Estado de Minas Gerais for financial support.