
Abstract
Most, if not all, dorsal root ganglion (DRG) neurons use the neurotransmitter glutamate. There are, however, conflicting reports of the percentages of DRG neurons that express glutaminase (GLS), the enzyme that synthesizes glutamate, ranging from 30% to 100% of DRG neurons. Defining DRG neuron populations by the expression of proteins like GLS, which indicates function, is routinely accomplished with immunolabeling techniques. Proper characterization of DRG neuron populations relies on accurate detection of such antigens. It is known intuitively that fixation can alter immunoreactivity (IR). In this study, we compared the effects of five formaldehyde concentrations between 0.25% and 4.0% (w/v) and five picric acid concentrations between 0.0% and 0.8% (w/v) on the IR of GLS, the voltage-gated sodium channel 1.8 (Nav 1.8), and the capsaicin receptor TRPV1. We also compared the effects of five incubation time lengths from 2 to 192 hr, in primary anti-serum on IR. Lowering formaldehyde concentration elevated IR for all three antigens, while raising picric acid concentration increased Nav 1.8 and TRPV1 IR. Increasing IR improved detection sensitivity, which led to higher percentages of labeled DRG neurons. By selecting fixation conditions that optimized IR, we found that all DRG neurons express GLS, 69% of neurons express Nav 1.8, and 77% of neurons express TRPV1, indicating that some previous studies may have underestimated the percentages of DRG neurons expressing these proteins. This manuscript contains online supplemental material at http://www.jhc.org. Please visit this article online to view these materials.
Keywords
I
We were concerned primarily with identifying which DRG neurons express GLS, and we hypothesized that GLS was ubiquitously distributed throughout the DRG. To determine if the effects of altering fixative concentration could be demonstrated for markers known to have limited distributions among DRG neurons, we chose to use antisera for voltage-gated sodium channel 1.8 (Nav 1.8) and transient receptor potential vanilloid receptor 1 (TRPV1). Electrophysiological properties, axon diameters, and cell body sizes have been used in attempts to classify populations of DRG neurons (Yoshida and Matsuda 1979; Lee et al. 1986; Fang et al. 2005b). More recently, protein markers have been used to identify subpopulations of DRG neurons that serve specific sensory modalities. Nav 1.8 and TRPV1 are examples of such markers that are expressed in small-diameter, nociceptive DRG neurons (Caterina et al. 1997; Djouhri et al. 2003; Fang et al. 2005a; Price and Flores 2007). If a “fully optimized” fixative were to indicate that all DRG neurons expressed one of these two markers, then this might indicate that the specificity of our techniques were compromised by optimizing the fixative. In such a case, the conclusion that distribution of GLS was ubiquitous would be flawed. These two antisera were initially designed as controls, but the outcomes of these studies showed interesting and helpful results.
Materials and Methods
Animals
Sprague-Dawley rats (n = 15; 200–300 g) were housed in a 12-hr-light:12-hr-dark cycle and given free access to food and water. Procedures were conducted according to guidelines from the National Institutes of Health (NIH-NRC 2003) and were approved by the Oklahoma State University Center for Health Sciences institutional animal care and use committee. All appropriate efforts were made to minimize the number of animals used in this study.
Tissue Preparation
Rats were anesthetized with tribromoethanol [Avertin; 2.5% (w/v)] and xylazine and perfused through the ascending aorta with 75 ml of calcium-free Tyrode's solution (pH 7.3), followed by 300 ml of fixative. Rats were randomly assigned to specific experiments, irrespective of their gender. Gender differences were not investigated in this study. Five rats were used for the formaldehyde concentration comparison. The fixative used for each rat contained 0.2% (w/v) picric acid in 0.1 M sodium phosphate buffer, and formaldehyde concentrations were varied among the five fixatives to 4%, 2%, 1%, 0.5%, or 0.25% (w/v). Five rats were used for the picric acid comparison. To prevent morphological changes to the tissue caused by inadequate fixation, we chose to include 1% formaldehyde in all of the picric acid comparisons. The fixative used for each rat contained 1.0% (w/v) formaldehyde in 0.1 M sodium phosphate buffer, and picric acid concentrations were varied among the five fixatives to 0.8%, 0.4%, 0.2%, 0.1%, or 0.0% (w/v). Two rats were used for the primary antisera incubation time comparison, and one rat was used for the postfixation comparison. The fixative used for these three rats was 0.2% picric acid and 1.0% formaldehyde in 0.1 M sodium phosphate buffer. All fixatives were adjusted to pH 7.3. Lumbar DRG dissected from perfused rats were post-fixed at 4C in the same fixative used for perfusion. For the formaldehyde, picric acid, and incubation comparisons, DRG were postfixed for 4 hr. For the postfixation time comparison, DRG were postfixed at 0, 0.5, 1, 4, or 20 hr. In addition, one set of DRG was postfixed in 4.0% formaldehyde for 4 hr after an initial fixation in 0.2% picric acid and 1.0% formaldehyde. All DRG were cryoprotected overnight at 4C in PBS (pH 7.3) containing 10% (w/v) sucrose.
Immunofluorescence
All DRG for a given comparison (i.e., formaldehyde and picric acid concentrations and primary incubation time) were embedded in the same frozen block, and 8-μm mid-DRG serial sections were cut with a Microm HM 550 OMVP cryostat (Richard Allan Scientific; Kalamazoo, MI). To prevent recounting of neurons for a given primary antiserum, sections were allotted to one of the three antisera, and the fourth section was discarded each time, making the minimum approximate distance between two analyzed sections 24 μm. Sections were thaw mounted to gelatin-coated SuperFrost slides (Fisher Scientific; Pittsburg, PA) and dried for 2 hr at 37C. Dried sections were rinsed three times in PBS before blocking for 1 hr at room temperature in 5% (v/v) normal goat serum, 1% (w/v) BSA, and 1% (w/v) polyvinylpyrrolidone in PBS with 0.2% (v/v) Triton X-100 (PBS-T). Sections for the formaldehyde and picric acid comparisons were incubated in primary antisera diluted with PBS-T for 4 days at 4C. Sections for the primary incubation time comparison were incubated at room temperature for 2 hr or at 4C for 20, 48, 96, or 192 hr. For GLS detection, polyclonal rabbit antiserum against whole GLS (Haser et al. 1985) was used at 1:10,000 dilution. For Nav 1.8 detection, polyclonal rabbit antiserum (Sigma; St. Louis, MO) against a 15-amino-acid peptide corresponding to the C-terminal residues (EDEVAAKEGNSPGPQ) of rat Nav 1.8 was used at 1:2000 dilution. For TRPV1 detection, polyclonal guinea pig antiserum (Neuromics; Edina, MN) against a 22-amino-acid peptide corresponding to the C-terminal residues (YTGSLKPEDAEVFKDSMVPGEK) of rat TRPV1 was used at 1:2000 dilution (Guo et al. 1999; Price and Flores 2007). Antisera dilutions were determined from previous dilution curve experiments (data not shown). Following incubation in primary antiserum, sections were rinsed three times in PBS and incubated in secondary antibody diluted in PBS-T at 1.0 μg/ml for 1 hr at room temperature. For detection of rabbit anti-GLS anti-serum or rabbit anti-Nav 1.8 antiserum, biotinylated goat anti-rabbit (Vector Laboratories; Burlingame, CA) antiserum was used. For detection of guinea pig anti-TRPV1 antiserum, AlexaFluor 488-conjugated goat anti-guinea pig (Molecular Probes; Carlsbad, CA) anti-serum was used. GLS and Nav 1.8 sections were rinsed twice in PBS and once in sodium carbonate-buffered saline (pH 9.0) and incubated for 1 hr at room temperature in 1.0 μg/ml fluorescein-conjugated avidin D (Vector Laboratories) diluted in sodium carbonate-buffered saline. All sections were rinsed three more times in PBS and coverslipped with ProLong Gold mounting medium (Molecular Probes).
Primary antiserum absorption control and secondary antiserum control experiments were performed for the three primary antisera and two secondary antisera, respectively. One additional rat was perfused with 0.8% picric acid and 0.25% formaldehyde, which are the concentrations of picric acid and formaldehyde that gave the highest immunofluorescence. Lumbar DRG from this rat were used for primary antiserum absorption controls and secondary antiserum control experiments. For primary antiserum absorption controls, each diluted antiserum was incubated for 24 hr at 4C with the respective antigen at 10–40 μg/ml. Processing of DRG sections for immunofluorescence was carried out as described above. Adjacent sections were incubated for 4 days at 4C in either absorbed diluted anti-sera or nonabsorbed diluted antisera. The secondary antisera control sections were incubated in PBS-T for 4 days at 4C before routine processing was continued.
Image Analysis
Images were acquired using a 20x objective on an Olympus BX51 epifluorescence microscope (Olympus; Center Valley, PA) equipped with a SPOT RT740 quantitative camera (Diagnostic Instruments; Sterling Heights, MI). To ensure proper quantitation, we captured all images by using a 300-msec exposure with the gain set at 1. Captured images were 1600 × 1200 pixels with 2.69 pixels per micrometer. For the formaldehyde and picric acid comparisons, three slides with tissue from each antiserum were used, and three images from each of the five treatments were captured, resulting in 45 images per antiserum and 135 images per fixative comparison. For the primary antibody incubation time comparison, two slides with tissue from each antiserum for each of the five time points were used and four images from each slide were obtained, resulting in 40 images per antiserum and 120 images for the incubation comparison. All neuron profiles with clearly visible nuclei that were not touching the edge of the image were traced with a Cintiq 21UX interactive pen display (Wacom; Kita Saitama-Gun, Saitama, Japan), using the freehand selection tool in ImageJ software (NIH). Nuclei were excluded from the regions of interest, making each region of interest correspond to the cytoplasmic profile of a single DRG neuron. Since all images were acquired at a bit depth of 8, pixel intensities could range from 0 (darkest) to 255 (lightest) on a grayscale. The mean gray value and area in μm2 for each cytoplasmic profile were measured and copied to a spreadsheet. The mean gray values for each cell were converted to relative IR by using the following formula, [(mean gray value - MIN)/(MAX - MIN)] × 100, where MAX and MIN are the maximum and minimum mean gray values for cytoplasmic profiles in a given comparison of experimental conditions with one of the three primary antisera. For each comparison of one of the three primary antisera, a relative IR threshold value was determined that best distinguished labeled from unlabeled cells. The values for area (μm2) were binned into small (<400 μm2), medium (400–799.99 μm2), and large (≥800 μm2) sized categories to indicate three broadly defined neuronal subpopulations that corresponded to C, Aδ, and Aα/β fibers, respectively (Fang et al. 2005a, 2006). Three populations of DRG neurons also have been identified morphologically by immunolabeling patterns in cat (Garry et al. 1989) and rat (Tuchscherer and Seybold 1985) studies.
Statistics
Data were analyzed with Prism version 5.01 software (GraphPad Software; San Diego, CA). The distributions of relative IR values for each dataset (i.e., cells fixed with 4% formaldehyde) within a given comparison (i.e., formaldehyde effects on small-cell GLS IR) were tested for normality with the D'Agostino and Pearson omnibus normality test. Bartlett's test for equal variances was used to determine if the variances were homogeneous for each comparison. Significant differences in mean relative IR among different experimental conditions were determined by the Kruskal-Wallis one-way ANOVA by ranks with the Dunn posttest. Correlation analyses were done by comparing the experimental condition that was varied (i.e., formaldehyde, picric acid, and incubation time length) as × values and the median relative IR as Y values. The χ2 test for trend was used for each comparison to determine if there was a linear trend between the percentages of neurons being labeled as the experimental condition was altered. Results were considered significant when the p value was <0.05.
Effects of formaldehyde concentration in fixative on IR.
Results
A total of 8908 cytoplasmic profiles were traced and analyzed in this study. Relative IR values for most datasets were not normally distributed, and variances were heterogeneous for nearly all comparisons. We therefore decided to use nonparametric statistical analyses and presented the data in scatter graphs.
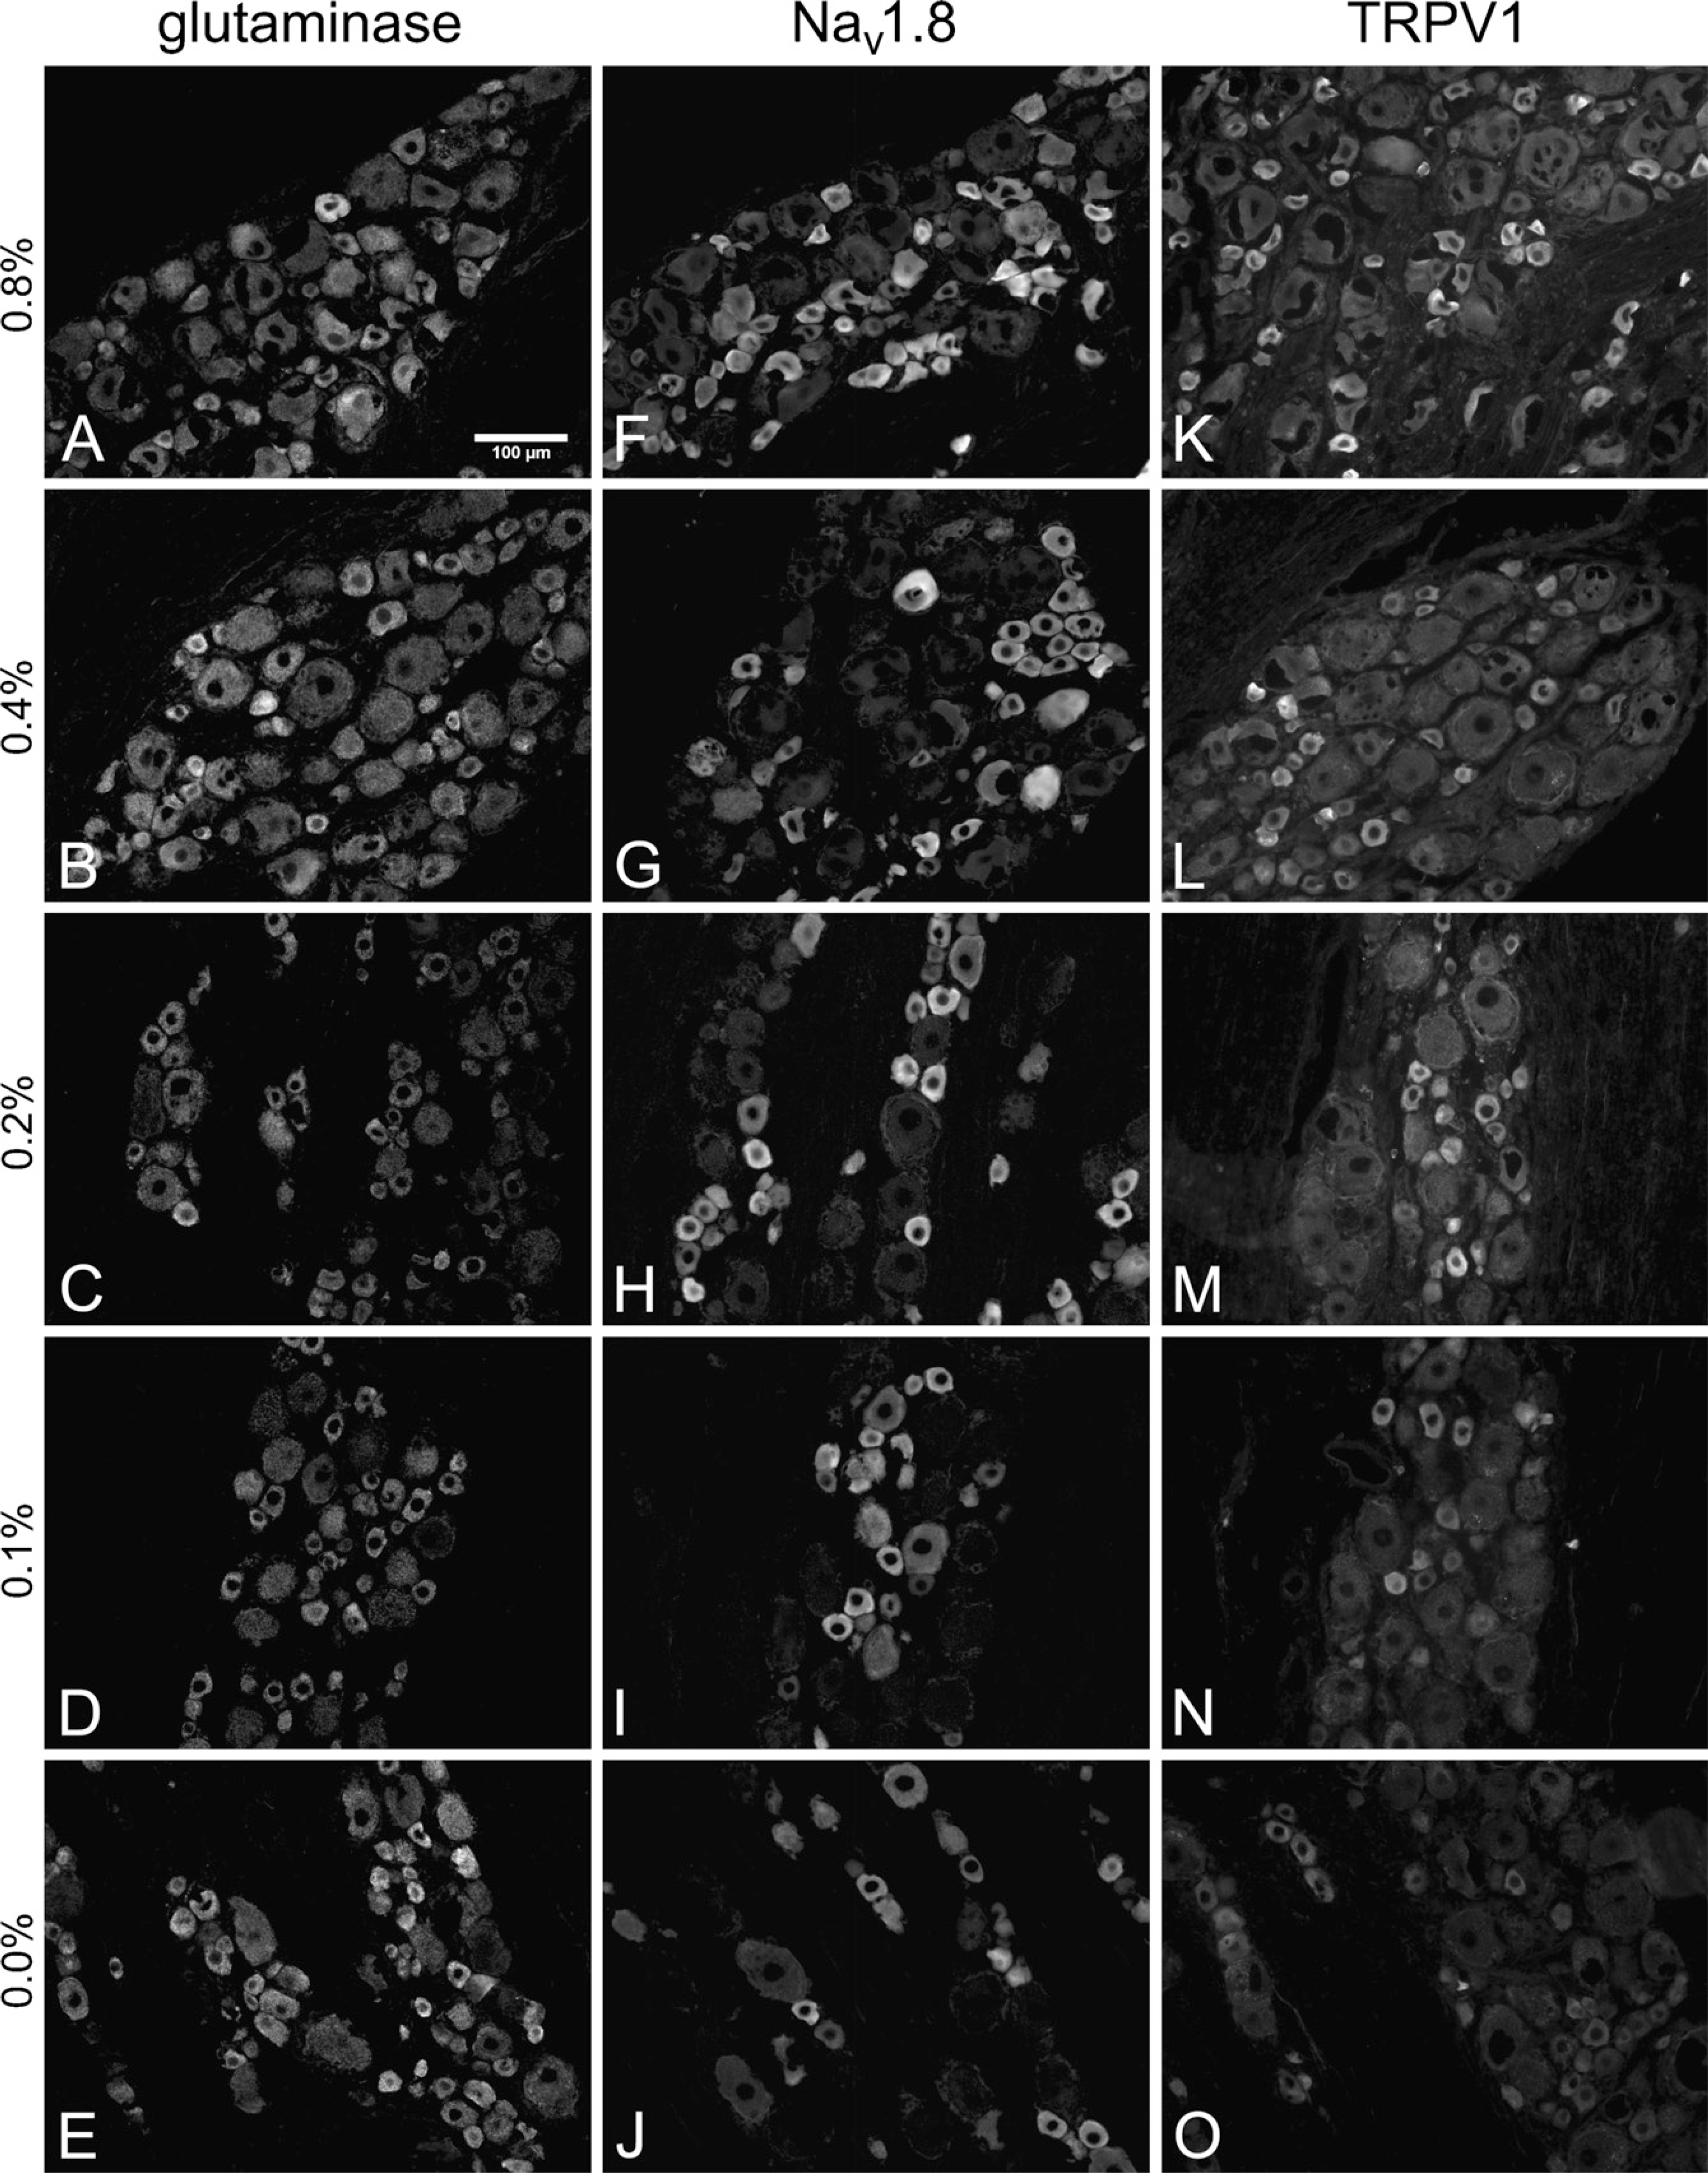
Representative micrographs from the formaldehyde comparison. As formaldehyde concentration decreased, glutaminase (GLS) immunoreactivity (IR) increased
Effects of Formaldehyde Concentration in Fixative on Immunofluorescence
A total of 3115 cytoplasmic profiles were traced and analyzed for the formaldehyde comparison. The numbers of cytoplasmic profiles traced and analyzed for GLS, Nav 1.8, and TRPV1 were 1103, 1232, and 780, respectively. The effect of formaldehyde on GLS IR was qualitatively apparent from micrographs (Figures 1A–1E) and scatter plots (Figures 2A–2C) and was reminiscent of the effects of decreasing formaldehyde concentrations on GLS IR noted in brain neurons (Kaneko et al. 1989). Decreasing the fixative formaldehyde concentration significantly raised GLS IR for all three sizes of DRG neurons for each stepdown in formaldehyde concentration from 4.0% to 0.5% (Figures 2A–2C), resulting in higher percentages of neurons being labeled for GLS (Table 1). For all sizes of DRG neuron, the GLS IR-enhancing effect of using less formaldehyde concentration reached a plateau at 0.5% formaldehyde. No further significant increase in GLS IR was detected when 0.25% formaldehyde was used (Figures 2A–2C). There were significant correlations between formaldehyde concentration and GLS IR for all three sizes of DRG neuron (Figures 2A–2C). Therefore, as formaldehyde concentration increased, GLS IR decreased, and 93–96% of the variation in median GLS IR values can be explained by variation in formaldehyde concentration. There was also a significant linear trend (as determined by the χ2 test for trend) in which lower formaldehyde concentrations resulted in greater percentages of neurons being considered as labeled for GLS (above relative IR threshold), regardless of size class (Figures 2A–2C). All DRG neurons (except one large neuron) were considered labeled for GLS when 1.0% formaldehyde or lower was used (Table 1).
To determine if the effects of formaldehyde concentration in the fixative were specific to GLS IR, we examined the changes in Nav 1.8 and TRPV1 IR intensities and distributions in DRG sections from the same rats. Qualitatively, the effect of formaldehyde on IR for these two proteins (Figures 1F–1J and 1K–1O) was not as apparent as it was for GLS (Figures 1A–1E). Image analysis, however, revealed that decreasing formaldehyde concentration led to some significant increases in Nav 1.8 IR of small- and medium-sized DRG neurons (Figures 2D and 2E), whereas it had no effect on Nav 1.8 IR of large DRG neurons (Figure 2F). There was a significant trend in which lower concentrations of formaldehyde resulted in higher Nav 1.8 IR in medium-sized neurons (Figure 2E) but not small neurons (Figure 2D). Similarly, lowering the formaldehyde concentration to 1% or less led to a significant increase in TRPV1 IR of small- and medium-sized DRG neurons (Figures 2G and 2H), whereas lowering it to 2.0% or less produced a significant increase in TRPV1 IR of large cells (Figure 2I). Correlations between formaldehyde concentration and TRPV1 IR were significant for medium and large cells (Figures 2H and 2I). There was a significant linear trend in which lower formaldehyde concentrations resulted in greater percentages of all three size classes of DRG neurons being labeled for TRPV1 (Figures 2G–2I, Table 1).
Effects of fixative composition and primary antiserum incubation length on the percentage of labeled DRG neurons
In general, decreasing formaldehyde concentration in the fixative raised the percentage of dorsal root ganglion (DRG) neurons labeled for a particular antigen. Increasing picric acid concentration had no effect on the percentages of any neurons labeled for glutaminase (GLS) or on the percentages of large neurons labeled for transient receptor potential vanilloid receptor (TRPV1). Higher picric acid concentrations led to more small and medium cells being labeled for voltage-gated sodium channel 1.8 (Nav 1.8) and TRPV1, and fewer large neurons labeled for Nav 1.8. In general, longer incubation times led to more neurons being labeled for all three antigens. IR, immunoreactivity.
Effects of Picric Acid Concentration in Fixative on Immunofluorescence
A total of 2955 cytoplasmic profiles were traced and analyzed for the picric acid comparison. The numbers of cytoplasmic profiles traced and analyzed for GLS, Nav 1.8, and TRPV1 were 935, 993, and 1027, respectively. The effect of picric acid on GLS IR was not qualitatively apparent from micrographs (Figures 3A–3E) or scatter plots (Figures 4A–4C). No concentration of picric acid in the fixative significantly altered the median GLS IR except for medium-sized neurons when 0.1% picric acid was added (Figure 4B). There were no significant correlations between picric acid concentration and GLS IR for any size of neurons, nor were there any significant linear trends in which picric acid concentration changed the percentages of neurons labeled for GLS (Figures 4A–4C). All rats used in the picric acid comparison were perfused with fixatives containing 1.0% formaldehyde. All neurons were considered labeled for GLS in the picric acid comparison (Table 1), which supports the findings of the formaldehyde comparison in which formaldehyde concentrations of ≤1% resulted in all DRG neurons being labeled for GLS.
To determine if the picric acid concentration in the fixative had effects on IR for proteins other than GLS, we examined IR of Nav 1.8 and TRPV1 in DRG sections from the same rats. Qualitatively, the effect of picric acid on IR for these two proteins was more apparent than it was for GLS (Figures 3F–3J and 3K–3O). Image analysis revealed that raising the picric acid concentration to 0.4% and higher led to significant increases in Nav 1.8 IR of small cells (Figure 4D) and that raising it to 0.2% and higher significantly increased Nav 1.8 IR of medium cells (Figure 4E). There were significant correlations between picric acid concentration and Nav 1.8 IR for small and medium neurons, and 82–84% of the variation in the median Nav 1.8-IR values can be explained by variations in picric acid concentration. There were significant trends in which higher concentrations of picric acid increased the percentage of small and medium DRG neurons labeled for Nav 1.8 (Figures 4D and 4E; Table 1). However, increasing picric acid concentration actually decreased Nav 1.8 IR of large cells when 0.2% or more was used (Figure 4F), resulting in a significant trend in which increasing picric acid concentration resulted in fewer large neurons being labeled for Nav 1.8 (Table 1).
Adding a picric acid concentration of 0.2% or higher led to a significant increase in TRPV1 IR of small cells (Figure 4G), whereas adding any amount significantly increased TRPV1 IR of medium cells (Figure 4H). There were also significant trends for higher picric acid concentrations to raise the percentages of small and medium neurons labeled for TRPV1 (Figures 4G and 4H; Table 1). Increasing the picric acid concentration to 0.2% and 0.8% significantly increased TRPV1 IR of large neurons but had no significant effect on the percentages of large neurons labeled for TRPV1 (Figure 4I; Table 1).
Effects of Length of Incubation in Primary Antiserum on Immunofluorescence
A total of 2838 cytoplasmic profiles were traced and analyzed for the incubation time length comparison. The numbers of cytoplasmic profiles traced and analyzed for GLS, Nav 1.8, and TRPV1 were 1012, 1002, and 824, respectively.
The effect of incubation time length on GLS IR was qualitatively apparent from micrographs (Figures 5A–5E) and scatter plots (Figures 6A–6C). Image analysis revealed that incubation for 20–48 hr increased GLS IR of all neurons significantly compared with just 2 hr of incubation; however, there was no significant difference between incubation time of 20 vs 48 hr (Figures 6A–6C). Moreover, incubation for 96–192 hr further increased GLS IR of all neurons above 20–48 hr of incubation, but 192 hr did not yield higher GLS IR than 96 hr (Figures 6A–6C). Background fluorescence levels also started to increase when incubation in anti-GLS was 96 hr and longer (Figures 5D and 5E). There was a significant trend in which increasing lengths of primary antiserum incubation time increased the percentages of neurons labeled for GLS, regardless of size (Figures 6A–6C; Table 1).
To determine if the effects of incubation time in primary antiserum were specific to GLS IR, we examined Nav 1.8 and TRPV1 IR in DRG sections from the same rats. Qualitatively, the effect of incubation time on IR for these two proteins (Figures 5F–5J and 5K–5O) was apparent after 48 hr or more of incubation in primary antiserum. Image analysis revealed that a significant increase in Nav 1.8 IR of small and medium neurons occurred between 2 and 20 hr (Figures 6D and 6E) but that 96 hr or more was required to significantly increase Nav 1.8 IR of large neurons (Figure 6F). Background fluorescence levels also started to increase with incubation in anti-Nav 1.8 was 48 hr and longer (Figures 5H–5J). There was a significant trend in which increasing lengths of time of primary antiserum incubation increased the percentages of neurons labeled for Nav 1.8, regardless of size (Figures 6D–6F; Table 1). Increases in TRPV1 IR were noted as early as 20 hr of incubation for all sizes of DRG neurons (Figures 6G–6I), and there was a significant trend in which increasing lengths of primary antiserum incubation time increased the percentages of neurons labeled for TRPV1, regardless of size (Figures 6G–6I; Table 1). Background fluorescence levels also started to increase when incubation in anti-TRPV1 was 96 hr and longer (Figures 5N and 5O).
Effects of Length of Postfixation on Immunofluorescence
A total of 557 cytoplasmic profiles were traced and analyzed for postfixation comparison. The numbers of cytoplasmic profiles traced and analyzed for GLS and Nav 1.8 were 235 and 322, respectively. There were no significant correlations between length of post-fixation time and IR for GLS or Nav 1.8 for any size of neurons; nor were there any significant linear trends of postfixation time lengths for changing the percentages of neurons labeled for GLS and Nav 1.8 (see supplemental data SD1). There were, however, significant differences in relative GLS and Nav 1.8 IR after varying times of postfixation. When DRG were postfixed for 4 hr in 4.0% formaldehyde in 0.1 M sodium phosphate buffer, there was a significant decrease in GLS IR for all sizes of DRG neurons. Postfixation for 1 to 4 hr in 1.0% formaldehyde with 0.2% picric acid seemed to give maximum Nav 1.8-IR in small and medium DRG neurons.
Effects of picric acid concentration in fixative on IR.
Specificity Controls
These control experiments were performed on tissue sections fixed in optimal or near optimal fixative concentrations and incubated for 96 hr. Absorption of each of the three antisera with antigen diminished IR to near background levels (Figure 7, top three rows). In addition, omitting primary antisera resulted in no IR (Figure 7, bottom row). Control experiments indicated that the primary antisera used were specific for their respective antigens and that the secondary anti-sera used produced little to no nonspecific labeling. In addition, we immunoprecipitated (IP) DRG lysates with either rabbit anti-Nav 1.8 (Sigma) or mouse anti-Nav 1.8 antiserum (NeuroMab; UC Davis, Davis, CA). Western blots (WB) of the eluted proteins were then probed with the complimentary antiserum, e.g., IP: rabbit and WB:mouse. Both the IP and the WB protocols showed a prominent band at ×220 kDa (data not shown). Moreover, double labeling with the two antisera revealed greater than 99% colocalization among DRG neurons (data not shown).
Representative micrographs from the picric acid comparison. No obvious qualitative change in GLS IR was observed as picric acid concentration was increased
Discussion
In the present study, we sought to clarify the extent of GLS expression among rat DRG neurons and to determine the effects of fixative composition and incubation length on GLS IR. Previous studies showed a broad range in the percentage of rat DRG neurons exhibiting GLS IR (Cangro et al. 1984, 1985; Miller et al. 1993; Li et al. 1996), which we attributed to the difference in formaldehyde concentration in the fixative used for tissue preservation (Kaneko et al. 1989). We therefore hypothesized a negative correlation between GLS IR in the rat DRG and formaldehyde concentration in the fixative. By performing a 2-fold dilution curve of formaldehyde concentration, we were able show this effect qualitatively (Figures 1A–1E). In addition, we obtained semiquantitative measures of GLS IR of the cytoplasm in combination with size measurements for each neuron (Figures 2A–2C), which revealed significant elevations in GLS IR as formaldehyde concentration decreased for all sizes of DRG neurons. Furthermore, there were significant correlations and trends for lower concentrations of formaldehyde to increase GLS IR in DRG neurons of all sizes. Picric acid is another fixative component that was used in the studies that reported higher estimates of GLS expression in the rat DRG (Miller et al. 1993; Li et al. 1996), so we also compared the effects of five concentrations of picric acid on GLS IR. Our results indicated that picric acid had no significant effect on GLS IR (Figures 3A–3E and 4A–4C). In the present study, increasing the length of incubation had the expected effect of raising GLS IR (Figures 5A–5E and 6A–6C), since a polyclonal antiserum was used. Lengths of incubation time were different among the previous studies of GLS IR in the rat DRG, but we doubt that length of incubation time was responsible for the discrepancies. The studies that reported lower estimates of GLS expressing DRG neurons incubated sections in polyclonal anti-GLS for 1 hr at 37C (Cangro et al. 1985) and 48 hr at 4C (Battaglia and Rustioni 1988), whereas Li et al. (1996) and Miller et al. (1993) used the same monoclonal antibody (Kaneko et al. 1988) and incubated overnight at 4C. We conclude that the reported differences from previous studies in the percentages of DRG neurons expressing GLS were likely due to effects of formaldehyde concentration in the fixative.
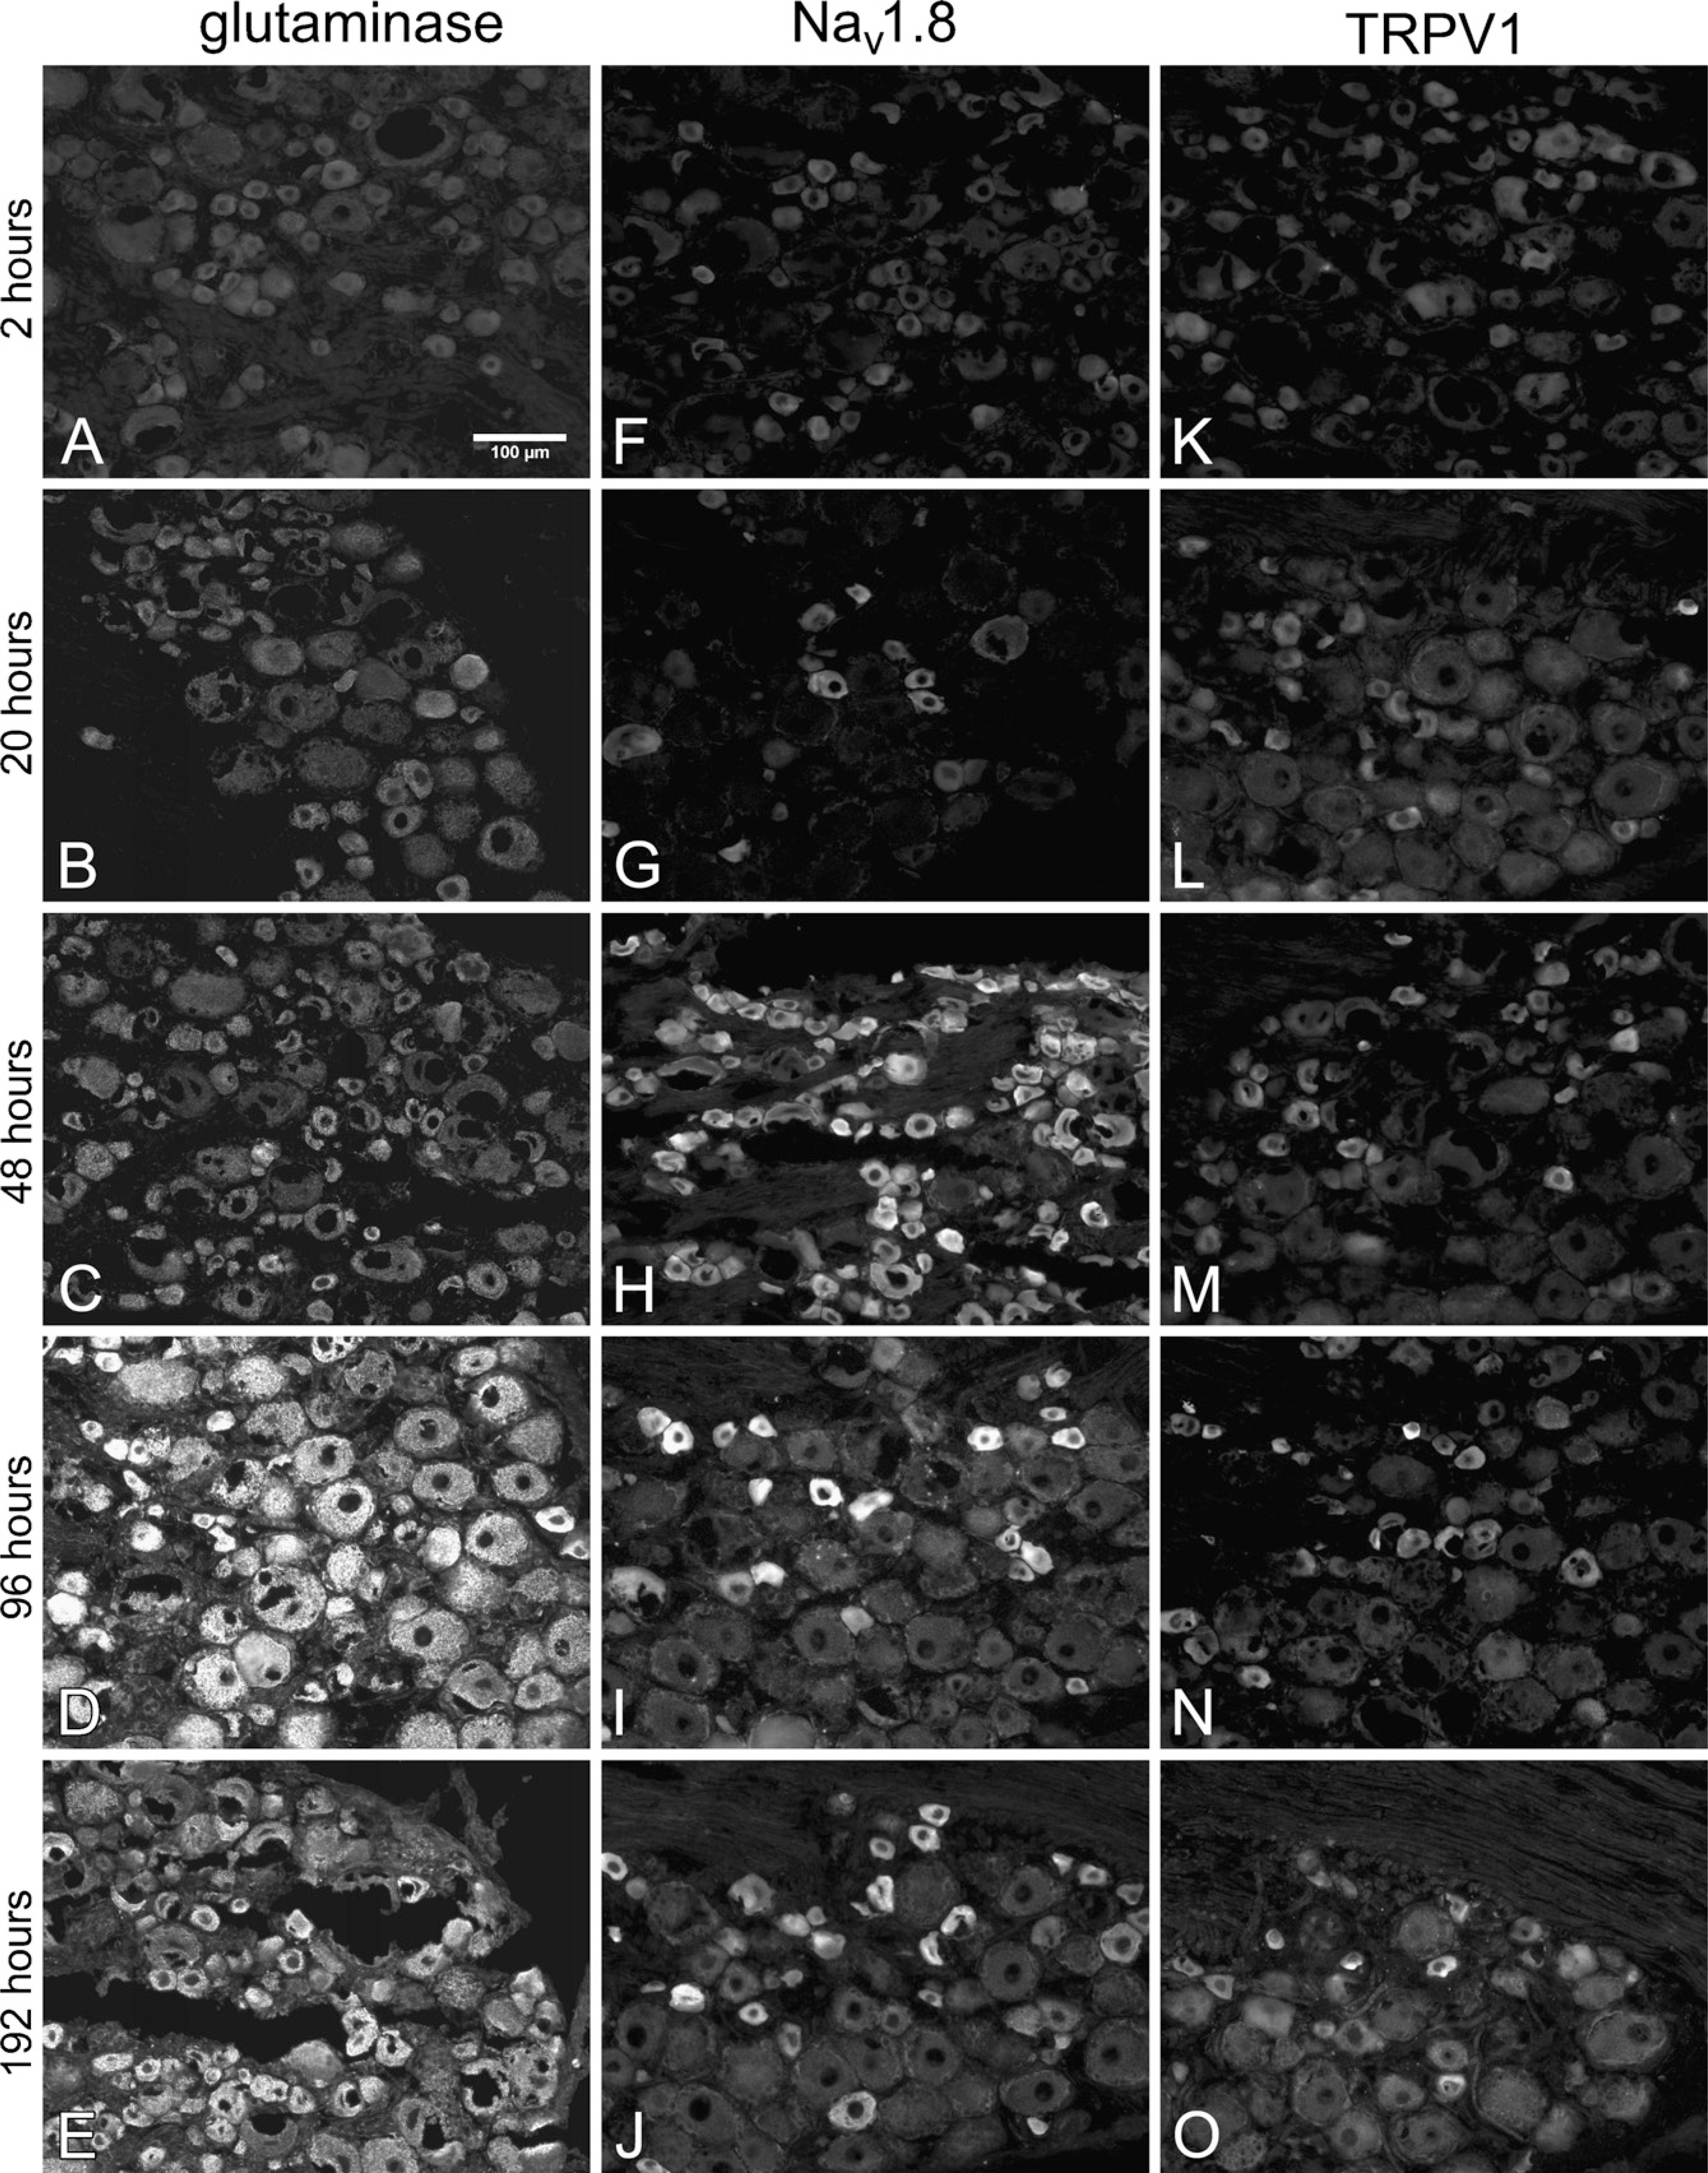
Representative micrographs from the incubation time length comparison. Extending the length of incubation time in primary antiserum increased the IR for GLS
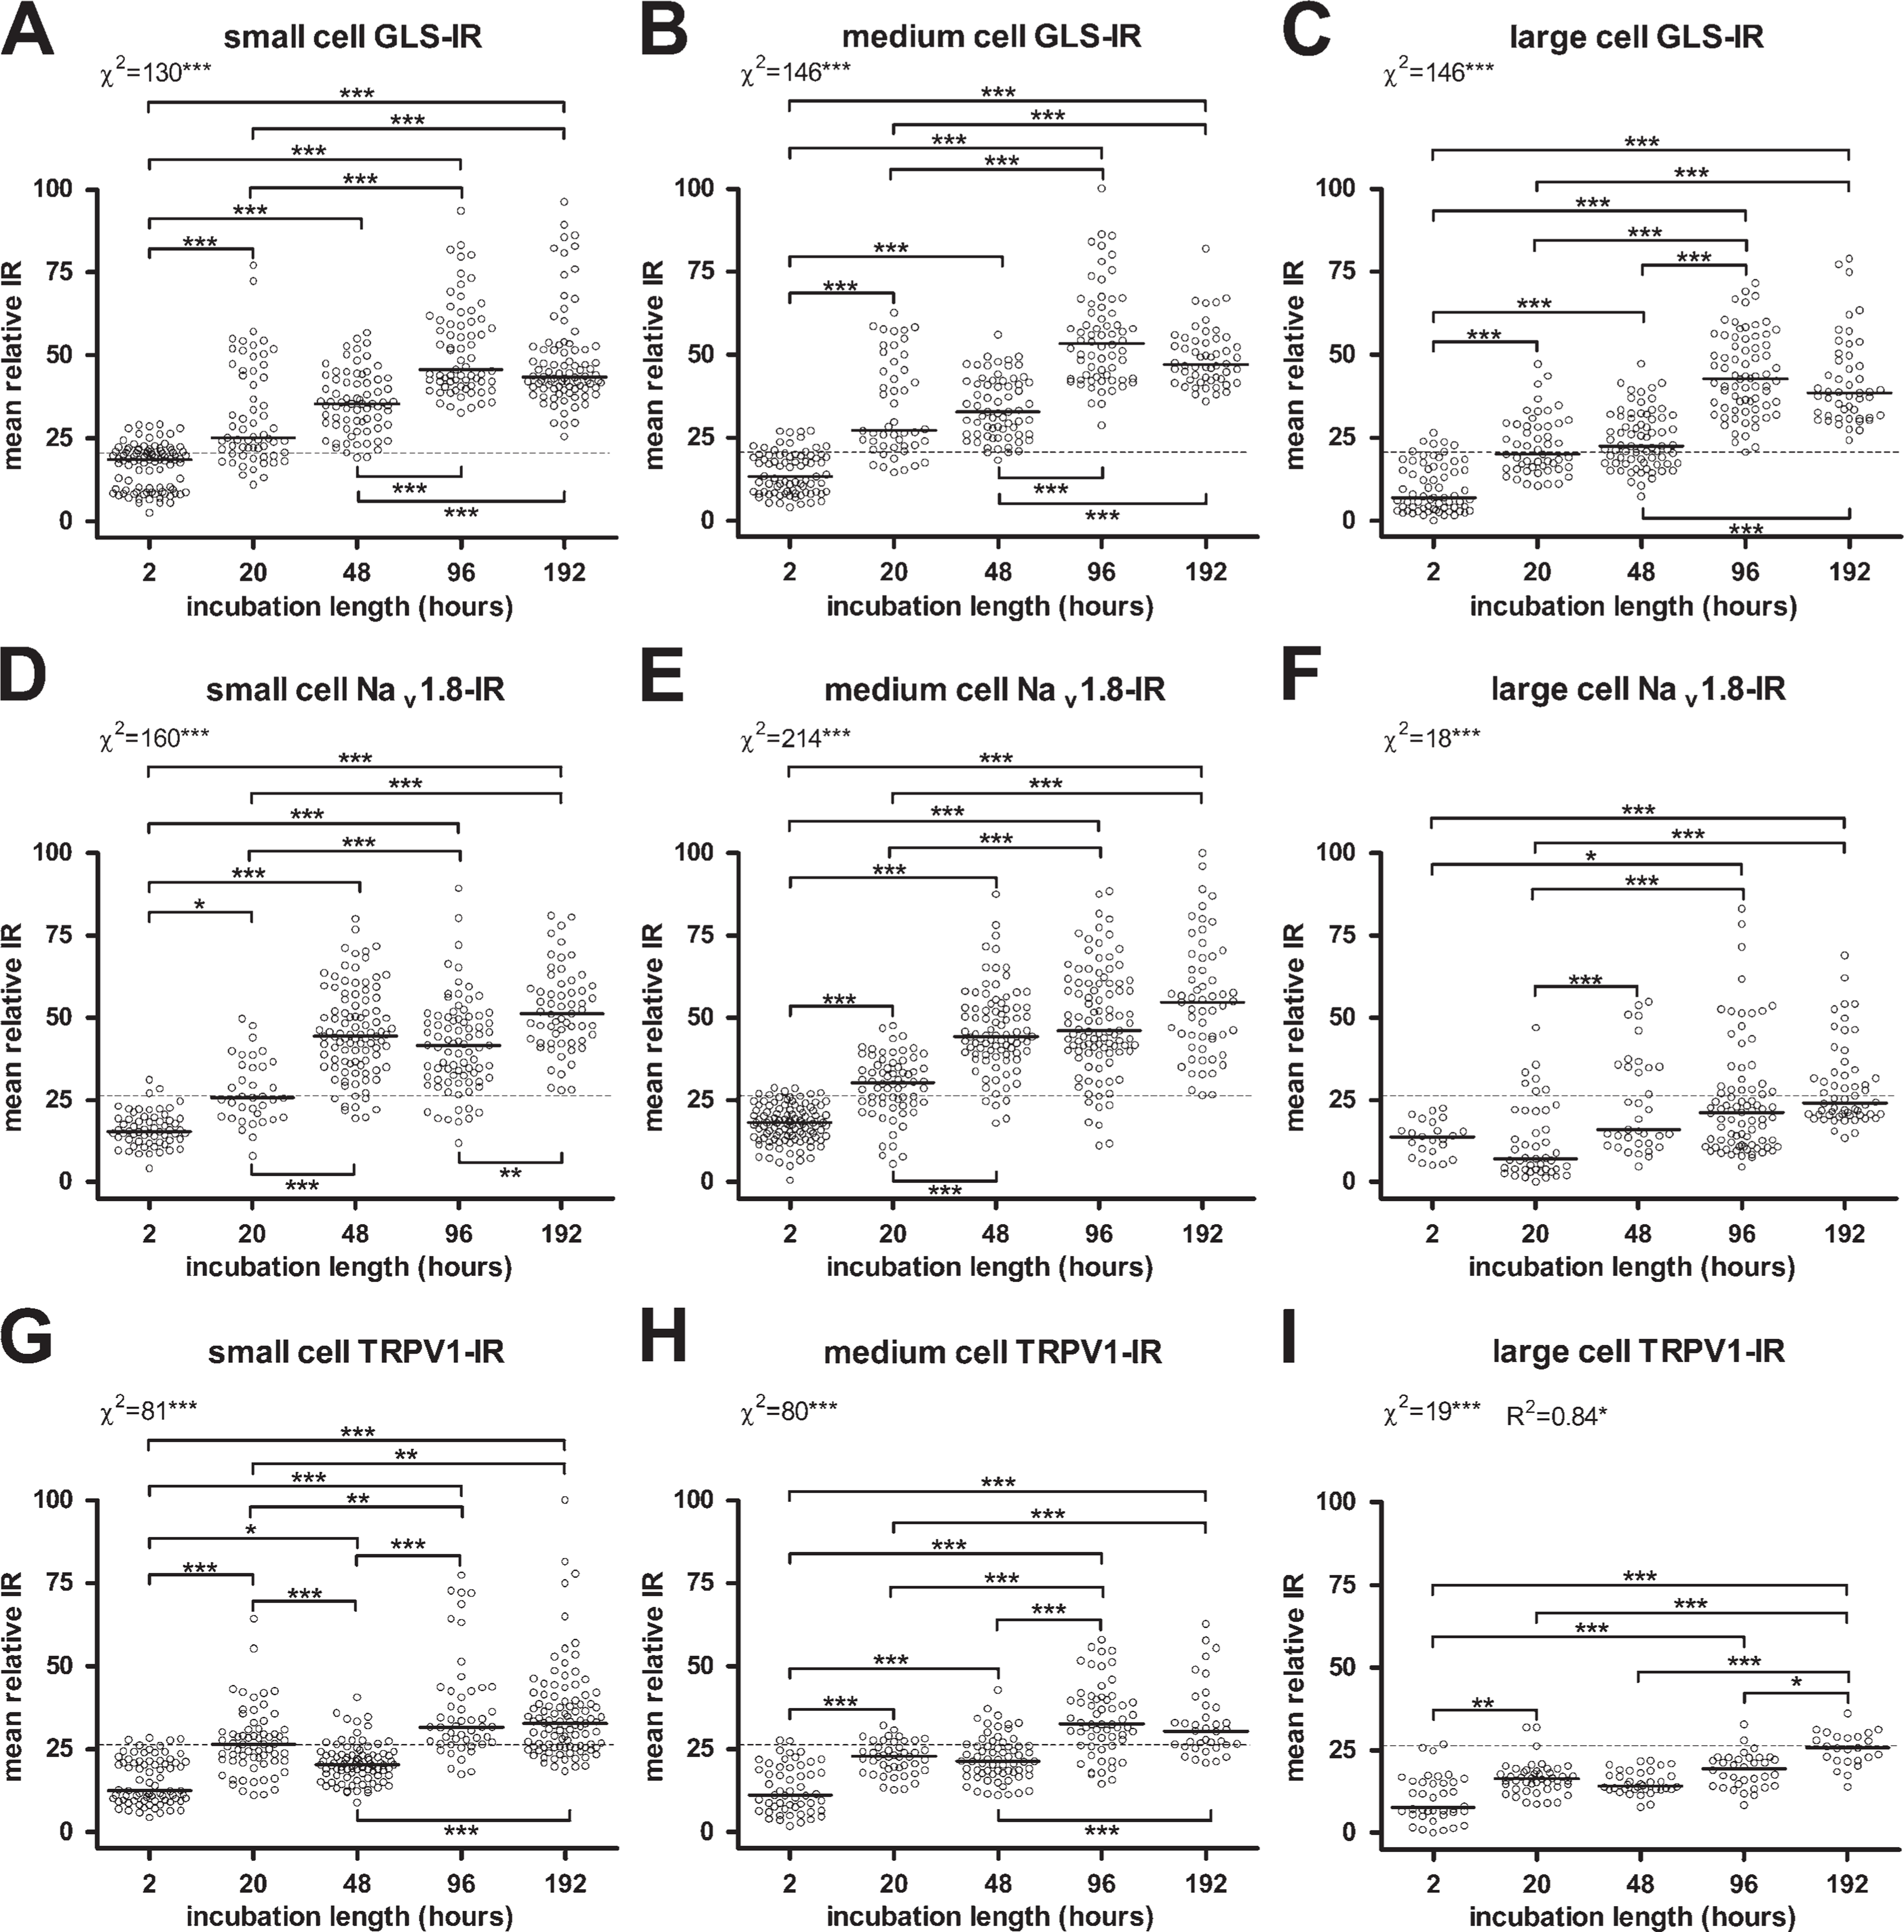
Effects of incubation length in primary antiserum on immunoreactivity. Increasing incubation time in primary antiserum significantly increased IR for GLS
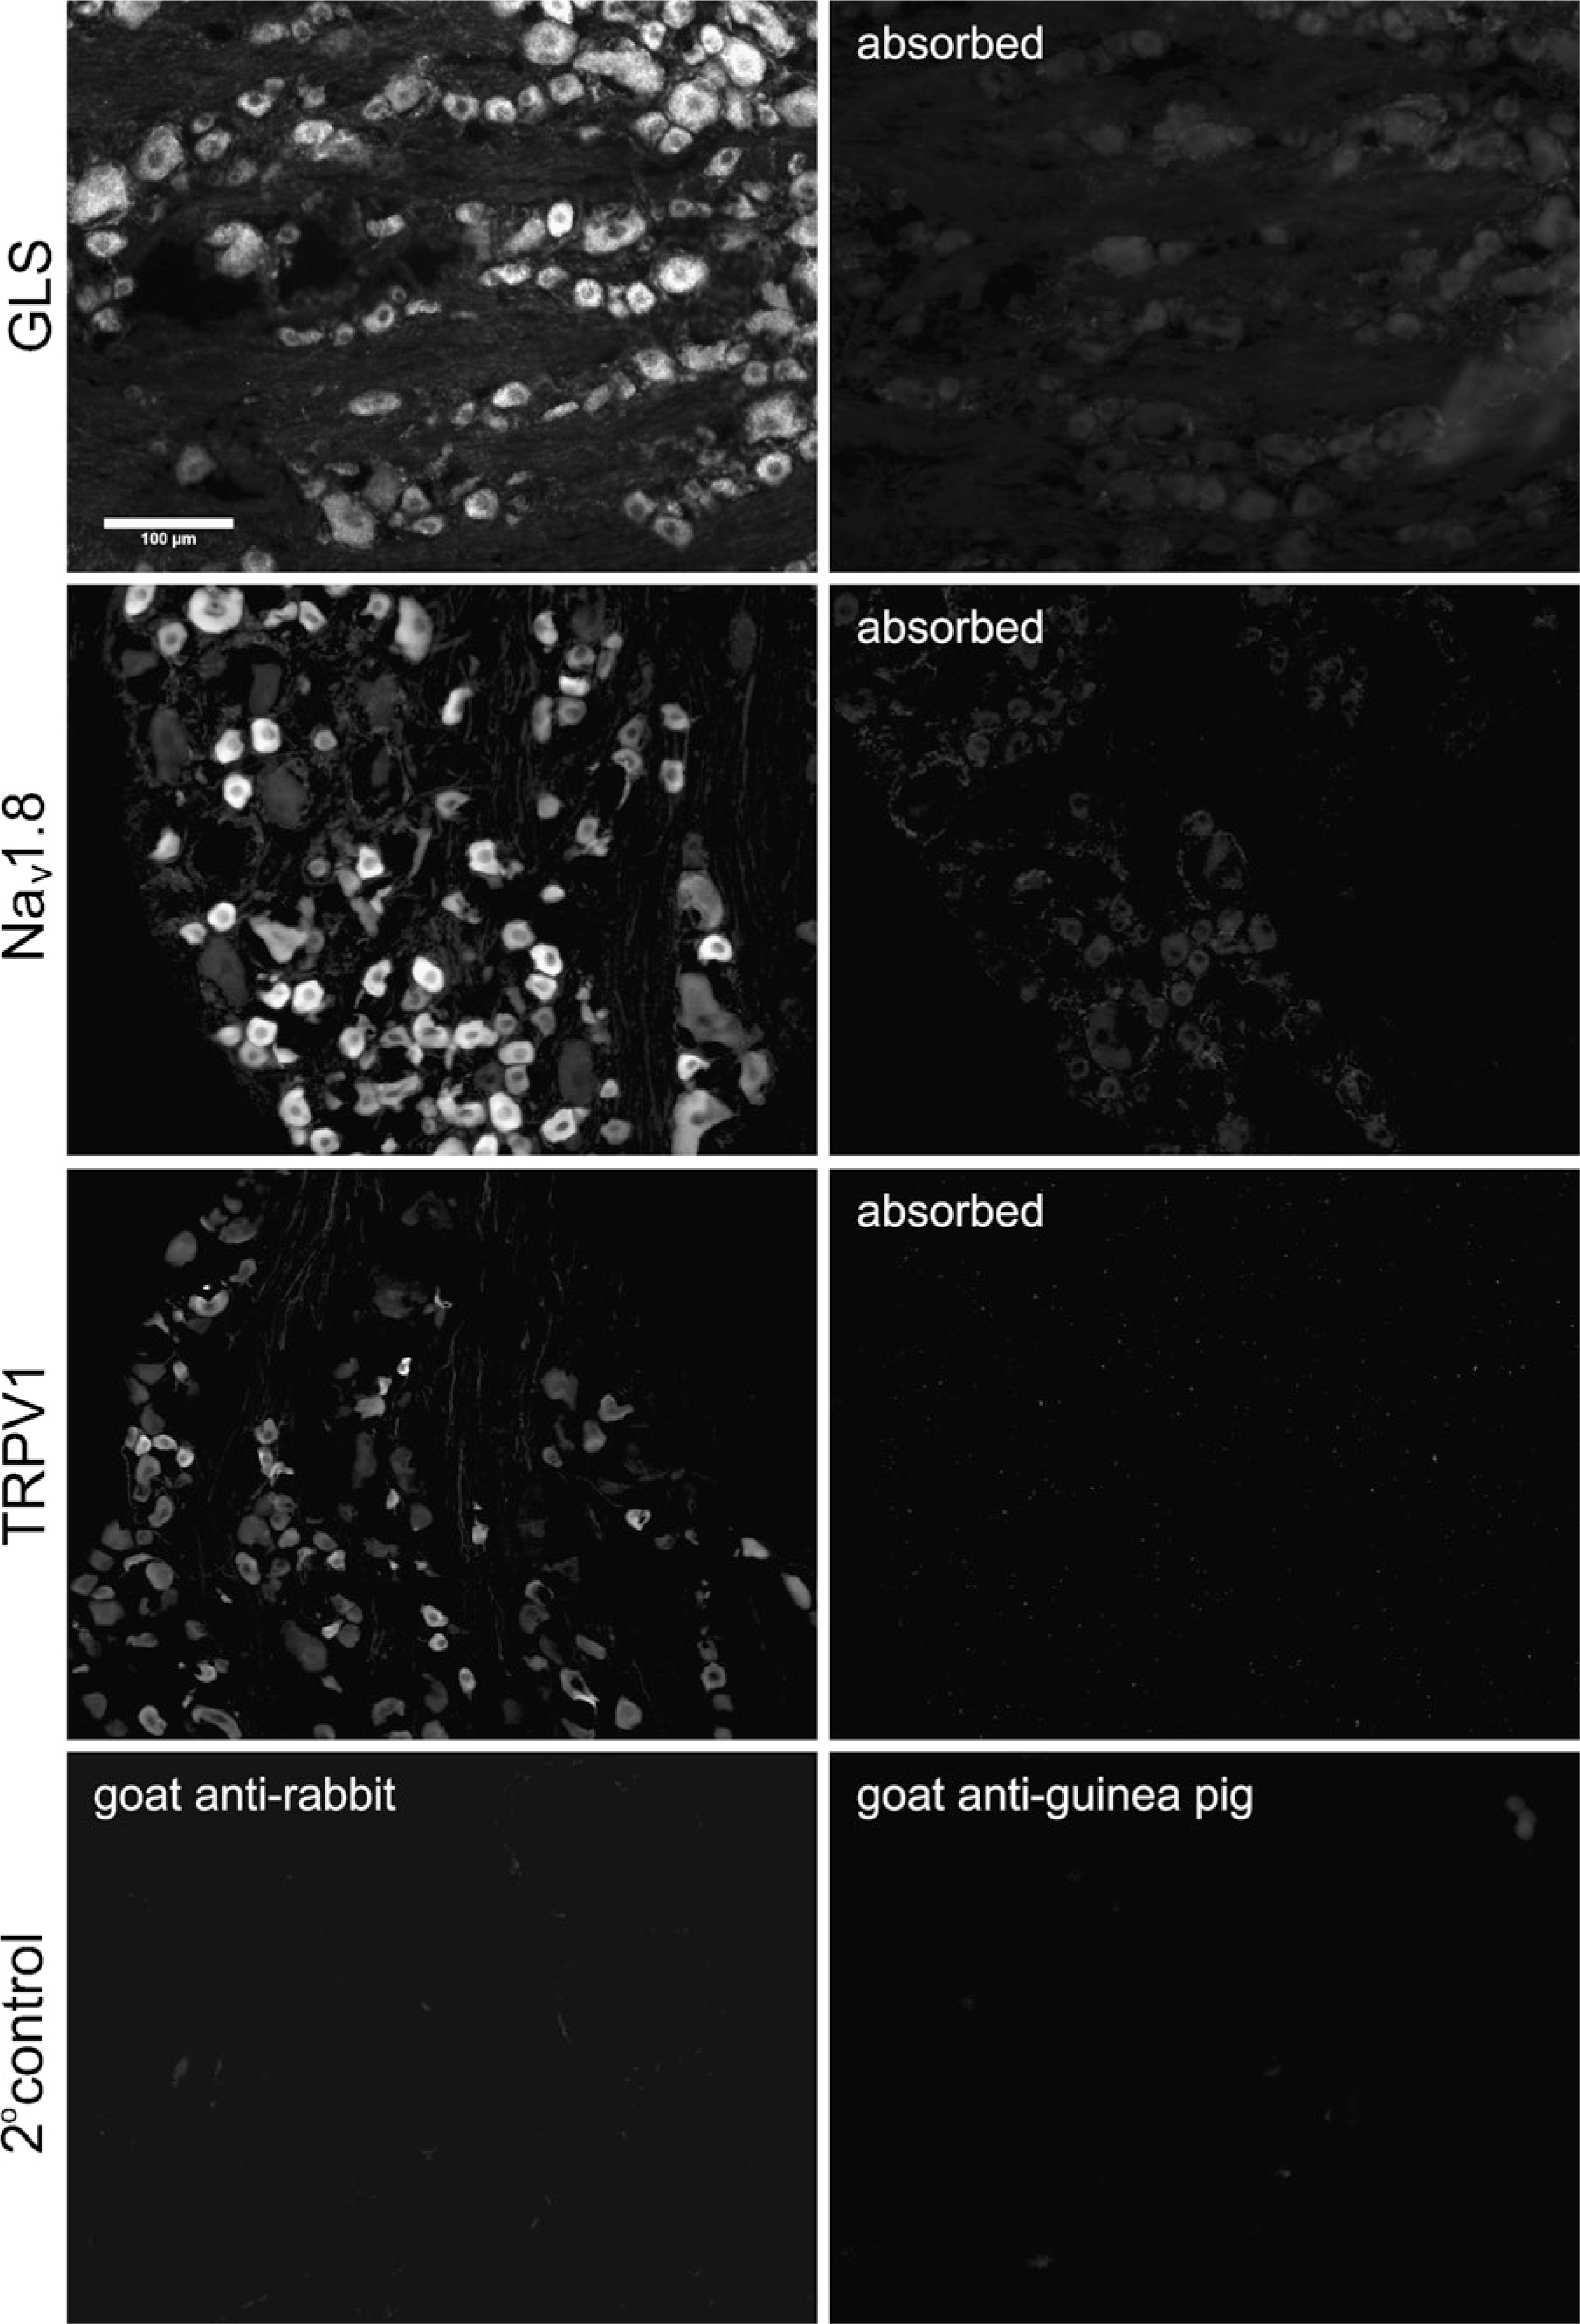
Control experiments for primary and secondary antisera. The optimal fixation conditions of low formaldehyde (0.25%) and high picric acid (0.8%) concentrations were used to fix the DRG. Diluted primary antisera were absorbed with antigen prior to routine processing (top three rows of panels). Sections were incubated in primary antiserum diluent only and then routinely processed with one of the two secondary antisera (bottom row of panels). Immunoreactivity for all three antigens was successfully absorbed (right column, top three rows), and the two secondary antisera produced minimal labeling (bottom row).
Estimating percentages of DRG neurons labeled for a specific antigen is typically performed by qualitatively scoring images to obtain counts of labeled and unlabeled neurons. The qualitative score is assigned based on the investigator's opinion of the staining intensity/quality relative to background IR levels. The simplest and closest way to quantitatively approximate this type of scoring is to set an intensity threshold above which neurons are considered labeled and below which they are considered unlabeled. The threshold must be set by the investigator in a manner similar to qualitative scoring by viewing many images from a data set and determining an intensity that best distinguishes labeled from unlabeled neurons. When such a practice was carried out for GLS IR in our formaldehyde comparison, we estimated that 38% of all neurons had GLS IR above the chosen threshold when we used 4% formaldehyde in the fixative (Figure 8A). When the same threshold was used, this estimate changed to 100% when 1% or less formaldehyde was used (Figure 8B). The quality of GLS IR (i.e., punctuate “mitochondrial” staining) indicated that the IR most likely was specific for GLS and, therefore, sensitivity was increasing as formaldehyde concentration decreased. Background fluorescence did not increase appreciably as less formaldehyde was used, indicating that a loss of specificity did not account for the higher estimates of GLS expression. Expression of GLS in all DRG neurons is consistent with the need of most, if not all, DRG neurons to have a means for synthesizing neurotransmitter glutamate at their central terminals (Skilling et al. 1988; De Biasi and Rustioni 1990; Zahn et al. 2002; Li et al. 2003b; Dmitrieva et al. 2004; Brumovsky et al. 2007). The higher GLS IR of small and medium DRG neurons (Figures 1A–1E) may correspond to the added ability of small-diameter nociceptive DRG neurons to release glutamate from their peripheral terminals (deGroot et al. 2000; Jin et al. 2006; Brumovsky et al. 2007).
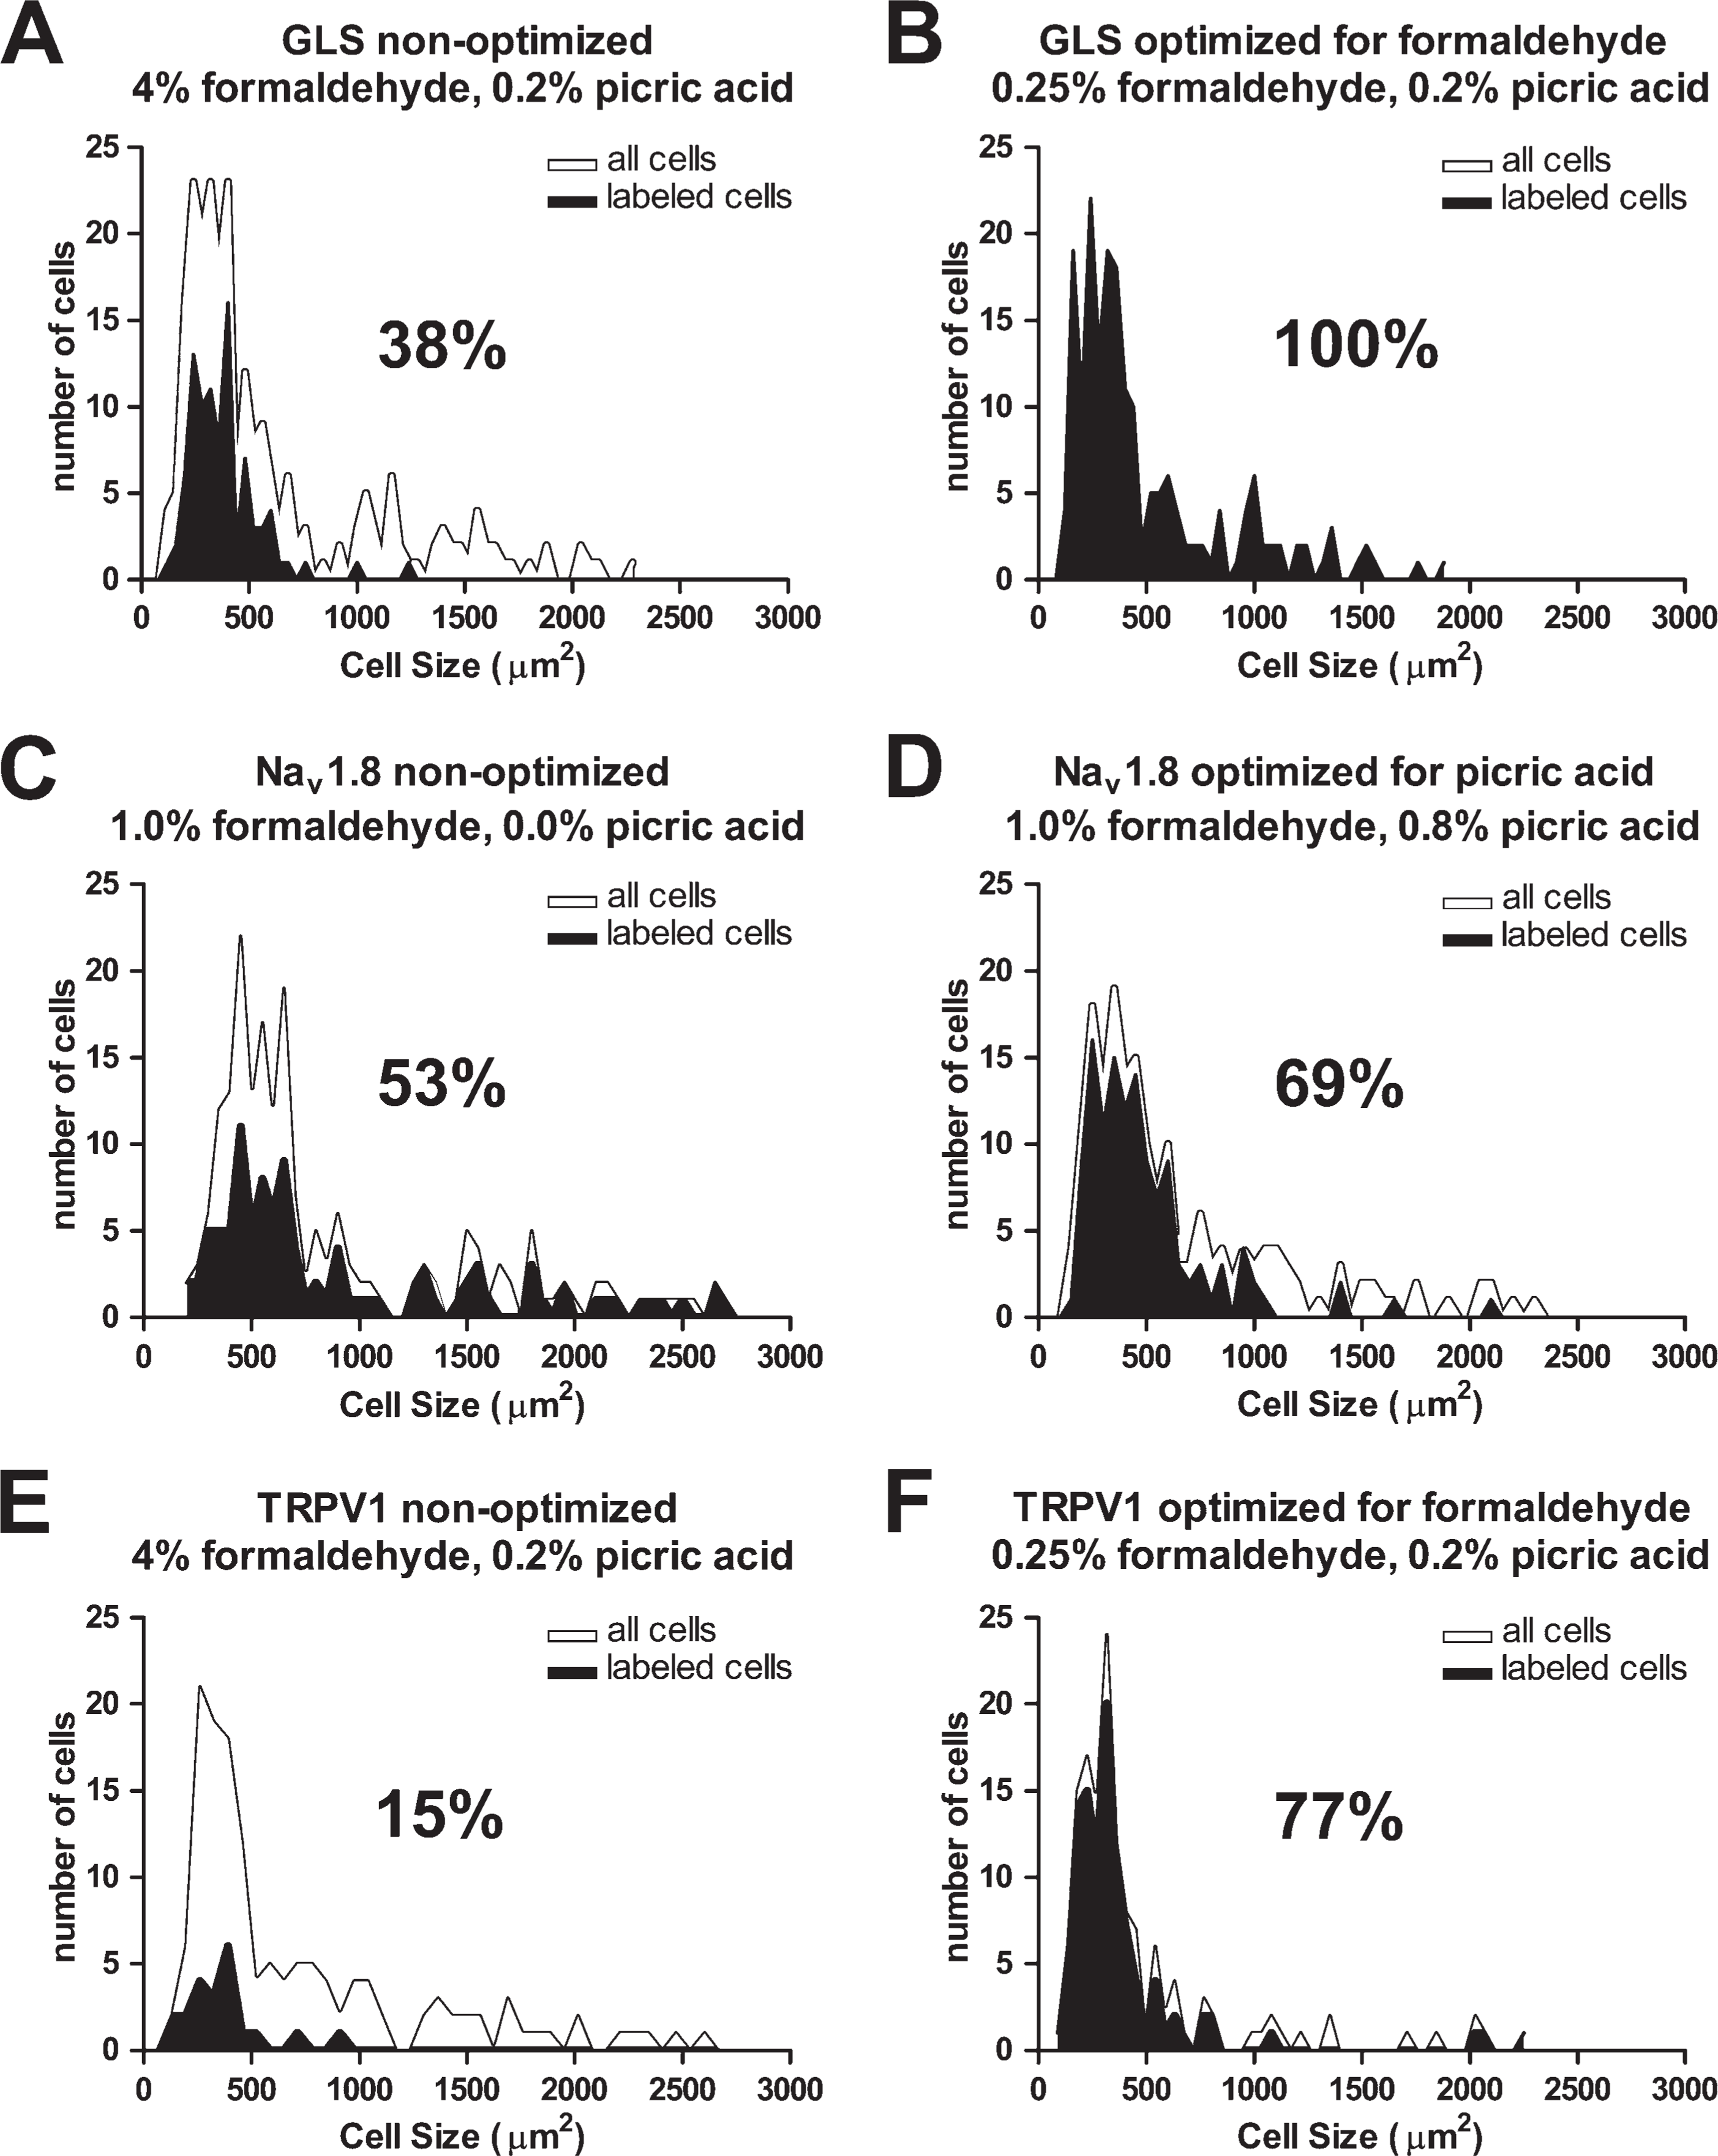
Optimization increases sensitivity of immunofluorescence detection for GLS, Nav 1.8, and TRPV1. Formaldehyde had a greater effect on GLS IR in rat DRG neurons than picric acid. When 4% formaldehyde is used, 38% of rat DRG neurons are labeled for GLS
Similar, albeit less pronounced, effects of fixative composition were seen for Nav 1.8 and TRPV1, confirming that the effect of fixation on IR is not specific to GLS. For Nav 1.8, however, picric acid had the largest effect on IR. As higher concentrations of picric acid were used in the fixative, Nav 1.8 IR increased in small and medium DRG neurons, which led to more small and medium neurons being considered as labeled for Nav 1.8 (Figures 3F–3J and 4D and 4E). Since small to medium DRG neurons express Nav 1.8 (Akopian et al. 1996; Sangameswaran et al. 1996; Djouhri et al. 2003), the effect of picric acid on Nav 1.8-IR was limited to these neurons. Interestingly, Nav 1.8 IR of large DRG neurons was lowered as picric acid concentration increased and resulted in fewer large neurons being considered labeled for Nav 1.8. Increasing the picric acid concentration had the net effect of increasing the signal-to-noise ratio for Nav 1.8 by decreasing nonspecific or background labeling with the polyclonal antiserum used in this study. The percentages of total DRG neurons labeling for Nav 1.8 were 53% and 69% using 0% and 0.8% picric acid, respectively (Figures 8C and 8D). According to another study using immunofluorescence that fixed with 4% formaldehyde and 0.0% picric acid, ×50% of adult rat DRG neurons express Nav 1.8 (Benn et al. 2001). Although there have been no studies of Nav 1.8 IR where 0.8% picric acid has been used to fix rat DRG, in situ hybridization for Nav 1.8 has shown that 66.5–68.9% of DRG neurons express Nav 1.8 mRNA (Fukuoka et al. 2008). Our results closely approximate those two estimates of Nav 1.8 expression in the rat DRG, indicating that the accuracy of Nav 1.8 detection can be improved by optimizing the fixation protocol.
TRPV1 IR was affected by both formaldehyde and picric acid concentration. Decreasing formaldehyde concentration and increasing picric concentration acid elevated TRPV1 IR to a greater degree in small and medium DRG neurons, which was expected since TRPV1 is expressed in small to medium DRG neurons (Guo et al. 1999; Price and Flores 2007). The effect of formaldehyde was greater than that of picric acid, but the effect of picric acid might have been greater if the formaldehyde concentration used for the picric acid comparison was lower than 1%. The percentages of DRG neurons labeling for TRPV1 were 15% and 77% using 4% and 0.25% formaldehyde, respectively (Figures 8E and 8F). Background IR levels were not appreciably different when we used different concentrations of formaldehyde and picric acid, suggesting that lowering formaldehyde or increasing picric acid would not result in a compromise of specificity. TRPV1 expression has been underestimated previously by using a high concentration (4%) of formaldehyde in the fixative in at least one study that reported 25% of primary sensory neurons with TRPV1 IR. The same study found that 65% of DRG neurons responded to the TRPV1 agonist capsaicin with calcium imaging, indicating that TRPV1 IR in 4% formaldehyde-fixed DRG may underestimate the actual percentage of neurons expressing TRPV1.
Since its accidental discovery as a fixative in the late nineteenth century (Blum 1893), formaldehyde has remained the most popular fixative used for both histopathology and basic science (Fox et al. 1985). It has long been recognized, however, that fixation with formaldehyde concentrations at 4% (w/v) [which is equal to 10% (v/v) formalin] is not optimal for preserving tissue antigenicity (Hopwood 2002). Our current understanding of the mechanism of formaldehyde fixation dates back to the 1940s, when it was shown that formaldehyde cross-links amino acid residues in proteins (Fraenkel-Conrat and Olcott 1948a, b; Fraenkel-Conrat and Mecham 1949). It is postulated that when amino acids are cross-linked with one another, antigens are “masked” and are unavailable for interaction with antibodies (Sompuram et al. 2004). Antigen retrieval techniques have been developed to “unmask” antigens after formaldehyde fixation and to reestablish immunolabeling (Shi et al. 1991). The success of such techniques is variable, and there is not a single technique that works for all antigen-antibody combinations (Shi et al. 2007). For clinical pathology laboratories, antigen retrieval is sometimes the only option, since 10% formalin is the standard fixative, and taking another sample for the purpose of fixing it differently is not always an option. Our results indicate a way to circumvent the need for antigen retrieval techniques by optimizing the formaldehyde concentration in the fixative to obtain maximal antigen detection sensitivity while maintaining adequate fixation by addition of another fixative component such as picric acid. Our results are more applicable to basic science research where greater control over fixation methods is possible. Fixative optimization could lead to more accurate determinations of antigen distribution, not just in rat DRG but in any tissue used for basic science research. Once the susceptibility of antigens processed routinely in pathology laboratories is known, it is possible that specific concentrations of formaldehyde may become standard for certain antigen-labeling protocols in the clinical setting as well. Many pathology specimens are also dehydrated in ethanol and embedded in paraffin wax, which may also contribute to poor antigenicity. However, basic research is not limited by the standard formalin-fixed paraffin-embedded protocol, and most research tissue can be fixed in any way and cut on a cryostat microtome to avoid paraffin embedding. We also showed that increasing the length of postfixation time in 1.0% (w/v) formaldehyde can decrease IR when postfixed for 20 hr. This effect on IR is greater when 4.0% formaldehyde is used for post-fixation (see supplemental data SD1).
In addition to fixation conditions, it is also necessary to optimize incubation time length in immunoreagents to obtain a clear picture of the distribution and relative amount of antigen in DRG neurons. The incubation time length comparison revealed increased IR with longer incubation periods for all three antigens tested. The presumed reason for a gradual increase in IR as incubation time length increased in this study is that polyclonal antisera were used. Each polyclonal antiserum has a heterogeneous mixture of antibodies, some of which may bind more slowly than others. Only the antibodies with the highest avidity for antigen will bind after short incubation periods. It should be expected that longer incubation lengths in polyclonal antisera will allow for lower avidity antibodies (which are no less specific) to bind antigen (Polak and Van Noorden 2003). However, there are nonspecific antibodies within polyclonal antisera that also start to bind as incubation length increases. We observed increases in nonspecific background labeling for all three anti-sera used with longer incubations (Figure 5). An optimal length should be selected where maximal specific labeling is reached but nonspecific background labeling is not yet prominent.
In this study, we showed that the sensitivity of immunofluorescence techniques can be affected by fixative composition and incubation time length in primary antibody. We used image analysis to objectively measure IR for GLS, Nav 1.8, and TRPV1. Decreasing the formaldehyde concentration in the fixative from the commonly used concentration of 4% (w/v) led to substantial increases in IR for GLS and TRPV1, whereas raising the concentration of picric acid elevated IR for Nav 1.8. Determining the distribution of antigens in the DRG is very important for studying populations or subpopulations of DRG neurons. Antigen distribution is often determined by the intensity of staining; therefore, increasing the sensitivity of immunofluorescence techniques may allow for other markers of DRG neuron subpopulations to be more accurately characterized.
References
Supplementary Material
Please find the following supplemental material available below.
For Open Access articles published under a Creative Commons License, all supplemental material carries the same license as the article it is associated with.
For non-Open Access articles published, all supplemental material carries a non-exclusive license, and permission requests for re-use of supplemental material or any part of supplemental material shall be sent directly to the copyright owner as specified in the copyright notice associated with the article.