
Abstract
The thymidine salvage pathway enzymes thymidine kinase 1 (TK1) and thymidine phosphorylase (TP) compete for thymidine as a substrate and catalyze opposing synthetic and catabolic reactions that have been implicated in the control of proliferation and angiogenesis, respectively. We investigated the relationship between the expression of TK1 and TP as they relate to proliferation (Ki-67 labeling index) and angiogenesis (Chalkley count of CD31-stained blood vessels) in a series of 110 non-small-cell lung cancer (NSCLC) tumors from patients prospectively enrolled in an imaging trial. TK1 and TP exhibited similar patterns of immunohistochemical distribution, in that each was found in both the nucleus and the cytoplasm of tumor cells. Each enzyme exhibited a significant positive correlation between its levels of nuclear and cytoplasmic expression. A significant positive correlation between TK1 expression and the Ki-67 labeling index (r = 0.53, p<0.001) was observed. TP was significantly positively correlated with Chalkley scoring of CD31 staining in high vs low Chalkley scoring samples (mean TP staining of 115.8 vs 79.9 scoring units, p<0.001), respectively. We did not observe a substantial inverse correlation between the TP and TK1 expression levels in the nuclear compartment (r = −0.17, p=0.08). Tumor size was not found to be associated with TK1, TP, Ki-67, or Chalkley score. These findings provide additional evidence for the role of thymidine metabolism in the complex interaction of proliferation and angiogenesis in NSCLC.
T
Several lines of evidence suggest that thymidine occupies a central position in determining the relationship between proliferation and angiogenesis (Figure 1). Thymidine undergoes a series of phosphorylations to form thymidine triphosphate (dTTP), one of the four basic building blocks of DNA synthesis, whereas its catabolic metabolite is the immediate precursor to 2-deoxyribose (2-dR), a potent angiogenic stimulus (Haraguchi et al. 1994; Brown and Bicknell 1998; Uchimiya et al. 2002; Hotchkiss et al. 2003).
The enzymes controlling thymidine and thymidylate [or thymidine monophosphate (dTMP)] synthesis and catabolism are elevated in hematologic malignancies (Vertongen et al. 1984; Shiotani et al. 1989a,b), as well as in several solid tumors, relative to surrounding non-malignant tissue. Tumor-specific elevation of the expression of cytosolic thymidine kinase 1 (TK1), a key enzyme of the thymidine salvage pathway, has been documented in a variety of cancers including non-small-cell lung cancer (NSCLC) (Yusa et al. 1988; Maehara et al. 1990). TK1 catalyzes the critical initial phosphorylation of thymidine to thymidylate, providing the substrate for subsequent phosphorylations to provide dTTP for DNA synthesis and repair. Increased TK1 expression is often associated with increased expression of cell proliferation markers such as the Ki-67 antigen and proliferating cell nuclear antigen (Wu et al. 2000; Mao et al. 2002; Oudard et al. 2002).
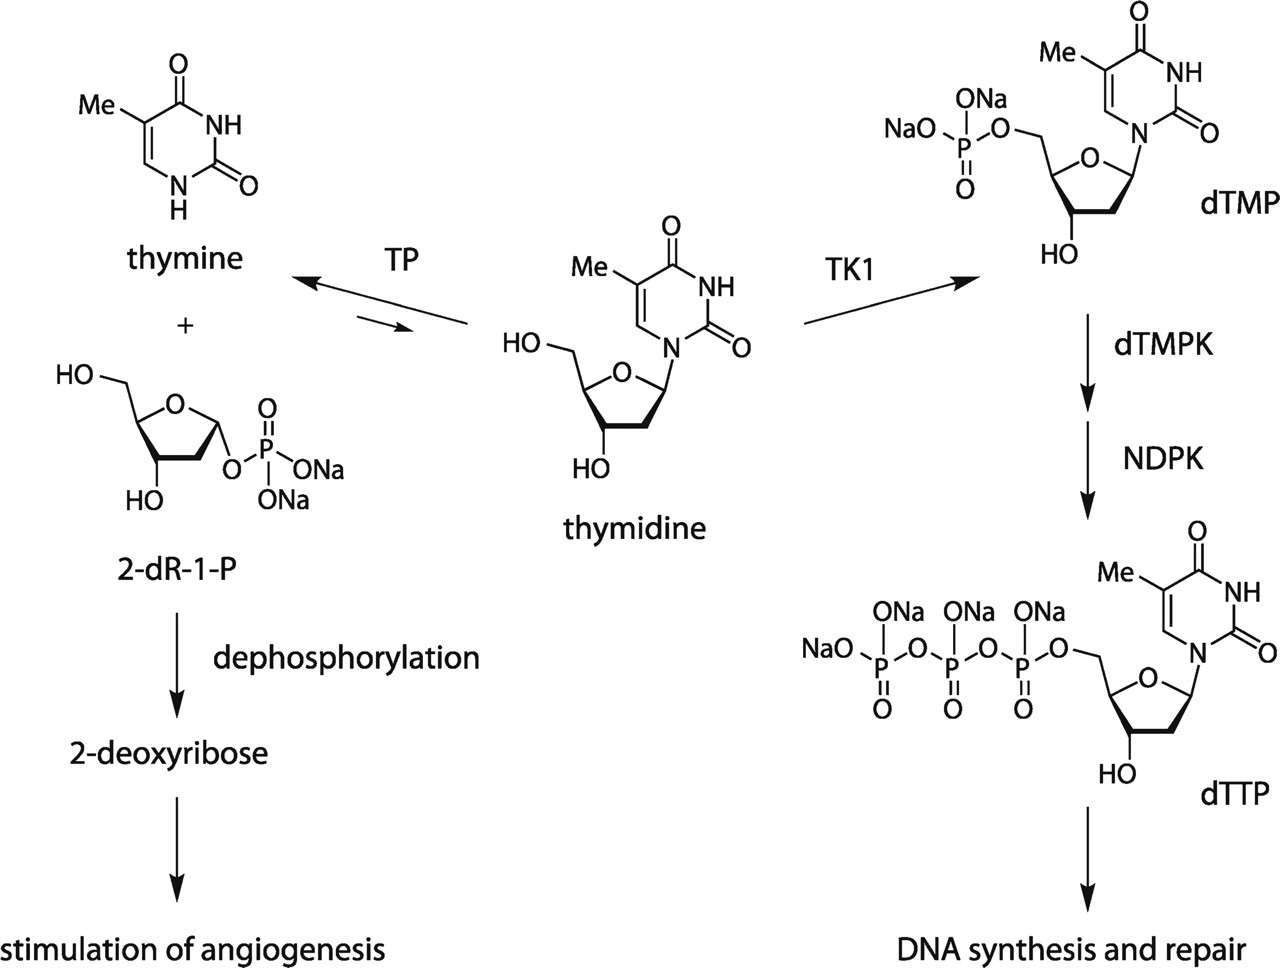
Thymidine plays a central role in both proliferation and angio-genesis. TP, thymidine phosphorylase; TK1, thymidine kinase 1; dTMPK, thymidine monophosphate kinase; NDPK, nucleotide diphsophate kinase; dTTP, thymidine triphosphate; dTMP, thymidine monophosphate (thymidylate); 2-dR-1-P, 2-deoxyribose-1-phosphate. Unequal reversible reaction arrows indicate that thymidine catabolism is usually the energetically preferred direction of bidirectional TP catalysis.
Another thymidine salvage pathway enzyme, thymidine phosphorylase (TP, also known as platelet-derived endothelial cell growth factor), catalyzes the reversible catabolism of thymidine to form thymine and 2-deoxyribose-1-phosphate (2-dR-1-P), which undergoes rapid dephosphorylation (de Bruin et al. 2003) to form 2-dR, a potent angiogenic and anti-apoptotic chemical signal (Haraguchi et al. 1994; Brown and Bicknell 1998; Ikeda et al. 2002, 2006; Uchimiya et al. 2002; Hotchkiss et al. 2003). TP expression has also been shown to be elevated in a variety of tumors, relative to adjacent non-tumorous tissue (Moghaddam et al. 1995; O'Brien et al. 1995, 1996; Takebayashi et al. 1996a,b; Ikeguchi et al. 1999; Koide et al. 1999; Hirano et al. 2003; Morita et al. 2003; Passantino et al. 2005; Miyake et al. 2007), including NSCLC (Takebayashi et al. 1996a; Koukourakis et al. 1997, 1998; Volm et al. 1998; Aikawa et al. 1999; O'Byrne et al. 2000; Sato et al. 2003; Chujo et al. 2006), and is associated with increased microvessel density (MVD) in several tumor types (Matsuura et al. 1999; Giatromanolaki et al. 2002; Li et al. 2005; Yasuno et al. 2005).
The fact that proliferation-associated TK1 and angiogenesis-associated TP compete for the substrate thymidine and catalyze opposing reactions (synthesis vs catabolism) of the thymidine salvage pathway suggests that thymidine may occupy a central position in determining the relationship between proliferation and angiogenesis (Liekens et al. 2007). Although many studies have examined TK1 and TP expression or their enzyme activities in individual tumor samples in parallel, very few have looked for evidence of their coordinated regulation by testing for an association between their expressions (Fujiwaki et al. 2001).
The pro-angiogenic actions of TP, coupled with reports of the prognostic value of tumor TP levels in cancer patients, indicate that obtaining non-invasive, repeatable, quantitative measures of TP in human tumors would be useful in several ways, including identifying patients who may have a poorer prognosis, and assessing angiogenesis-related tumor growth potential, which may predict response to anti-angiogenic agents (Klecker and Collins 2001). Positron emission tomography (PET) is already ideally suited for quantitative and non-invasive measures of tumor proliferation using the specific tracer of cellular TK1 activity, 3'-deoxy-3'-[F-18]flourothymidine (Shields et al. 1998; Grierson and Shields 2000; Rasey et al. 2002; Vesselle et al. 2002). A PET radiotracer to quantify tumor TP levels will offer a novel tool for examining other essential features of tumor biology and would complement our ability to non-invasively assess tumor prognosis, angiogenesis, and response to certain chemotherapies. We previously developed the PET tracer 5'-deoxy-5'-[F-18]fluorothymidine as a potential marker of TP activity. However, uptake studies in cultured lung cancer cells revealed that this tracer was rapidly metabolized and leaked from cells into the medium (Grierson et al. 2007). Future efforts to develop and validate a PET radiotracer to image TP activity in human cancer patients will require a solid understanding of TP expression and its relation to tumor proliferation.
In a series of prospectively accrued and treated NSCLC patients undergoing primary surgical resection without neo-adjuvant or adjuvant treatment, we used immunohistochemical (IHC) methods to study the relationship between TK1 and TP expression. We used as correlates the Ki-67 score as an overall measure of tumor proliferation, and a Chalkley score of CD31 staining as an end-point measure of angiogenesis for these tumors.
Materials and Methods
Patient Population and Tumor Type
All subjects in the present IHC study are a subset of patients from a larger prospective study of fluorodeoxy-glucose PET imaging in NSCLC conducted under the approval of the University of Washington Human Subjects Division. Informed consent was obtained according to procedures approved by the Human Subjects Committee of the University of Washington. Two hundred and eight potentially resectable NSCLC patients were enrolled into the imaging trial, the results of which have been recently reported (Vesselle et al. 2007), and their management followed the standard NSCLC care algorithm previously described (Vesselle et al. 2004). In 110 of the 208 subjects, a primary tumor block was available for IHC analysis.
Immunohistochemistry
Four-micron sections of formalin-fixed, paraffin-embedded tissue were cut and placed on Superfrost Plus microscope slides (Fisher Scientific; Pittsburgh, PA). The tissue sections were deparaffinized and rehydrated through graded alcohols. Antigen retrieval was carried out with Tris/EDTA, pH 9.0, buffer in a tabletop autoclave. Endogenous peroxidase activity was blocked with 3% H2O2. In preliminary tests, each primary antibody was titered across a range of dilutions to determine the optimal concentration that produced strong specific staining with no background. The clone designation, vendor, dilution, and target protein specificity citation for the antibodies used are as follows: CD31 [JC70A; DAKO Corporation, Carpintera, CA, at 1:500 (Parums et al. 1990)]; Ki-67 [MIB-1; DAKO Corporation, at 1:500 (Key et al. 1993)]; TK1 [3B3.E11; QED Biosciences, Inc., San Diego, CA, at 1:500 (Tu et al. 2006) and http://www.abcam.com/index.html?pageconfig=reviews & intAbreviewID=11846&intAbID=988]; and TP [PGF.44C; Lab Vision Corporation, Fremont, CA, at 1:4000 (Fox et al. 1995b)]. The appropriate antibody was applied to each slide. The slides were washed and ImmPRESS (Vector Laboratories; Burlingame, CA), an anti-mouse IgG polymerized reporter enzyme, was applied to each tissue. Color development was accomplished by incubation in diaminobenzidine (DAKO Corporation). The slides were counterstained in hematoxylin (DAKO Corporation), dehydrated through graded alcohols, cleared in xylene, and coverslipped with permanent mounting media. A slide lacking the addition of the primary antibody was used as a negative control. For each of the four antibodies used in this study, these control slides demonstrated a complete absence of peroxidase staining (data not shown). Each stained slide was read independently by two experienced investigators (JKM, JSB). In the event of a discrepancy in scoring, both investigators examined the slide simultaneously on a dual-head teaching microscope and arrived at a consensus score.
Assessment of TK1 and TP Expression. Preliminary examination of TK1 and TP staining revealed a marked heterogeneity within sections, which has been widely reported for many immunohistochemical markers in NSCLC (Gatter et al. 1985; Dunnill and Gatter 1986) and which invalidates assessment of expression using a simple intensity score for each slide. For this reason, TK1 expression and TP expression were assessed using a graded semi-quantitative scoring method. Staining intensity was scored as 0, 1+, 2+, or 3+. For each of these four staining intensity scores, the percentage of cells staining at that respective intensity score was determined and multiplied by the intensity score to yield an intensity percentage score. The final TK1 and TP staining scores used in analyses were calculated from the sum of the four intensity percentage scores. Thus, the staining score had a minimum value of 0 (no staining) and a maximum of 300 (100% of cells with 3+ staining intensity). TK1 expression and TP expression were evaluated in both the nucleus and the cytoplasm of the tumor cells and were designated as TK1nuc or TPnuc and TK1cyt or TPcyt, respectively (Table 1). Because of the potential for the signal from one cellular compartment to influence the scoring of the other compartment (e.g., cytoplasmic staining influencing the scoring of the nuclear staining), a subgroup of slides was scored again to determine whether bias was present. In a subset of 30 cases, cytoplasmic or nuclear staining was re-read independently and compared with the scores initially obtained. We observed a strong correlation in staining scores in the original and re-read samples (r = 0.96 for TPnuc, r = 0.83 for TPcyt).
Mean immunohistochemical scores
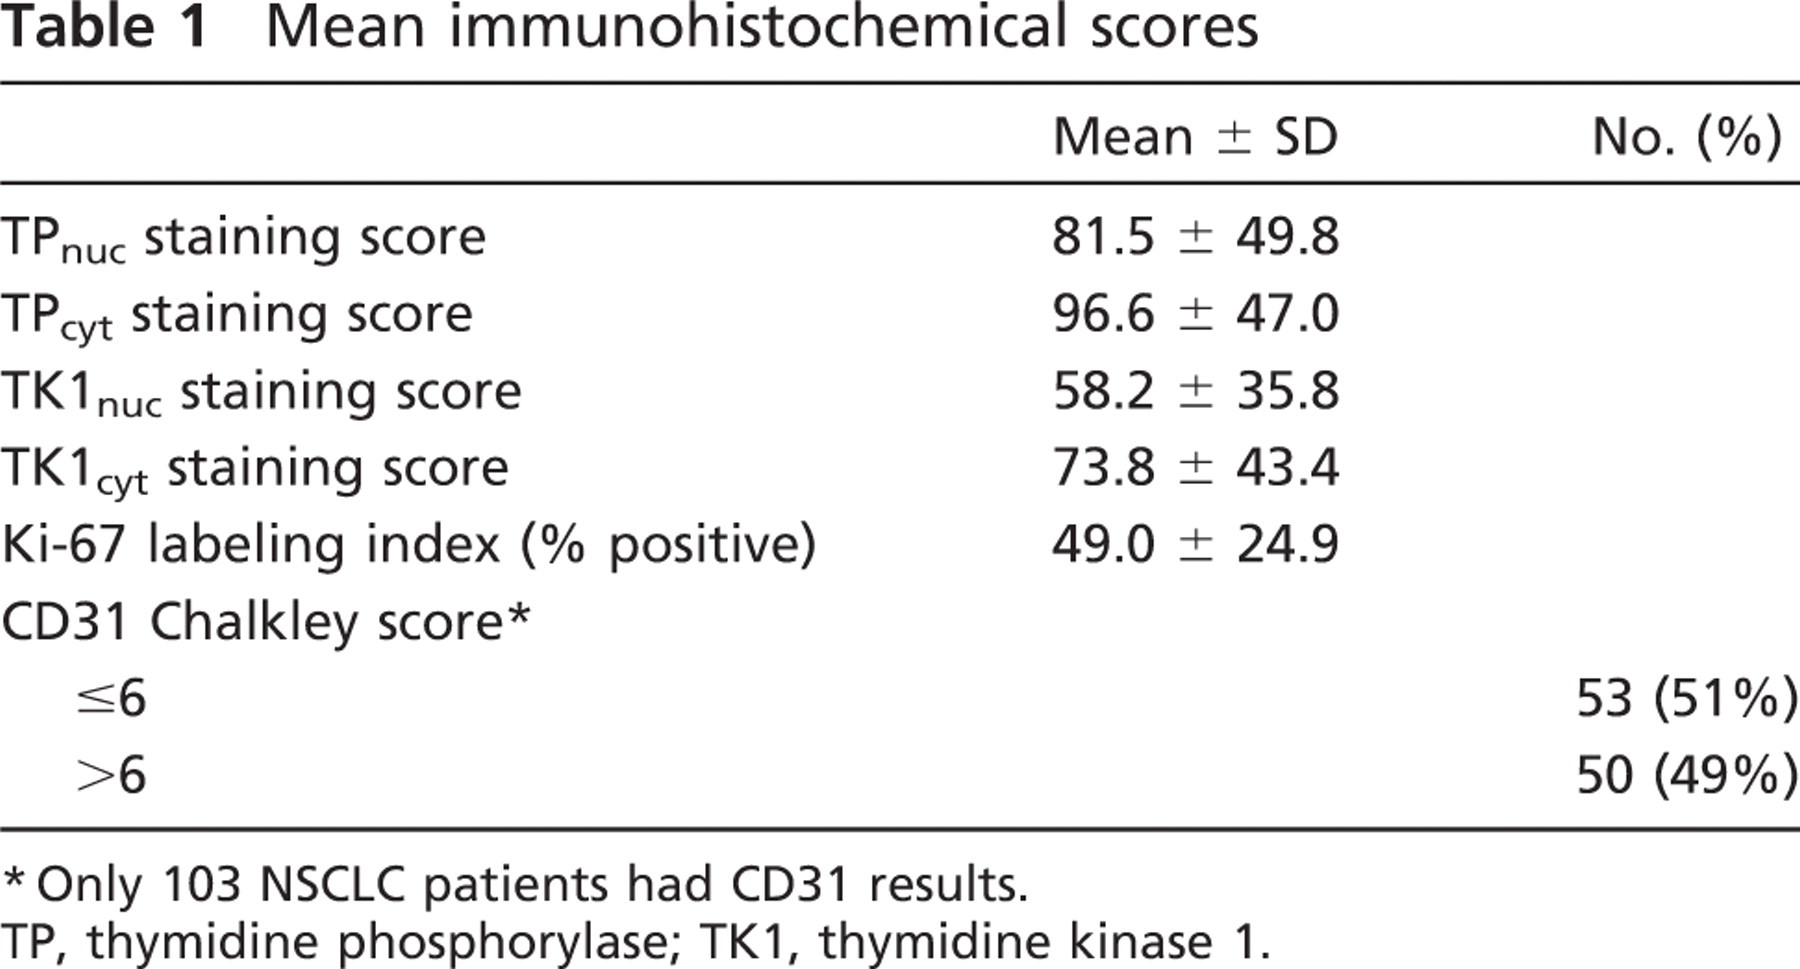
∗Only 103 NSCLC patients had CD31 results.
TP, thymidine phosphorylase; TK1, thymidine kinase 1.
Chalkley Scoring of CD 31 Staining. Angiogenesis was assessed by the Chalkley counting method for determining the MVD index as described by Fox with some modifications (Fox et al. 1994, 1995a). The Chalkley count is a measure of the relative area occupied by the stained blood vessels as opposed to the density of vessels within a high-power field (i.e., MVD). Tumors were scanned under low power (10×) to determine the three areas with the highest vascularity (“hotspots”). Areas of adjacent normal lung tissue, and areas of necrosis or sclerosis, were not included. The Chalkley graticule (Chalkley 1943) is a disk imprinted with 25 randomly placed dots. Under high power (200×), the Chalkley graticule was rotated and oriented so that the maximum number of dots contacted the CD31-positive blood vessels. Any stained single endothelial cell or endothelial cell cluster with or without a vessel lumen was counted. The Chalkley score was determined as the mean of the three counts (Table 1). For the purpose of analyses, the Chalkley score was dichotomized into two levels, low and high, which correspond to values below and above the median Chalkley score of 6.
Ki-67 Labeling Index Determination. The Ki-67 labeling index was determined by estimating the percentage of tumor cells stained with the MIB-1 antibody (Table 1).
Statistical Analysis
Because the staining markers were not necessarily normally distributed, or were ordinal in nature, non-parametric Spearman's rank correlation coefficients were used to determine the degree of correlation between measurements of staining markers (TP, TK1, Ki-67, and CD31). Similarly, non-parametric Wilcoxon rank-sum tests were used to assess differences in levels of staining markers between groups, and paired Wilcoxon signed-rank tests were utilized to compare levels of staining markers within individuals. A two-sided 0.05 test level determined statistical significance for all analyses. All analyses were conducted using SAS version 9.1 (SAS Institute, Inc.; Cary, NC).
Results
The baseline characteristics of the study subjects are summarized in Table 2. The mean age of the 110 NSCLC cases was 65 years, approximately one third were female (37%), and most were caucasian (89%). All but four patients reported a history of smoking, with 72% reporting at least 40 pack-years of smoking at the time of enrollment in the imaging trial. The majority of these NSCLC cases had surgical stage I (58%) or II (25%) disease, and more than half (60%) had tumors <3 cm in size. By histology, 40% of tumors were adenocarcinomas, 35% were squamous cell carcinomas, 14% were large-cell carcinomas, 5% were bronchoalveolar carcinomas, and the remaining 6% were of mixed or unspecified histology. Greater than half (57%) of the tumors were poorly differentiated.
Nuclear TP vs Cytoplasmic TP
Figure 2 illustrates the well-known heterogeneous nature of NSCLC tumors, both with regard to the staining of specific markers as well as overall morphology (Gatter et al. 1985; Dunnill and Gatter 1986). TP expression was evaluated in both the nuclear and cytoplasmic compartments of the tumor cells (Figures 2 and 3) to determine whether there were any differences in expression between the two compartments. TP was localized in both the nuclear and cytoplasmic compartments of the tumor cells. The TPcyt staining score was, on average, significantly greater than the TPnuc staining score (p<0.001, paired Wilcoxon signed-rank test) and was closely correlated with the TPnuc staining score (r = 0.85, p<0.001, Spearman's correlation coefficient). Within each histological subtype (adenocarcinoma vs squamous cell carcinoma), similar results were observed when comparing TPcyt and TPnuc staining scores (data not shown).
Baseline demographic and tumor characteristics of 110 NSCLC patients
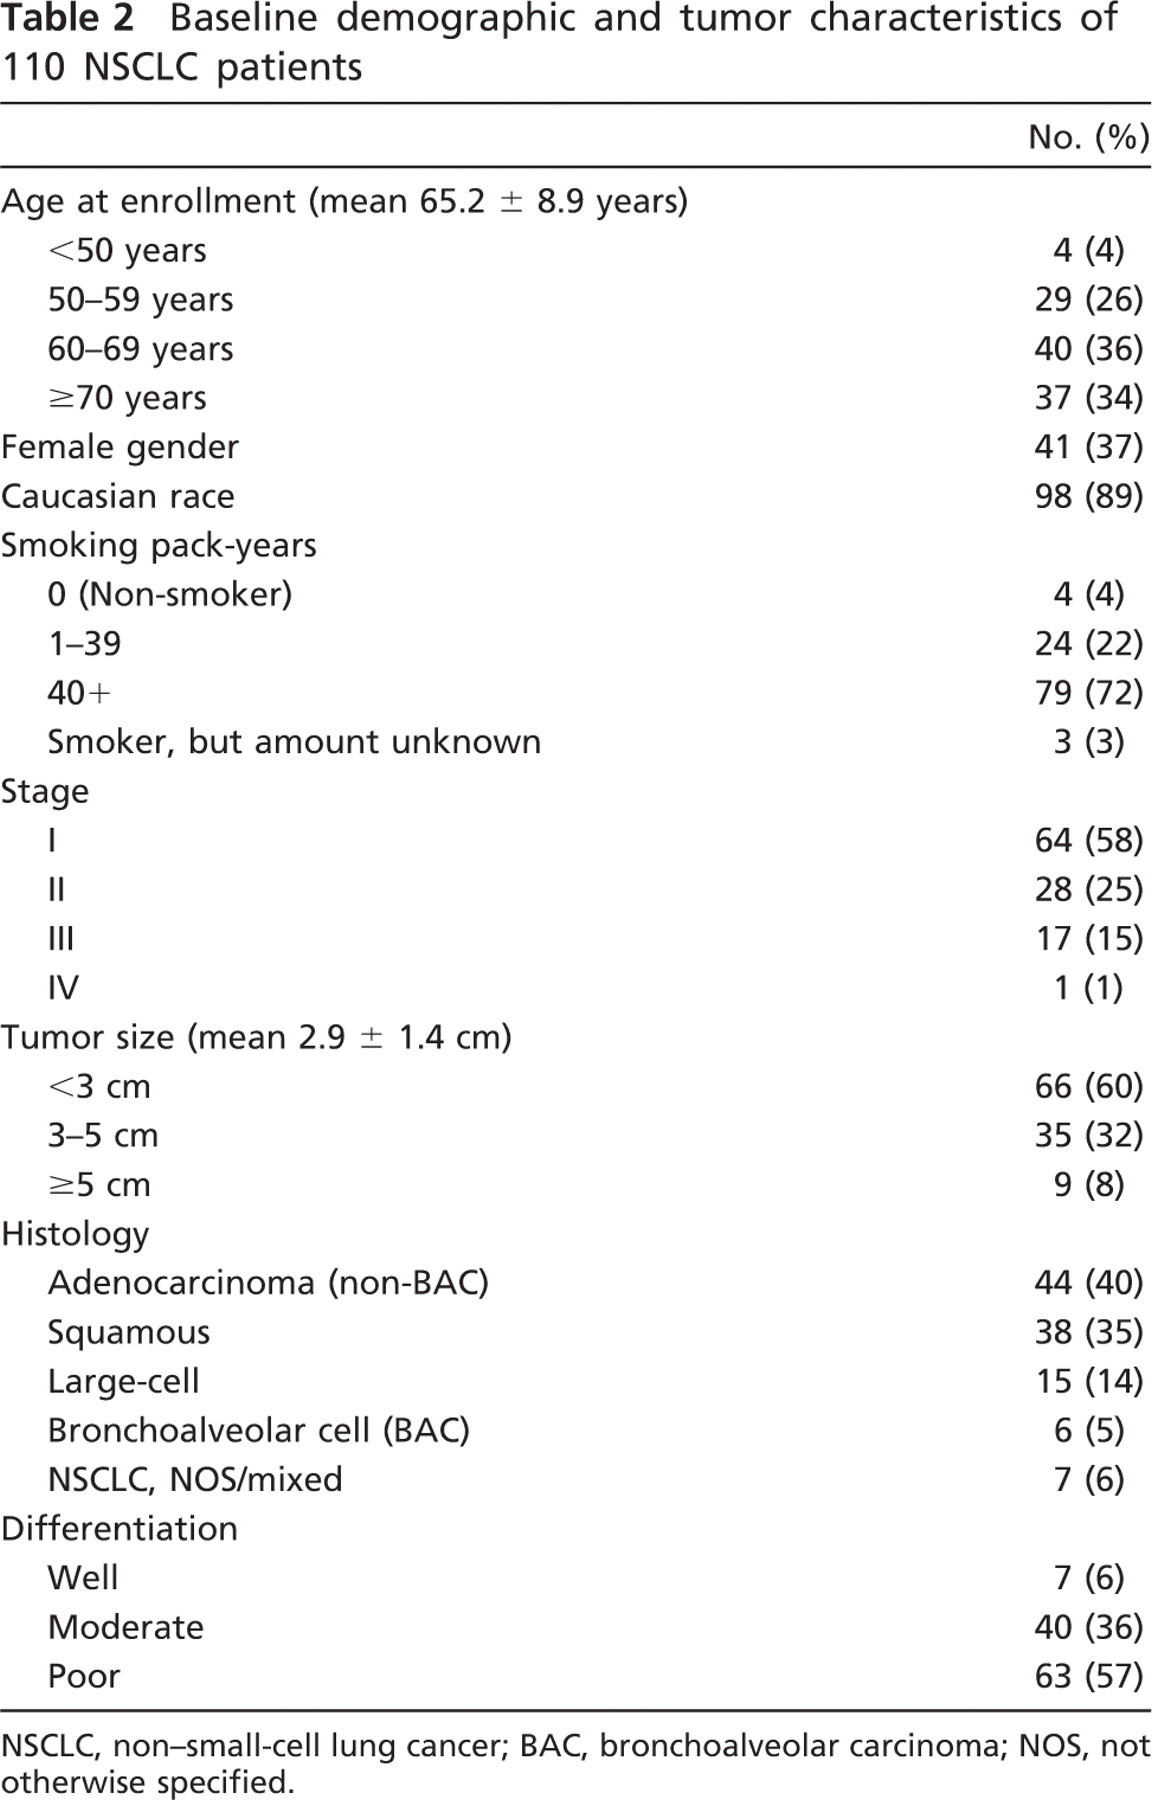
NSCLC, non-small-cell lung cancer; BAC, bronchoalveolar carcinoma; NOS, not otherwise specified.
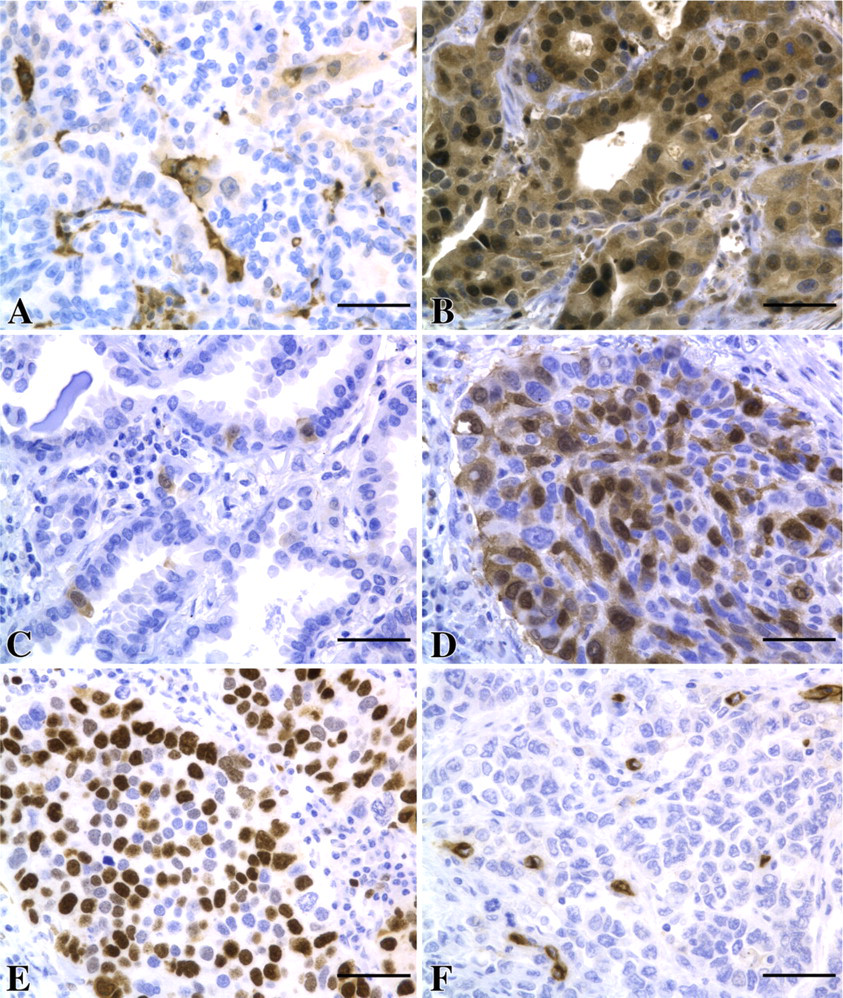
Representative examples of immunohistochemical staining. (A) TP-low composite score. (B) TP-high composite score. (C) TK1-low composite score. (D) TK1-high composite score. (E) CD31 staining. (F) Ki-67 staining. Bar = 50 μm.
Nuclear TK1 vs Cytoplasmic TK1
TK1 expression was assessed in both the nucleus and the cytoplasm of the tumor cells to determine whether differences in expression exist between the two compartments (Figures 2 and 4). Localization of TK1 was observed in both the nuclear and cytoplasmic compartments of the tumor cells, as previously noted, using immunohistochemistry, immunofluorescence, and enzyme assay methods (Johansson et al. 1997; veer Reddy and Pardee 1980; Kuroiwa et al. 2001; Cui et al. 2004). The TK1cyt staining score was, on average, significantly greater than the TK1nuc staining score (p< 0.001, paired Wilcoxon signed-rank test) and we observed a close correlation between the TK1 staining scores in the nuclear and cytoplasmic compartments (r = 0.78, p< 0.001, Spearman's correlation coefficient). We also observed similar results when comparing the two staining scores separately within each histological subtype (data not shown).
Given the high degree of correlation between the nuclear and cytoplasmic expression of both TK1 and TP, in the majority of analyses, we will present cytoplasmic expression of TK1 and TP only, except when differences were observed.
Relationship Between TK1 Staining and Ki-67 Labeling Index
In contrast to TK1 and TP, Ki-67 was found to be exclusively localized in the nuclear compartment (Figure 2). The TK1cyt staining score was significantly correlated with the Ki-67 labeling index (r = 0.53, p<0.001, Spearman's correlation coefficient), as shown in Figure 5, and consistent with the role of TK1 in the eventual synthesis of dTTP as well as a previous report of TK1 and Ki-67 staining in NSCLC (Mao et al. 2005). When considering staining within each histological subtype (adenocarcinoma or squamous cell carcinoma), similar results were observed (data not shown).
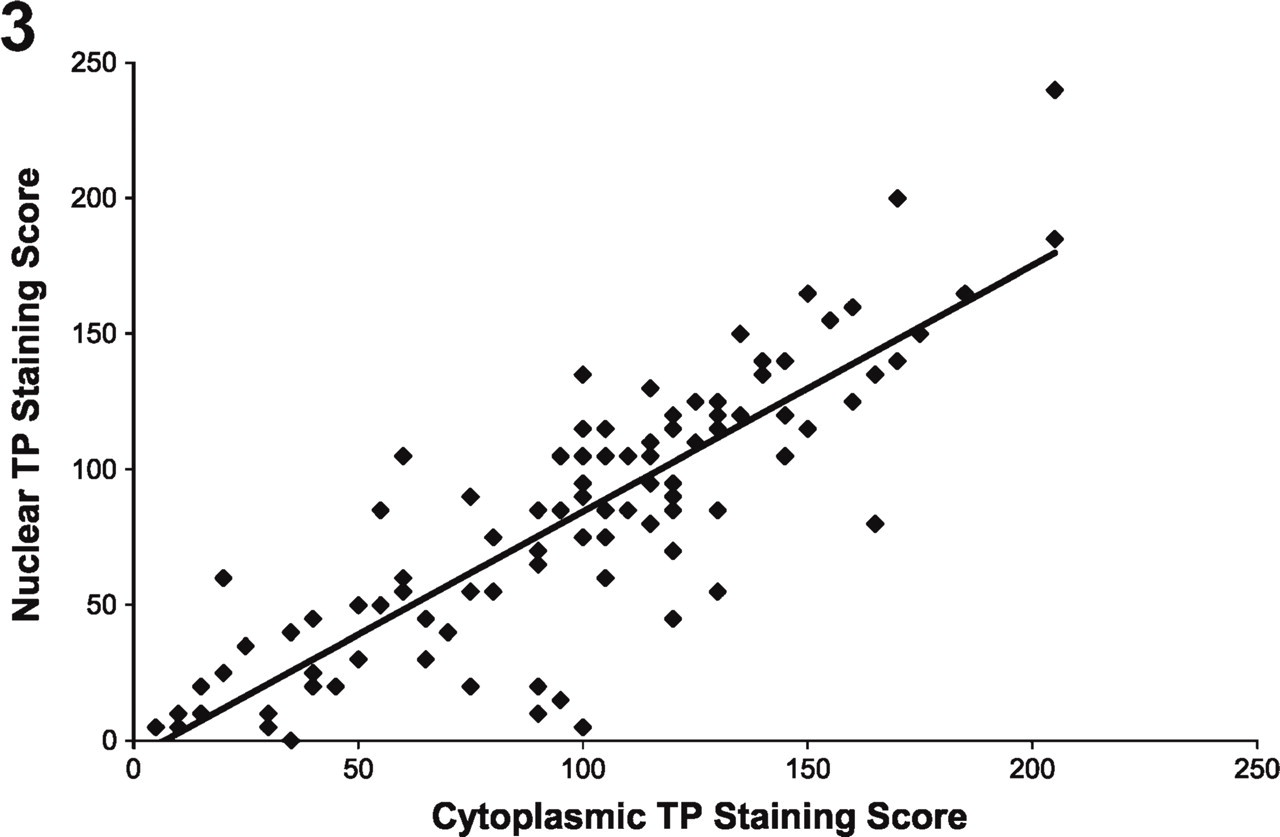
Nuclear TP staining vs cytoplasmic TP staining. Cytoplasmic TP staining was strongly correlated with (r = 0.85, p< 0.001) and significantly greater than (p<0.001) nuclear TP staining.
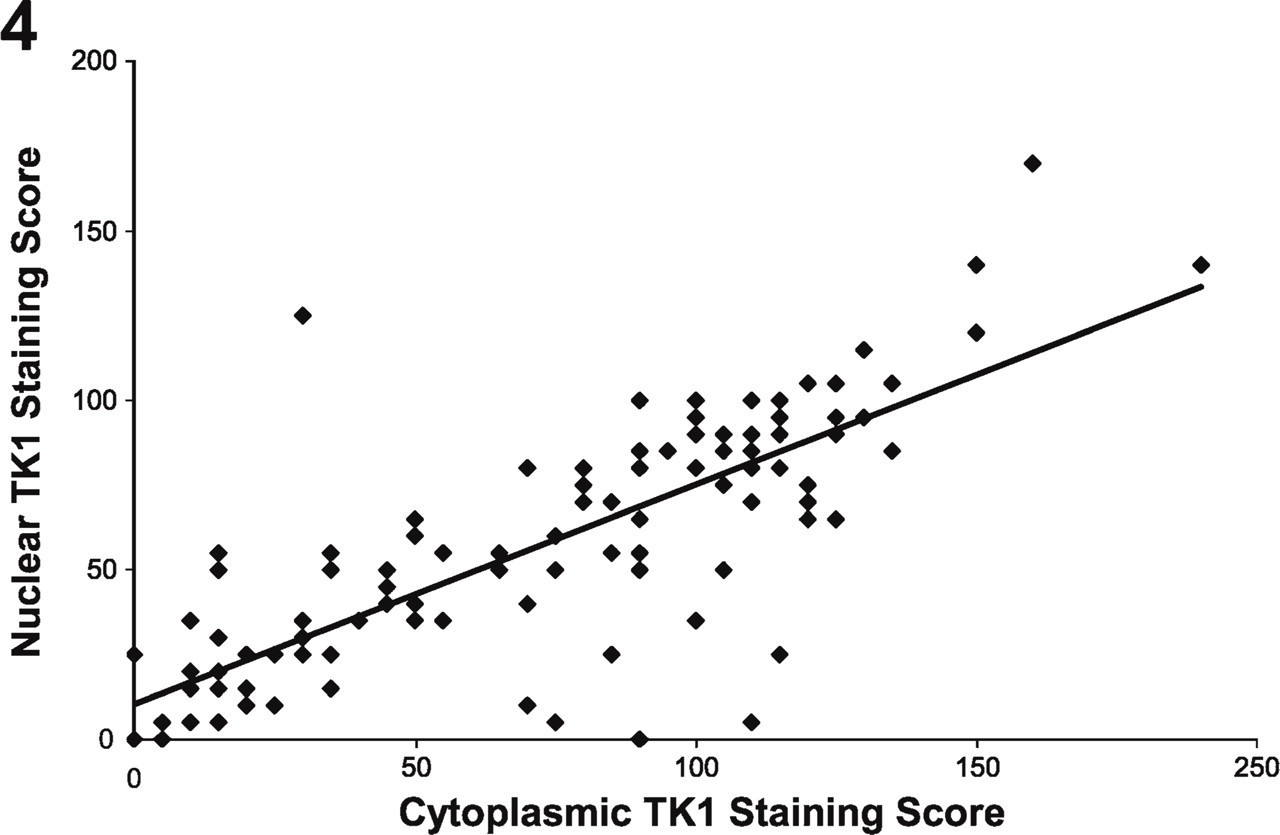
Nuclear TK1 staining vs cytoplasmic TK1 staining. Cytoplasmic TK1 staining was strongly correlated with (= 0.78, p< 0.001) and significantly greater than (p<0.001) nuclear TK1 staining.
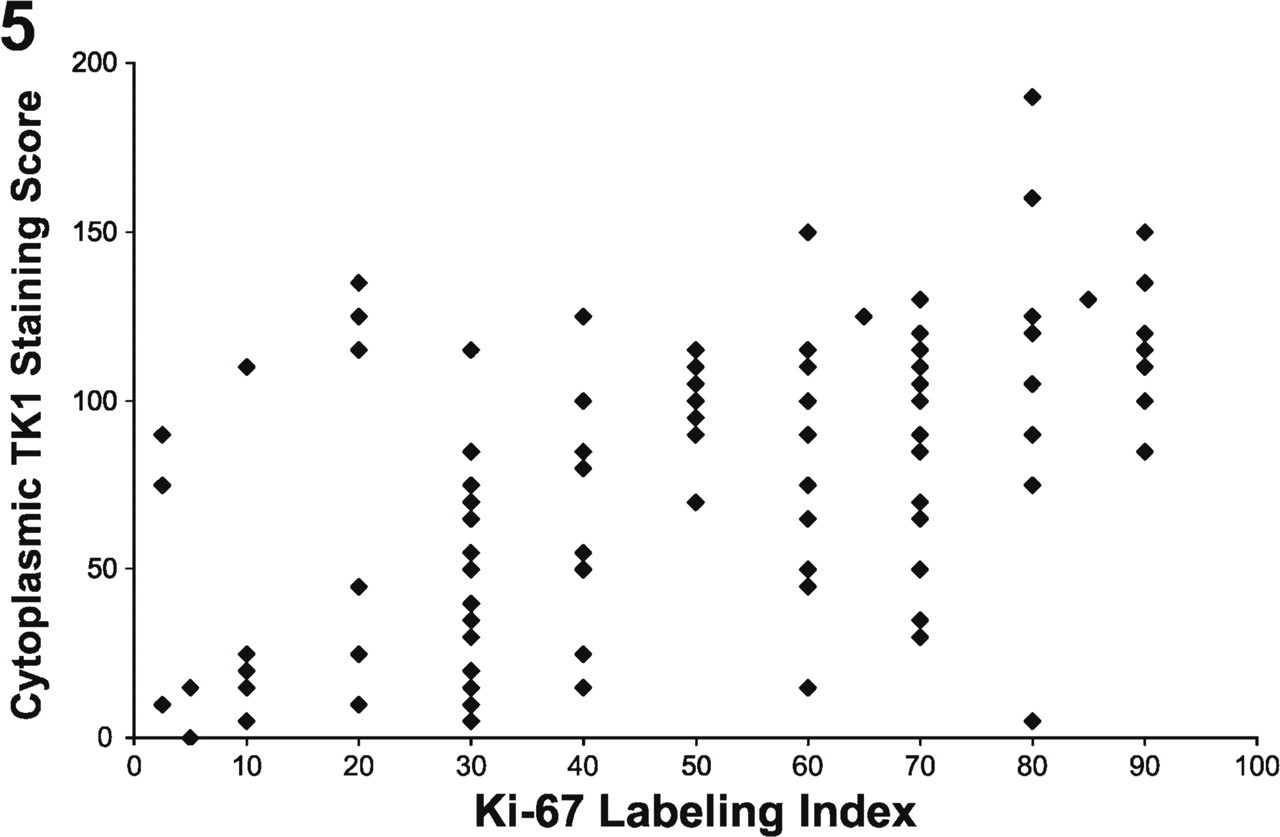
Cytoplasmic TK1 staining vs Ki-67 labeling index. Cytoplasmic TK1 staining was significantly correlated with the Ki-67 labeling index (r = 0.53, p<0.001).
Relationship Between TP Staining and Chalkley Score
TP has been shown to have angiogenic activity, believed to be due to one of its end products, 2-dR-1-P. The Chalkley score based on CD31 staining is representative of the relative area occupied by nascent blood vessels. The median Chalkley score value (6) was used as the cut-off point for dichotomizing the Chalkley score into low and high categories. The mean TPcyt staining score was significantly greater for high Chalkley scores (>6) compared with low Chalkley scores (≤6) (mean 115.8 vs 79.9, p<0.001, Wilcoxon rank-sum test), as seen in Figure 6. Similar results were observed when considering these scores within each histological subtype (adenocarcinoma or squamous cell carcinoma) (data not shown). In addition to being expressed by blood vessels, CD31 was also expressed on macrophages and plasma cells. Because these cell types are easily distinguished from blood vessels, their staining did not compromise our analysis.
TK1 Staining vs TP Staining
Given that TK1 and TP share a common substrate, and that TP is catabolic whereas TK1 is synthetic, it might be expected that their expression would be inversely related, as has been reported in hematologic malignancies (Shiotani et al. 1989a,b). We found that the TPcyt staining score was on average significantly greater than the TK1cyt staining score (Table 1, p=0.0002, paired Wilcoxon signed-rank test), but there was no significant correlation (inverse or otherwise) between the scores (r = 0.04, p=0.64; Spearman's correlation coefficient, data not shown). Similar to what was observed in the cytoplasm, nuclear TP staining was greater than nuclear TK1 staining (p=0.0003, paired Wilcoxon signed-rank test), and we did not observe a significant inverse correlation between TPnuc and TK1nuc (r = −0.17, p=0.08, Spearman's correlation coefficient).
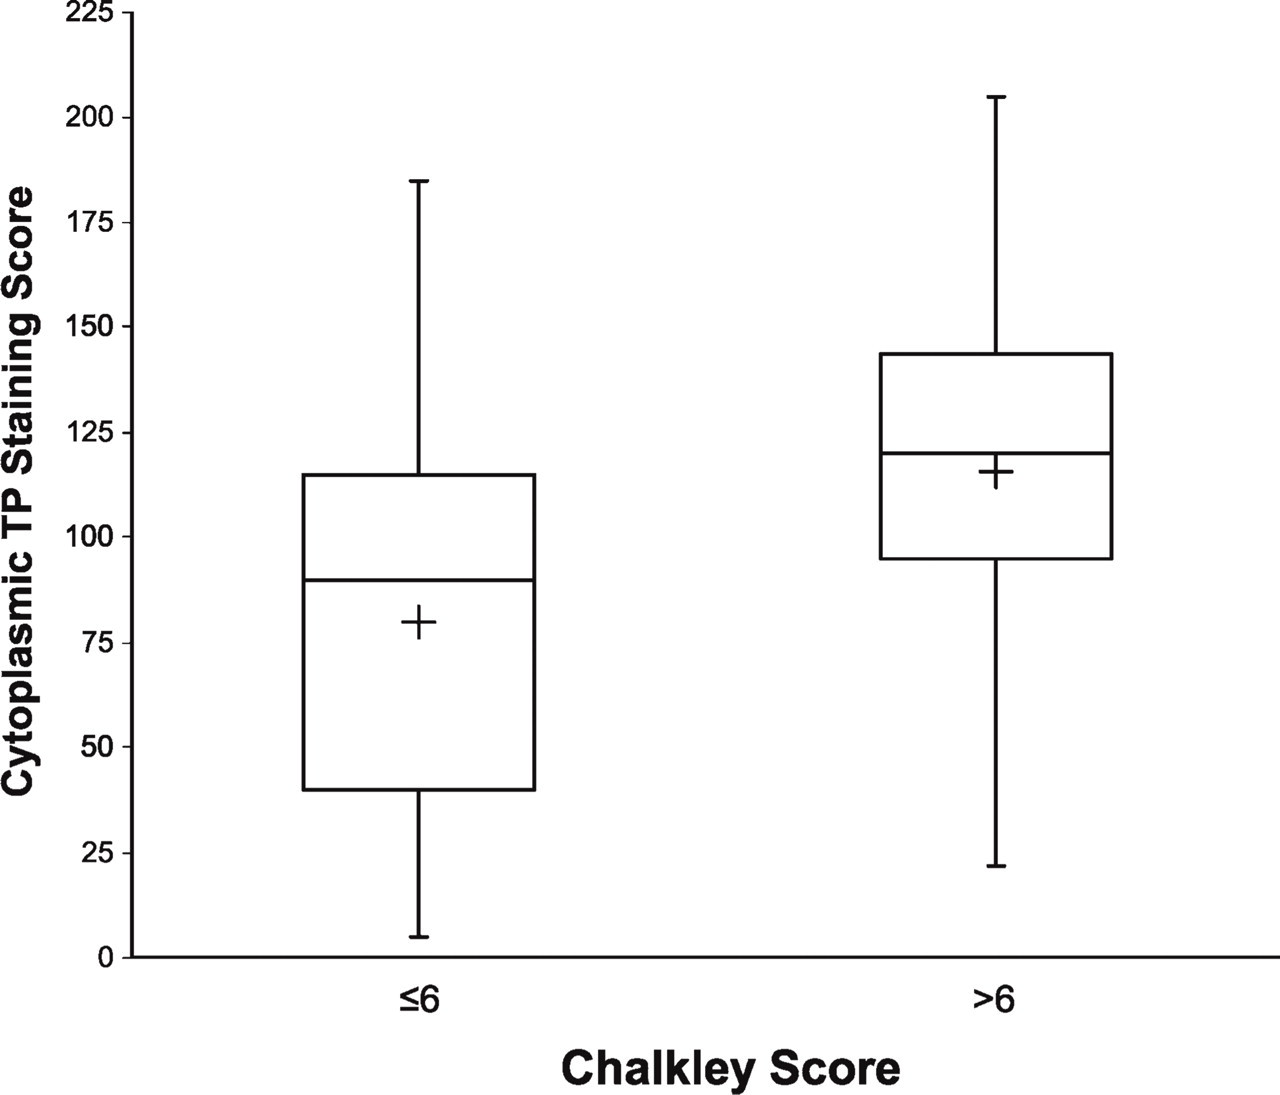
Boxplot of cytoplasmic TP vs CD31. Cytoplasmic TP staining was significantly greater for those with high (>6) compared with low (≤6) Chalkley score for CD31 staining (mean cytoplasmic TP staining, 115.8 vs 79.9, respectively, p<0.001). The length of the box represents the interquartile data range (the distance between the 25th and the 75th percentiles). The plus symbol in the box interior denotes the data mean, and the horizontal line in the box interior represents the data median. Vertical lines extending from the box mark the minimum and maximum observed values.
Ki-67
Increased tumor cell proliferation is a contributing factor to tumor size and metabolic burden, and might be expected to be associated with angiogenesis. However, we found that the Ki-67 labeling index was not significantly associated with the Chalkley score (Table 1, p=0.70, Wilcoxon rank-sum test), TPcyt staining (r = −0.04, p=0.65; Spearman's correlation coefficient, data not shown), or TPnuc staining (r = −0.17, p=0.08, Spearman's correlation coefficient).
Tumor Size
Tumors ranged in size from 1.0 to 7.7 cm in diameter (Table 2). Tumor size was not significantly associated with TPnuc (r = 0.14, p=0.15, Spearman's correlation coefficient), TPcyt (r = 0.11, p=0.26, Spearman's correlation coefficient), TK1nuc (r = −0.05, p=0.58, Spearman's correlation coefficient), TK1cyt (r = 0.03, p=0.79, Spearman's correlation coefficient), Ki-67 labeling index (r = −0.04, p=0.68, Spearman's correlation coefficient), or Chalkley score (p=0.37, Wilcoxon rank-sum test; data not shown).
Discussion
These IHC studies were undertaken to complement our investigations in PET imaging, currently the only clinical tool capable of tracking enzyme activities in vivo in a non-invasive yet quantifiable manner. Over the past several years, we have developed the now widely used PET tracer 3'-deoxy-3'-[F-18]fluorothymidine ([F-18] FLT) to track TK1 activity. However, it would be very useful to also have a PET tracer to monitor thymidine catabolism via TP to better understand the overall disposition of thymidine in tumors and the associated generation of metabolic signals, which can profoundly affect proliferation and angiogenesis.
We tested our composite scoring data for any correlations in the expression of TP relative to that of TK1. TP and TK1 share a common substrate, thymidine, and catalyze opposing reactions. Therefore, we hypothesized that they would demonstrate an inverse relationship with reference to their expression, as has been reported in hematologic malignancies (Shiotani et al. 1989a,b). However, we did not observe substantial positive or negative correlations either between TPnuc and TK1nuc expression or between that of TPcyt and TK1cyt. In the only other report we have found examining the relationship between TK1 and TP within the same solid tumors, TK1 mRNA expression and TP mRNA expression were both increased in cervical cancer, although comparing their expression in individual samples did not reveal any significant association (Fujiwaki et al. 2001). However, the failure to detect correlations in our data may be due to sampling errors resulting from the well-documented heterogeneity within NSCLC tumors at the light microscopic (Willis 1948; Hirsch et al. 1983), immuno-histochemical (Gatter et al. 1985), electron microscopic (Dunnill and Gatter 1986), and genomic (Petersen and Petersen 2001) levels (Figure 2).
Our study reveals a number of critical associations in NSCLC, among them the strong correlations between nuclear and cytoplasmic staining for TP and, similarly, for TK1. This is an important point in determining the prognostic value of staining in these compartments, particularly in the context of imaging research, because present imaging modalities are unable to discern between nuclear and cytoplasmic signals. The cytoplasmic and nuclear localization of TK1 (Kuroiwa et al. 2001; Cui et al. 2004) and TP (Matsuura et al. 1999; Stavropoulos et al. 2005) is consistent with previous studies. Nuclear TP staining has been reported to be a prognostic indicator of survival in squamous head and neck cancer (Koukourakis et al. 2000), gallbladder adenocarcinoma (Giatromanolaki et al. 2002), and superficial bladder cancer (Stavropoulos et al. 2005). However, in only one of these studies (Koukourakis et al. 2000) was a correlation between the staining in the two compartments evaluated. In the present study, we used the same anti-TP monoclonal antibody (Koukourakis et al. 2000; Giatromanolaki et al. 2002; Stavropoulos et al. 2005) and found a strong correlation between nuclear and cytoplasmic TP staining, making it unlikely that prognostic significance could be associated with staining in one compartment but not the other.
Inasmuch as the end products of both TP and TK1 are small molecules and should easily pass through the nuclear pores, it is not immediately apparent why the enzymes should be translocated into the nucleus. Although experiments to examine this question are beyond the scope of the present study, there is evidence to suggest a critical role for TK1 and TP in the nucleus. The absolute levels and relative proportions of the four dNTPs used in DNA synthesis are tightly regulated. Perturbation of this regulation results in errors of DNA replication, stalling of the replication fork, and increased mutation rates, eventually leading to genetic instability and death (Yoshioka et al. 1987; Hu and Chang 2007). TK1 and enzymes of the de novo thymidine synthesis pathway (thymidylate synthase, dihydrofolate reductase) have been coisolated in a large nuclear multimeric enzyme complex with DNA polymerase α (the “replitase”), which is believed to be associated with the replication fork of mammalian cells only during the S and G2/M phases (veer Reddy and Pardee 1980, 1983; Noguchi et al. 1983; Plucinski et al. 1990). Because the replication fork is the site where dNTP incorporation must take place with absolute fidelity at very great speed, the replitase complex would seem to ensure localized and rapid response to dNTP demand and proportionality without having to rely on a widely distributed, slower responding equilibration with the cytosolic and mitochondrial pools of dNTPs. Although there have been no reports of TP being associated with the replitase complex, TP may also be present to abrogate local excesses in thymidine concentration that endanger the dNTP balance (Weinberg et al. 1981; Ke et al. 2005; Hu and Chang 2007).
With regard to imaging, TK1 is the enzyme that phosphorylates the PET imaging tracer [F-18]FLT, resulting in its metabolic trapping within the cell, and [F-18]FLT uptake by cells is correlated with their TK1 enzymatic activity (Kong et al. 1992; Rasey et al. 2002). In the present study, we observed a strong correlation between TK1 expression and Ki-67 labeling, which is consistent with our previously reported strong correlation between Ki-67 labeling and standardized uptake value measures of [F-18]FLT uptake in NSCLC tumors (Vesselle et al. 2002).
Recent studies have demonstrated that angiogenesis can proceed by any one of several parallel pathways in several tumor types, including NSCLC (Mizukami et al. 2005; McClelland et al. 2007). In the present case, our data reveal a significant association between TP expression and Chalkley scoring of CD31 staining. Although the tumors used in this study are all at least 1 cm in diameter and therefore too large to contribute information about the initial molecular commitment to angiogenesis, the observed association between TP and Chalkley score is consistent with ongoing maintenance of an already-established angiogenic process in NSCLC.
Finally, we found no correlation between the Ki-67 labeling index and either TP expression or CD31 staining. It might be expected that the percentage of actively dividing cells, reflected by Ki-67 staining, would have a positive correlation with angiogenesis; however, this was not supported in the present study of NSCLC. Hlatky et al. (2002) state that angiogenesis increases not in response to tumor proliferation, but rather to tumor “metabolic burden,” i.e., nutrient and oxygen demands. Many tumors have been shown to tolerate hypoxic conditions much better than corresponding normal tissue (Graeber et al. 1996), which may reflect their lower oxygen consumption rates (Steinberg et al. 1997) due to their reliance on glycolysis to produce ATP (Kim and Dang 2006). Consequently, many tumors have a decreased metabolic burden relative to normal tissue, and provide a reduced angiogenic stimulus. Eberhard et al. (2000) found that in several different solid tumors, the MVD of surrounding normal tissue was usually greater than that of the actively growing tumor; normal lung had a MVD over 3-fold greater than that of angiogenic lung carcinoma, which is consistent with the normal lung's performance of gas exchange. Angiogenesis in NSCLC tumors is further complicated by the fact that the advancing margins of the tumor may opportunistically decrease their metabolic burden by “coopting” existing vessels of the highly vascular adjacent normal lung and air-filled alveolar spaces (Pezzella et al. 1997; Sardari Nia et al. 2008). This suggests that the regulation of angiogenesis as it relates to metabolic burden will need to be individually established for any given tissue or, potentially, even any tumor.
These results provide important insights into the disposition of thymidine as it relates to proliferation and angiogenesis in NSCLC, as well as additional context for the development of PET imaging tracers that we hope will specifically track angiogenic vs proliferative signals in the thymidine salvage pathway. In the case of TK1, IHC detection of expression may not accurately reflect enzyme activity levels, because TK1 enzymatic activity is subject to rigorous posttranslational modification (Sherley and Kelly 1988; Rasey et al. 2002; Ke et al. 2005; Hu and Chang 2007), although this regulation is perturbed in transformed cells (Hengstschlager et al. 1994a,b), possibly as a result of TK1 overexpression (Mikulits et al. 1996). We are currently performing TK1 activity assays on a subset of these tumors, with the goal of determining just how closely our IHC results track TK1 enzyme activity. In contrast, TP activity is not known to be regulated by posttranslational modifications, and we expect TP staining to closely correspond to tumor TP enzymatic activity. We plan to use the results of these studies to facilitate further development of PET imaging tracers targeting TP and tumor angiogenesis in NSCLC (Grierson et al. 2007).
Footnotes
Acknowledgements
This work was supported in part by Grants CA-115559 and CA-107264 from the National Institutes of Health.