
Abstract
Cancer cell monolayers are commonly used for preclinical drug screening. However, monolayers do not begin to mimic the complexity of the tumor microenvironment, including hypoxia and nutrient gradients within the tumor. To more accurately mimic solid tumors, we developed and drug-tested an anaplastic lymphoma kinase (ALK)-positive (H3122) non-small-cell lung cancer 3D (three-dimensional) culture model using light-activated gelatin methacryloyl hydrogels. We previously demonstrated that the combination of alectinib, an ALK inhibitor, and SHP099, an SHP2 inhibitor, had synergistic efficacy in ALK-positive cell monolayers. We aimed to test this drug combination in our novel ALK-positive 3D cancer model. We first validated the 3D cultures by comparing the distribution of terminal deoxynucleotidyl transferase dUTP nick end labeling (TUNEL)-positive cells in the 3D cultures with sections from time-matched mouse xenografts, finding a comparable percentage of TUNEL-positive cells in the 3D culture and xenograft inner cores at each time point. When we investigated the effect of the combination of alectinib and SHP099 in these novel 3D cultures, we found a comparable cellular response compared with our two-dimensional experiments especially with the drugs in combination. We suggest that 3D cultures be used as preclinical screening platforms to ensure that only the most efficacious drug candidates move on to in vivo testing.
Keywords
Introduction
Preclinical screening of cancer drugs in vitro has traditionally utilized cell monolayers, valued for their simplicity, ease of use as a high-throughput platform, and cost-effectiveness.1-3 However, despite these advantages, these monolayers fail to accurately mimic the intricate tumor microenvironment due to several factors. Monolayers lack the tumor’s structural organization and thus fail to capture the interactions that influence tumor growth, invasion, and therapeutic response.4–7 This may contribute to the poor translation of findings from cell monolayer testing to success in clinical trials or even to similar success in experiments that use animal models. 8 As a result, there has been a shift in cancer research to the use of 3D (three-dimensional) culture models that more accurately represent solid tumors.4,9–11
Tumor 3D cultures are 3D clusters of cancer cells that more closely mimic solid tumors compared with cancer cell monolayer cultures in terms of their structural organization, cellular assembly, and, potentially, oxygen and nutrient gradients from the exterior to the interior of the 3D culture.4,10,11 Oxygen gradients in tumors can lead to a relatively hypoxic tumor core, particularly when the tumor is poorly vascularized, and accelerate the development of drug resistance. 12 It is this hypoxic zone, along with acidosis, that can trigger neovascularization, tumor progression, and metastasis.13–15 Therefore, by partially modeling these processes, 3D cultures more accurately mimic tumors (compared with monolayer cancer cell cultures). Consistent with this reasoning, differences in drug responses have been observed in experiments between the two types of cell cultures and, in some cases, using the same cell line. This difference has been found for several cancers, including melanoma, ovarian, and lung.16,17
With the development of biomaterials, contemporary cancer models have focused on encapsulating cells in hydrogels. These hydrogels give a surrogate extracellular matrix to help generate dynamic 3D culture properties that mimic the tumor microenvironment, for example, nutrient, metabolite, and oxygen gradients.18–22 Gelatin methacryloyl (GelMA) is a gelatin-based biomaterial synthesized by reacting gelatin, the primary structural protein in the extracellular matrix, with methacrylic anhydride, which is then light-activated to form a hydrogel with tunable mechanical properties. 23 GelMA-based hydrogels have critical characteristics, including biocompatibility/cytocompatibility, enzymatic-cleavage, cell adhesion, and tunable mechanical properties. 24 As a result of these properties, GelMA has been investigated for 3D culture systems, in addition to drug delivery and tissue engineering.20,25–29
Lung cancer accounts for approximately 1.6 million deaths per annum, 30 with the most common form being non-small-cell lung cancer (NSCLC). Approximately 6% of NSCLC cases harbor anaplastic lymphoma kinase (ALK) fusions with echinoderm microtubule-associated protein like-4 (EML4), known as ALK+ NSCLC.31,32 For patients with ALK+ NSCLC, ALK inhibitors, such as alectinib, can drastically prolong patient survival. However, resistance typically develops within several years of treatment. 33 Following Daredaei et al., 34 we previously demonstrated that co-targeting ALK with the secondary oncogenic driver Src homology region 2–containing protein tyrosine phosphatase (SHP2), using alectinib (ALK inhibitor) and SHP099 (SHP2 inhibitor), is synergistically effective at inducing a G1 phase cell cycle arrest and intrinsic apoptosis in H3122 and H2228 ALK+ NSCLC cells, which harbor EML4-ALK variants 1 and 3, respectively. 35 However, these results were obtained in monolayer cultures. Therefore, in this study, we aimed first to develop an approach that has not been used before: ALK+ NSCLC 3D culture model using H3122 cells and light-activated GelMA hydrogel to validate against excised xenografts and, second, to test the efficacy of alectinib combined with SHP099 in that model. We hypothesized that H3122 cells could be successfully cultured as 3D cultures using a GelMA-based extracellular matrix and that alectinib with SHP099 would show similar efficacy at suppressing cancer cell growth in these 3D cultures, as demonstrated in monolayers.
Methods
Experimental Approach
Using light-activated GelMA hydrogels, we established H3122 cell 3D cultures over 1, 2, and 3 weeks, representing early, middle, and late-stage tumor development. These 3D cultures were directly compared with H3122 cell mouse xenografts. To match the development stages of xenografts and 3D cultures, we worked from the assumption that palpable xenografts of 100 mm3 (indicating successful implantation at approximately 1 week post injection) could operate as a starting point for xenografts in the way that aligned with the degree of development of the cell pellet implanted into GelMA for the 3D culture cultures at 7 days post culture, that is, early stage/baseline for both 3D cultures and xenografts. To test whether the 3D cultures exhibited a core cell death region in a similar pattern to the tumors, 3D cultures and tumors were sectioned, and patterns of TUNEL staining were compared at each time point (Table 1). Patterns of TUNEL staining were hypothesized to correspond to diffusion gradients in the 3D culture and tumors for oxygen and nutrients, therefore indicating construct validity of the 3D cultures as a model for intra-tumor drug kinetics. Using this developed model, we assessed whether the combination of alectinib and SHP099 exerted tumor cell suppression effects on the 3D cultures at different tumor development stages. For manuscript clarity, we refer to early-, middle-, and late-stage 3D cultures and xenografts rather than to precise days (Table 1).
EC50 Values and Maximum Percentage Reduction of Cancer Cell Growth Over 3 Days Compared With Control in 2D and 3D Culture.

Materials
Alectinib was purchased from LC Laboratories (Woburn, MA). SHP099 was purchased from MedChemExpress (Monmouth Junction, NJ). All drugs were solubilized in 100% dimethyl sulfoxide (DMSO), stored at −20C for alectinib or −80C for SHP099, and diluted when required, with the DMSO content not exceeding 0.1%. Roswell Park Memorial Institute (RPMI) 1640 medium, TrypLE, and Geltrex matrix were purchased from Life Technologies (Grand Island, NY). Penicillin/streptomycin, DMSO, eosin, and tris (2,2′-bipyridyl)dichloro-ruthenium(II) hexahydrate powder (Ru) (Batch number 1003436076), sodium persulfate (SPS), methacrylic anhydride, DPX, mountant, and gelatin were obtained from Sigma-Aldrich (St Louis, MO). FBS was purchased from Sigma-Aldrich (Auckland, New Zealand). AlamarBlue cell viability reagent was obtained from Invitrogen (Waltham, MA). Hematoxylin was purchased from the Histology Unit (University of Otago, Dunedin, New Zealand). ApopTag peroxidase in situ apoptosis detection kit and hydrogen peroxide (30%) were obtained from EMD Millipore (Temecula, CA). 3,3′-diaminobenzidine (DAB) substrate kit was purchased from Cell Marque (Rocklin, CA). The Dako pen was purchased from Dako (Glostrup, Denmark).
Cell Culture
H3122 ALK+ human lung adenocarcinoma cells with the variant 1 EML4-ALK fusion were gifted by Dr Daniel Costa, Harvard University. The cells were stored and maintained in a humidified incubator (PHCbi) with 5% CO2 at 37C. Cells were maintained in RPMI 1640 medium supplemented with 5% FBS and 1% penicillin/streptomycin. At 80%–95% confluency, cells were passaged. The 2D (two-dimensional) cultures were carried out as described previously. 35
Macromer Preparation
The GelMA macromer was prepared as described previously by Lim et al. 36 Methacrylic anhydride of 0.6 g per gram of gelatin was left to react for 1 hr at 50C under constant stirring, followed by dialysis against deionized water to remove unreacted methacrylic anhydride. The purified solution was then sterile-filtered, freeze-dried, and stored at room temperature until required.
GelMA Hydrogel 3D culture Synthesis
Cells were passaged, and following optimization, a seeding density of 2.5 × 10⁵ cells per 3D culture was centrifuged at 265 × g for 3 min to create a cell pellet. The supernatant was discarded, and the pellet was resuspended in GelMA with PBS at a final concentration of 10 wt%. This pre-gel solution was mixed with the photoinitiators (0.5 mM tris(2,2-bipyridyl)dichlororuthenium(II) hexahydrate (Ru) and 5mM SPS, and 50 μL pipetted into silicone molds (Ø 5.5 × 2 mm). Polymerized hydrogels were formed by exposing the pre-gel solution to visible light (30 mW/cm3) for 3 min to initiate photo-crosslinking. Ru/SPS of 10 wt% with 0.5/5 mM was chosen as it retains high cell viability and optimal crosslinking dynamics. 36 Gels were removed from molds, placed in a 24-well plate containing RPMI 1640 media, and stored in a 37C incubator. Media was changed 24 hr after 3D culture synthesis to remove the initial leaching photoinitiators and then routinely cultured for the experiment duration. When the time points were reached for each group, all 3D cultures were washed in PBS and placed in 4% paraformaldehyde for 24 hr, followed by 24 hr in 30% sucrose, all at 4C before being embedded in a cryomatrix. Embedded 3D cultures were stored at −20C until required.
Animal Housing and Care
Male NOD scid gamma (NSG) mice (6–8 weeks old) were purchased from BRF (University of Otago, Dunedin, New Zealand). Mice were housed in pathogen-free conditions with continuous access to sterile water and a Reliance rodent diet. The room was maintained at 21C–24C with a 12 hr light/dark cycle. Before the experiment commenced, the mice were acclimatized. All animal experiments were approved by the University of Otago Animal Ethics Committee (AUP Approval 21-85).
Xenograft Preparation
For xenograft implantation, 32 male immunocompromised NSG mice (6–8 weeks old) received a subcutaneous injection to the lower left flank of a 1:1 of Geltrex matrix to RPMI 1640 media containing 1.0 × 10⁶ H3122 cells. The tumor was measured daily using digital calipers. To obtain xenograft tumors corresponding to the 3D cultures at days 7, 14, and 21 (Table 2), we randomly assigned the mice to groups to be euthanized, with the xenografts dissected 1 week after injection (if the tumor was palpable at 100 mm3, indicating a successful cancer cell graft), at 2 weeks, or 3 weeks (or when tumor size had reached the ethical endpoint of 1500 mm3). These three time points (1, 2, and 3 weeks) are where tumor and 3D culture comparisons were measured, as reported in the results.
Summary of 3D Culture and Xenograft Corresponding Stage Time Points.

Body weight and tumor volume [(width 2 × length)/2] were recorded daily to monitor animal health. At each experimental time point, mice were anesthetized with isoflurane before cervical dislocation, and tumors were excised and weighed. All tumors were washed in PBS and placed in 4% paraformaldehyde for 24 hr, followed by 24 hr in 30% sucrose, at 4C before being embedded in a cryomatrix. The embedded tumors were stored at −20C until required.
Histology
3D cultures were embedded in a cryomatrix and frozen on a freezing block placed in liquid nitrogen, and then sliced at 20 µm and xenografts at 10 µm using a cryostat and stored at −20C until required. Slides were thawed at room temperature before being stained with hematoxylin and eosin. The slides were dehydrated in 70%, 95%, and 100% ethanol. The dehydration was followed by washes in xylene. Distyrene plasticiser xylene (DPX) was then used to mount coverslips. An Aperio Image ScanScope System (Leica, Chicago, IL) was used to image the slides.
Immunohistochemistry
To investigate cell death staining, a TUNEL assay was performed according to the manufacturer’s instructions (ApopTag Peroxidase in Situ Apoptosis Detection Kit, EMD Millipore). 3D cultures were sliced at 20 µm and tumors at 6 µm using a cryostat and stored at −20C until required. DPX was used to mount coverslips after the ApopTag protocol and left to dry for 24 hr. 3D culture and xenograft slides were scanned with the Aperio Image ScanScope System (Leica) and analyzed using ImageJ, with manual counting for 3D cultures, with both the total number of cells in the tumor and the total number of TUNEL+ cells quantified.
AlamarBlue Cell Viability
The metabolic activity was assessed at each time point to determine whether the 3D cultures were viable over the entire growth period—day 1 (baseline), 7, 14, and 21. 3D cultures were seeded at a density of 2.5 × 10⁵ H3122 cells per 3D culture. At each time point, AlamarBlue (10×) was diluted to 1× in media, placed in a clean well with an untreated 3D culture, and incubated in the dark for 4 hr at 37C in a humidified incubator. According to the manufacturer’s instructions, fluorescence was read at an excitation wavelength of 540–570 nm and emission at 580–610 nm using the CLARIOstar PLUS plate reader (BMG Labtech, Ortenberg, Germany). Fluorescent intensity was plotted for days 1, 7, 14, and 21. n=3 repeated in technical triplicate.
For drug testing, 3D cultures were seeded at a density of 2.5 × 10⁵ H3122 cells per 3D culture and incubated for 4 days at 37C. 3D cultures were transferred to a clean well and then treated with respective drug concentrations of alectinib (0.001–75 µM), SHP099 (1–450 µM), or the combination of SHP099 (1–450 µM) in the presence of alectinib (10 µM) and incubated for a further 72 hr. On day 7 after seeding, AlamarBlue (10×) was diluted to 1× in media, placed in a clean well with a 3D culture, and incubated in the dark for 4 hr at 37C in a humidified incubator. Fluorescence was read at an excitation wavelength of 540–570 nm and emission at 580–610 nm according to the manufacturer’s instructions using the CLARIOstar PLUS plate reader (BMG Labtech). For 2D cultures, we used the method previously published. 35 Data were presented as a percentage of the DMSO control and plotted against the respective drug concentrations. n=3 biological replicates with duplicate samples.
Data Analysis
AlamarBlue time assays are fluorescent intensity measures expressed as mean ± SEM and were analyzed using repeated measures one-way analysis of variance (ANOVA) to compare the means of the fluorescent intensity based on repeated observations of the same 3D cultures over time. Specifically, for the AlamarBlue drug efficacy data, results are presented as a percentage of the control measurements for the control condition. Data were then transformed using x = log(x) and analyzed using nonlinear regression analysis for a log (inhibitor) versus response variable slope (four parameters) using GraphPad Prism v9.0 (GraphPad, San Diego, CA) to obtain EC50 values taken as the median response. All data are expressed as mean ± SEM.
Immunohistochemistry data for xenografts and 3D cultures were similarly analyzed using one-way ANOVA followed by a Bonferroni post hoc test using GraphPad Prism v9.0 (GraphPad). All data were presented as mean ± SEM, and a significant result was reported when p<0.05
To determine whether the combination of alectinib and SHP099 produced synergistic suppression of cell growth, the drug concentration curves for AlamarBlue (for alectinib and SHP099) were compared with cell responses predicted from the Bliss model of drug additivity as previously reported. 37 The Bliss equation for the expected fractional inhibition for the combination of alectinib and SHP099 (Fexp) where FAlectinib (fractional inhibition for alectinib alone) = 1—the viability of cells treated with alectinib alone; FSHP099 = (fractional inhibition for SHP099 alone) = 1—the viability of cells treated with SHP099 alone is:
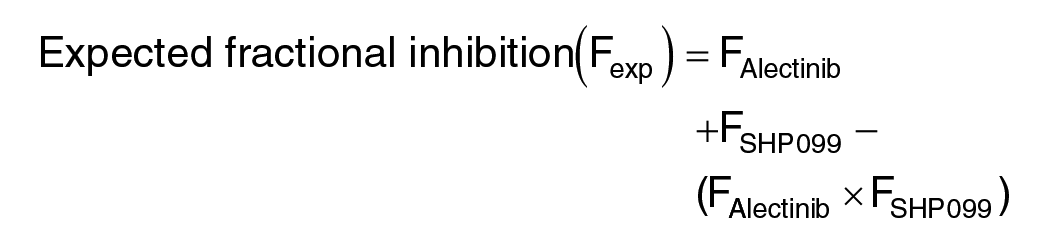
Equation 1. Bliss model combination equation for calculation of synergy when alectinib and SHP099 are applied in combination.
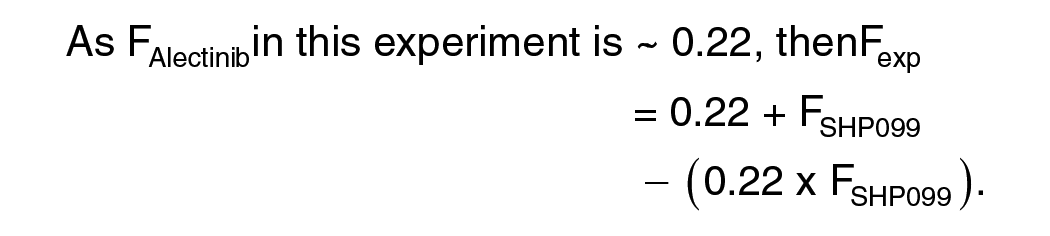
Equation 2. Bliss equation where for when alectinib is used at one concentration, with a fractional effect of approximately 22% reduction in viability.
Results
We aimed to develop a 3D culture model of ALK+NSCLC using a light-activated hydrogel system that better mimics the properties of the tumor microenvironment. We aimed to determine key time points in this in vitro model, which mimics tumor progression, by comparing 3D cultures with tumor xenografts. Finally, we used the novel validated 3D culture model to determine whether the combination of alectinib and SHP099 exerted tumor cell suppression effects on the 3D cultures.
3D Culture Metabolic Activity
We first measured the metabolic activity of the H3122 3D cultures over 21 days to ascertain whether the 3D cultures remained viable over this period. The metabolic activity of the 3D cultures did not significantly change over the 21 days of 3D culture growth (p>0.05, Fig. 1). Since the H3122 3D cultures remained metabolically active over 3 weeks, we compared them with xenografts at the times chosen to represent the early, mid, and late stages of 3D culture and xenograft growth.
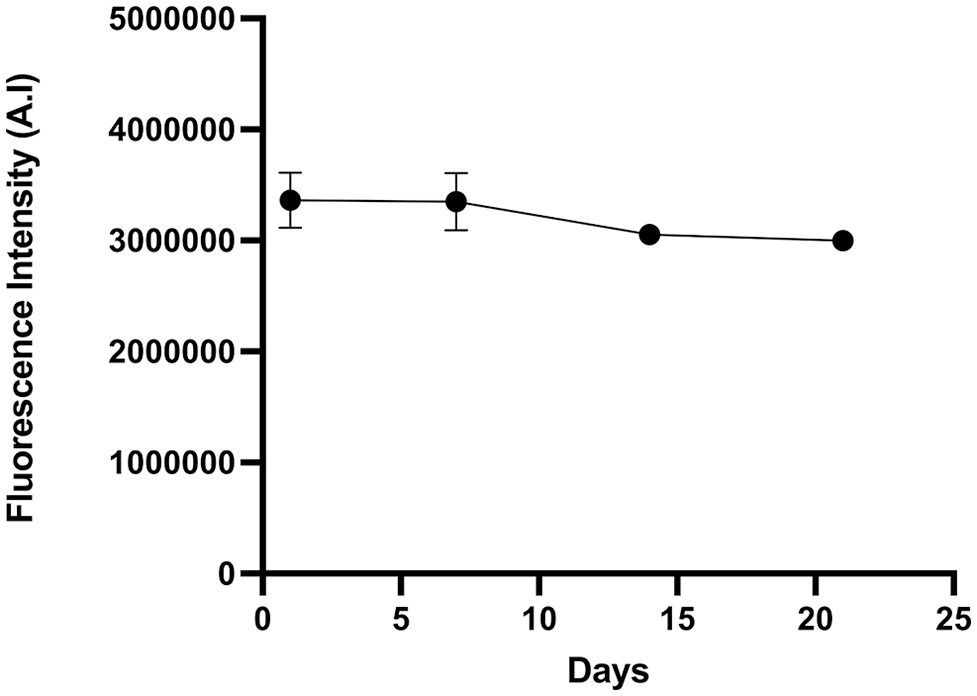
Metabolic activity of untreated 3D cultures over 21 days. Data are expressed as mean ± SEM and were analyzed using repeated measures one-way ANOVA. No significance was detected between time points, p>0.05. n=3 independent experiments repeated in technical triplicate.
Histological and Immunohistochemical Analysis of 3D cultures and Xenografts
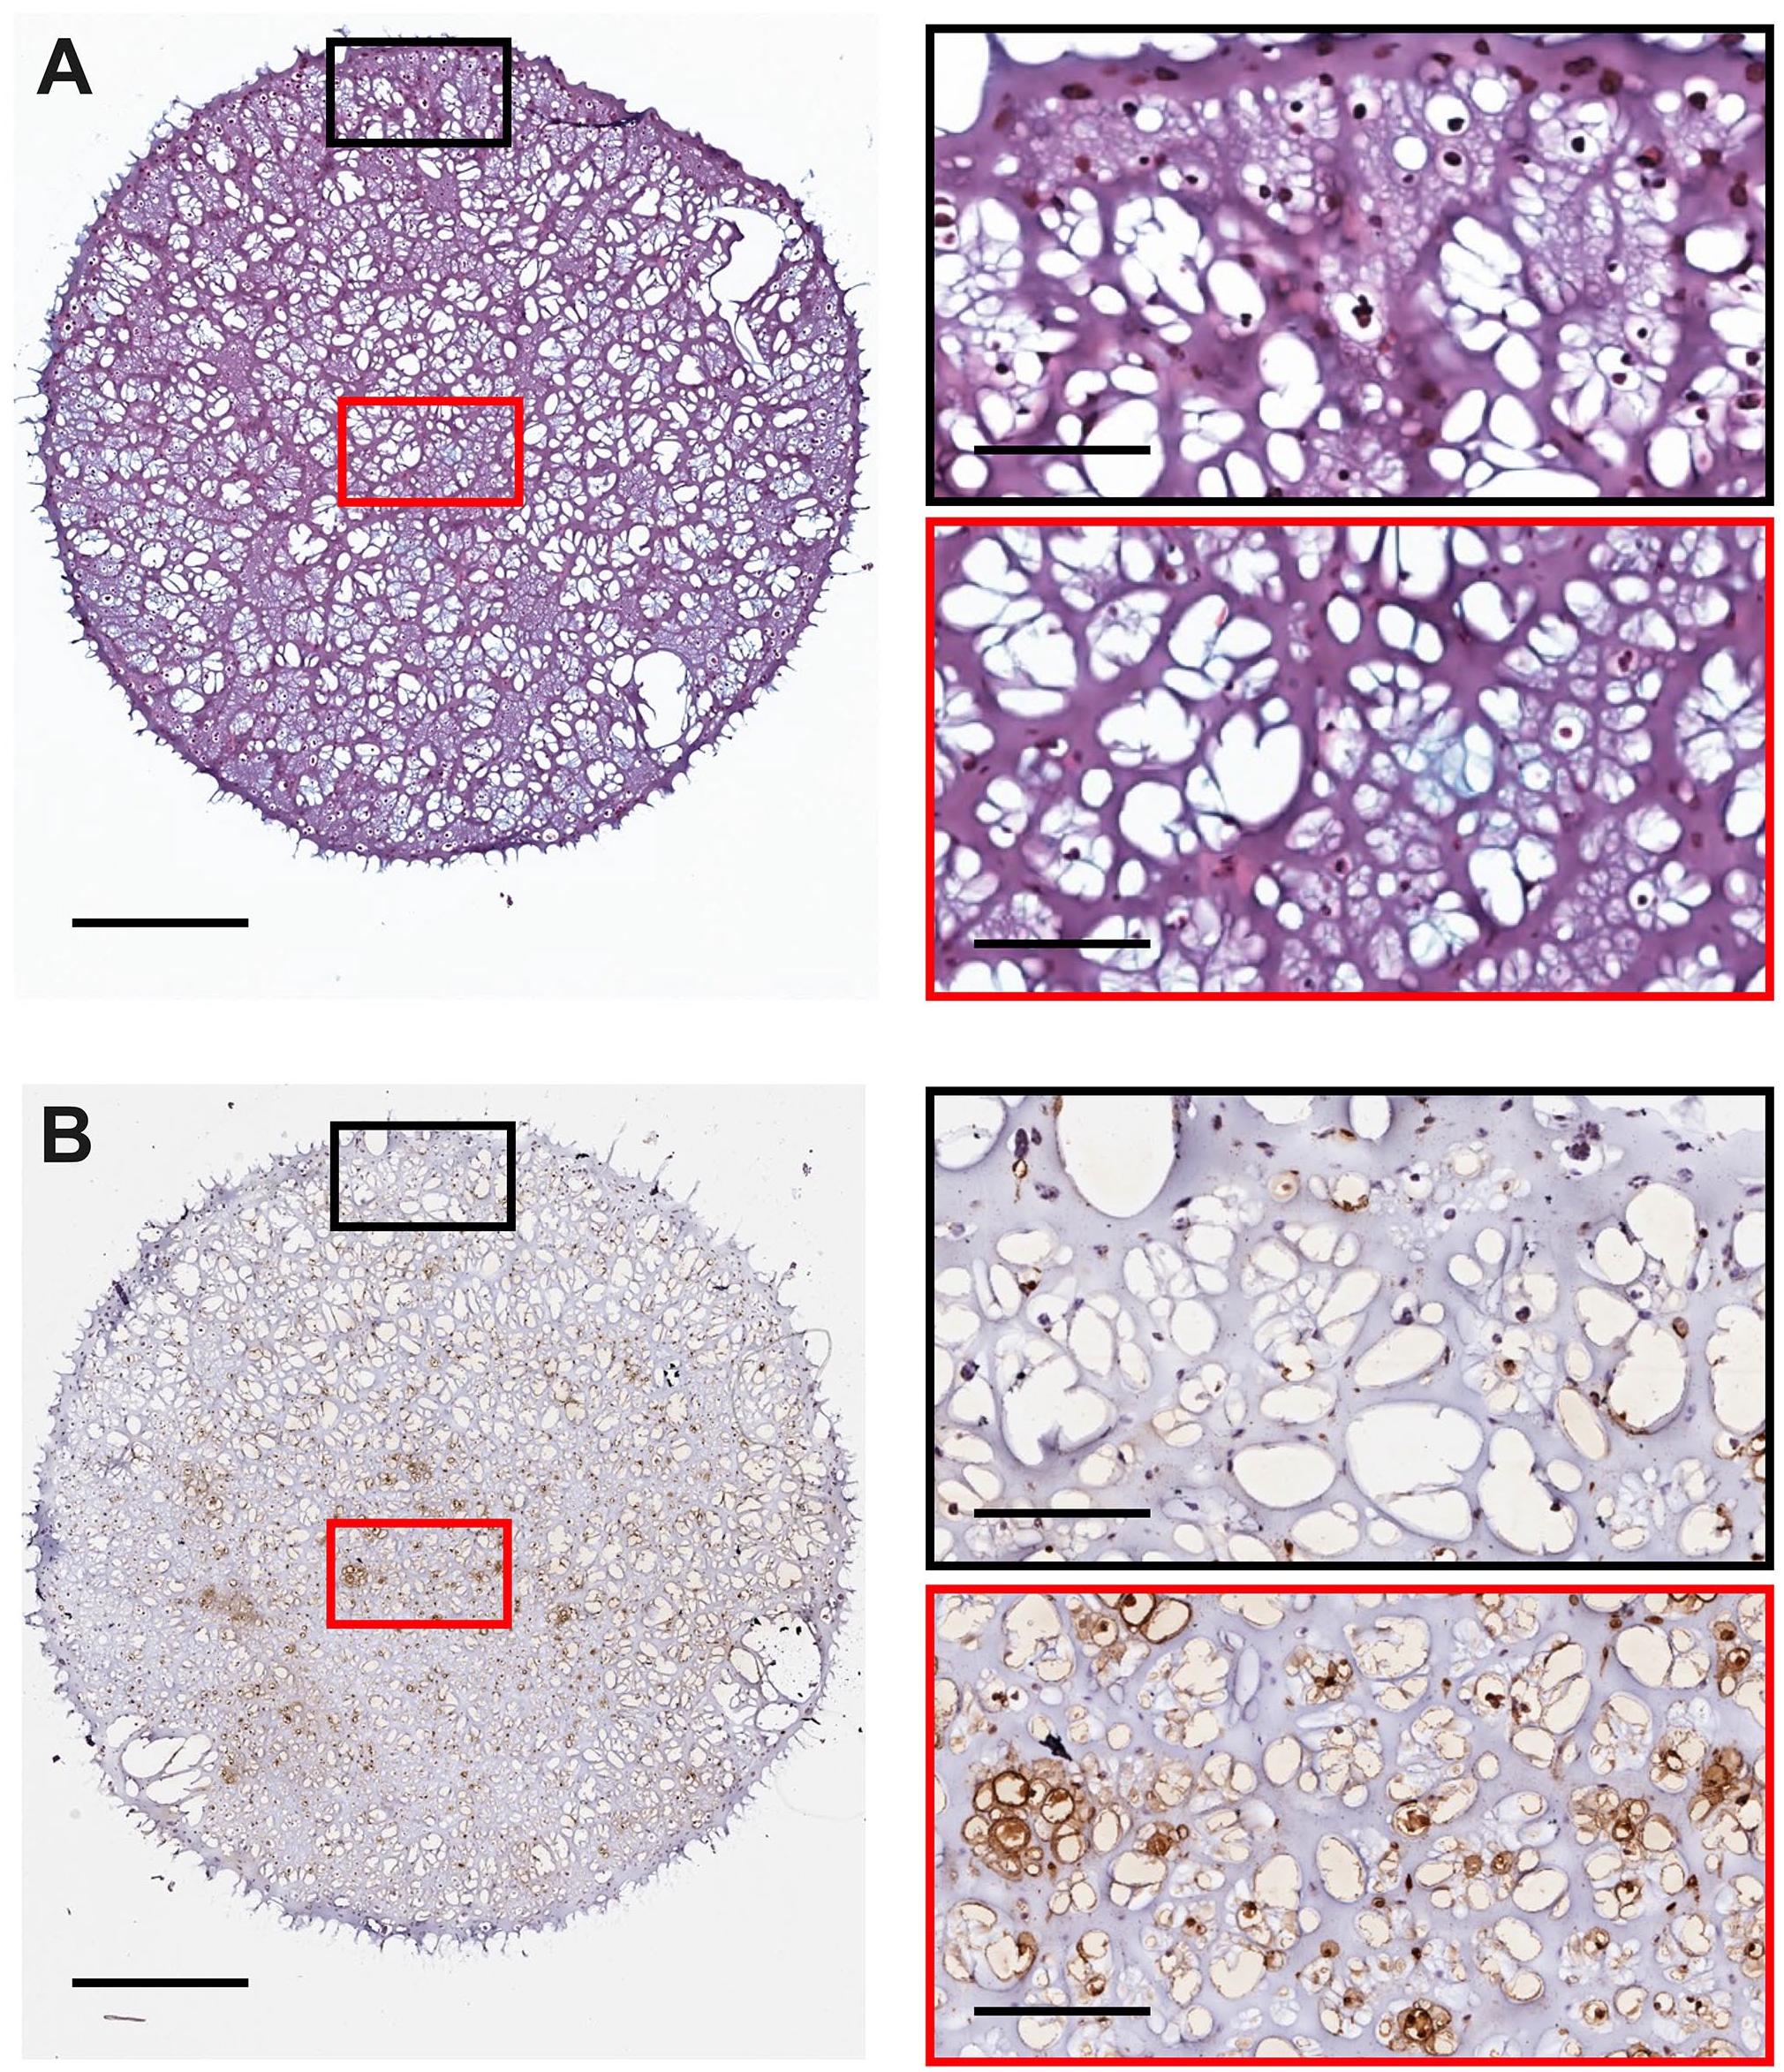
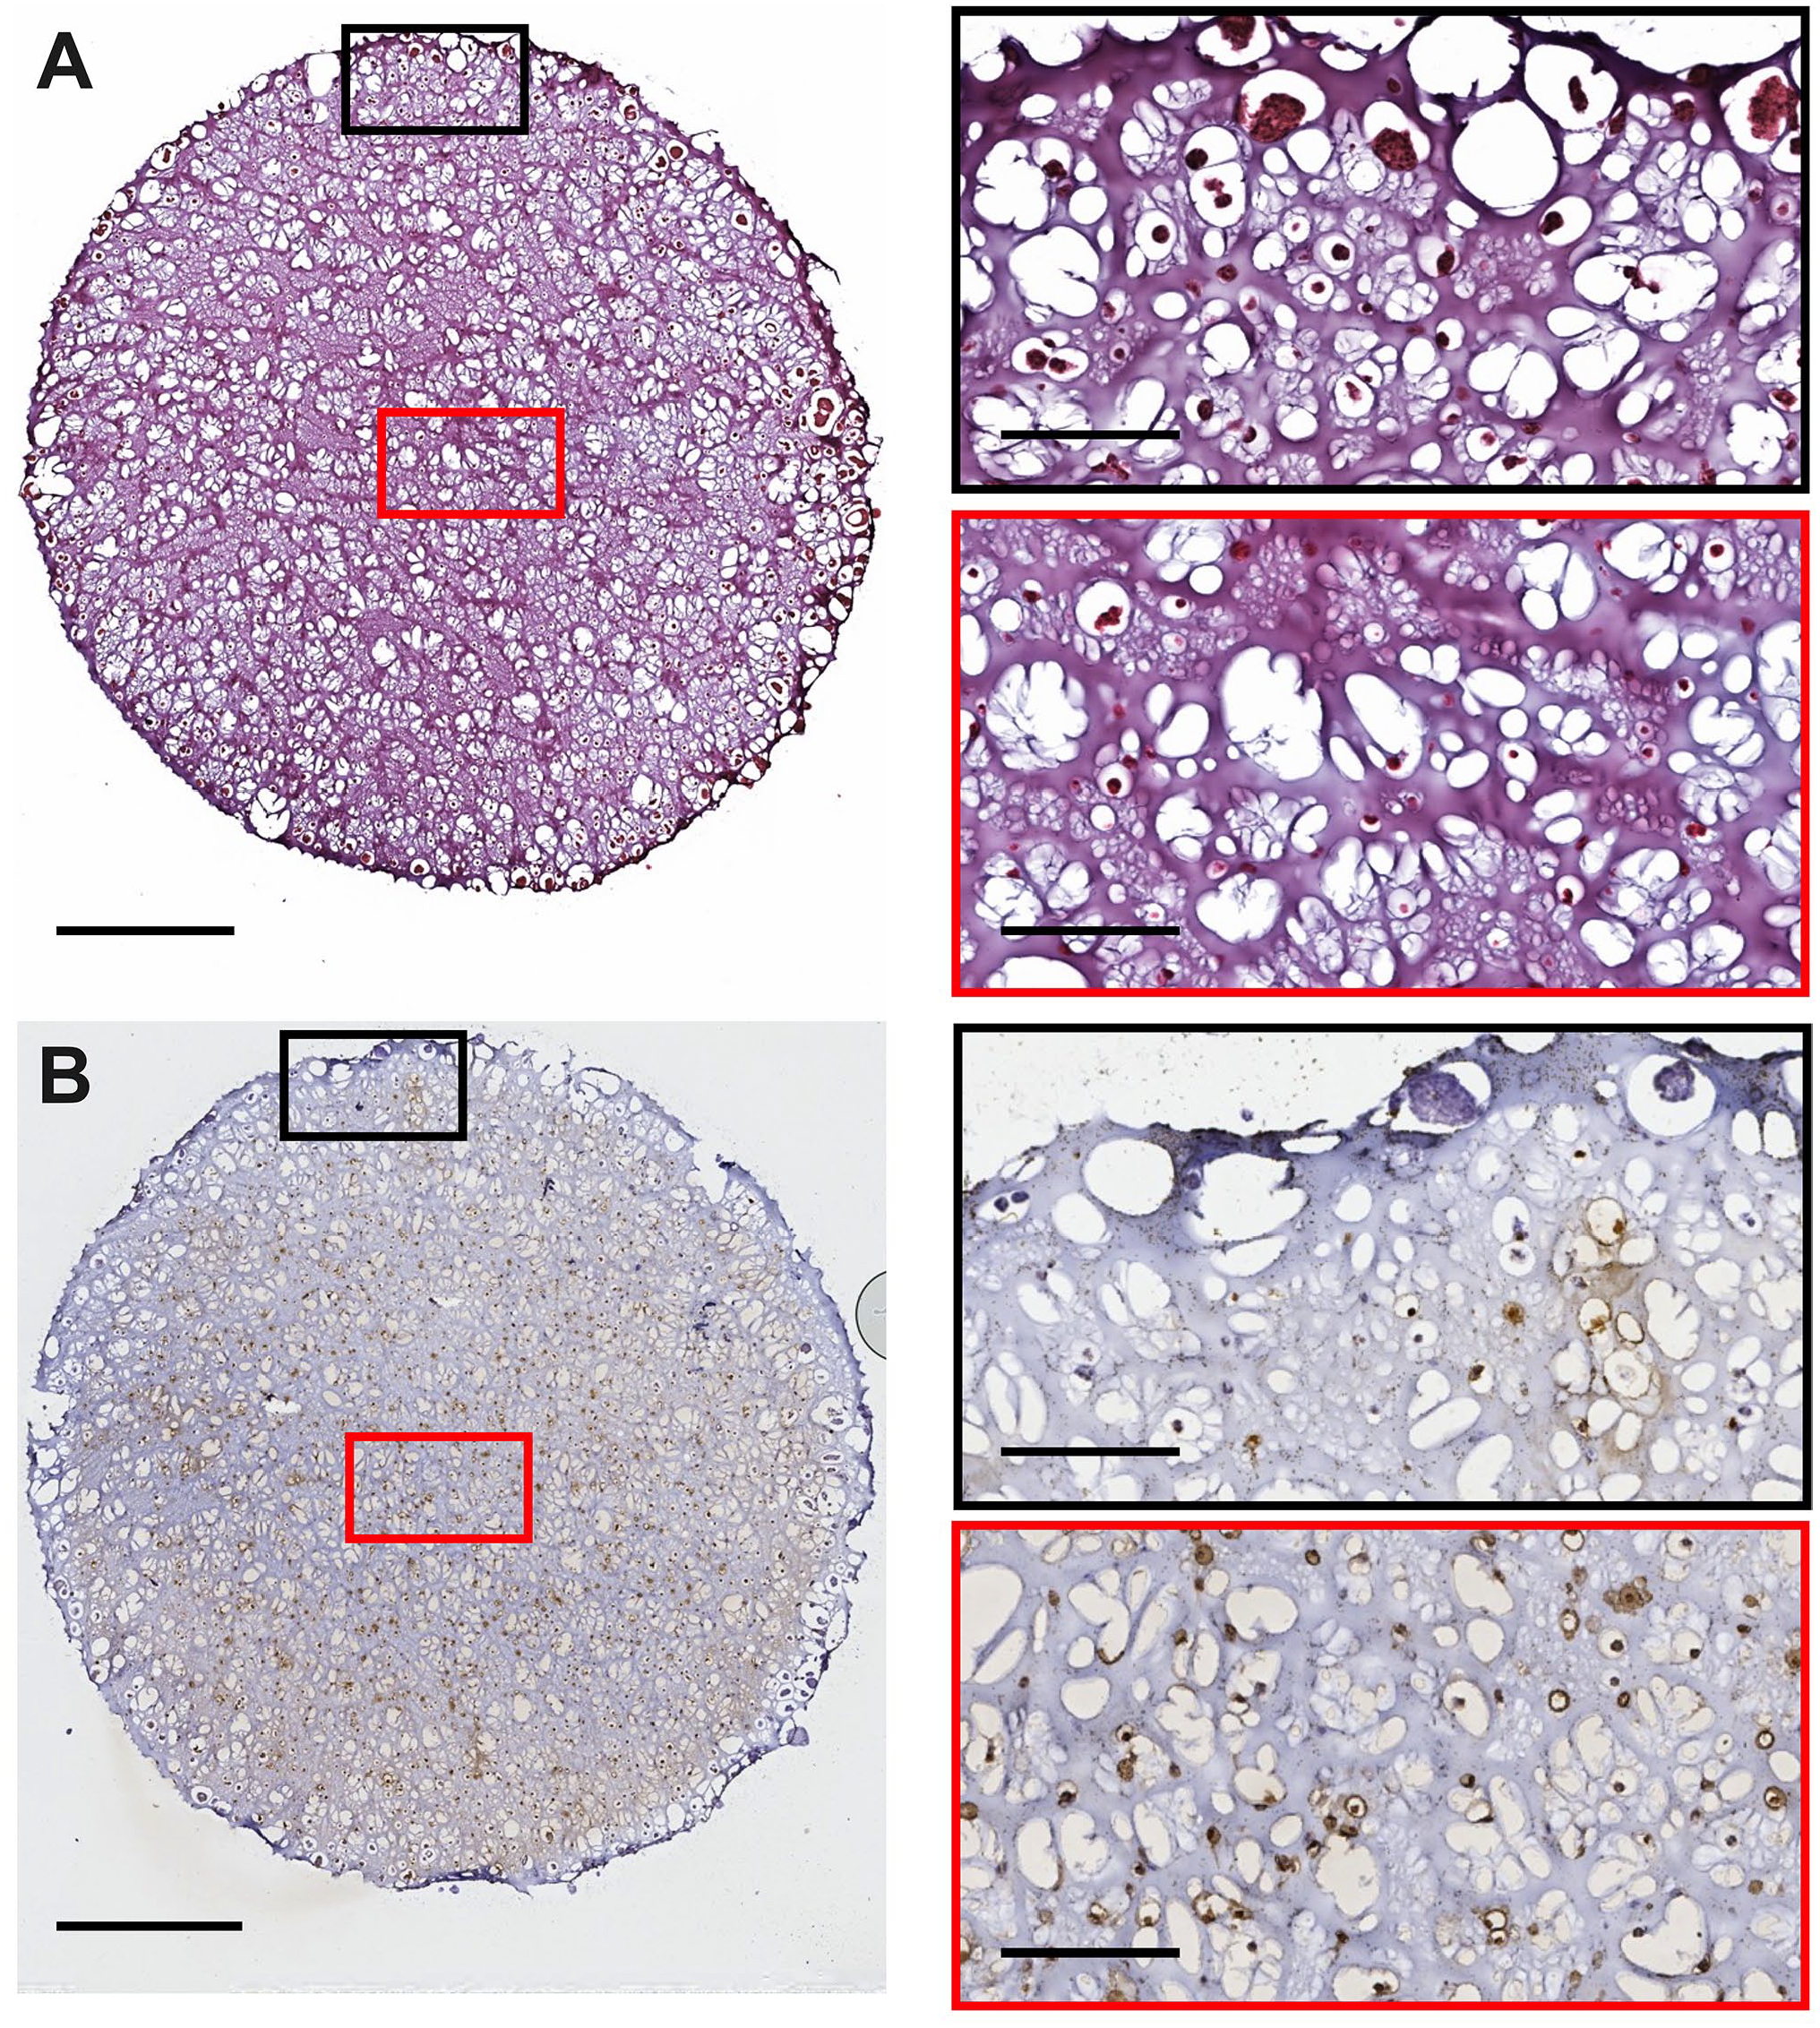
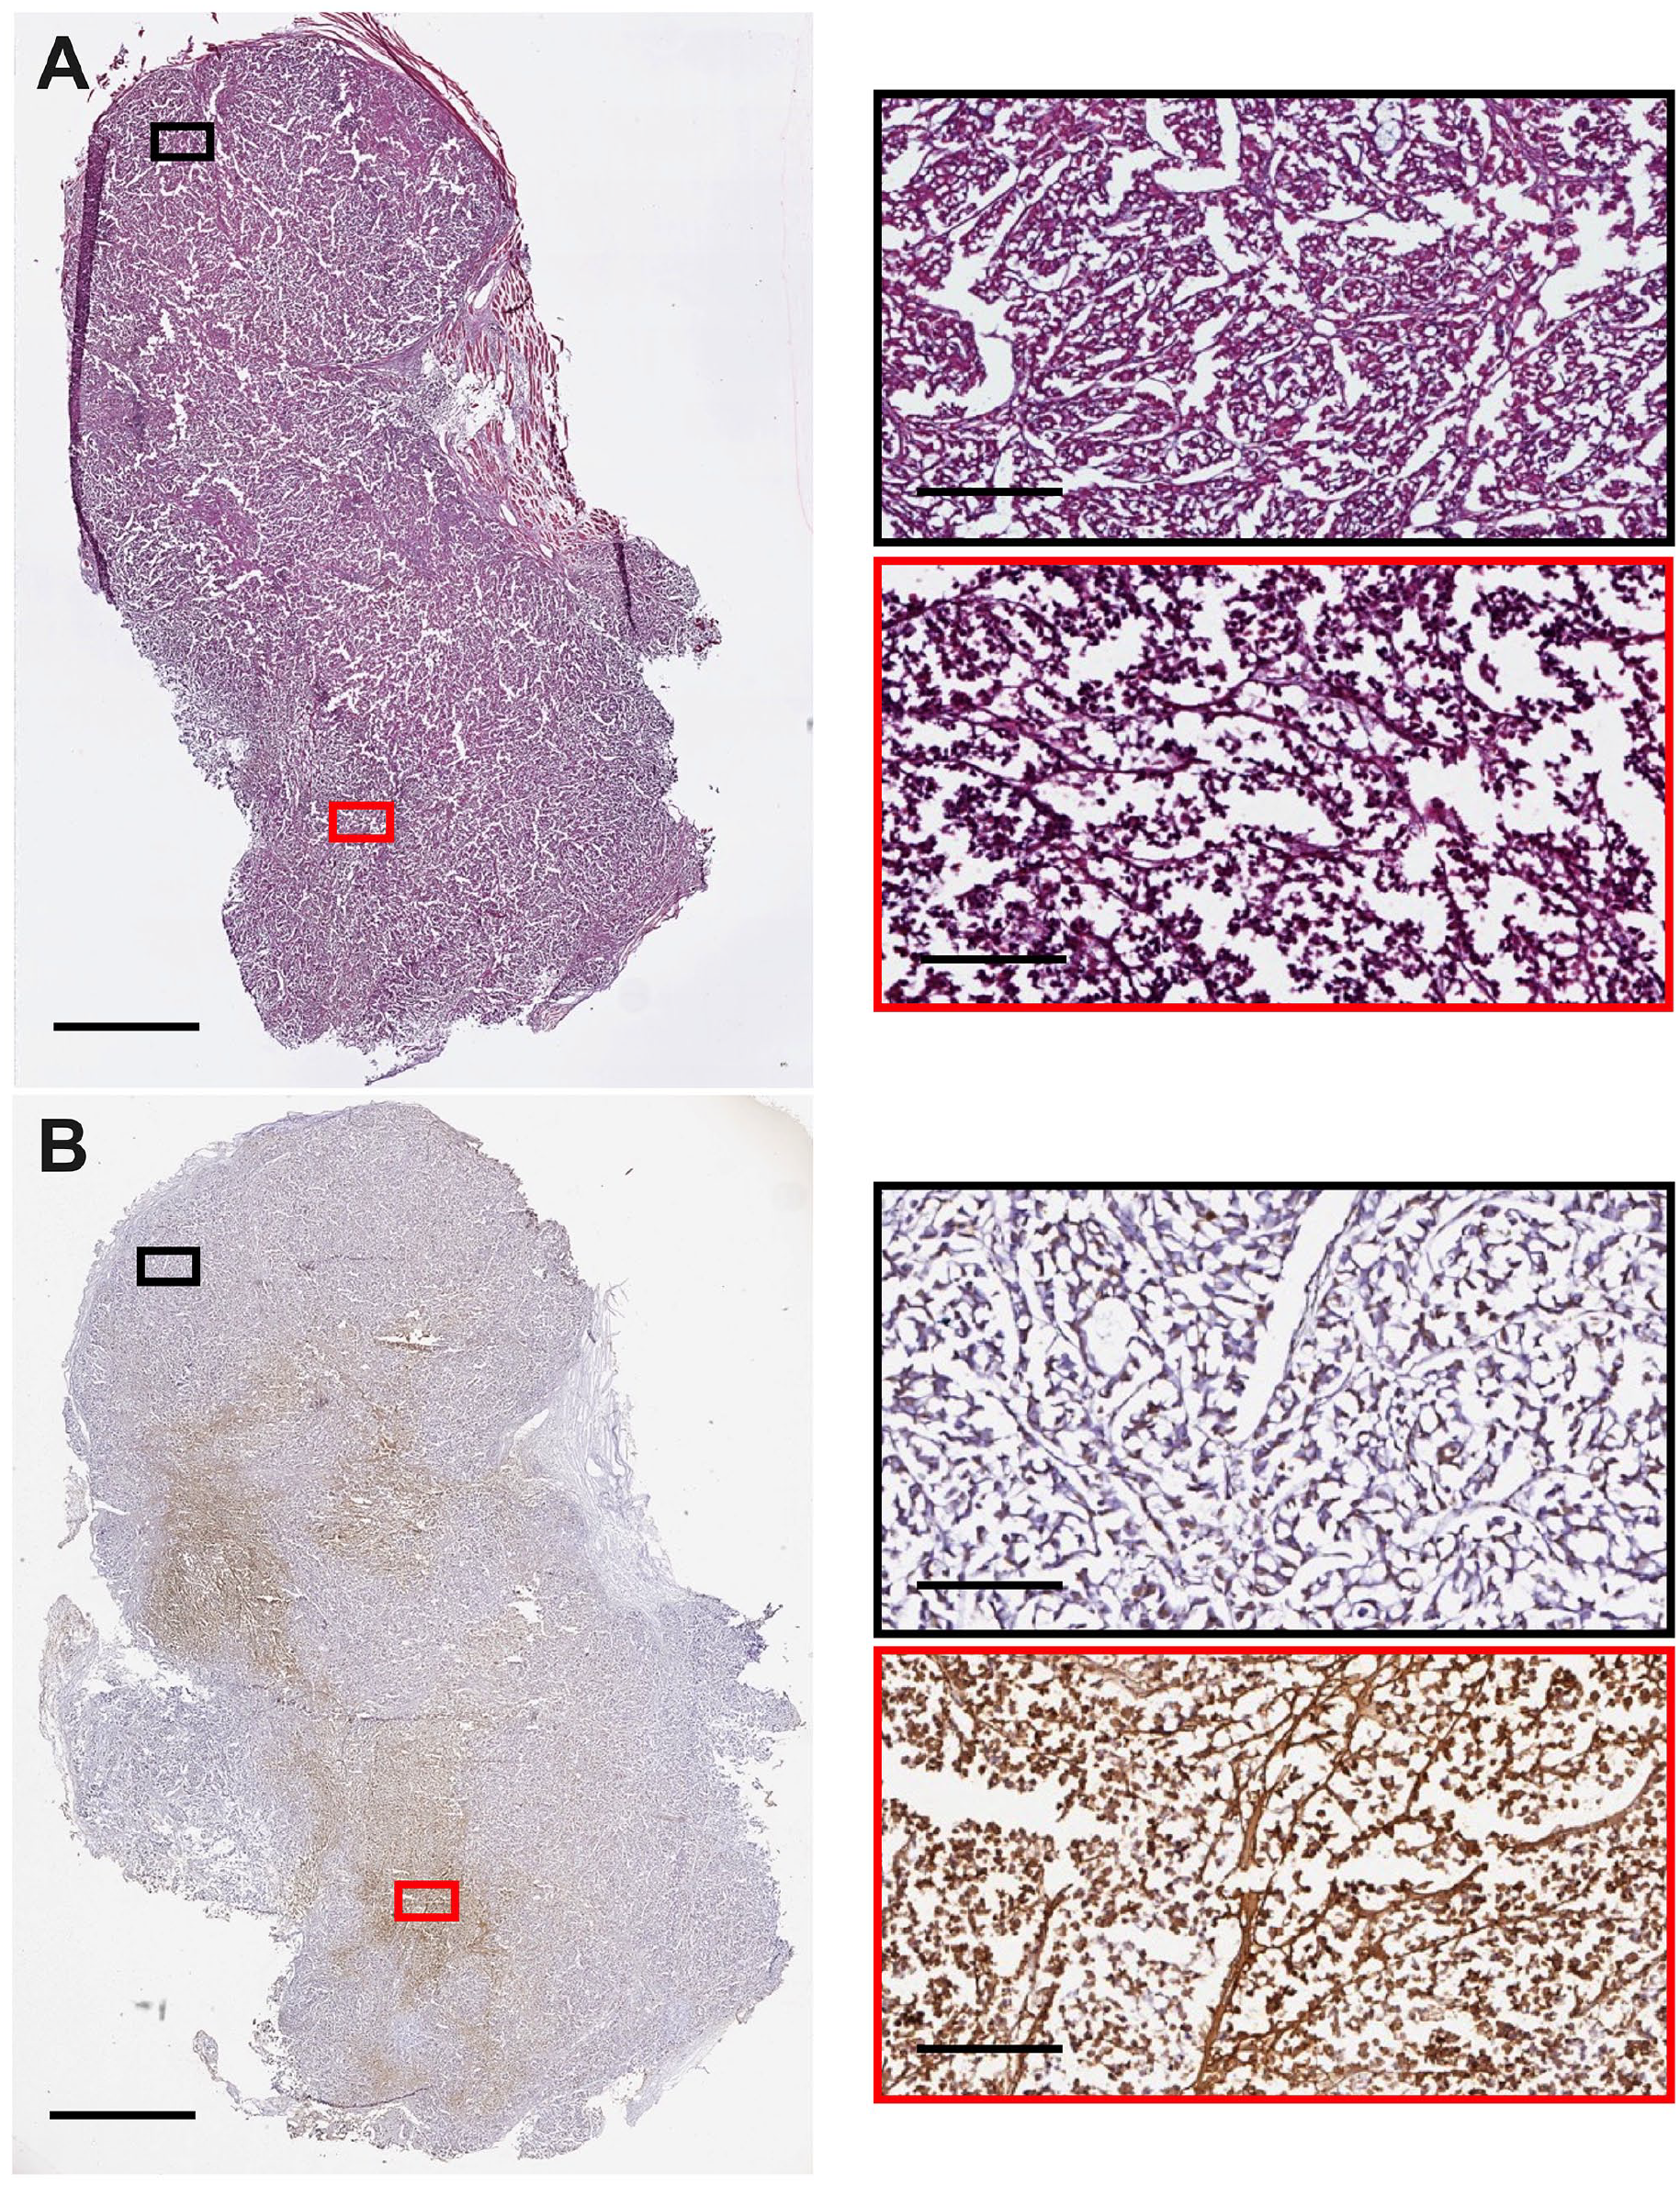
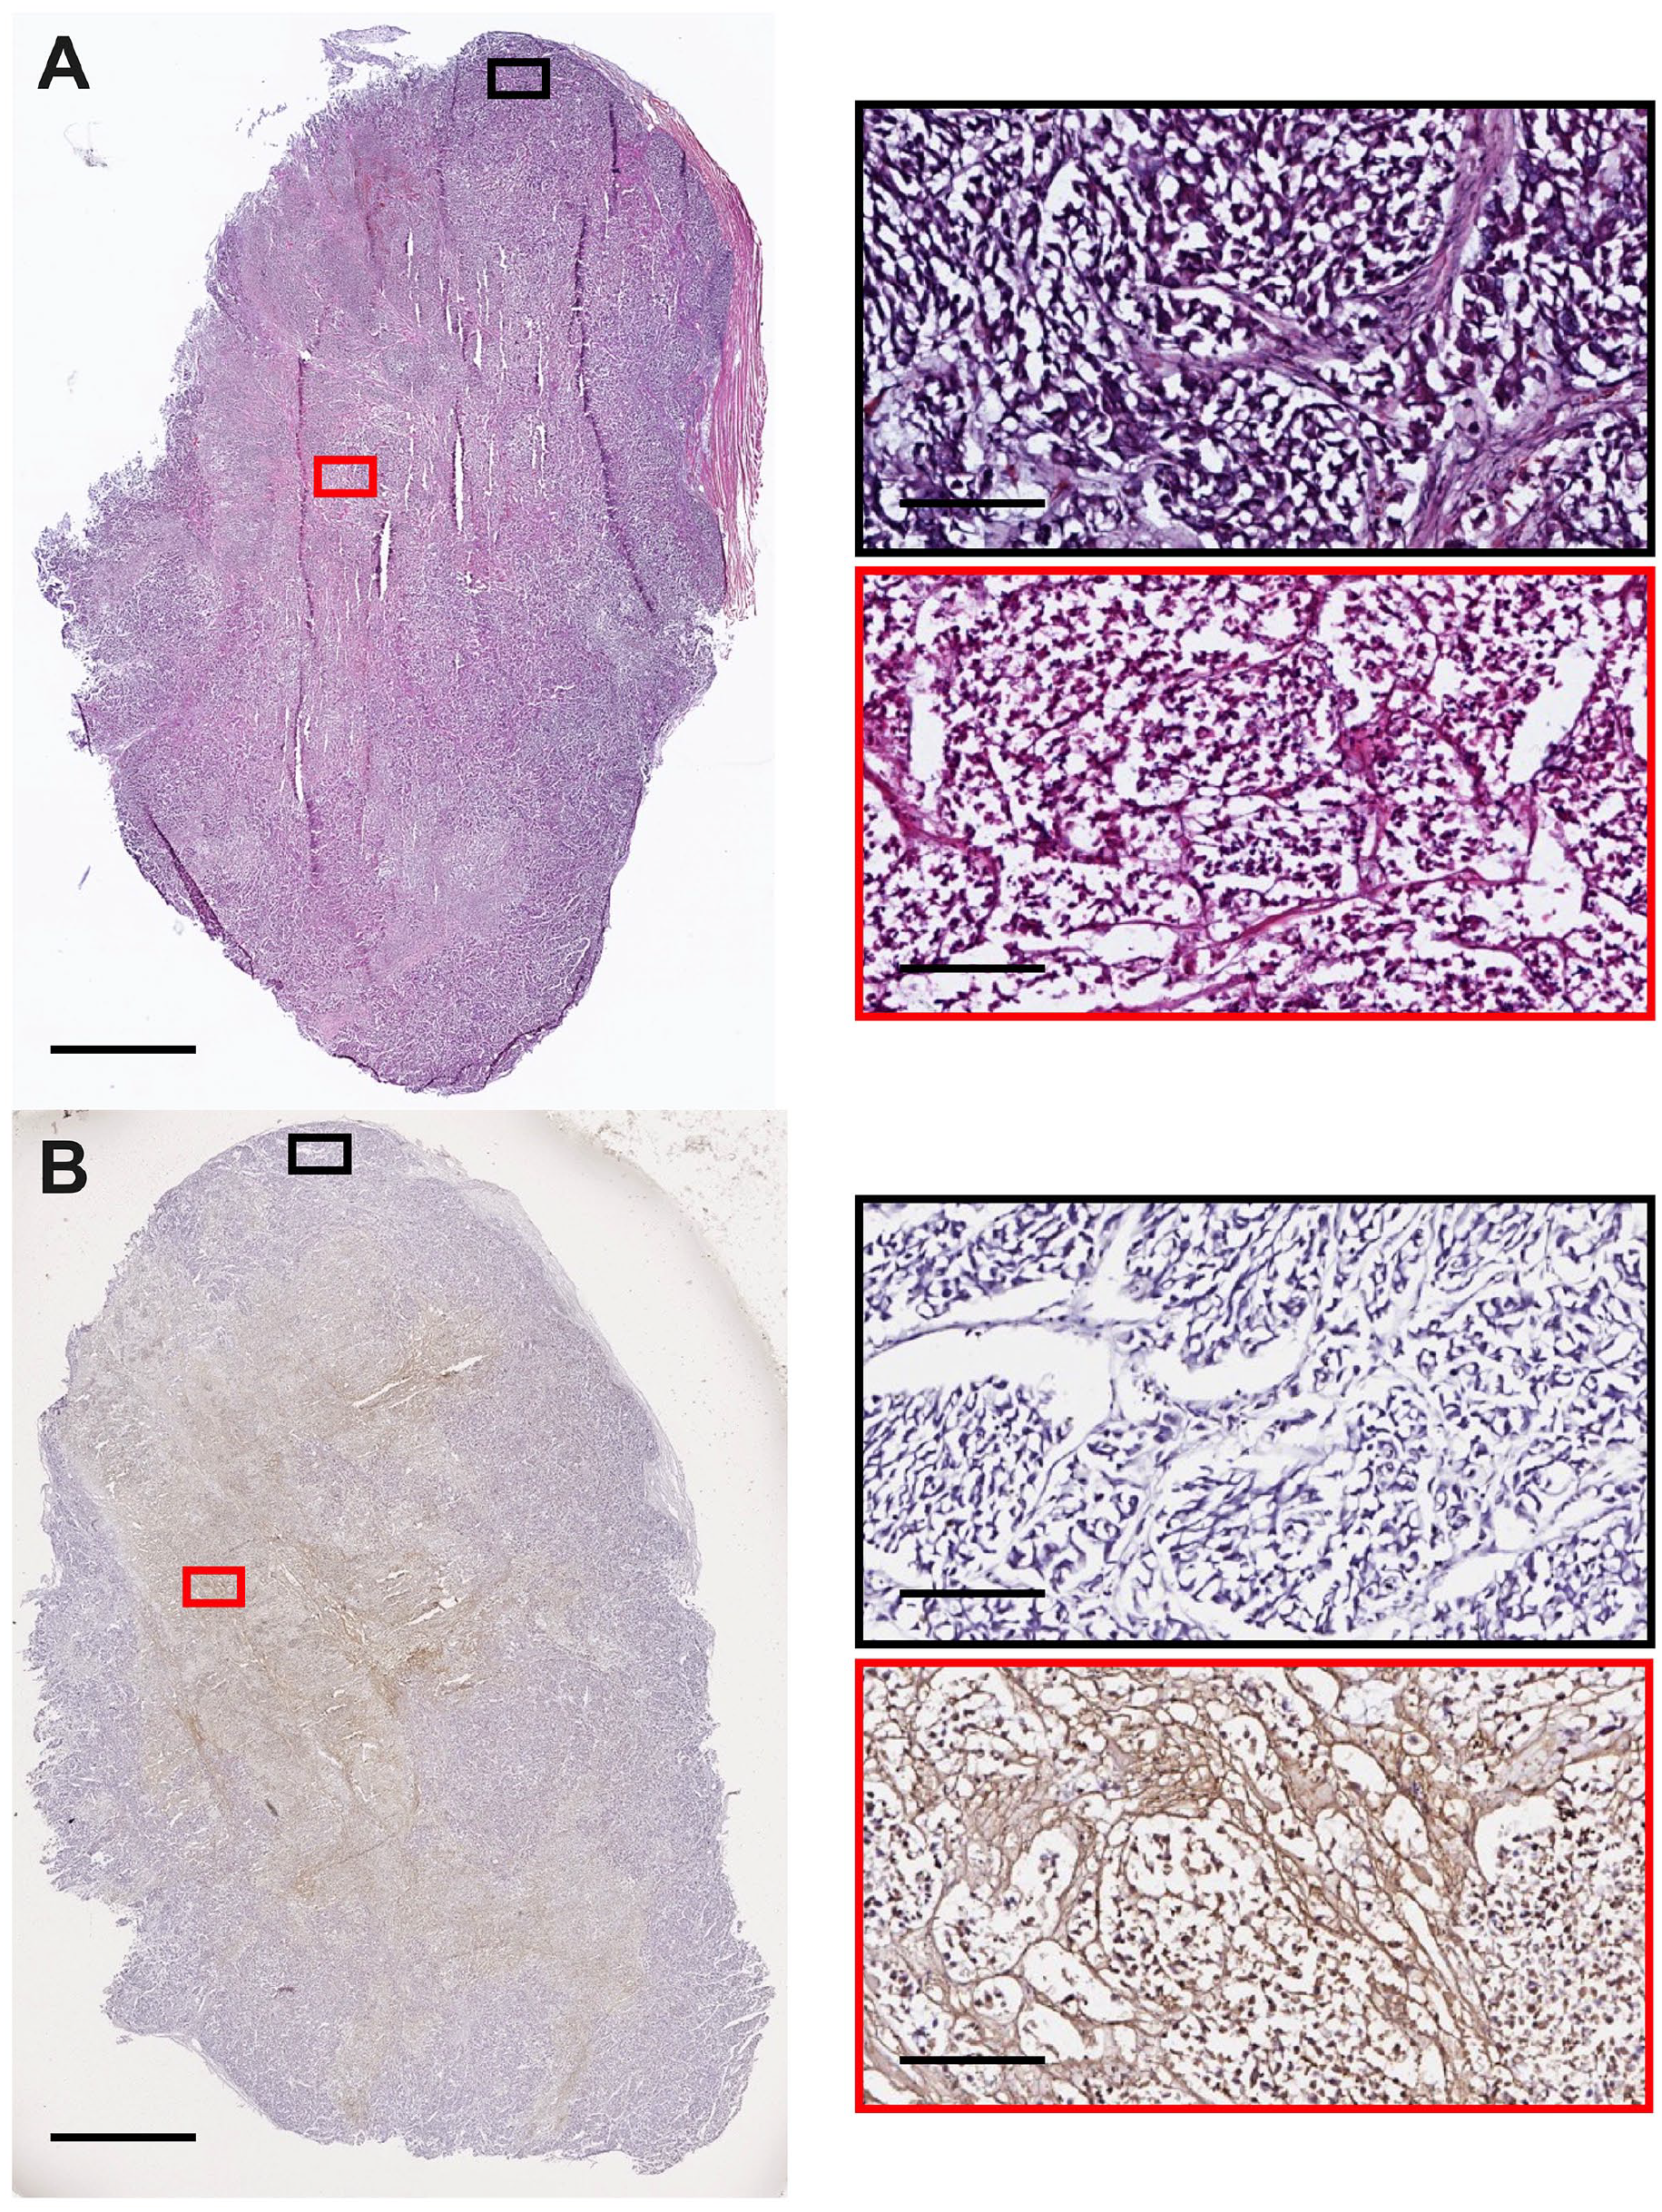
To validate the model and establish time points replicating stages of tumor progression, we first compared H&E and TUNEL staining of sections from 3D cultures and xenografts at each time point. Consistent with the presence of exterior to interior diffusion gradients, H&E staining of 3D cultures consistently showed an outer region characterized by large clusters of cells and an inner region with sparser clusters of cells (Figs. 2A to 4A). Similarly, the xenografts had a dense region within the tumor core, containing cells with small nuclei, and a less dense region on the outer margins containing cells with larger nuclei. This regional density pattern grew more pronounced as the 3D cultures and tumors increased in volume at the middle and late stages of growth (Figs. 7A to 8A). By contrast, during the early stage of growth, the structure of the xenografts appeared almost homogeneous (Figs. 5A to 6A). Corresponding to this pattern, the sparser inner areas of the 3D cultures were typically TUNEL-positive at all time points, with the outer region (i.e., close to the 3D culture surface) containing predominantly TUNEL-negative cells. Over 3 weeks of growth, the presence of TUNEL-positive cells within the interior of the 3D culture grew (Figs. 2B to 4B). Comparatively, the xenograft interior also had significant numbers of TUNEL-positive cells, with a less dense periphery that was TUNEL negative. Smaller xenografts had occasional TUNEL-positive staining in their interiors, though not to the same extent as the middle- and late-stage xenografts (Figs. 5B to 8B).
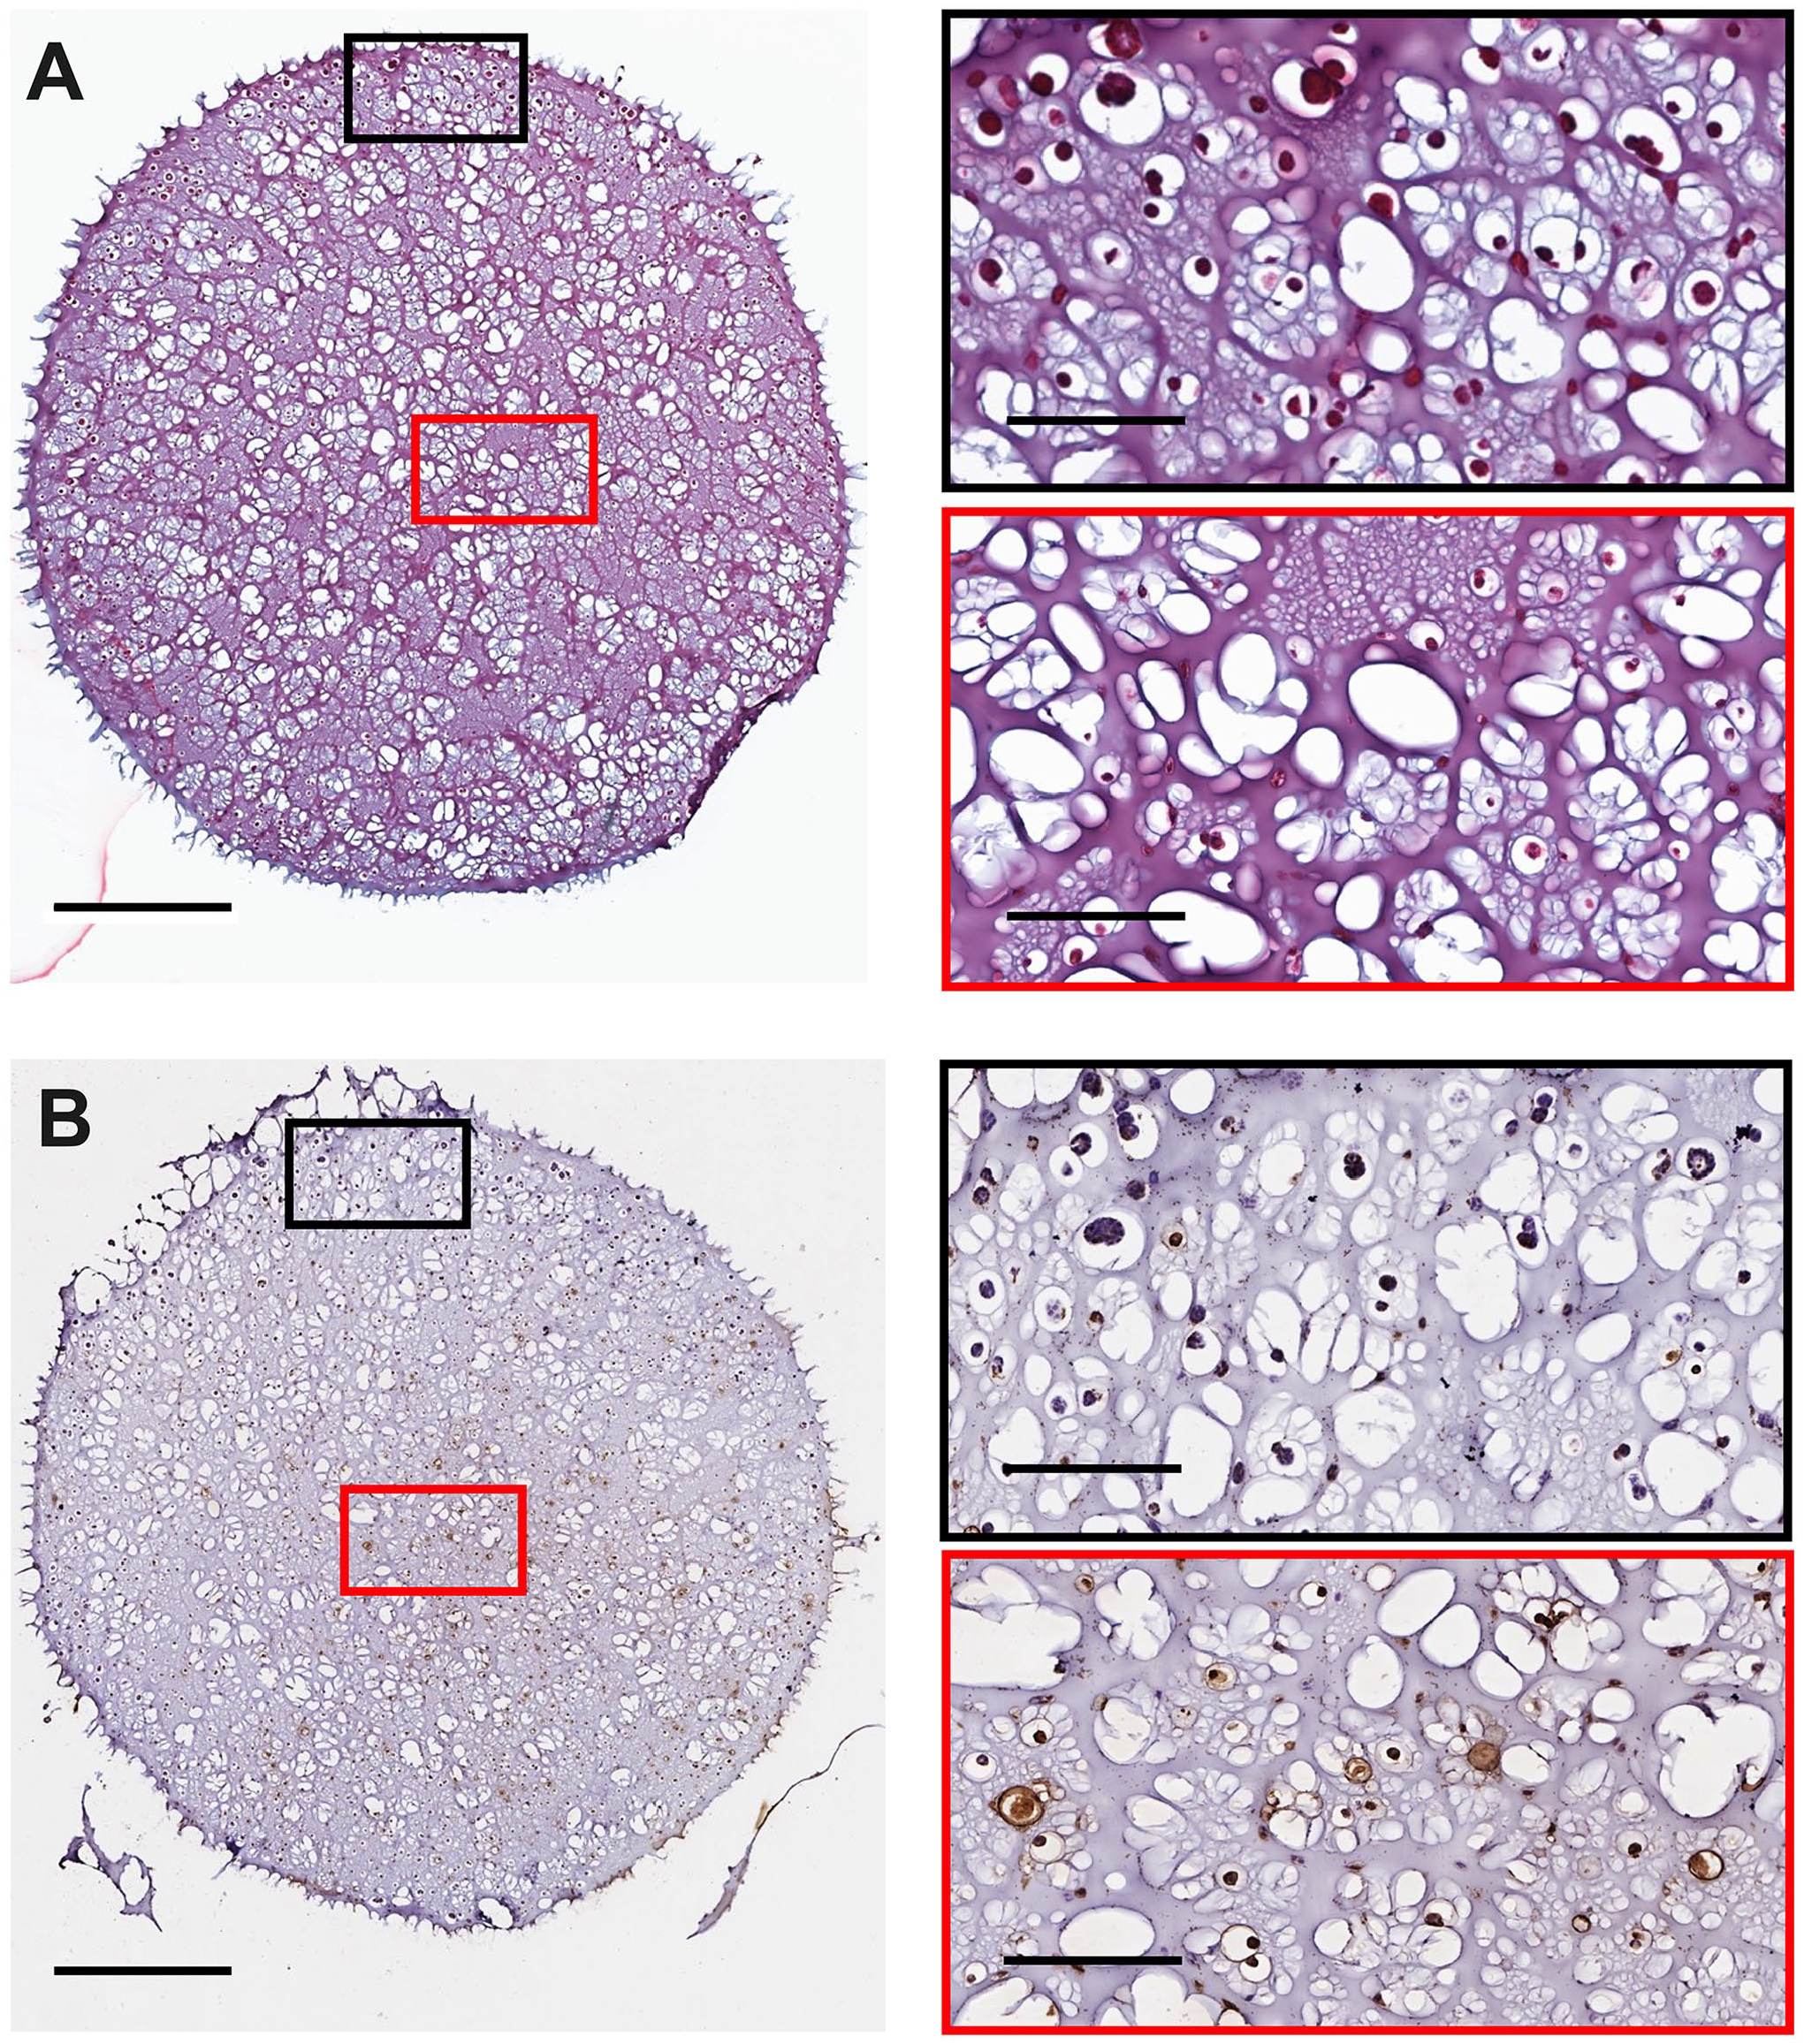
Representative 3D culture histology and cell death staining from a H3122 3D culture at early-stage development (day 7). 3D cultures were seeded at 2.5 × 10⁵ cells per 3D culture. Slices were stained for (A) histology and (B) ApopTag. Images were captured using an Aperio Image ScanScope System. Red/Black boxes on the right correspond to the respective region on the left image. The scale bars represent 1 mm for images on the left and 200 µm for the right.
Representative 3D culture histology and cell death staining from a H3122 3D culture at middle stage development (day 14). 3D cultures were seeded at 2.5 × 10⁵ cells per 3D culture. Slices were stained for (A) histology and (B) ApopTag. Images were captured using an Aperio Image ScanScope System. Red/Black boxes on the right correspond to the respective region on the left image. The scale bars represent 1 mm for images on the left and 200 µm for the right.
Representative 3D culture histology and cell death staining from a H3122 3D culture at late-stage development (day 21). 3D cultures were seeded at 2.5 × 10⁵ cells per 3D culture. Slices were stained for (A) histology and (B) ApopTag. Images were captured using an Aperio Image ScanScope System. Red/Black boxes on the right correspond to the respective region on the left image. The scale bars represent 1 mm for images on the left and 200 µm for the right.
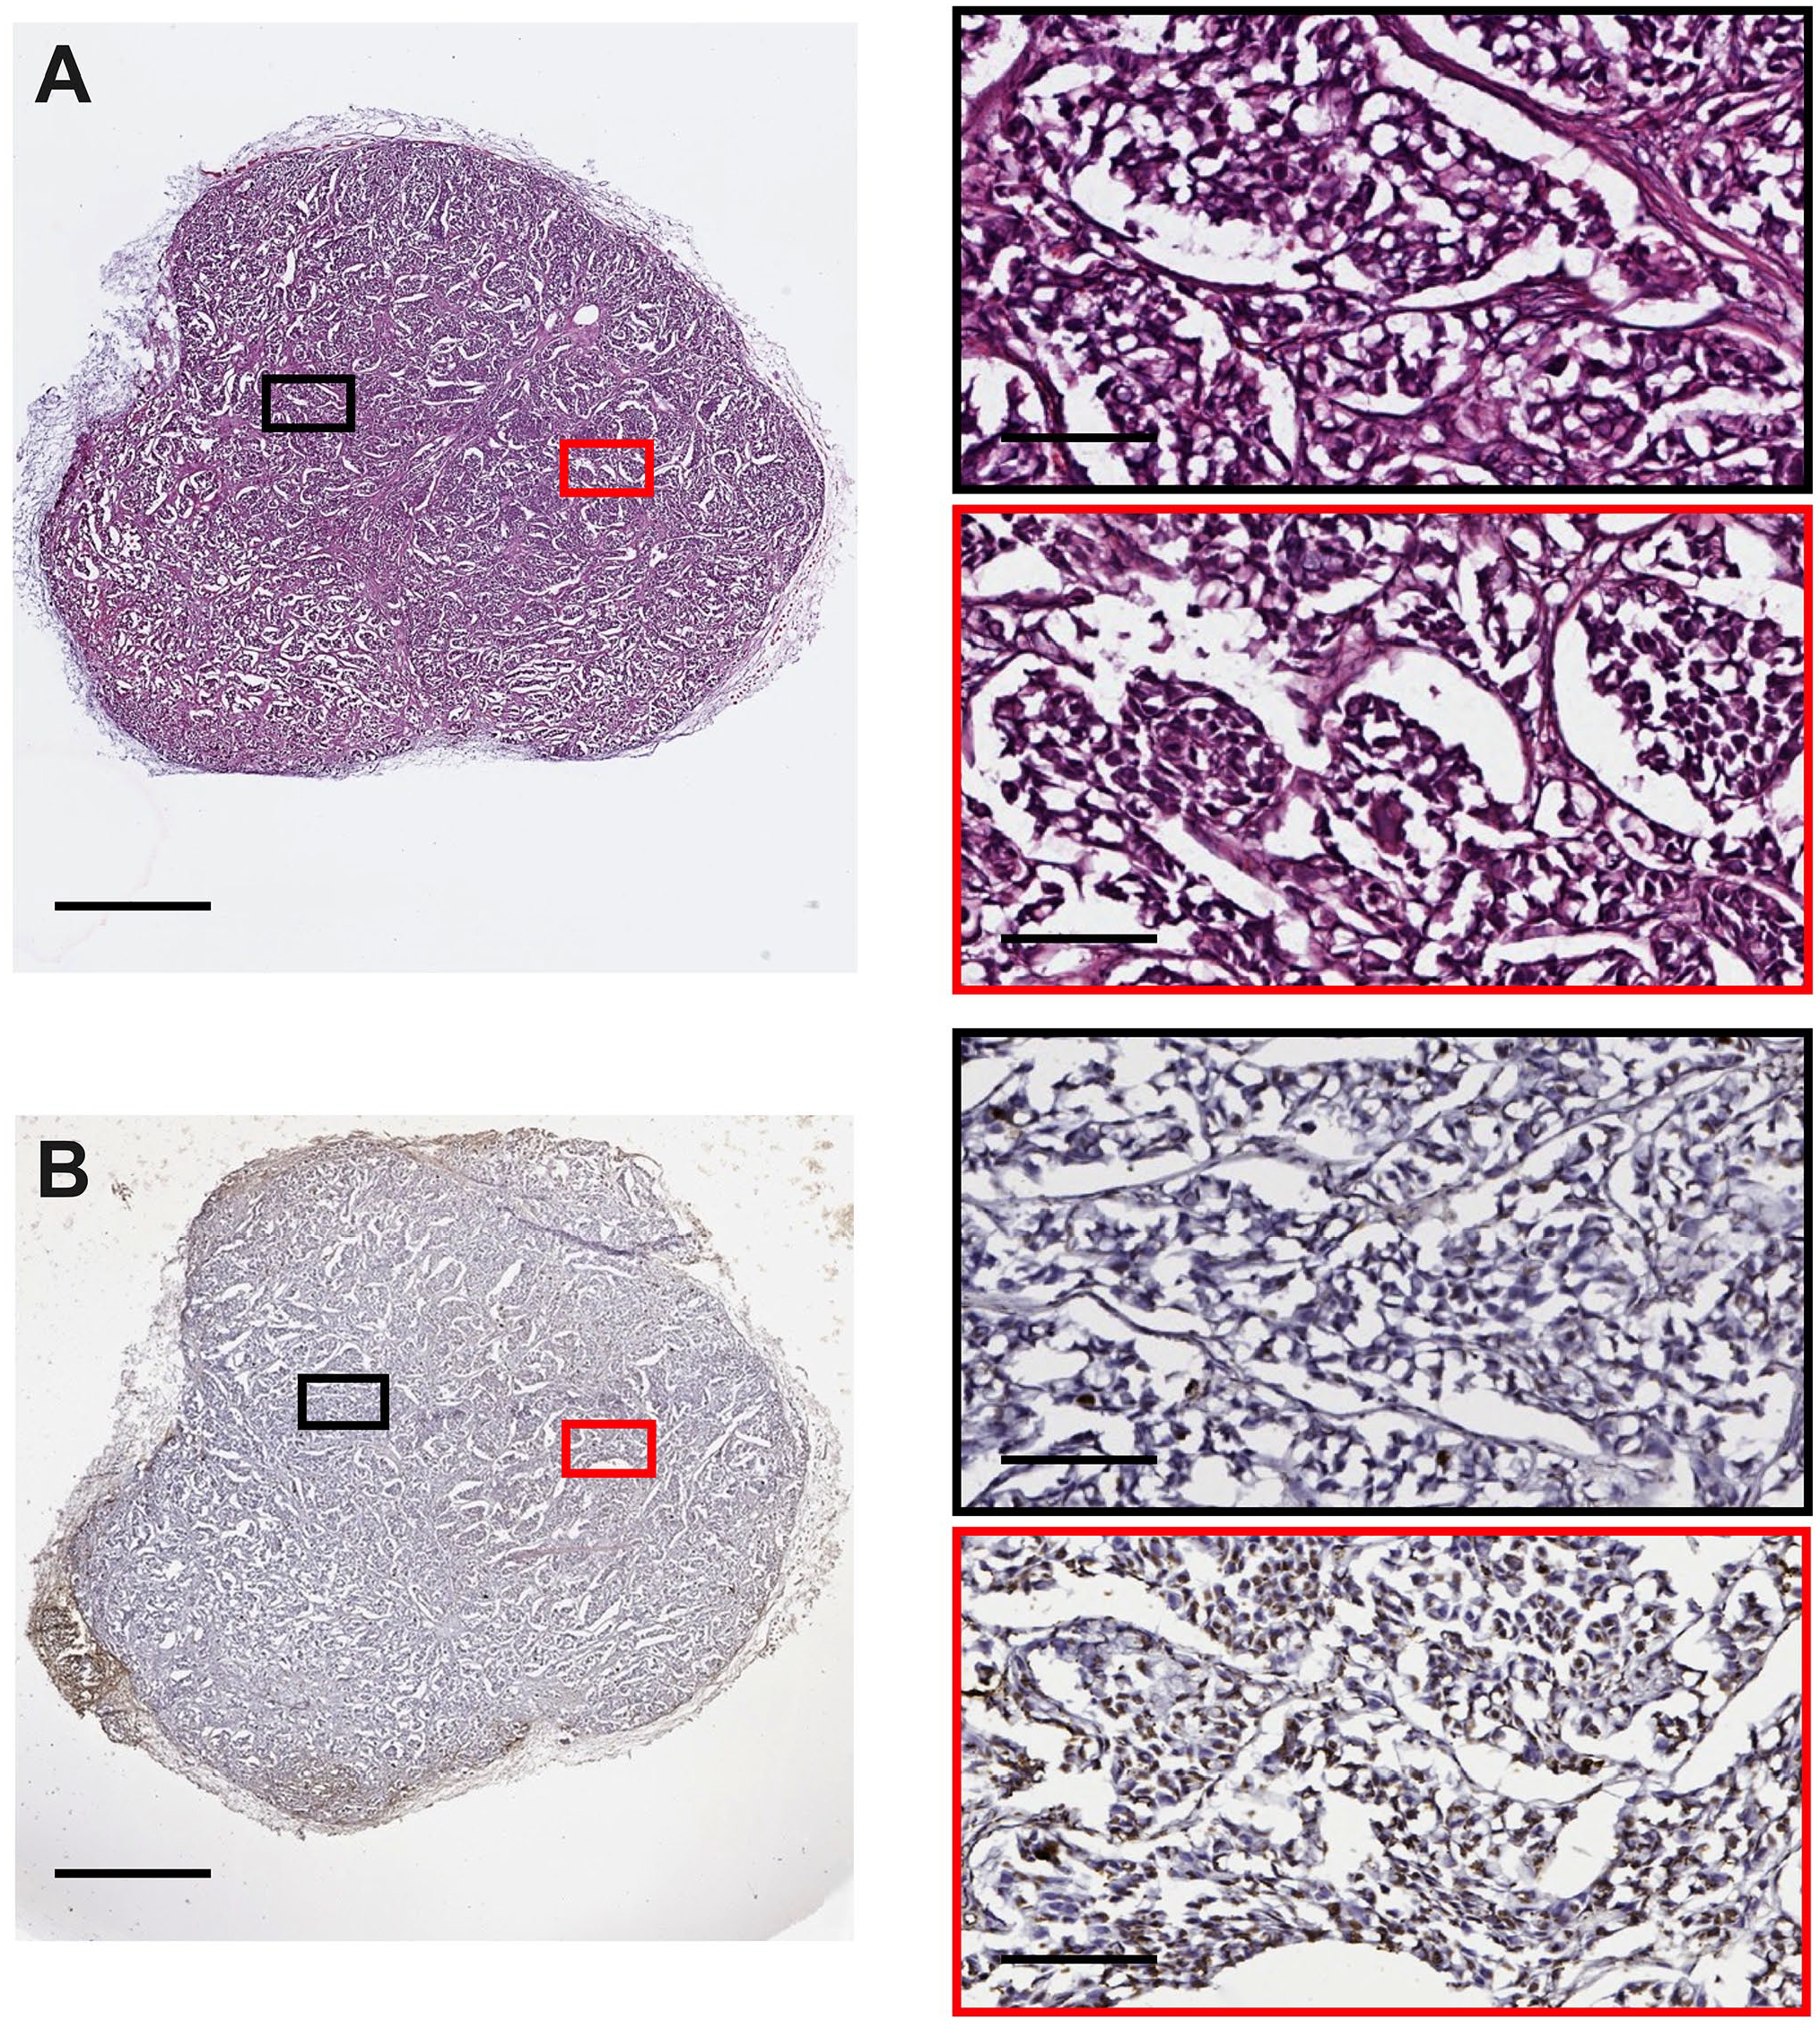
Representative tumor histology and cell death staining from an NSG mouse bearing an H3122 xenograft at early-stage development (100 mm3). 3D culture slices were stained for (A) histology and (B) ApopTag. Images were captured using an Aperio Image ScanScope System. Red/Black boxes on the right correspond to the respective region on the left image. The scale bars represent 1 mm for images on the left and 100 µm for the right.
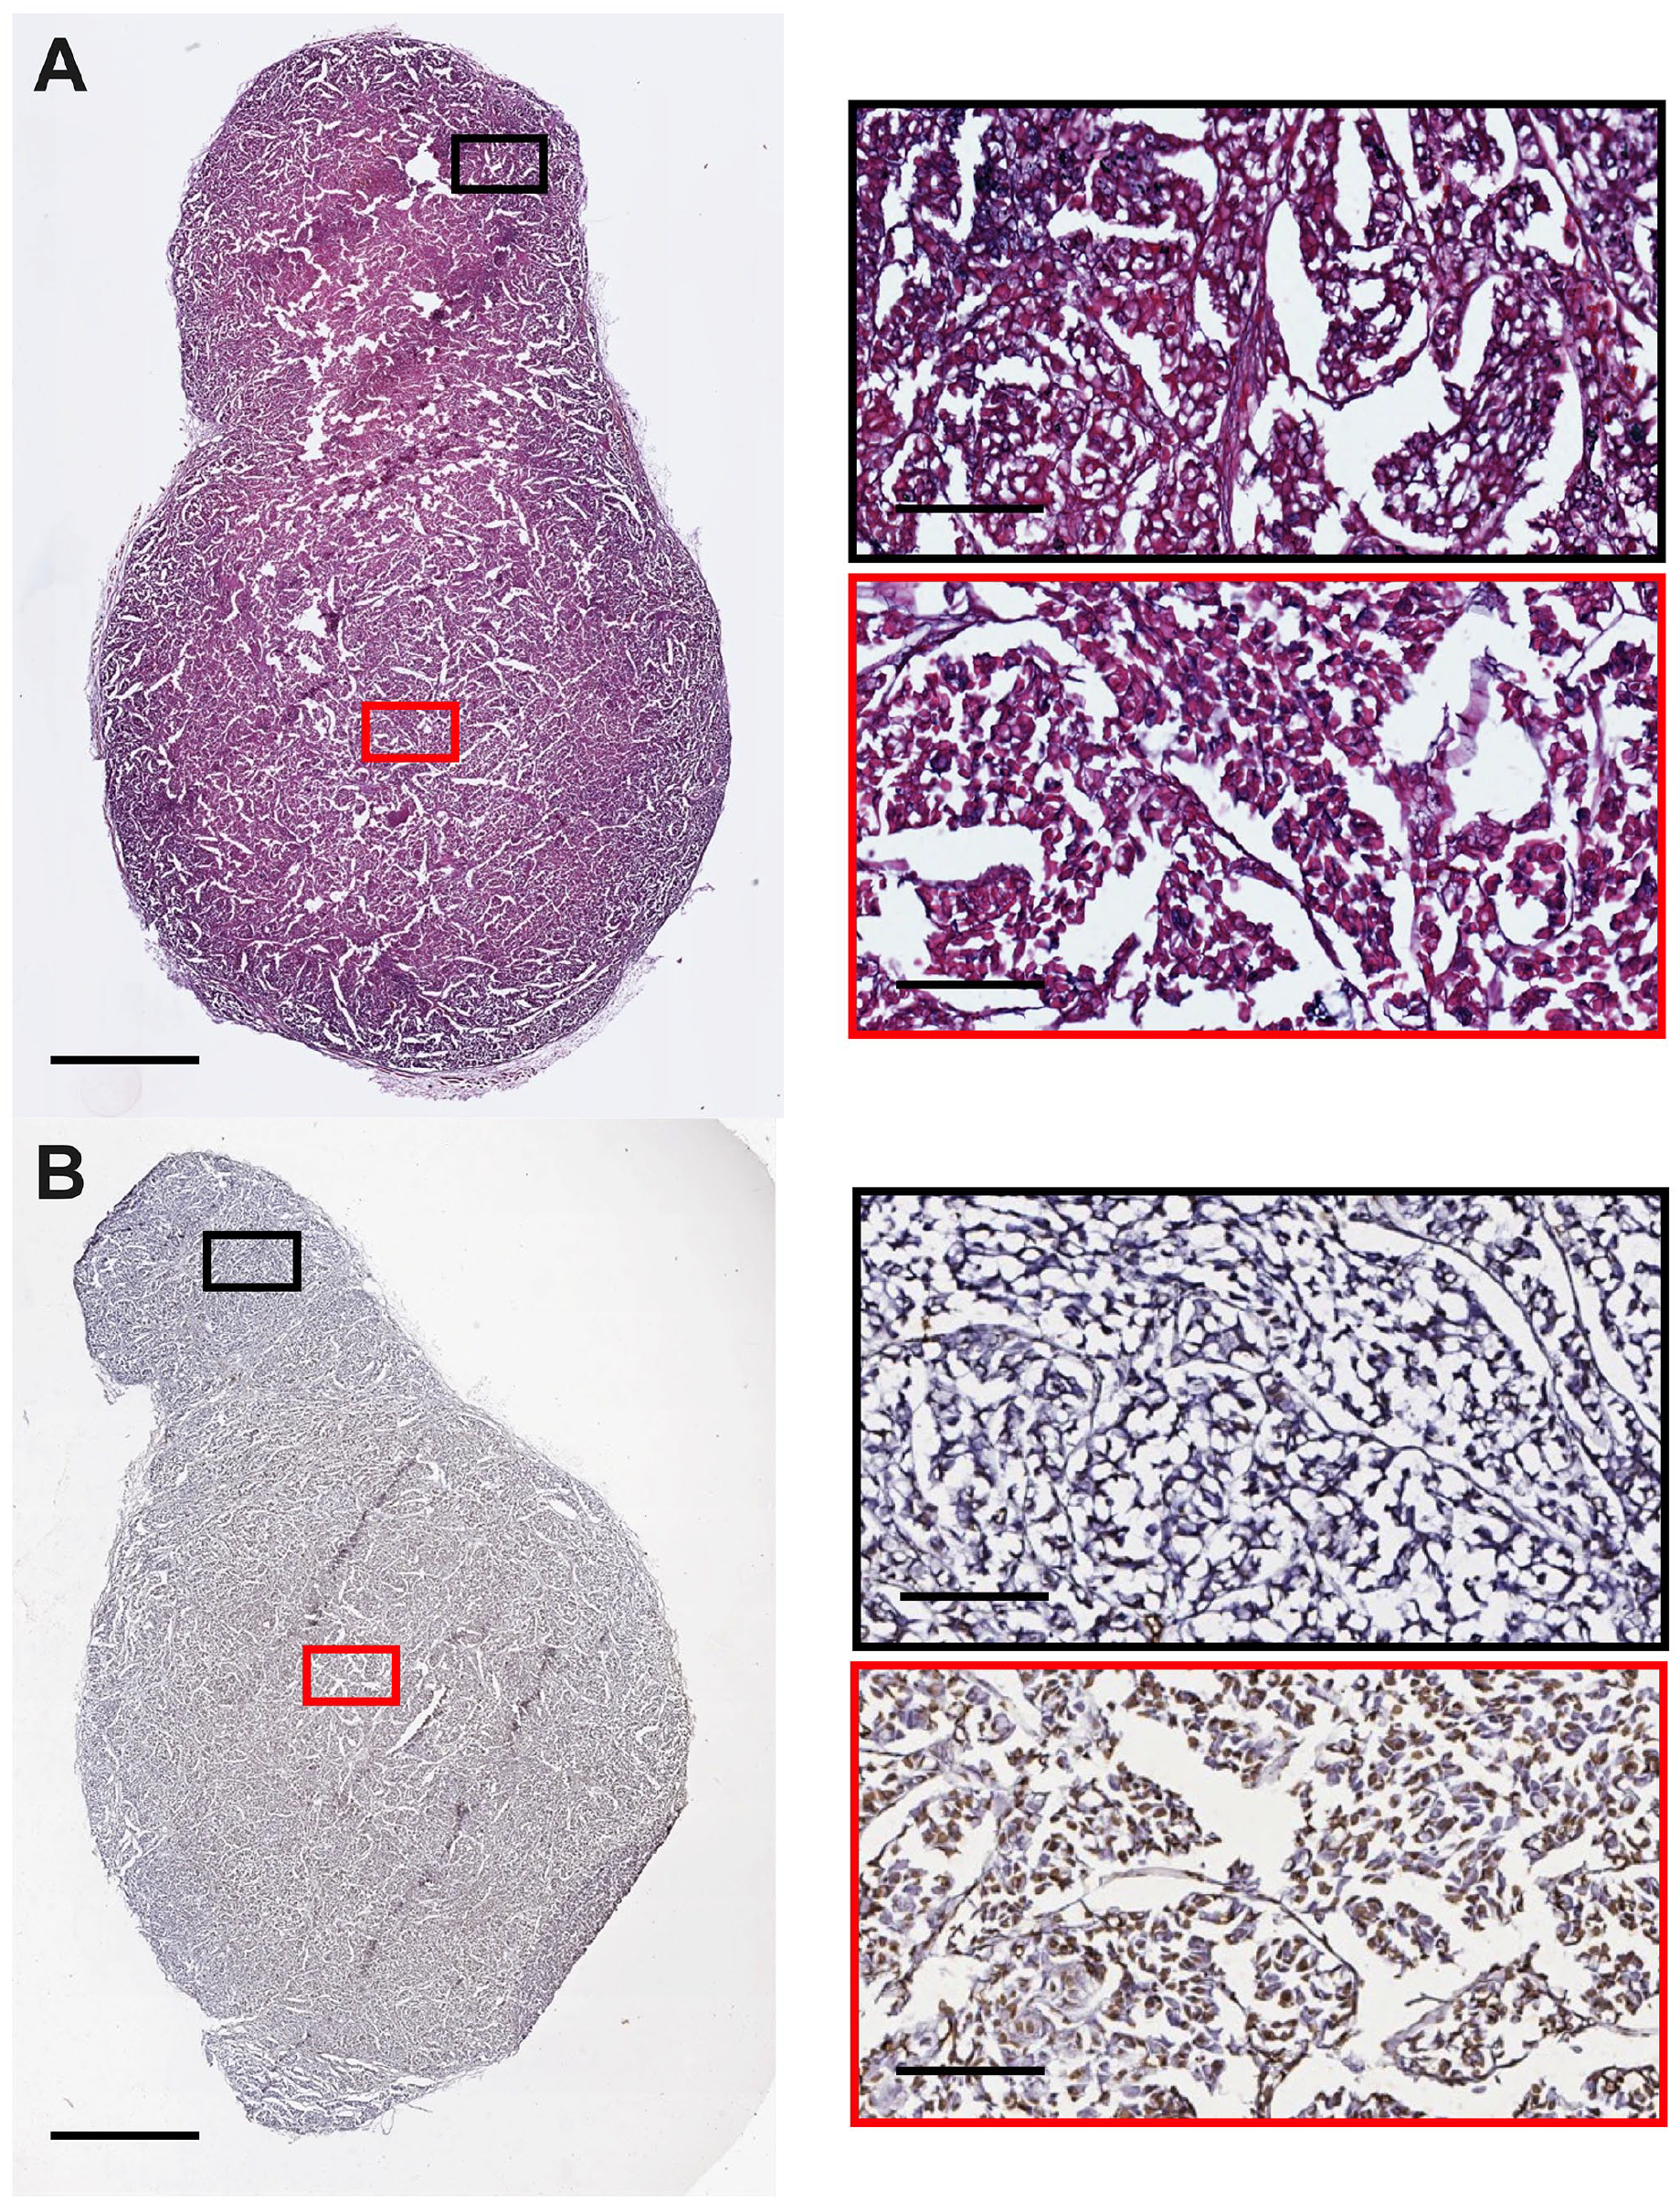
Representative tumor histology and cell death staining from an NSG mouse bearing an H3122 xenograft at middle stage development (7 days post 100 mm3). 3D culture slices were stained for (A) histology and (B) ApopTag. Images were captured using an Aperio Image ScanScope System. Red/Black boxes on the right correspond to the respective region on the left image. The scale bars represent 1.5 mm for images on the left and 200 µm for the right.
Representative tumor histology and cell death staining from an NSG mouse bearing an H3122 xenograft at late stage development (14 days post 100 mm3). 3D culture slices were stained for (A) histology and (B) ApopTag. Images were captured using an Aperio Image ScanScope System. Red/Black boxes on the right correspond to the respective region on the left image. The scale bars represent 2.5 mm for images on the left and 300 µm for the right.
Representative tumor histology and cell death staining from an NSG mouse bearing an H3122 xenograft at late-stage development (1500 mm3). 3D culture slices were stained for (A) histology and (B) ApopTag. Images were captured using an Aperio Image ScanScope System. Red/Black boxes on the right correspond to the respective region on the left image. The scale bars represent 2.5 mm for images on the left and 300 µm for the right.
When we measured the percentage of TUNEL-positive cells in sections for the middle- and late-stage 3D cultures, there was a significant 0.24-fold and 0.32-fold increase, respectively, compared with early stage (p<0.01, Fig. 9A); however, there was no increase in the percentage of TUNEL-positive cells between the middle stage and late stage (p>0.05). Similarly, for the xenografts, there was a 0.74-fold and 0.73-fold increase in TUNEL-positive cells, respectively, for both the late-stage xenografts compared with the early-stage xenografts (Fig. 9B). Attempting to match percentages of TUNEL-stained cells across 3D cultures and xenografts, the early-stage 3D cultures and xenografts (34% vs 28%, respectively), the middle 3D cultures and xenografts (45% vs 40%, respectively), and the late-stage 3D cultures and xenografts (50% vs 48% for both late-stage xenografts) all had similar percentages.
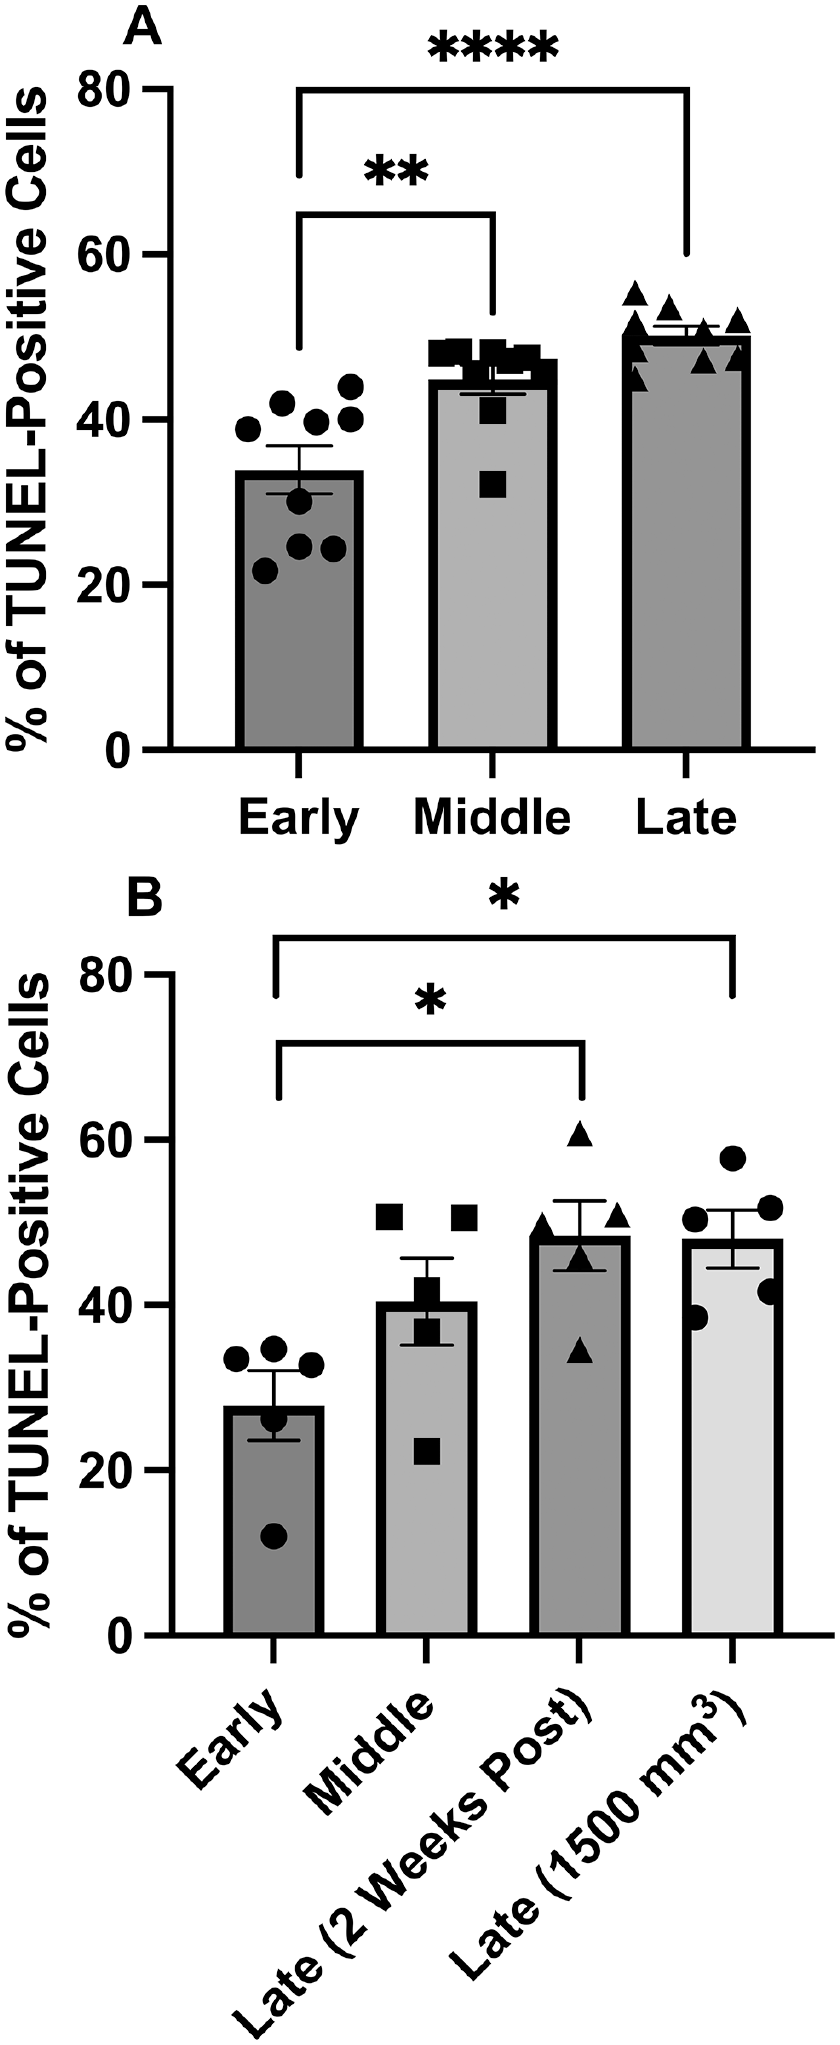
(A) The percentage of TUNEL-positive cells in untreated H3122 3D cultures over time. 3D cultures were seeded at 2.5 × 10⁵ H3122 cells. Data are expressed as mean ± SEM and were analyzed using a one-way ANOVA followed by a Bonferroni post hoc test. ** represents a significant difference between early and middle stage, and **** between early and late stage, p<0.01 and p<0.0001, respectively. n=9 3D cultures per time point. (B) The percentage of TUNEL-positive cells in excised untreated tumors over time. NSG mice were subcutaneously implanted with 1 × 10⁶ H3122 cells. Data are expressed as mean ± SEM and were analyzed using a one-way ANOVA followed by a Bonferroni post hoc test. *p<0.05. n=5 per group repeated in duplicate.
The Effect of Alectinib, SHP099, and the Combination on ALK+ NSCLC 3D cultures
AlamarBlue cell viability assays were performed to determine the potency of alectinib, SHP099, and the combination in H3122 ALK+ NSCLC 3D cultures. The maximum reduction of cell growth by alectinib was considerably lower in 3D than 2D culture (~20 vs ~90%. Table 1). This was not the case for SHP099, which is likely to be a result of the impermeability of alectinib compared with SHP099. The EC50 for cell growth suppression in 3D culture SHP099 was 3.98 µM, similar to in 2D culture; however, an EC50 value for alectinib was difficult to calculate in 3D cultures due to the short range between maximum effect and baseline. Because of this, we investigated the effect of combining alectinib and SH099 testing the effect of a range of SHP099 concentrations combined with the concentration that gave the limiting/maximum effect for alectinib. We compared this with the predicted effects of combination under the assumptions of the Bliss model (Fig. 10A). The combination resulted in a substantial drop in cell viability at the low SHP099 concentrations, greater than that predicted by the Bliss model (indicating synergy), but then converged with the predictions of the Bliss model at higher SHP099 concentrations. When we compared Bliss combination indices for 2D and 3D cultures as described previously, the combination indices were similarly mildly synergistic at mid-range for both types of cell culture (Fig. 10B).
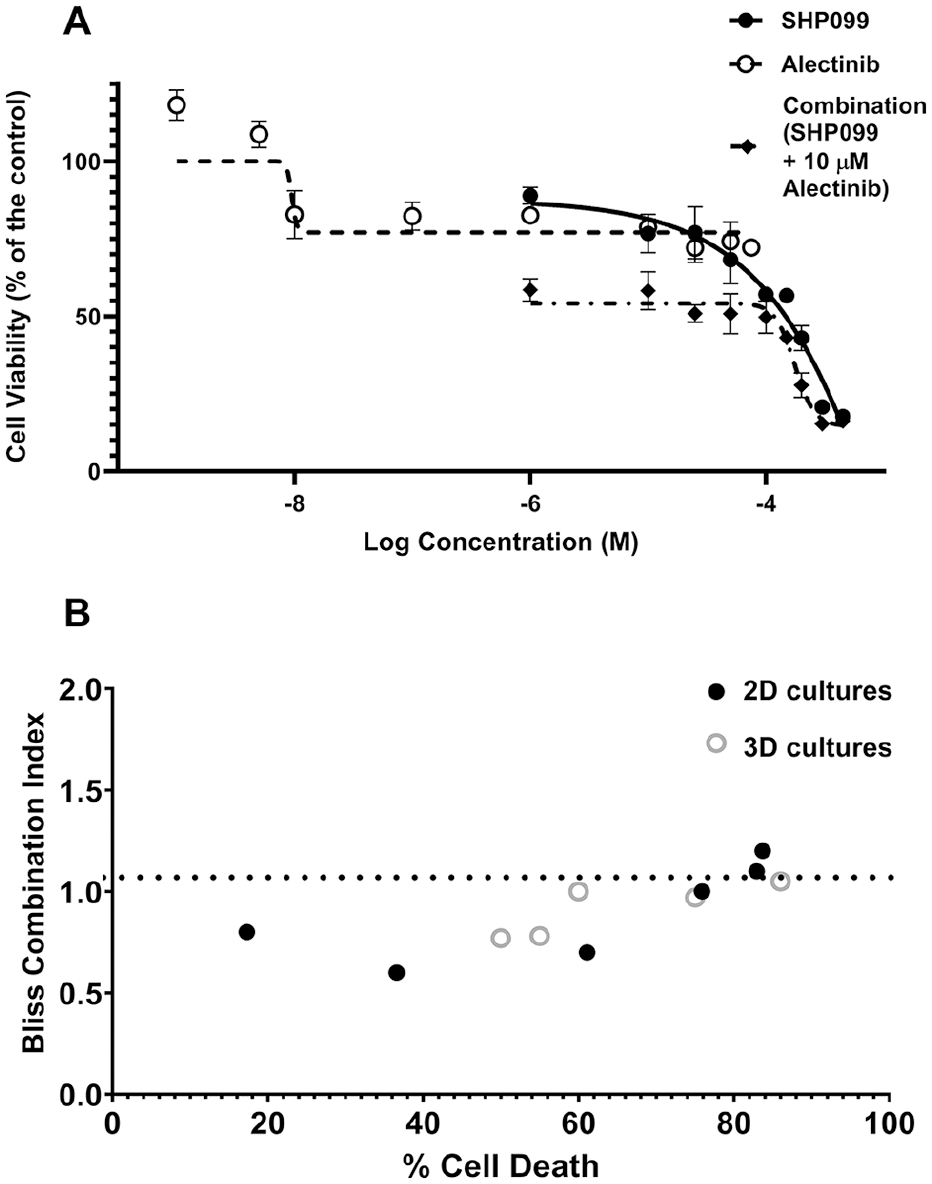
(A) The effect of alectinib and SHP099 and their combination on cell viability of treatment-naïve ALK+ NSCLC 3D cultures. The blue dotted line represents the Bliss model values for the combination data. Data points are expressed as mean ± SEM. (B) Combination indices calculated using the Bliss method for each of the combinations tested for 2D model assays (filled circles) and 3D model assays (open circles). The x-axis represents the amount of cell death obtained by each combination and the dotted line additivity; above the line represents a inhibitory response and below the line synergy. For all data, n=3 independent experiments performed in duplicate for 3D cultures and triplicate for 2D cultures.
Discussion
Moving from cell monolayer cultures to 3D tumor 3D culture models is a recent innovation aimed at improving the translatability of preclinical experiments. Previous studies have other techniques for producing NSCLC 3D cultures, ranging from methods using ultra-low attachment plates and agarose molds to a lung-decellularized extracellular matrix gel to suspend the cells.38–42 Until now, none had been validated using excised xenografts. Xenografts are typically used for preclinical in vivo drug efficacy testing before progression into clinical trials and are an essential reference. 43 Aiming not only to develop a superior early screening platform compared with cell monolayer cultures and reduce animal use (aligned with the 3Rs of reduction, replacement, and refinement) but also to broaden accessibility beyond research groups lacking access to advanced platforms, such as patient-derived xenografts and organ-simulating chips. In this study, we report the development of a robust, simple, and cost-effective GelMA-based ALK+ NSCLC 3D culture model suitable for pharmacological investigation.
We had previously determined two distinct regions of cells within Nu/J mouse xenografts—a less dense cell population with larger nuclei in the outer regions and a highly dense area with small nuclei mainly in the inner region at 14 days post 100 mm3, 44 consistent with the findings of this study. We now demonstrate that there are also two separate regions of cells within the 3D cultures: an outer region with large clusters of cells and an inner less dense region with sparser individual or clustering cells. These different regions of cells typically correlated with the regions of TUNEL-positive cells observed, with the TUNEL-positive nuclei routinely being smaller, indicating nuclear shrinkage.45,46
Researchers such as Tameemi et al. 47 and Trédan et al. 48 have emphasized the importance of a central core of cell death affecting cellular metabolism and chemoresistance in lung tumors and xenografts through increased P-gp expression created by oxygen and nutrient gradients. In solid tumors, the outer region is normoxic, whereas the inner region is hypoxic due to the reduced oxygen and nutrient delivery from increased diffusion distances and an abnormal/lack of vasculature. 49 With 3D culture development, cells proliferate on the outer external region, consuming more oxygen and increasing the diffusion distance to the inner region.50–52 Accordingly, this study focused on identifying this “dead” core and confirmed that 3D cultures and xenografts had similar percentages of TUNEL-positive cells within the core at the comparative time points, confirming the successful validation of the 3D culture model in terms of the central interior of cell death.
Our investigations demonstrated that alectinib became insoluble before an EC50 value could be obtained in the 3D cultures, indicating that 3D cultures also go beyond monolayers in giving insights into drug performance influenced by permeability. Previous research by Ryu et al. 53 established heterogeneous penetration of alectinib in ALK+ neuroblastoma xenografts across different regions of the tumors, with alectinib not appearing in the lighter stained H&E areas, which are typically the inner regions of cell death. Unlike alectinib, SHP099, which has good solubility, was effective in GelMA 3D cultures, with similar results found for other 3D culture platforms. 54
We have previously demonstrated a synergistic effect of combining alectinib and SHP099 in variant 1 ALK+ NSCLC cell monolayer. 35 This study confirmed that the synergistic effect observed in the monolayer translates to the 3D culture model but with reduced efficacy. If diffusion gradients in 3D cultures are to reflect the solid tumor microenvironment, 55 then 3D cultures and tumors should contain a hypoxic core. Supporting that this experiment achieved this, our histological analysis revealed the effect of a gradient of cell death in 3D cultures that match those seen in xenografts. We concluded that GelMA H3122 3D cultures represent a significant advance for ALK+ NSCLC drug experiments over monolayers and demonstrate how a more nuanced understanding of drug action can be ascertained in the 3D cultures than in monolayers. GelMA, a semi-synthetic hydrogel with tunable mechanical properties, mimics cancer pathological stiffness, making it a reliable model for research.56,57 By contrast, ultra-low attachment plates for spheroids lack an extracellular matrix, limiting their relevance for drug testing. Agarose molds are biocompatible but lack adhesion motifs and collagen, while Matrigel, solidifying at room temperature, requires challenging cold manipulation, making comparisons between vascularized tissue and in vitro constructs challenging.
Although 3D cultures provide a more physiologically relevant model than 2D monolayers, the interpretation of viability data in these systems remains complex due to the heterogeneous cellular composition, which includes proliferating, quiescent, and apoptotic cells, which can confound conventional metrics like EC50 values. Hafner et al. 58 propose the use of GR (growth rate) metrics, which normalize drug response data to cell proliferation rates. These metrics can help disentangle cytostatic and cytotoxic effects, making them particularly suitable. Applying GR-based approaches in 3D cultures would, however, require the development of cell counting methods for such platforms, or some other growth parameter as a proxy.
Footnotes
Competing Interests
The author(s) declared no potential conflicts of interest with respect to the research, authorship, and/or publication of this article.
Author Contributions
MAB conducted the experiments, participated in the experimental design, performed the statistical analysis, and contributed to the writing and editing of the manuscript. ARB participated in the experimental design. GSM trained MAB in the GelMA hydrogel synthesis. JCA oversaw the project, participated in the experimental design and statistical analysis, and reviewed the writing of the manuscript. All authors have read and approved the final manuscript.
Funding
The author(s) disclosed receipt of the following financial support for the research, authorship, and/or publication of this article: This study was supported by a University of Otago Research Grant.