
Abstract
The fibrotic remodeling in chronic obstructive pulmonary disease (COPD) is held responsible for narrowing of small airways and thus for disease progression. Oxidant damage and cell senescence factors are recently involved in airways fibrotic remodeling. Unfortunately, we have no indications on their sequential expression at anatomical sites in which fibrotic remodeling develops in smoking subjects. Using immunohistochemical techniques, we investigated in two strains of mice after cigarette smoke (CS) exposure what happens at various times in airway areas where fibrotic remodeling occurs, and if there also exists correspondence among DNA damage induced by oxidants, cellular senescence, the presence of senescence-secreted factors involved in processes that affect transcription, metabolism as well as apoptosis, and the onset of fibrous remodeling that appears at later times in mice exposed to CS. A clear positivity for fibrogenic cytokines TGF-β, PDGF-B, and CTGF, and for proliferation marker PCNA around airways that will be remodeled is observed in both strains. Increased expression of p16ink4A senescence marker and MyoD is also seen in the same areas. p16ink4A and MyoD can promote cell cycle arrest, terminal differentiation of myofibroblasts, and can oppose their dedifferentiation. Of interest, an early progressive attenuation of SIRT-1 is observed after CS exposure. This intracellular regulatory protein can reduce premature cell senescence. These findings suggest that novel agents, which promote myofibroblast dedifferentiation and/or the apoptosis of senescent cells, may dampen progression of airway changes in smoking COPD subjects.
Keywords
Introduction
The chronic airflow limitation characterizing chronic obstructive pulmonary disease (COPD) is caused by alveolar and/or airway changes due to a chronic exposure to cigarette smoke (CS), gases, or noxious particles.1–3
Chronic inflammation, present in all COPD patients, is the most relevant cause of structural changes that lead to the destruction of the lung parenchyma, the narrowing of the small airways, and mucus hyperproduction, which greatly contribute to airflow limitation, a hallmark of the disease. 4
It is important to emphasize that separate “phenotypes” of COPD have been described, in which the various parenchymal or airway lesions are variously associated, or in which a substantial overlap exists between COPD and other disorders that cause airflow limitation (such as asthma, bronchiolitis, and chronic bronchitis) or restrictive lung diseases that usually result from inflammation and the scarring of lung tissue (e.g., fibrosis). 5 Therefore, it is possible to hypothesize that age, sex, and individual susceptibility to various pathogenic noxae, such as CS, influence the pattern of pathological changes that characterize the clinical phenotypes of COPD. The role of individual susceptibility has been clearly demonstrated in several murine strains, which mirror some human phenotypes after smoke exposure.6–12
There is also an increasing awareness that COPD involves several processes present in age and cellular senescence. 13
Age acts as a risk factor for many diseases, 14 including idiopathic pulmonary fibrosis (IPF), by affecting wound healing through abnormal fibrogenesis. 15 COPD is also treated like an “accelerated aging phenotype” where age can be related to an amplification of oxidative stress and shares several common genetic and molecular mechanisms with inflammation in COPD. 16 A main aspect of aging is the limitation in regeneration and repair, associated with cell senescence. 17 In COPD, peribronchiolar/peribronchial fibrosis is held responsible for the narrowing of small airways, an important mechanism identified at the basis of disease progression. 18 Common cellular and molecular traits associated with aging can be found in senescent cells, which may occur throughout the lifespan, playing physiological roles during normal development or limiting the proliferation of damaged and aged cells. 19
Many works carried out on humans or in animal models highlight the increase or the decrease in several factors involved in the processes of senescence, in oxidant damage, or in the fibrotic remodeling of COPD lungs; however, they do not give indications on their lung compartmentalization and what happens at sites in which airways fibrotic remodeling develops.13,15
The main scope of this study was to investigate in smoking mice, which in the long run develop emphysema and goblet cell metaplasia, what happens at various times after CS exposure in areas where airways fibrotic remodeling will occur, and whether an anatomical correspondence exists between the onset of airways fibrous remodeling 20 and DNA damage induced by oxidants. It was also investigated whether oxidants-induced DNA damage is accompanied by cellular senescence and the presence of senescence-secreted factors (SASPs), which are involved in processes affecting transcription (i.e., epigenetic alterations), metabolism (i.e., fibrotic cytokines), and apoptosis.
Among the complex mixture of hundreds of SASPs, including proinflammatory cytokines, chemokines, growth factors, and proteases, 21 we investigated those involved in the differentiation of myofibroblasts, in their metabolic function and in apoptosis.
The expression of these factors in different lung sites associated with matrix changes was analyzed by immunohistochemistry in two strains of mice sensitive to oxidative stress, which develop after chronic CS exposure emphysema and a different pattern of pathological changes of airways epithelial lining cells.7–9
Materials and Methods
Animal Experiments
Male C57BL/6J and DBA/2 mice (8 weeks old) used in this study were purchased from Charles River (Calco, Italy). The mice were housed in a controlled environment (22C ± 2C, relative humidity 55% ± 15%, light:dark cycle: 12:12); food (Mucedola Global Diet 2018; Harlan, Correzzana, Italy) and water were supplied ad libitum. All animal experiments were conducted in conformity with the “Guiding Principles for Research Involving Animals and Human Beings” and were approved by the Ethics Committee of the University of Siena and the Italian Health Ministry (no. 186/2015-PR).
Chronic Exposure to CS
Thirty-six mice from each strain were exposed to either room air or to the smoke of three cigarettes per day, 5 days/week, for 1, 4, and 7 months (Marlboro Red, 10 mg of tar and 0.8 mg of nicotine) in especially designed Makrolon cages (Tecniplast, Buguggiate, Italy). These cages (42.5 × 26.6 × 19 cm) were equipped with a disposable filter cover, with 15 10-mm holes that enabled the air to flow out of the cages and thus to be continuously renewed. The methodology for smoke exposure has previously been described in detail.7,22 In detail, the smoke is produced by the burning of a cigarette and introduced into the chamber with the airflow generated by a mechanical ventilator (7025 Rodent Ventilator, Ugo Basile, Biological Research Instruments, Comerio, Italy) at a rate of 33 ml/min; a second ventilator is used to provide room air for the dilution 1:8 of the smoke stream. In a pilot study, the efficiency of the smoke delivery system was tested in 12 mice by measuring blood HbCO by cooxymetry. Control mice were exposed to room air under the same conditions. At the different time points, animals were anesthetized and sacrificed by severing the abdominal aorta.
Morphology and Morphometry
Mice lungs were fixed intra-tracheally with buffered formalin (5%) at a constant pressure of 20 cm H2O. Lung post-fixation volumes were measured by water displacement. Lungs were processed for histologic examination and lung slides were analyzed for morphology and morphometry. Sagittal sections (7 μm) of each pair of lungs were cut and stained with hematoxylin/eosin and Masson’s trichrome stain. Mean linear intercepts (LM) and internal surface area (ISA) on hematoxylin/eosin-stained sections were assessed on paraffin sections according to conventional methods.23–25 For the determination of LM, two blinded pathologists evaluated 40 histologic fields for each pair of lungs, both vertically and horizontally. Examination of these numbers of fields meant that practically the entire lung area was evaluated. The entity of airway collagen deposition (peribronchiolar fibrosis) was evaluated on lung slices after Masson’s trichrome staining. 26 Areas of peribronchial trichrome staining (sea green color) were outlined and quantified using a light microscopy (BX 40 Olympus) equipped with the software NIS-Elements 5.01.00 (Nikon). Results are expressed as the area of staining per µm length of basement membrane of bronchioles with 150/200 µm internal diameter. At least eight bronchioles for each mouse were counted for statistics.
The area of peribronchial α-smooth muscle actin immunostaining was outlined and quantified using a light microscopy attached to an image analysis system as described above. Results are expressed as the area of staining per µm length of basement membrane of bronchioles with 150/200 µm internal diameter. At least eight bronchioles for each mouse were counted for statistics.
Immunohistochemical Analysis
Lung tissue sections of 5-μm thick from the mice exposed either to room air or CS for 1, 4, and 7 months were stained for 8-oxo-7,8-dihydro-2′-deoxyguanosine (8-OHdG), transforming growth factor-β (TGF-β), platelet-derived growth factor B (PDGF-B), connective tissue growth factor (CTGF), proliferating cell nuclear antigen (PCNA), α-smooth muscle actin (α-SMA), MyoD and p16ink4A, SIRT-1, and cleaved caspase-3.
The primary antibodies (Ab) used were mouse monoclonal Ab to 8-OHdG (1:500; Abcam; Cod Ab62623), rabbit polyclonal Ab to mouse TGF-β (1:50; Novus Biological; Centennial, CO; Cod NBP1-03276), rabbit polyclonal Ab to PDGF-B (1:100; Abcam; Cod Ab23914), rabbit polyclonal Ab to CTGF (1:200; Abcam; Cod Ab6992), mouse monoclonal Ab to PCNA (1:100; Dakocytomation, Glostrup, Denmark; Cod M0879), mouse monoclonal Ab to α-SMA (1:300; Sigma; St Louis, MO; Cod A2547), goat polyclonal Ab to α-SMA (1:100; Sigma; Cod SAB2500963), mouse monoclonal Ab to MyoD (1:50; Novus Biological; Cod NB100-56511), mouse monoclonal Ab to p16ink4A (1:200; Abcam; Cod Ab54210), mouse monoclonal Ab to SIRT-1 (1:1000; Invitrogen Life Technologies, Irvine, CA; Cod MA5-27217), and rabbit polyclonal Ab to cleaved Caspase-3 (1:300; Cell Signaling Technology; Danvers, MA; Cod #9661).
Additional information on the specificity of antibodies used in this study is reported in the “Appendix” and “Methods” section.
Antigen retrieval was performed by heating the sections in a microwave (750 W) in 0.01 M pH 6.0 citrate buffer for 8-OHdG, p16ink4A, PCNA, cleaved caspase-3 and MyoD, PDGF-B, TGF-β, and SIRT-1.
All the sections, except for cleaved Caspase-3 and SIRT-1, were pre-treated with 3% hydrogen peroxide for blocking the endogenous peroxidase and then incubated with 3% bovine serum albumin for 30 min at room temperature.
The sections were rinsed and incubated for 30 min at room temperature with sheep anti-rabbit IgG diluted 1:200 (Sigma; Cod SAB3700918) to detect TGF-β, while for PDGF-B, the same anti-rabbit IgG was diluted 1:100 followed by incubation with peroxidase–antiperoxidase complex (Cod P1291) prepared from rabbit serum for 20′. Color development was performed using 3,3′-diaminobenzidine tetrahydrochloride (DAB) as a chromogen (Vector Laboratories; Burlingame, CA; Cod D5637-5G).
To detect cleaved caspase-3, the sections were incubated with goat polyclonal anti-rabbit biotinylated IgG (1:200) (Vector Laboratories; Cod BA-1000) for 30 min at room temperature. The staining was revealed by adding streptavidin–alkaline phosphatase (BD Pharmingen; Buccinasco, Italy; Cod 51-75893E). Color development was performed using NBT/BCIP stock solution (Roche Diagnostics; Milan, Italy; Cod 11681451001) as a chromogen, diluted in 0.1 M Tris buffer, pH 9.5, 0.05 M MgCl2, 0.1 M NaCl, and 2 mM levamisole.
CTGF sections were incubated with the appropriate biotin-conjugated secondary antibody (Vector Labora-tories; Cod BA-1000) diluted 1:200 and subsequently with streptavidin–HRP complex (BD bioscience; San Diego, CA; Cod 554066) diluted 1:1000. Color development was performed using DAB as a chromogen (Vector Laboratories; Cod D5637-5G).
To localize mouse primary monoclonal antibodies to α-SMA protein, 8-OHdG, MyoD, p16ink4A, PCNA, and SIRT-1 on mouse lung tissues, we used the Vector M.O.M. immunodetection kit (Vector Laboratories; Cod PK-2200) containing a blocking agent designed specifically to reduce the level of undesired background staining. Immunostaining was revealed using the M.O.M. detection kit with DAB substrate for α-SMA protein, 8-OHdG, MyoD, p16ink4A, and PCNA, and NBT/BCIP substrate for SIRT-1.
Slides immune-stained for MyoD were then counterstained with hematoxylin to highlight nuclei.
As the negative control for the immunostaining, the primary Ab was replaced with nonimmunized serum.
The number of individual cells staining positive for SIRT-1 in the airways was counted using a light microscopy and expressed as the number of cells per bronchiole with 150- to 200-µm internal diameter. A minimum of 10 bronchioles was counted per each animal.
Double-Immunofluorescence Staining
Double-immunofluorescence analysis was visually examined under immunofluorescence microscopy using an LSM510 Zeiss META confocal microscope (Carl Zeiss; Oberkochen, Germany). Images were captured with a Zeiss LSM 510 software version 4.2 SP1 with selective multitracking excitation.
The sections were double-stained for goat polyclonal Ab to α-SMA (1:100; Sigma-Aldrich; St Louis, MO; Cod SAB2500963) and mouse monoclonal Ab to p16ink4A (1:200; Abcam; Cod Ab54210).
All the sections were rinsed with phosphate-buffered saline and incubated with Alexa Fluor-488-labeled donkey anti-goat antibody (dilution 1:200; Molecular Probes, Eugene, OR Cod A11055) for 45 min in the dark and at room temperature to detect goat polyclonal Ab to α-SMA; Alexa Fluor-546 labeled donkey anti-mouse antibody (dilution 1:200; Molecular Probes, Eugene, OR. Cod A10036) was used to detect p16ink4A. As negative controls for the immunostaining, the primary Ab was replaced by nonimmunized serum.
RNA Isolation and cDNA Synthesis
Total RNA was extracted from lungs of mice using Tri Reagent (Ambion; Austin, TX; Cod AM9738) according to the manufacturer’s instructions. Six mice for each group were used for RNA isolation. RNA was re-suspended in RT-PCR Grade Water (Ambion. Cod 03315843001), and the amount and purity of RNA were quantified spectrophotometrically by measuring the optical density at 260 and 280 nm. Integrity was checked by agarose gel electrophoresis. Two micrograms of total RNA were treated with TURBO DNase (TURBO DNA-free kit; Ambion; Cod AM1907) for 30 min and reverse transcribed using the RETRO script kit (Roche; Cod 04896866001) according to the manufacturer’s instructions. Two hundredths of the final volume of RT were used for real-time RT-PCR.
Real-Time RT-PCR
Real-time RT-PCR was performed in triplicate for each sample on the MJ Opticon Monitor 2 (MJ Research Co.; Waltham, MA) with specific locked nucleic acid probes from the Mouse Universal Probe Library Set (Roche; Indianapolis, IN; Cod 04683641001). Primers were designed using the free online ProbeFinder software version 2.53 (Roche Molecular Systems Inc.; Branchburg, NJ), which shows a pair of specific primers for each probe from the Universal Probe Library set (Roche) (Table 1). The primers were designed to span an exon–exon junction, with one of the amplification primers potentially spanning the actual exon–intron boundary. The combination of primers and probes provides the specific amplification and detection of the target sequence in the sample. Polymerase chain reaction reactions were performed in a volume of 25 µL and contained 12.5 µL of FastStart TaqMan Probe Master (Roche; Cod 04673417001), 300 nmol/L forward and reverse primers (TIB Molbiol; Genova, Italy), 200 nmol/L Universal Probe Library Set probes, and 5 µL of cDNA. Reactions were incubated at 95C for 10 min and then amplified for 40 cycles, each cycle comprising an incubation step at 94C for 15 s followed by 60C for 1 min. A minus reverse transcription control (-RT control) was included in all RT-qPCR experiments to test for contaminating DNA. The real-time RT-PCR assay included a no-template control and a standard curve of four serial dilution points (in 10-fold steps) for each of the test cDNAs, and this was performed according to the method reported in detail in previous studies.12,27
Primers Sequence and Probe Catalog Number.
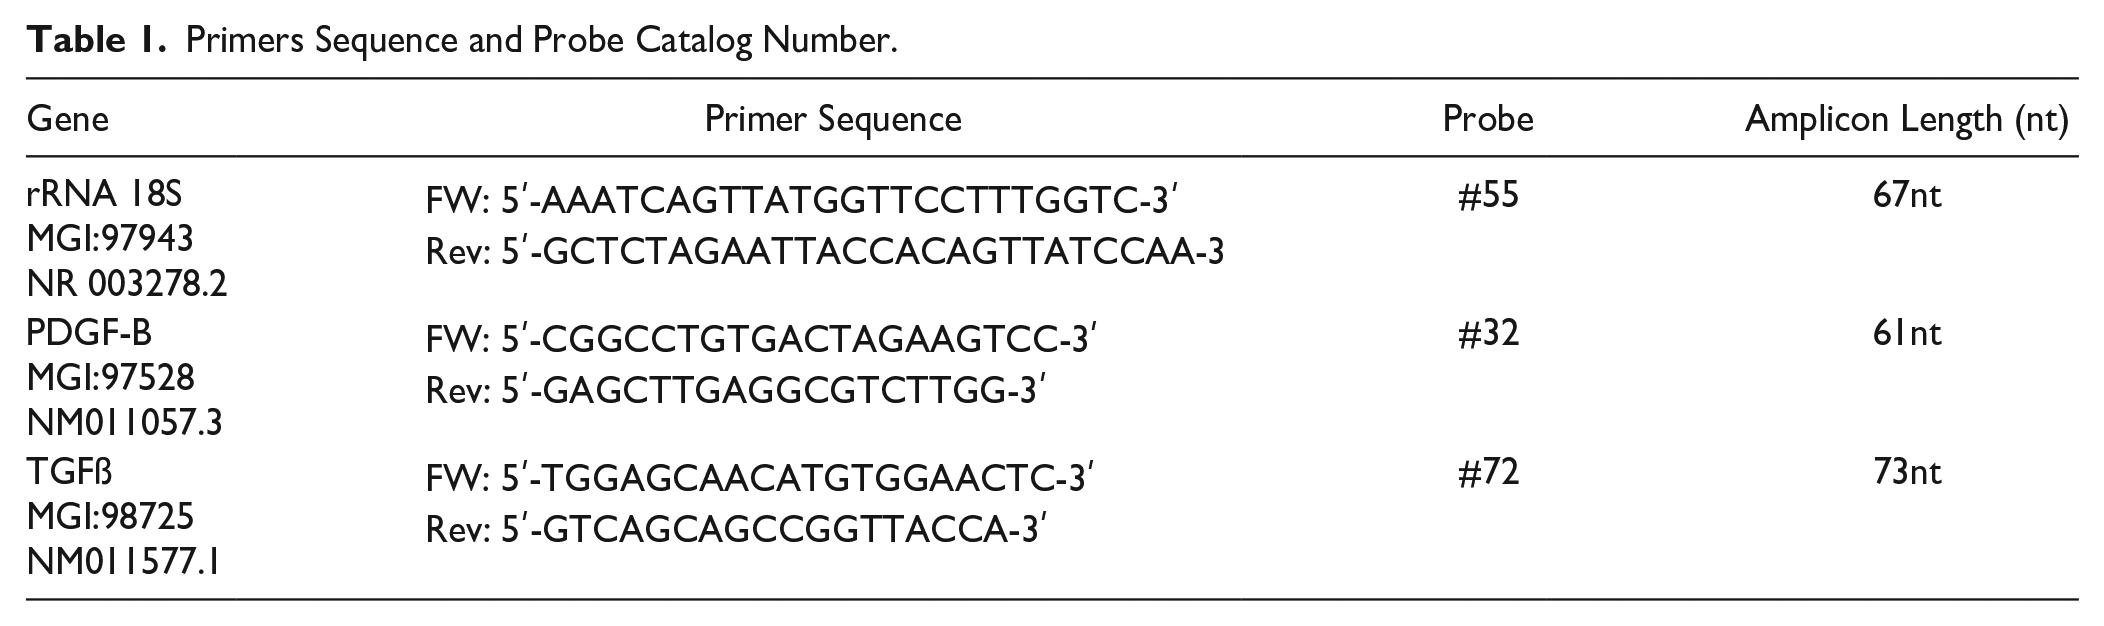
The analysis of the results was based on the Ct comparative method (ΔΔ Ct), in which Ct represents the cycle number at which the fluorescent signal, associated with an exponential increase in polymerase chain reaction (PCR) products, crosses a given threshold. The specific gene’s cycle threshold (Ct) values were normalized to the housekeeping gene 18S rRNA and compared with the control group, which was assigned a value of 1 to calculate the relative fold change in expression, as previously described. 28
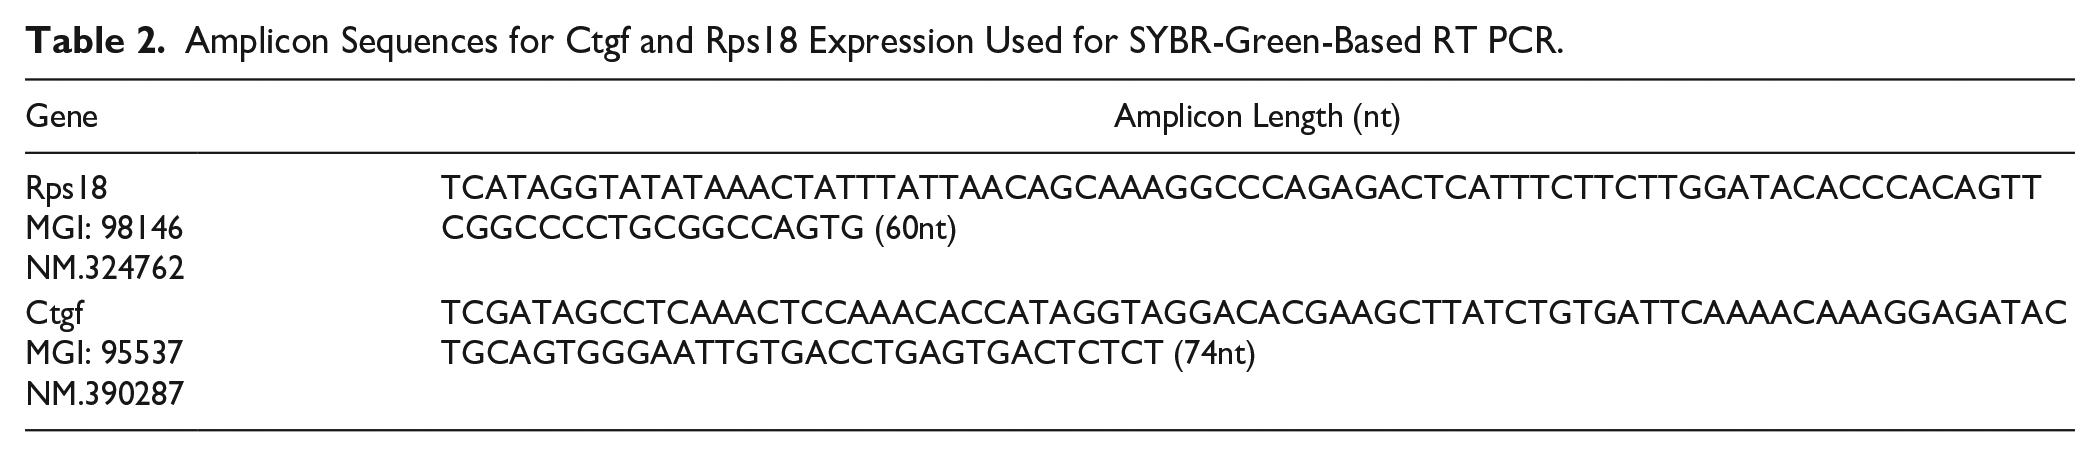
Ctgf and Rps18 gene expression was assessed by SYBR-Green-based real-time PCR using SsoAdvanced Universal SYBR-Green Supermix (Bio-Rad) protocol and amplification thermocycler machine (PCR Detection System CFX Opus 96, Bio-Rad). Rps18 expression was used as the endogenous control to normalize the sample data.
The gene-specific primers for Ctgf and Rps18 were purchased from the Bio-Rad company which supplied the PrimePCR Assay Validation Report for them (Table 2).
Amplicon Sequences for Ctgf and Rps18 Expression Used for SYBR-Green-Based RT PCR.
The specificity of the primers was determined by melting curve analysis and agarose gel electrophoresis.
Polymerase chain reaction reactions for Ctgf and Rps18 genes were performed in a volume of 20 μL and contained 10 μL of SsoAdvanced Universal SYBR-Green Supermix (Bio-Rad), 1 μL of forward and reverse primers (PrimePCR SYBR Green Rps18, mouse and/or PrimePCR SYBR Green Ctgf mouse; Bio-Rad, Italy), 2,5 μL of cDNA, and 6.5 μL of PCR-grade H2O.
Statistical Analysis
For each parameter, either measured or calculated, the values for individual animals were averaged, and the standard deviation (SD) was calculated. The significance of the differences between numerical data was calculated using one-way analysis of variance followed by Bonferroni’s post hoc test. A p<0.05 was considered significant. All data were plotted and analyzed using GraphPad Prism 5.
Results
Lung Changes and Fibrous Airway Remodeling in DBA/2 and C57BL/6 Mice Following Exposure to CS
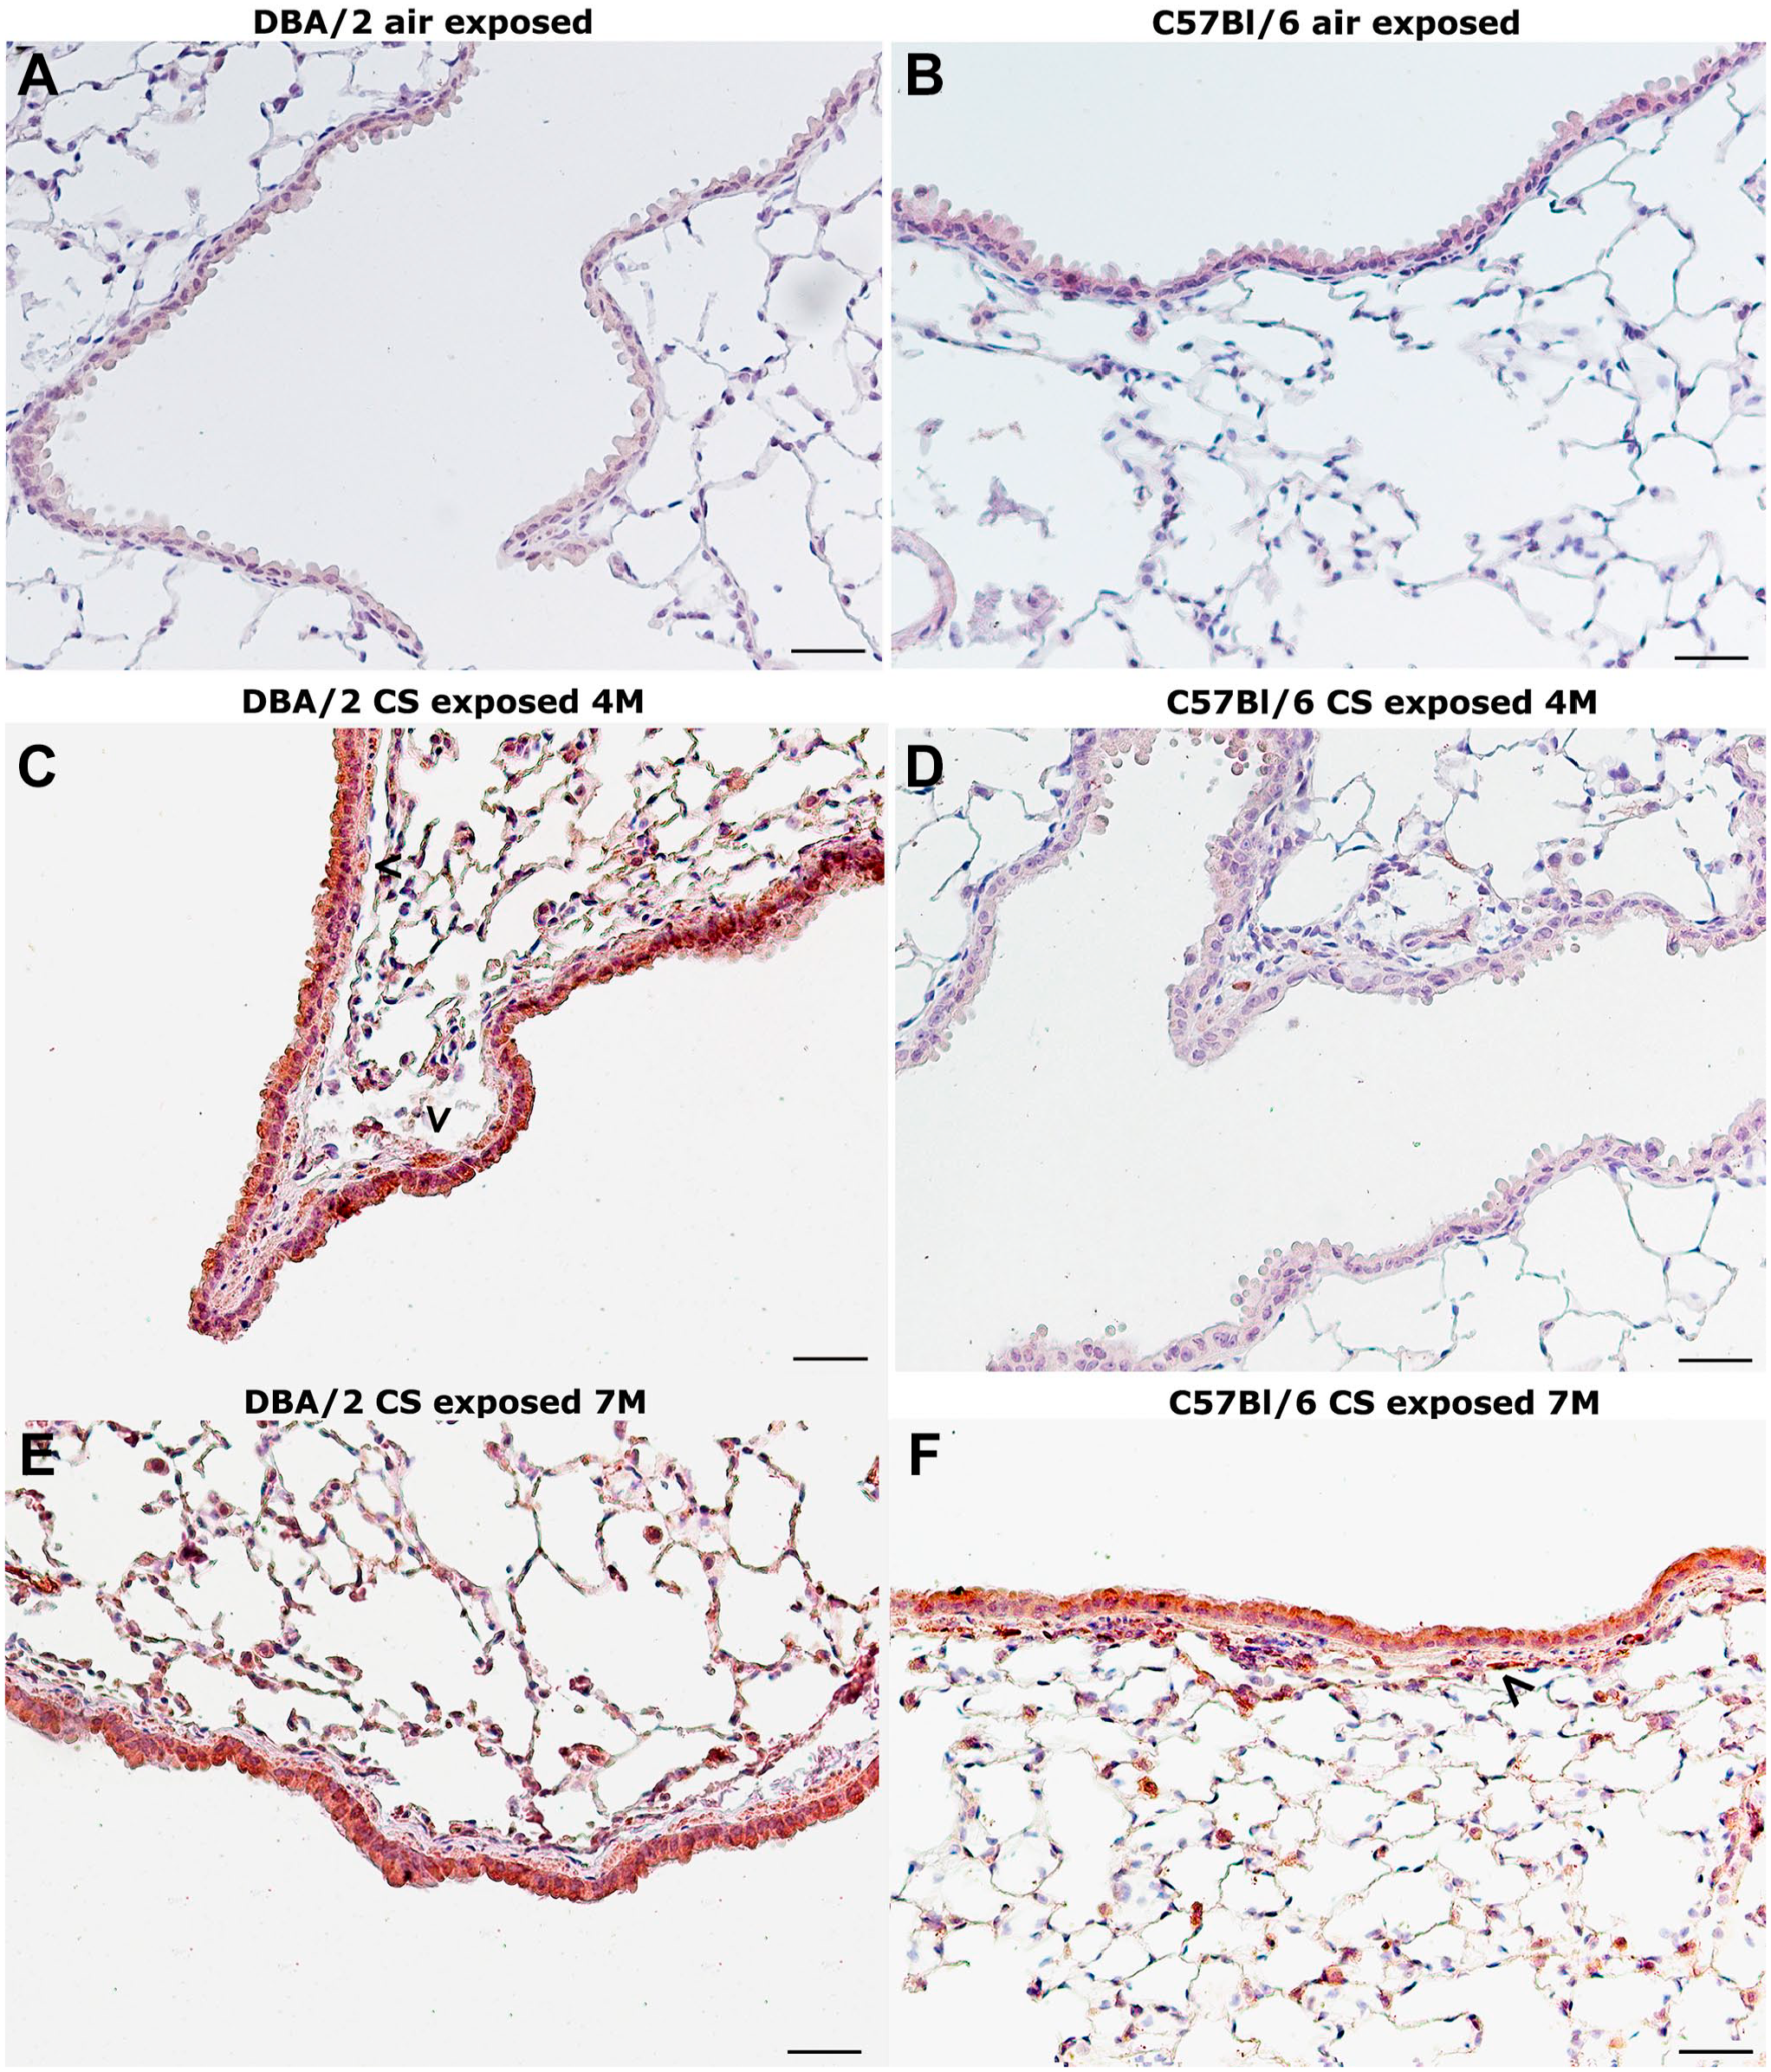
Air-exposed controls from both strains show a normal appearance at 7 months (Fig. 1A and B) and at the other times examined (Tables 3 and 4).
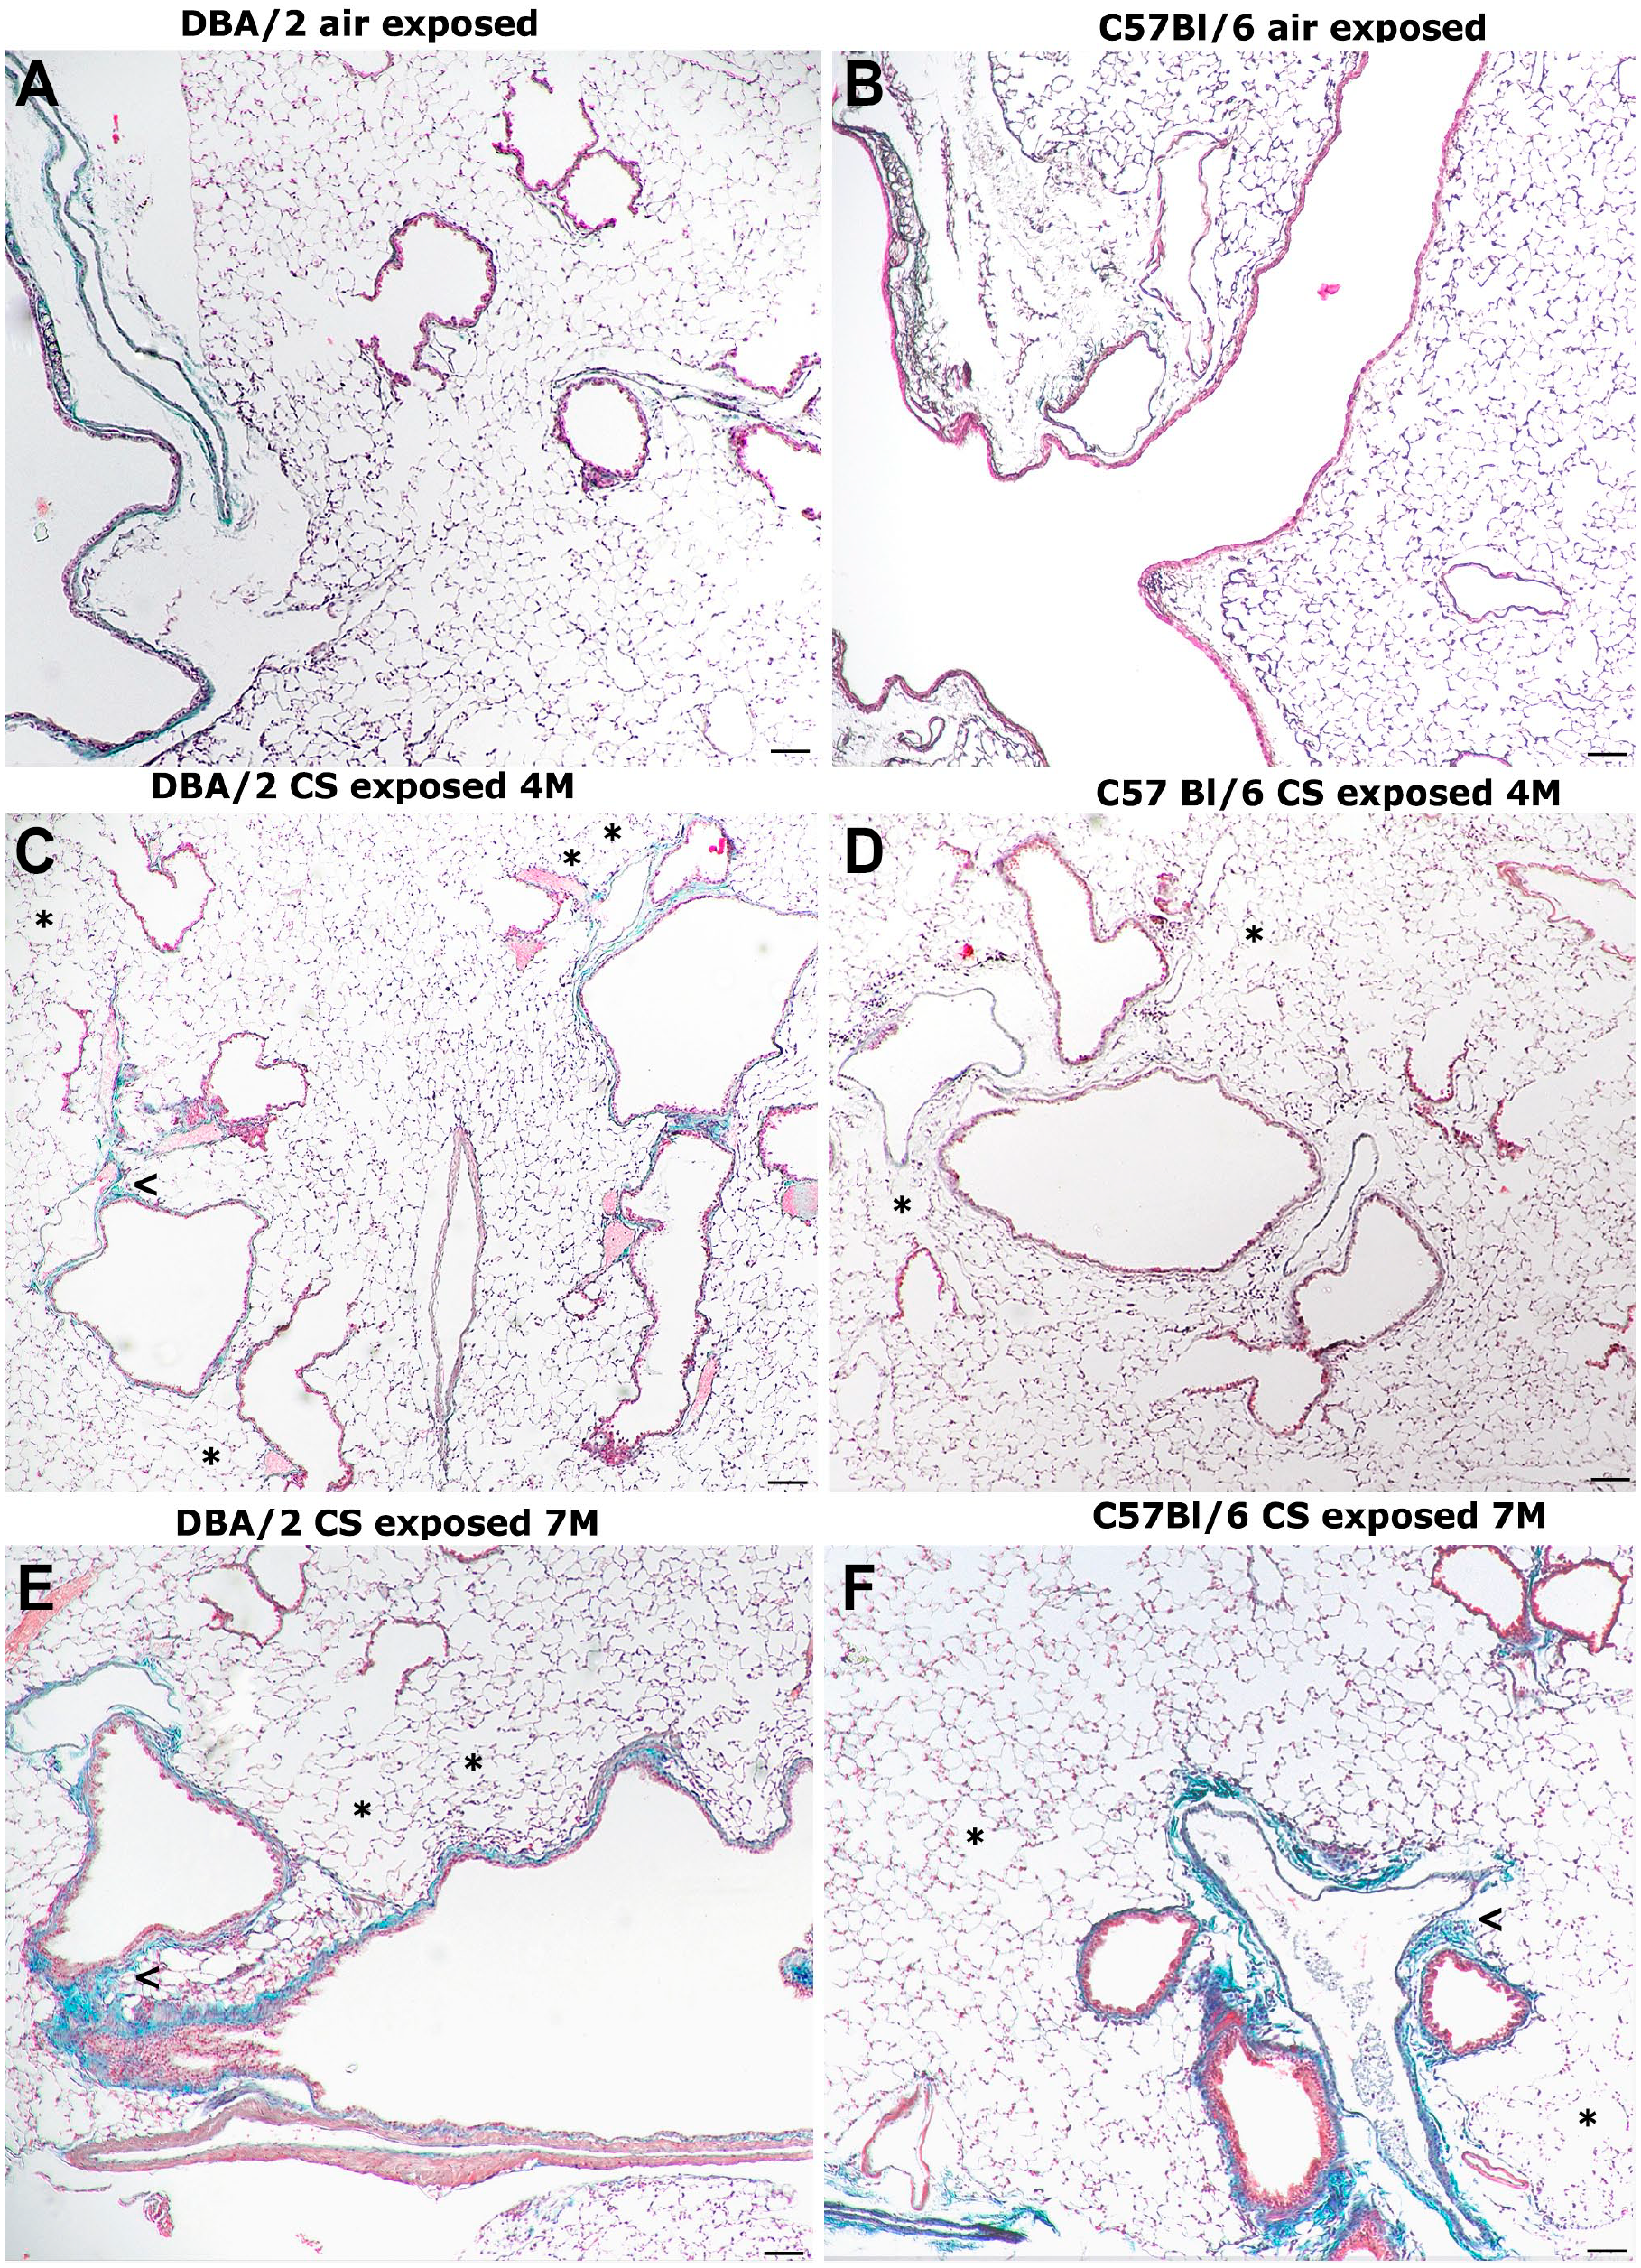
Representative histologic sections from lung parenchyma at different times from the start of the study. (A) Lung from an air-exposed DBA/2 mouse showing a normal architecture. (B) Lung from an air-exposed C57BL/6 mouse showing a normal architecture. (C) Lung from a DBA/2 mouse after 4 months of cigarette smoke exposure. Areas of fibrotic remodeling are seen around bronchioles (arrowhead). Emphysematous changes (*). (D) Lung from a C57BL/6 mouse after 4 months of CS exposure. Some emphysematous changes are present (*) but no areas of airway fibrotic remodeling are seen. (E) Lung from a DBA/2 mouse after 7 months of smoke exposure. Airway fibrotic remodeling changes (arrowhead) are more severe (sea green areas) around bronchioles. (F) Lung from a C57BL/6 mouse after 7 months of smoke exposure showing patchy areas of lung emphysema (*) and areas of fibrotic remodeling around bronchioles (arrowhead). (A–F) Masson’s trichrome stain. Scale bars = 100 µm. Abbreviation: CS, cigarette smoke.
Effect of Chronic Exposure to CS on Lung Morphometry in the Two Strains of Mice at 1, 4, and 7 Months From the Start of Exposure.
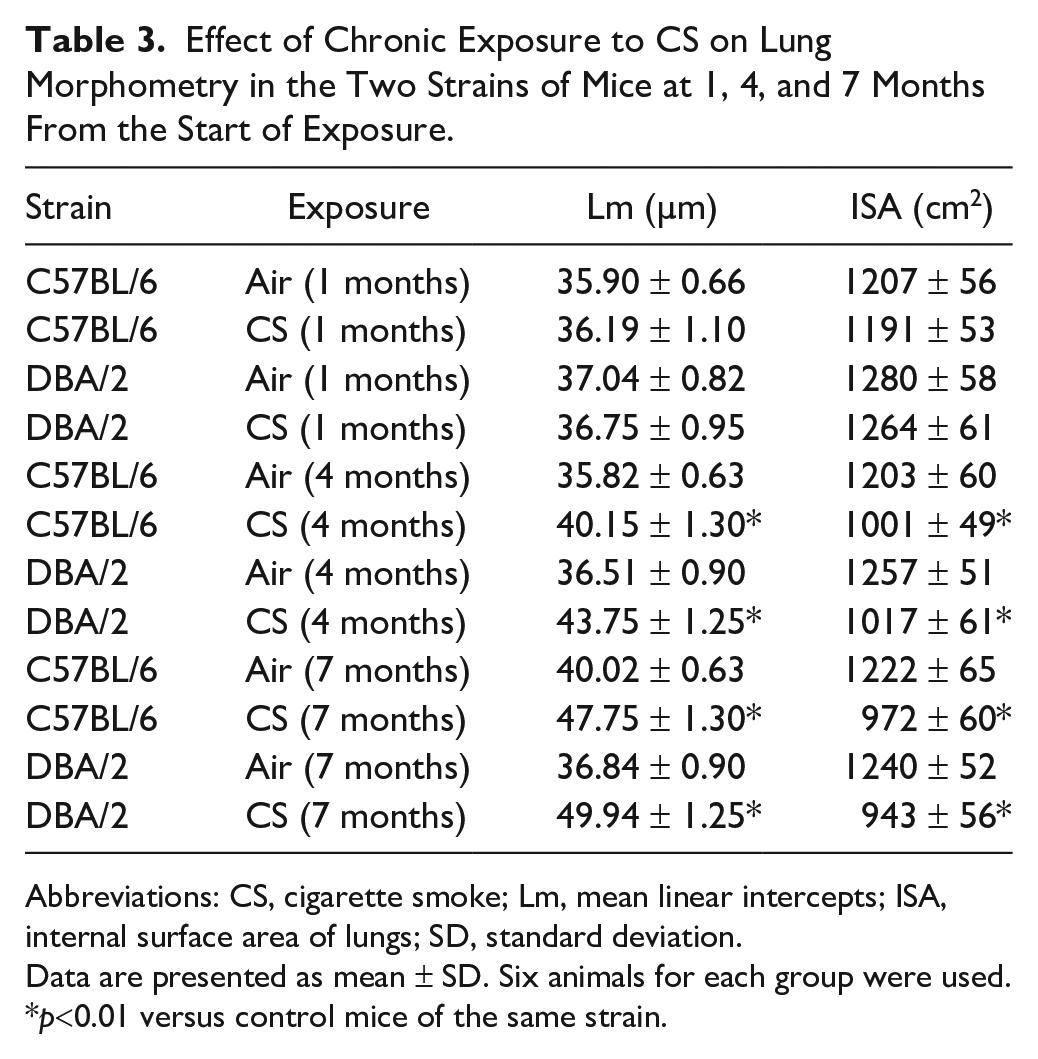
Abbreviations: CS, cigarette smoke; Lm, mean linear intercepts; ISA, internal surface area of lungs; SD, standard deviation.
Data are presented as mean ± SD. Six animals for each group were used.
p<0.01 versus control mice of the same strain.
Peribronchial Trichrome Stained Area (Peribronchial Fibrosis, PF) and Peribronchial α−SMA Stained Area After CS Exposure.
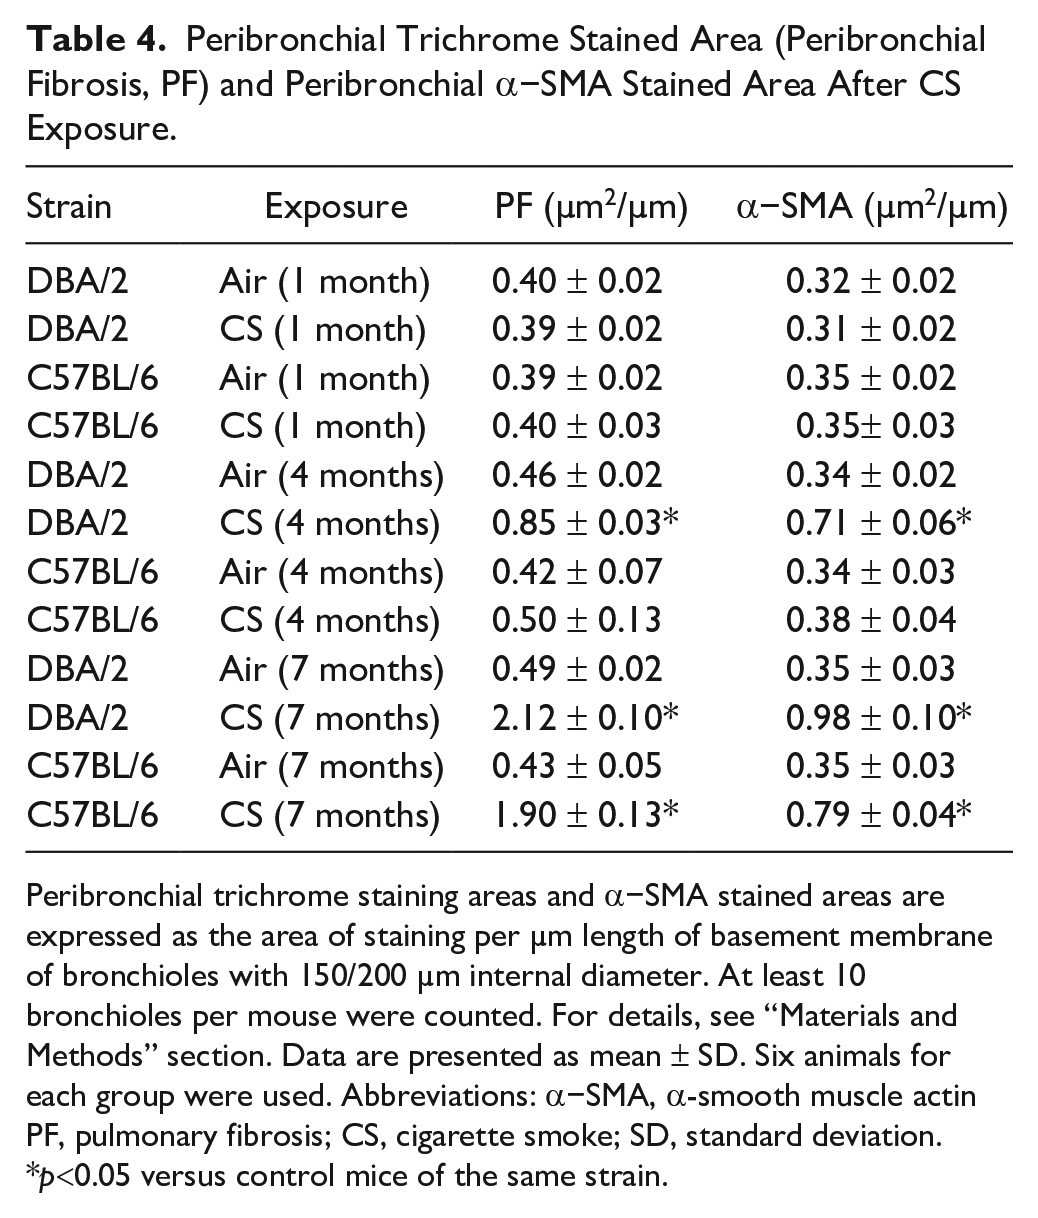
Peribronchial trichrome staining areas and α−SMA stained areas are expressed as the area of staining per µm length of basement membrane of bronchioles with 150/200 µm internal diameter. At least 10 bronchioles per mouse were counted. For details, see “Materials and Methods” section. Data are presented as mean ± SD. Six animals for each group were used. Abbreviations: α−SMA, α-smooth muscle actin PF, pulmonary fibrosis; CS, cigarette smoke; SD, standard deviation.
p<0.05 versus control mice of the same strain.
The two strains of mice develop enlargement of air spaces when chronically exposed to CS (Fig. 1E and F, asterisks). However, DBA/2 and C57BL/6 mice are affected to a different extent by fibrotic airway remodeling from 4 months of exposure onward, as demonstrated by morphometry after Masson’s trichrome staining (Tables 3 and 4; Fig. 1C to F).
The quantification of alveolar changes in both strains has been carried out by analyzing mean linear intercepts (Lm) and internal surface areas (ISA) at 1, 4, and 7 months of exposure either to room air or to CS (Table 3). As previously reported, 8 no pathological changes or differences in Lm or ISA values (Table 3) are observed between control mice and CS-exposed mice for each strain at 1 month of exposure (Table 3). At 4 and 7 months from the beginning of the treatment the values of Lm and ISA of smoking mice are statistically different compared with the control mice exposed to the air (Table 3). Already at 4 months and even more so at 7 months of smoke exposure, both strains show the presence of scattered foci of air space enlargements in the lung parenchyma (Fig. 1C to F). A progressive collagen accumulation is observed around peripheral airways in the lungs of both strains of mouse. At 7 months of CS exposure, a significant increase around peribronchial trichrome stain (sea green stain) from both strains (Fig. 1E and F; Table 4) was observed as compared with the respective nonsmoking control DBA/2 (2.12 ± 0.10 vs 0.49 ± 0.02 µm2/µm), and C57BL/6 mice (1.90 ± 0.13 vs 0.43 ± 0.05 µm2/µm. Collagen accumulation is seen earlier in DBA/2 mice and is evident at 4 months of smoking exposure (Fig. 1C), when the values of the trichrome stained areas for smoking and air control DBA/2 mice are 0.85 ± 0.03 versus 0.46 ± 0.02 µm2/µm, respectively. At 4 months, the difference of the values of stained areas of smoking C57BL/6 mice is not statistically greater than of air control mice (0.50 ± 0.13 vs 0.42 ± 0.07 µm2/µm, respectively) (Table 4).
Areas of Airways Fibrotic Remodeling are Characterized by an Upregulated Expression of Alpha SMA, p16ink4A, and MyoD
Immunohistochemical staining of alpha SMA in small bronchioles of air control DBA/2 and C57BL/6 mice is shown in Fig. 2A and C, respectively, where very few positive cells can be observed. A marked positivity for alpha SMA is seen beneath the intraparenchymal bronchi and bronchioles of DBA/2 (Fig. 2E and F) as well as C57BL/6 mice (Fig. 2G and H) at 7 months of CS exposure.
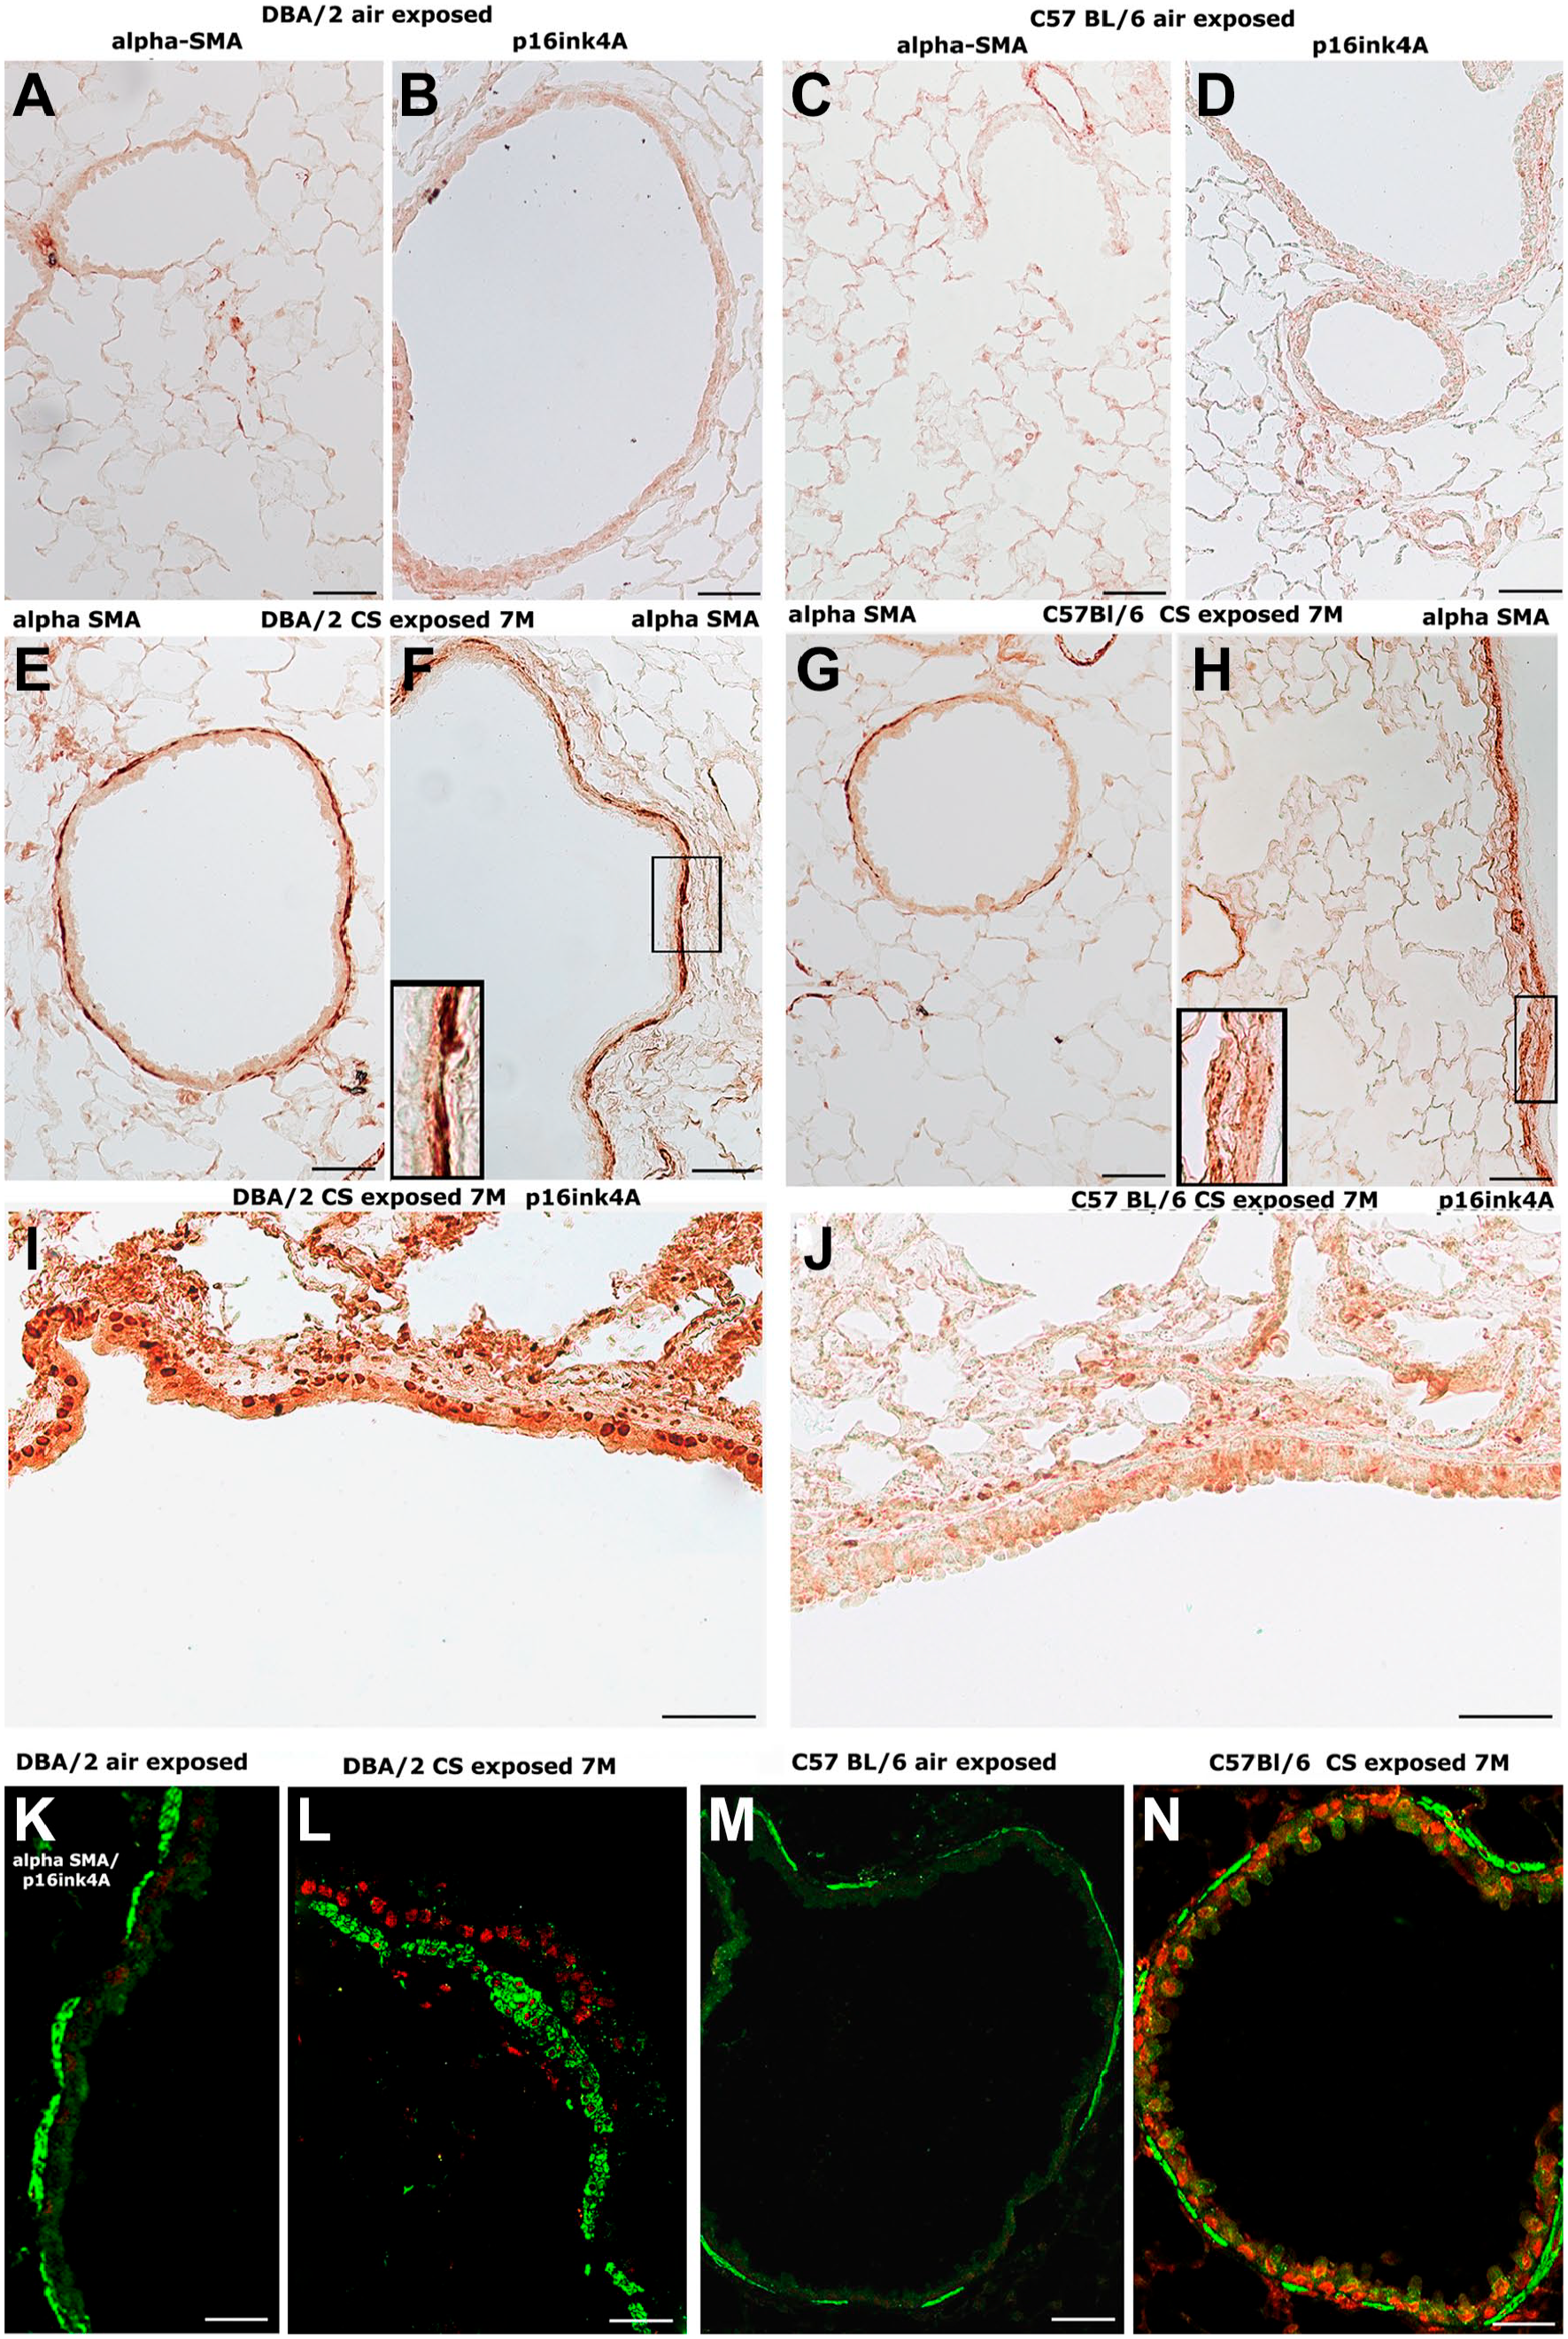
Representative immunohistochemical reaction for alpha-SMA and p16ink4A in mouse lungs from the different experimental groups. (A and B) Lung slices from a control DBA/2 mouse after immunostaining for alpha-smooth muscle cells (alpha-SMA) (A) and p16ink4A (B) showing a very faint reaction on pulmonary airways. (C and D) Lung slices from a control C57BL/6 mouse after immunostaining for alpha-smooth muscle cells (C) and p16ink4A (D) showing a very faint or null reaction on pulmonary airways. (E–H) Lung slices from DBA/2 (E, F) and C57BL/6 (G, H) mice at 7 months of exposure to CS after immunostaining for alpha-SMA. An intense staining is present around the airways of both strains. In the inserts, higher magnification of the micrographs (F) and (H) is reported. (I and J) Lung slices from DBA/2 (I) and C57BL/6 (J) mice at 7 months of exposure to CS after immunostaining for alpha-SMA. An intense staining is present beneath the epithelial layer of the airways of both strains. (K–N) Alpha-smooth muscle cells (green) and p16ink4A (red) colocalization on airway structures of DBA/2 (L) and C57BL/6 (N) mice on lung slices taken at 7 months of CS exposure. No signals for p16ink4A are present on lung slides of air control DBA/2 (K) and C57BL/6 (M) mice. (A–J) Scale bars = 50 µm. Abbreviations: alpha-SMA, α-smooth muscle actin; p16ink4A, tumor suppressor protein p16ink4A; CS, cigarette smoke.
Cigarette smoke exposure–induced thickening of the peribronchial smooth muscle layer in DBA/2 and C57BL/6 mice (Fig. 2I and J) (Table 4). The area of peribronchial alpha-smooth muscle actin at 7 months was significantly greater that in controls in both strains of mice (DBA/2: 0.98 ± 0.10 vs 0.35 ± 0.3 µm; C57BL/6: 0.79 ± 0.04 vs 0.35 ± 0.03 µm2/µm, p<0.05). Significant difference between smoking and air-control DBA/2 mice was also observed at 4 months of exposure (0.71 ± 0.06 vs 0.34 ± 0.02 µm2/µm, p<0.05). On the contrary, no significant difference was observed at 4 months between smoking and air-control C57BL/6 mice (0.38 ± 0.04 vs 0.34 ± 0.03 µm2/µm, respectively).
At the same times, the p16ink4A senescence marker is easily observed beneath the intraparenchymal bronchi and bronchioles in the two mouse strains (Fig. 2B and D). The contemporary analysis of alpha SMA and p16ink4A that we performed, albeit on a limited number of slides, with specific fluorescent probes on confocal microscopy (Fig. 2L and N) supports this conclusion. Immunohistochemical reactions for alpha SMA and p16ink4A on slices from air-exposed DBA/2 and C57BL/6 mice are shown in panels K and M of Fig. 2.
Of interest, also the transcription factor MyoD is expressed in the areas affected by fibrotic airway remodeling of DBA/2 mice at 4 and 7 months (Fig. 3C and E) and of C57BL/6 mice of 7 months (Fig. 3F) of CS exposure. p16ink4A together with MyoD play a crucial role in myoblast proliferation and differentiation. p16ink4A pushes cells to enter senescence, leading to G1 cell cycle arrest. MyoD inducing cell cycle arrest promotes the cellular terminal differentiation of fibroblasts into myofibroblasts, and in senescent myofibroblasts this determines their resistance to apoptosis and opposes their dedifferentiation. No reaction for these factors is found in slices from air control mice from both strains (Fig. 3A and B).
Representative immunohistochemical reaction for the transcription factor MyoD in mouse lungs from the different experimental groups. (A and B) Immunohistochemical staining for MyoD in lungs of DBA/2 (A) and C57BL/6 (B) control mice. No reaction is observed in tissue slices. (C and D) At 4 months of CS exposure a marked expression of this transcription factor can be seen on the airway structures and subpleural areas of DBA/2 mice (C). No reaction is observed in the pulmonary structures of C57BL/6 mice (D). (E and F) An intense staining for MyoD is seen on epithelial cells and in cells beneath the basal membrane of airways at 7 months after cigarette smoke exposure in both strains of mice. Airways of DBA/2 (E) and C57BL/6 (F) are shown. (A–F) Scale bars = 50 µm. Abbreviation: CS: cigarette smoke.
A Marked Positivity for 8-OHdG Is Associated to Increased Expression of Fibrotic Cytokines
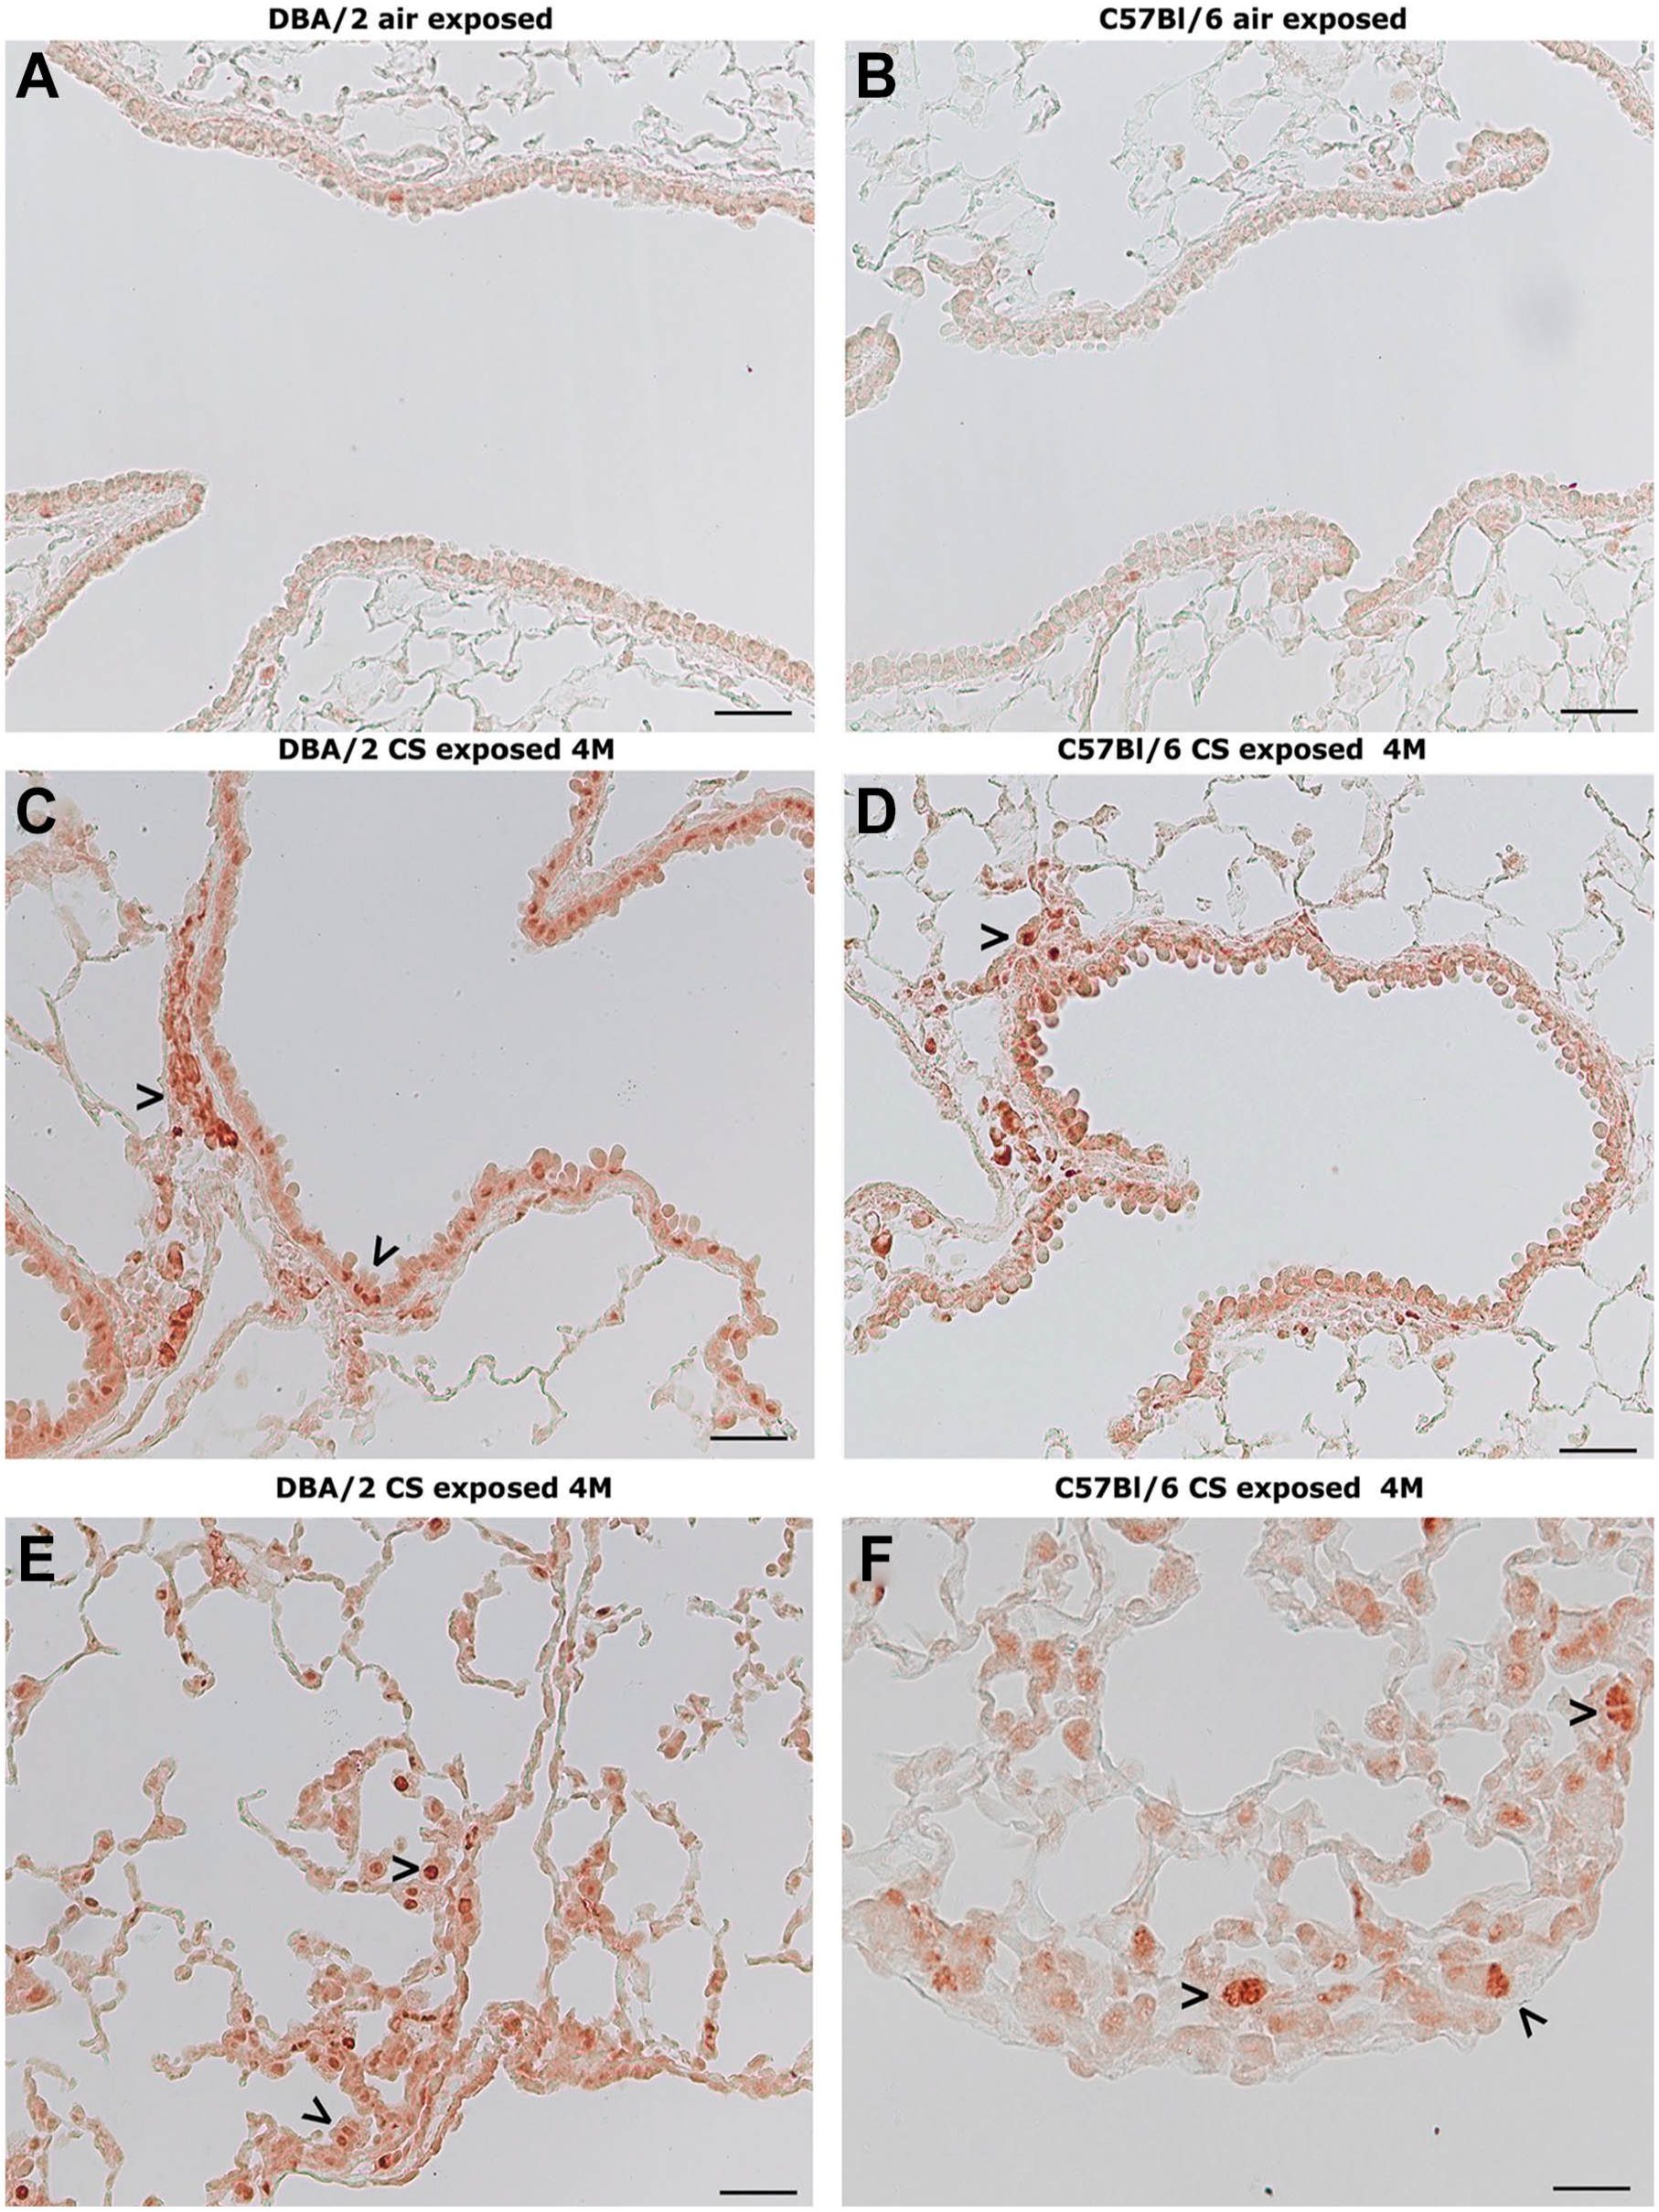
No appreciable reaction for 8-OHdG, a marker of oxidative DNA damage, is present in peribronchial areas of peripheral airways of the two strains of mice exposed to room air (Fig. 4A and B).
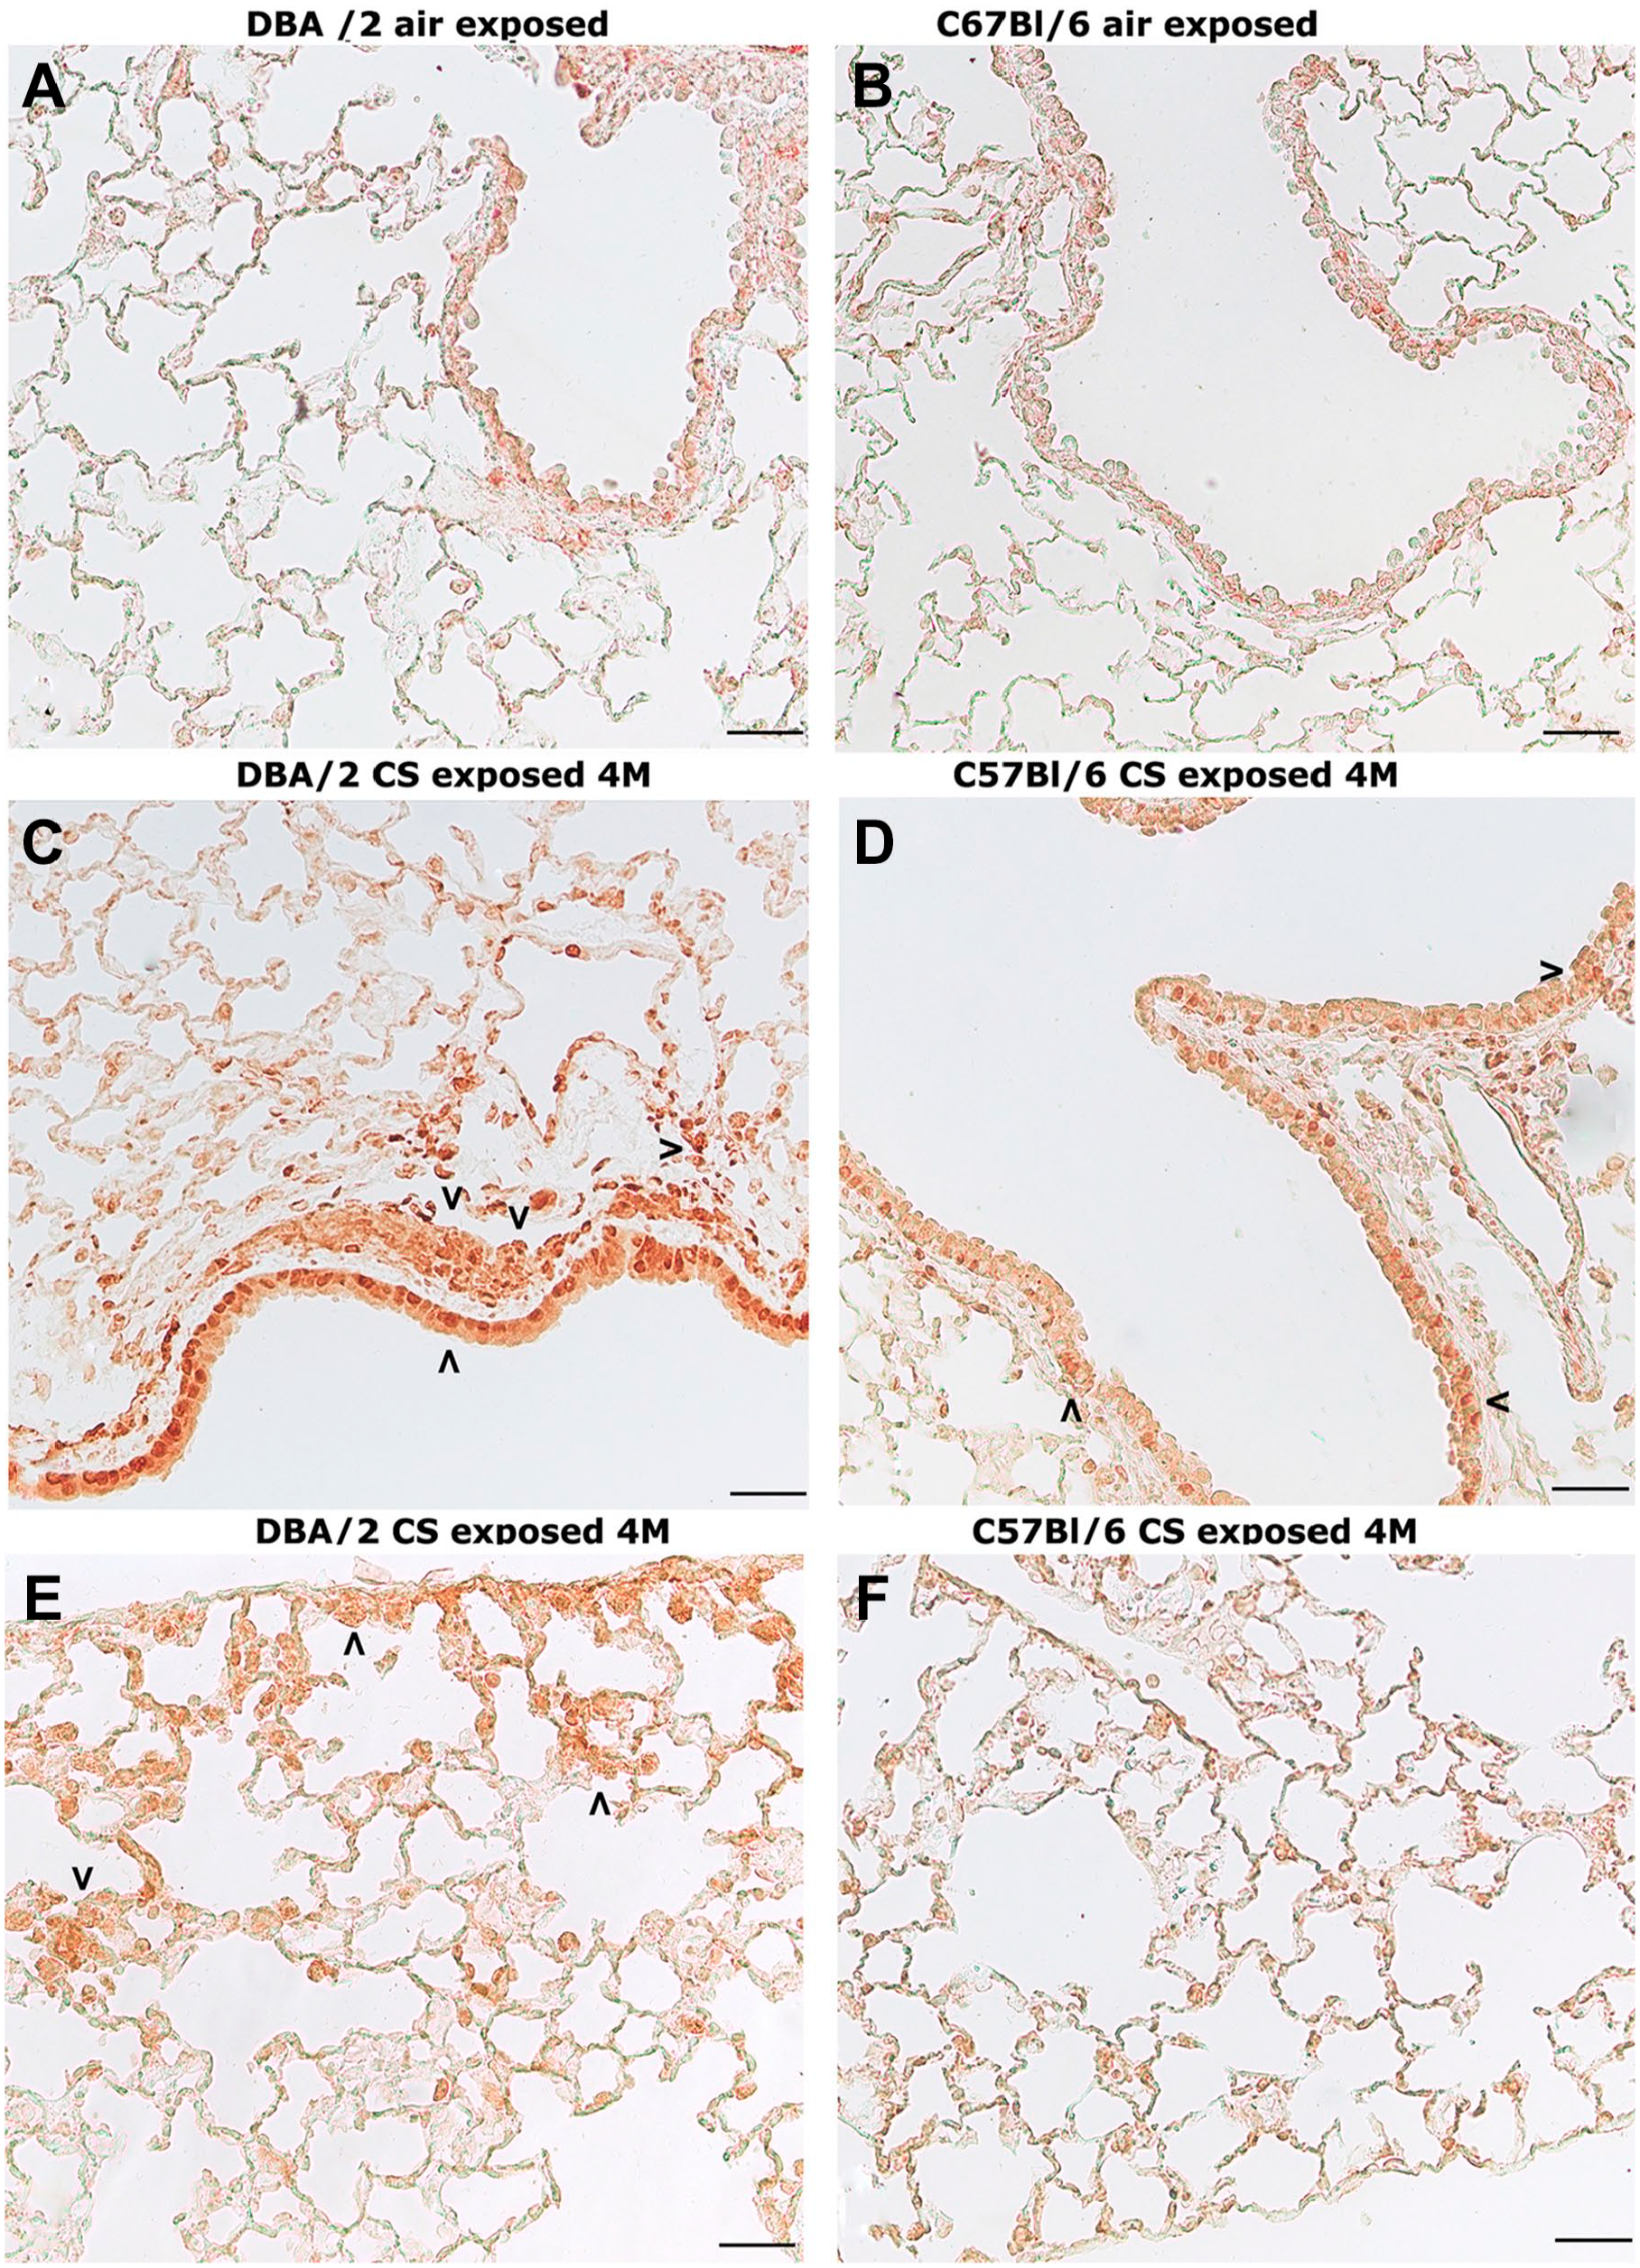
Representative sections from lung parenchyma after immunolocalization of 8-oxo-7,8-dihydro-2′-deoxyguanosine (8-OHdG). (A) Immunohistochemical staining for 8-OHdG in lung from an air-exposed DBA/2 mouse at 4 months from the start of the study showing no positivity. (B) Immunohistochemical staining for 8-OHdG in lung from an air-exposed C57BL/6 mouse at 4 months from the start of the study showing no positivity. (C and D) Positive staining for 8-OHdG is seen on the nuclei of parenchyma and bronchiolar cells (>) in lung for DBA/2 (C) and C57BL/6 (D) mice at 4 months of CS exposure. (E) An intense staining for 8-OHdG is present in subpleural areas of DBA/2 mice (>) at 4 months of CS exposure. (F) A very faint or practically null reaction is seen in subpleural areas of C57BL/6 mice at the same time from the start of the treatments. (A–F) Scale bars = 50 µm. Abbreviation: CS: cigarette smoke.
DBA/2 mice at 4 months of CS exposure show mark-ed positivity for 8-oxo-7,8-dihydro-2′-deoxyguanosine (8-OHdG) in airways and fibromuscular layer cells (Fig. 4C) as well as in subpleural areas and central parts of the lung parenchyma (Fig. 4E) where, as published before, emphysema develops. At 4 months, C57BL/6 mice show a slight but clear positivity for 8-OHdG under the airway structures (Fig. 4D) and trivial or no positivity in the subpleural areas (Fig. 4F).
In peribronchial areas of both strains of mice, immunohistochemical investigation reveals at 7 months of CS exposure strong positivity for the fibrogenic cytokines TGF-β, PDGF-B and CTGF in DBA/2 (Fig. 5C, F, and I), and C57BL/6 mice (Fig. 6C, F, and I).
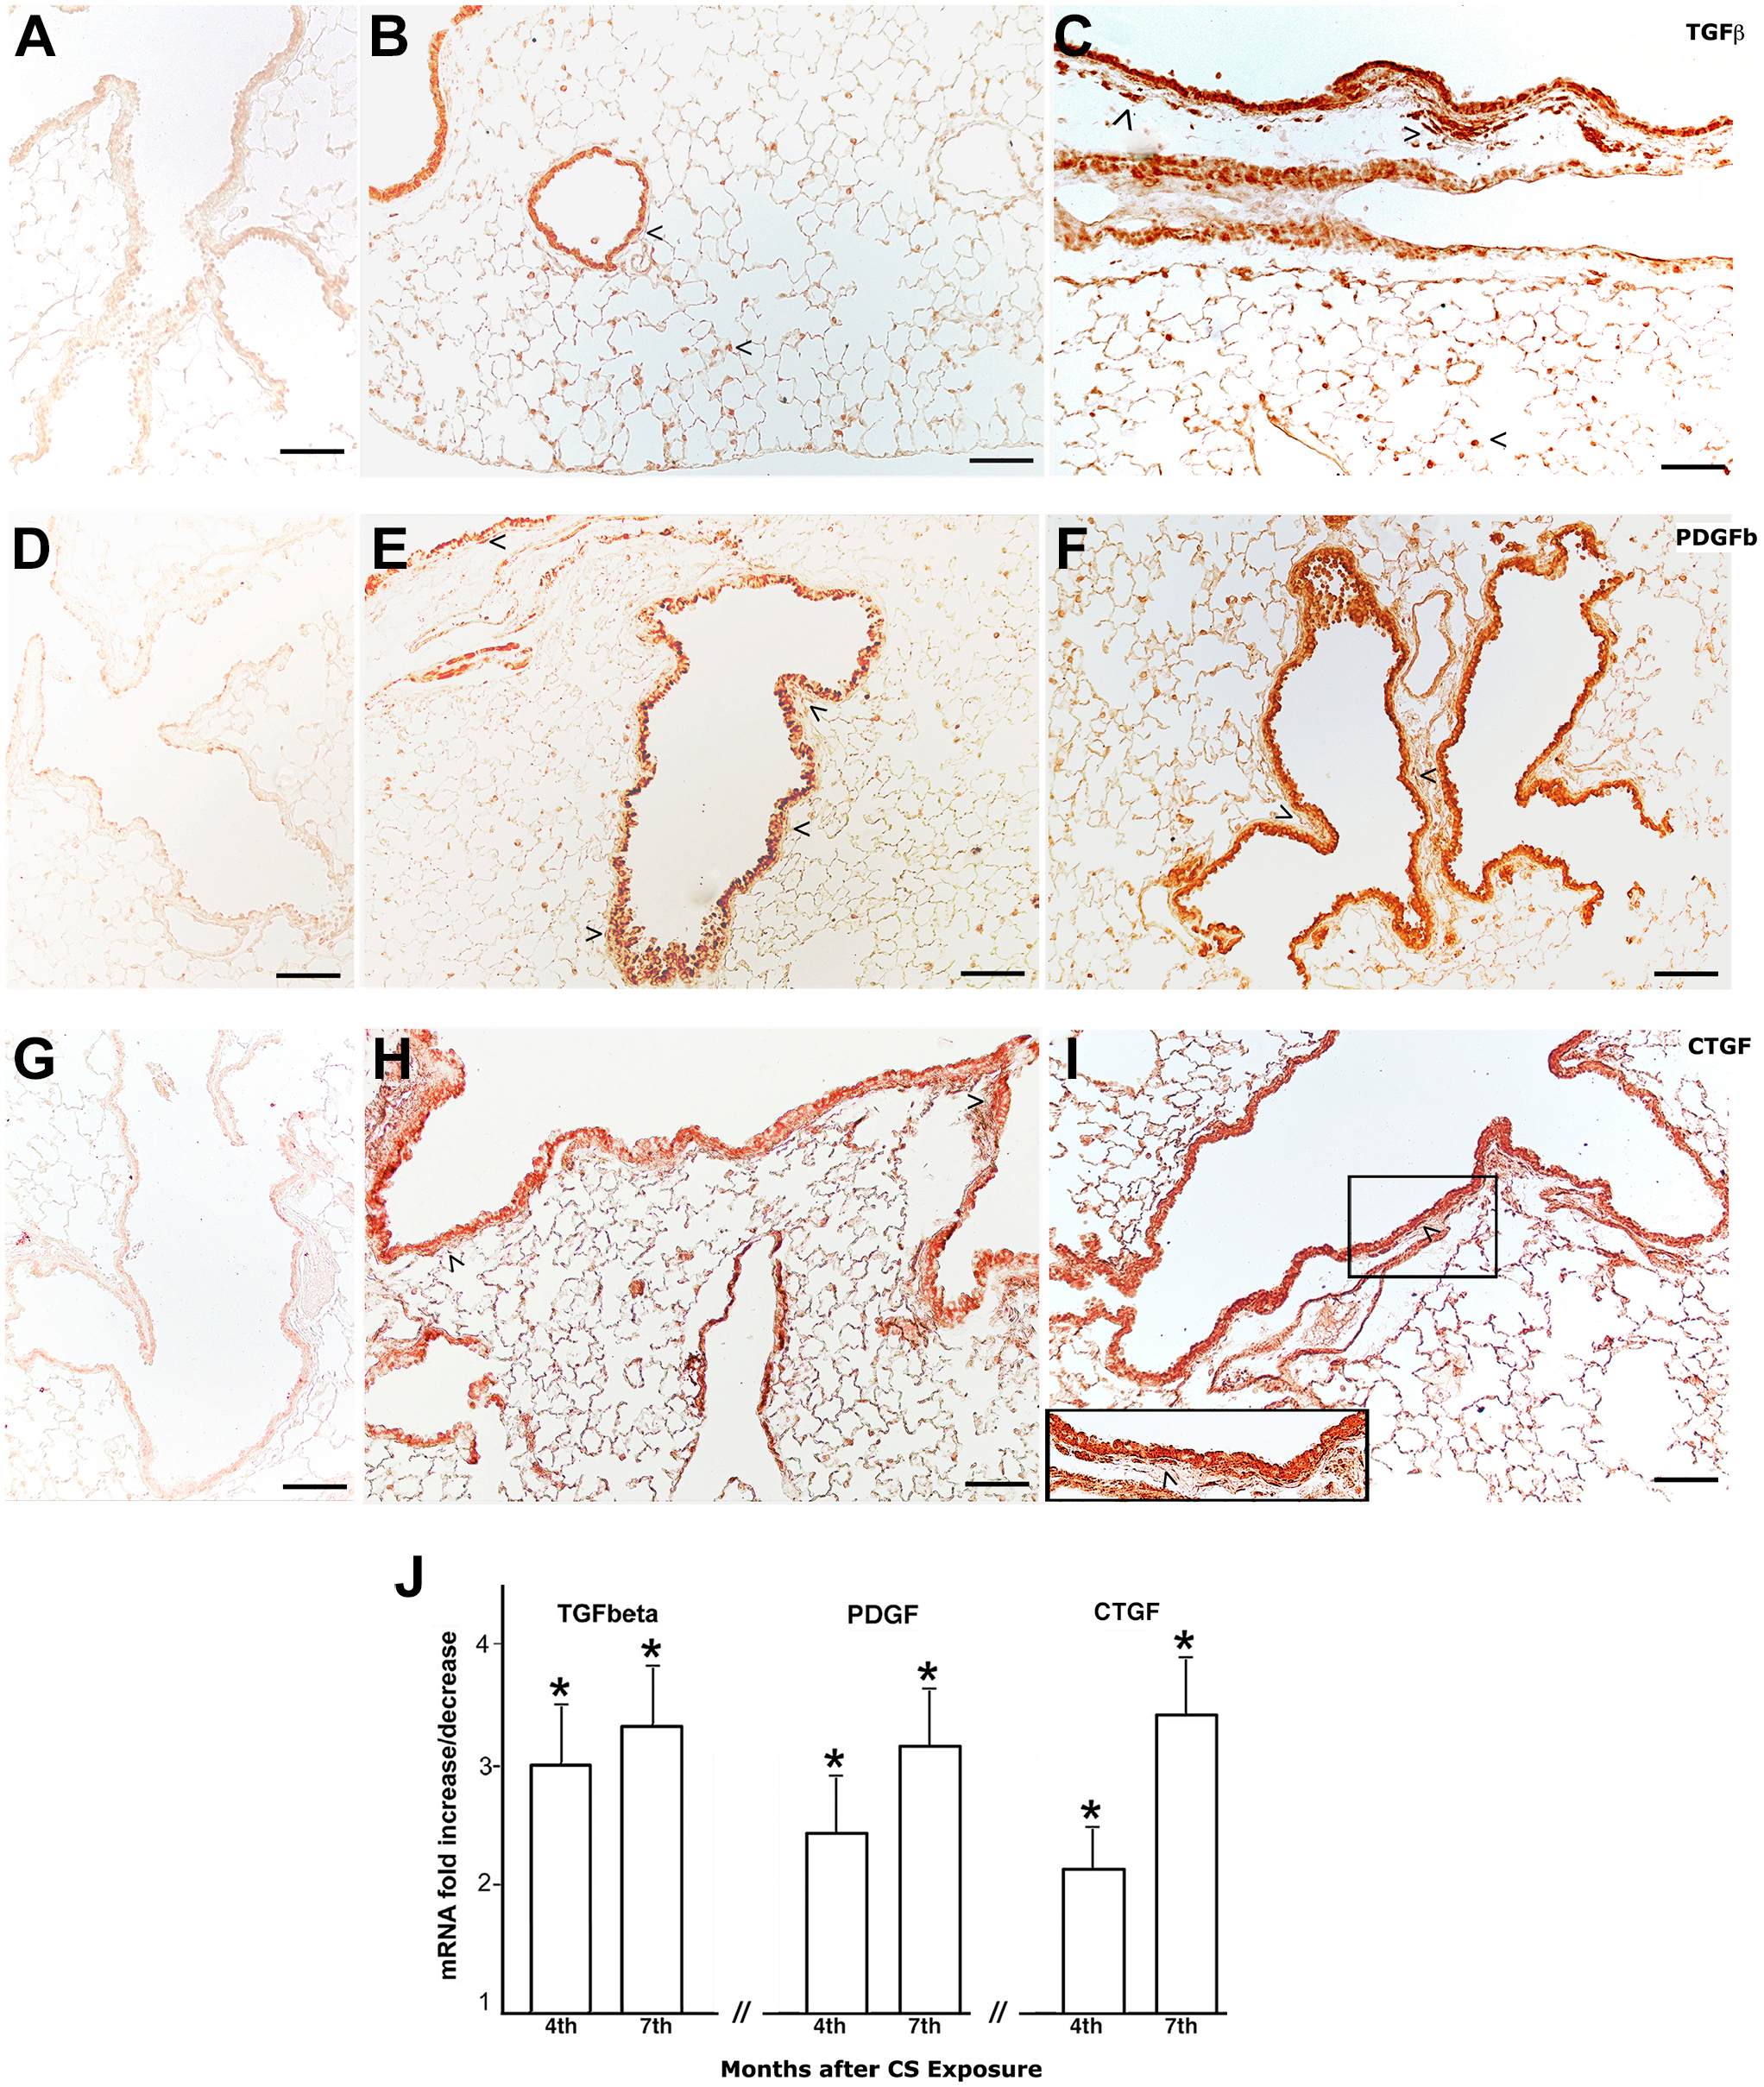
Representative sections from the lung parenchyma of DBA/2 mice after immunolocalization of TGF-β, PDGF-B, and CTGF. Real-time PCR analysis of mRNAs for TGF-β, PDGF-B, and CTGF. (A–C) Immunohistochemical staining for TGF-β in lung slices from air control (A) and CS-exposed DBA/2 mice at 4 (B) and 7 (C) months from the start of the study. Intense positivity (>) on bronchi, bronchioles, and on cells of the central part of the parenchyma is evident at 4 and 7 months. Air control mice have no cells that stained positive for TGF-β. (D–F) Immunohistochemical staining for PDGF-B in lung from CS-exposed DBA/2 mice at 4 (E) and 7 (F) months from the start of the study showing positivity around peripheral airways (>). A very faint or null immunoreaction is present in lung slices of air control mice (D). (G–I) The immunohistochemical stain for CTGF in the lung slices from DBA/2 mice at 4 (H) and 7 (I) months of CS exposure. CTGF shows a similar distribution to that observed for TGF-β and PDGF-B in DBA/2 mice. In the insert of Fig. (I), higher magnification of the CTGF reaction can be appreciated. No reaction is observed in lung slices of air control mice (G). (J) Real-time PCR analysis of mRNA for TGF-β, PDGF-B and CTGF carried out in lungs from six DBA/2 mice at 4 and 7 months after CS exposure reveals a marked and significant increase of these cytokines. Values of transcripts for TGF-β, PDGF-B and CTGF are corrected for 18S rRNA and normalized to a median control value of 1.0. Error bars indicate mean ± SD. *p<0.05 versus controls. (A–I) Scale bars = 100 µm. Abbreviations: TGF-β, transforming growth factor-β; PDGF-B, platelet-derived growth factor B; CTGF, connective tissue growth factor; PCR, Polymerase Chain Reaction; mRNA, messenger RNA.
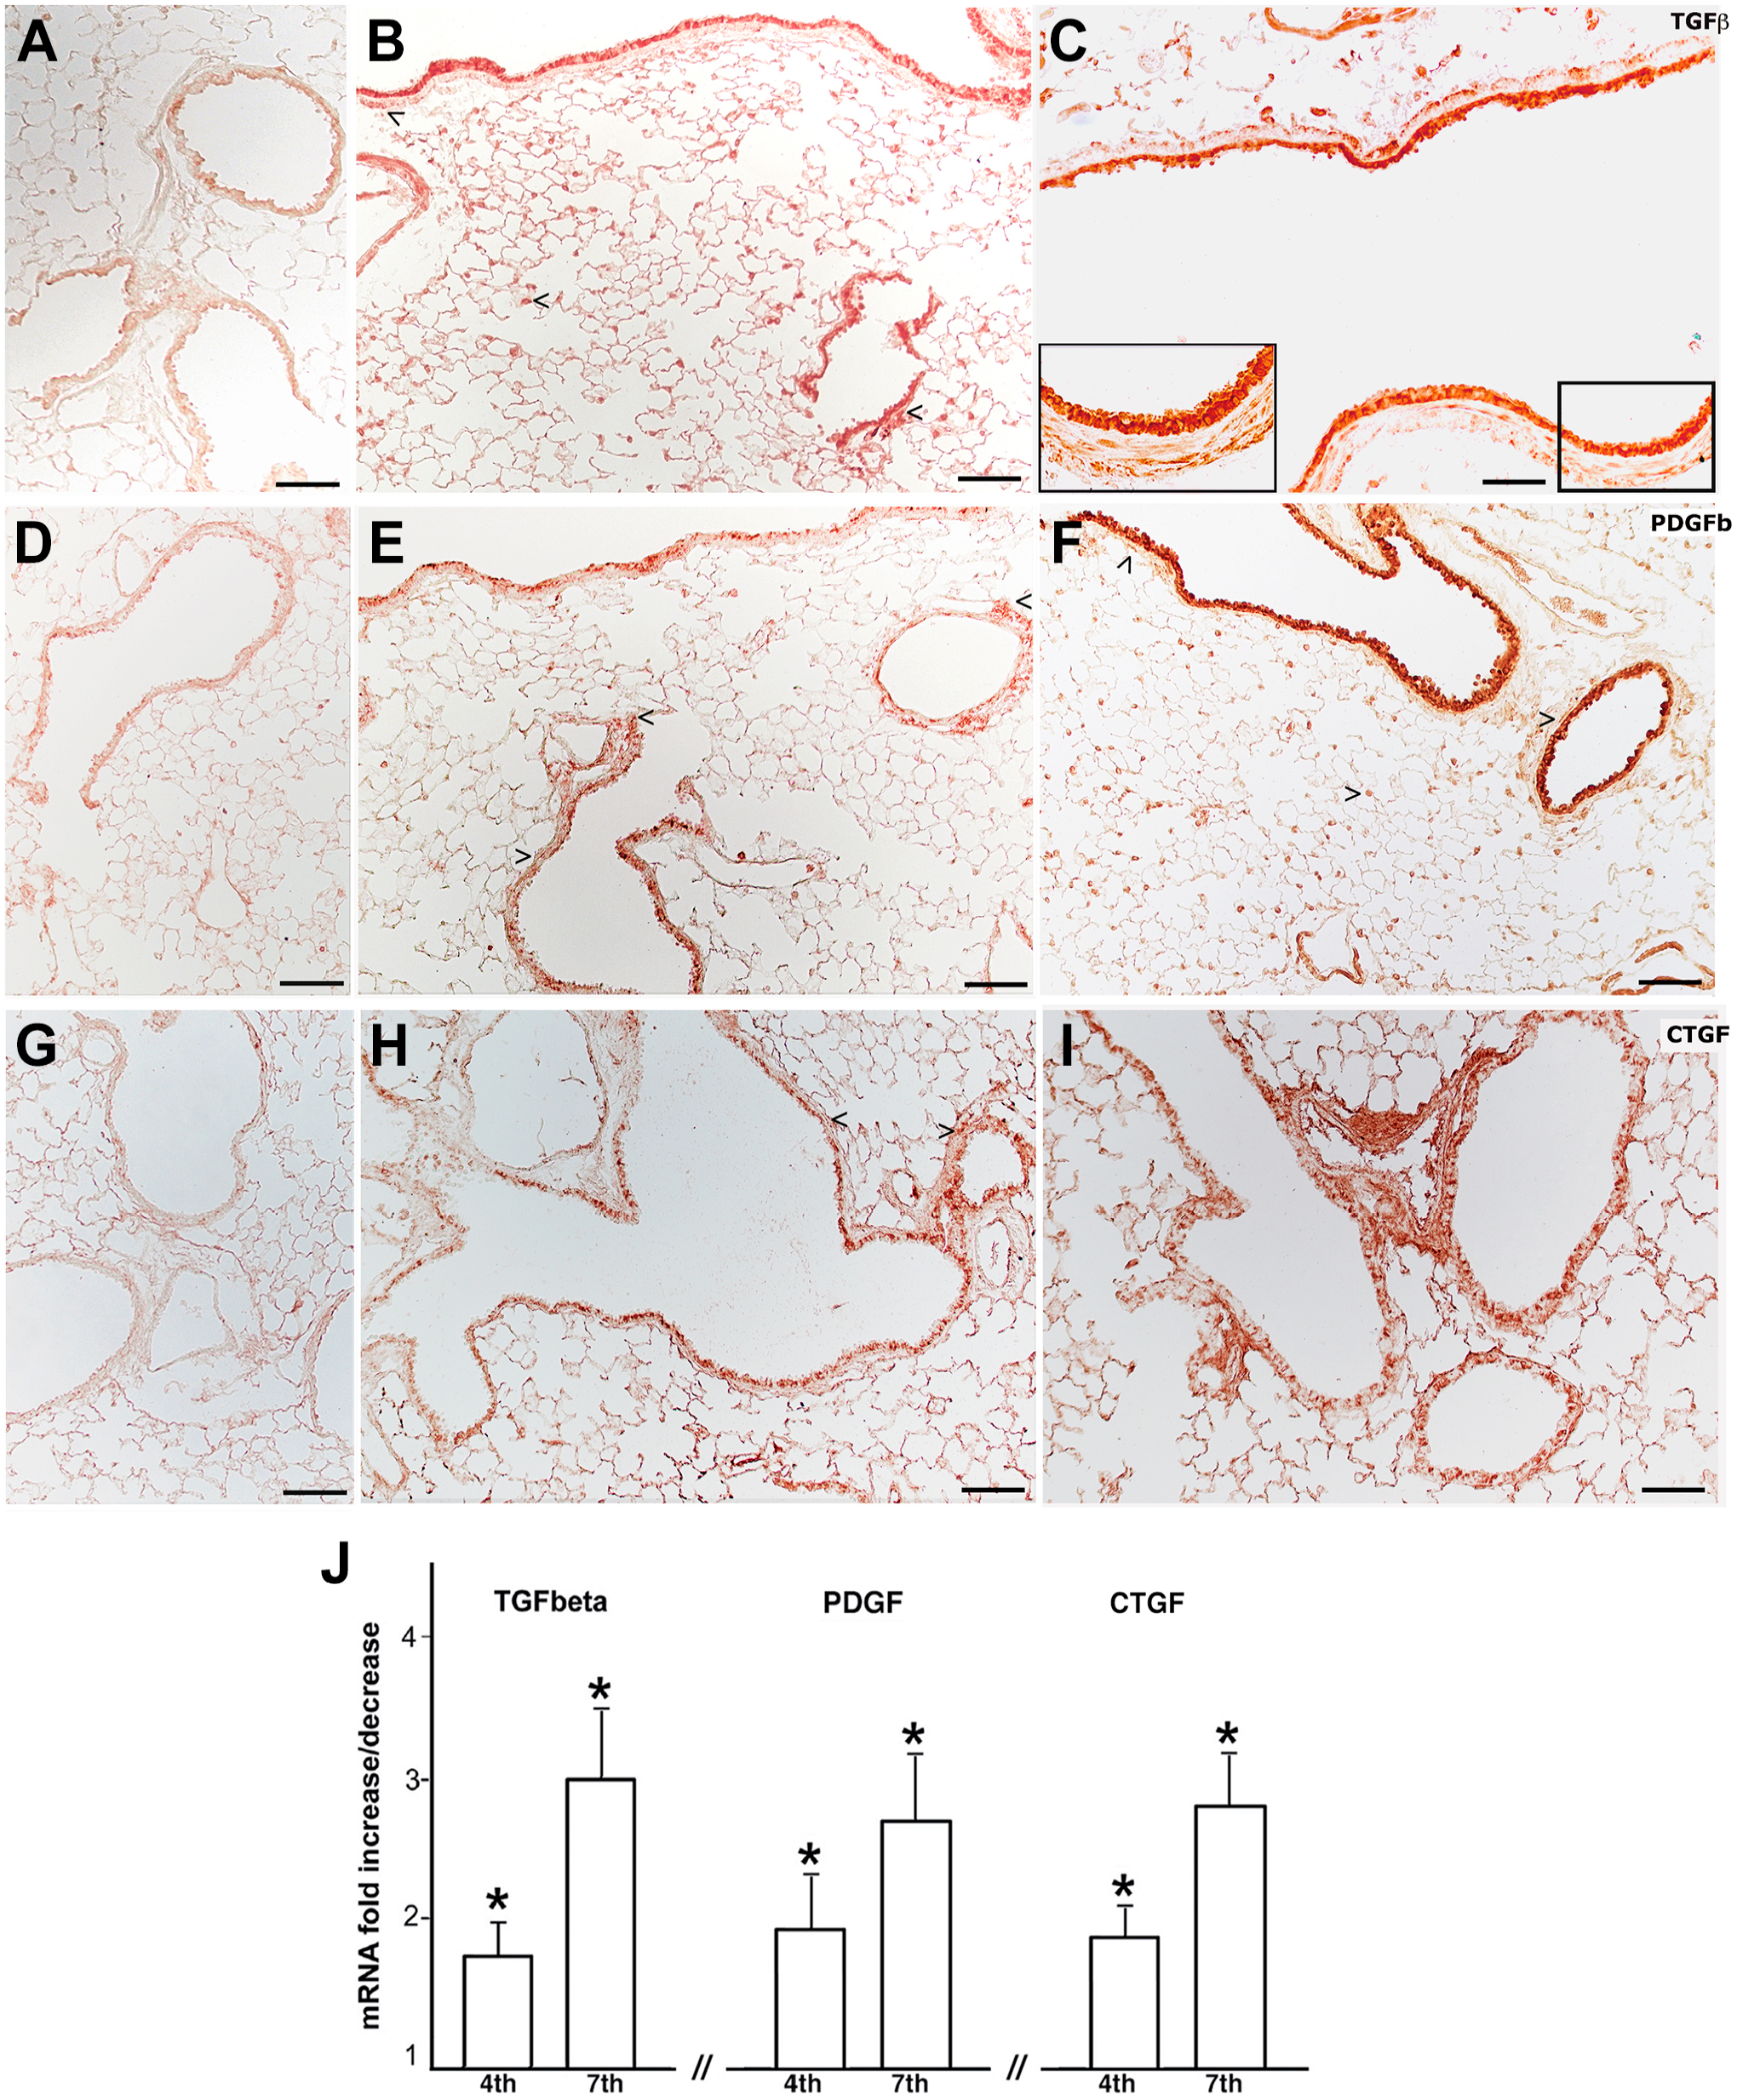
Representative sections from the lung parenchyma of C57BL/6 mice after immunolocalization of TGF-β, PDGF-B, and CTGF. Real-time PCR analysis of mRNAs for TGF-β, PDGF-B, and CTGF. (A–C) Immunohistochemical staining for TGF-β in lung slices from air control (A) and CS-exposed C57BL/6 mice at 4 (B) and 7 (C) months from the start of the study. Intense positivity on bronchi, bronchioles, and the central part of the parenchyma is evident at 4 and 7 months. In insert of Fig. 6(C) higher magnification of the TGF-β reaction can be appreciated. Air control mice have no cells that stained positive for TGF-β (A). (D–F) Immunohistochemical staining for PDGF-B in lung from cigarette smoke exposed C57BL/6 mice at 4 (E) and 7 (F) months from the start of the study showing positivity around peripheral airways (>). No immunoreaction for PDGF-B is observed in lung slices of air control mice (D). (G–I) The immunohistochemical stain for CTGF in the lung slices from C57BL/6 mice at 4 (H) and 7 (I) months of CS exposure. CTGF shows a similar distribution to that observed for TGF-β and PDGF-B in the same strain. No reaction is observed in lung slices of air control mice (G). (J) Real-time PCR analysis of mRNA for TGF-β, PDGF-B and CTGF carried out in lungs from six C57BL/6 mice at 4 and 7 months after cigarette smoke exposure reveals a significant increase of these cytokines. Values of transcripts for TGF-β, PDGF-B and CTGF are corrected for 18S rRNA and normalized to a median control value of 1.0. Error bars indicate mean ± SD. (A–I) Scale bars = 100 µm. Abbreviations: TGF-β, transforming growth factor-β; PDGF-B, platelet-derived growth factor B; CTGF, connective tissue growth factor; mRNA, messenger RNA; rRNA, ribosomal ribonucleic acid. *p<0.05 versus controls.
Some differences between the two strains in the distribution and intensity of their expression seem to be present at 4 and 7 months from the beginning of the experiments (Figs. 5 and 6). However, an intense staining for TGF-β, PDGF-B and CTGF is present in subpleural areas, and around peripheral airways of DAB/2 and C57BL/6 mice from 4 months onwards (Figs. 5B, E, and H and 6B, E, and H).
These changes are in line with what we found by analyzing the mRNA expression of the three cytokines in the whole lung tissues of the two murine strains at 4 and 7 months of exposure to CS. Real-time PCR analysis of mRNA for TGF-β, PDGF-B and CTGF carried out on lungs from six mice for each experimental group at 7 months after CS exposure or air exposure revealed a marked and significant increase of these cytokines between air and smoking groups within the same strain (Figs. 5J and 6J). At 7 months, the expression levels of TGF-β PDGF-B and CTGF do not appear substantially different between the two strains of mice. At 4 months after CS exposure, the increase in the expression of these cytokines with respect to air control mice appears more evident in DBA/2 (Fig. 5J), when a mild but significant increase is observed in C57BL/6 mice (Fig. 6J).
The immunohistochemical reactions for the three cytokines in control mice from the DBA/2 and C57BL/6 strains are shown in Figs. 5A, D, and G and 6A, D, and G, respectively. A very weak or practically null reaction is observed for the three cytokines in lung slices of control mice of the DBA/2 strain (Fig. 5A, D and G) and C57BL/6 (Fig. 6A, D and G).
The Increased Expression of Fibrogenic Cytokines in the Two Strains Results in an Increased Mitotic Activity
An immunohistochemical reaction for the proliferating cell nuclear antigen (PCNA) is practically absent in lung slices from the control mice of the two strains (Fig. 7A and B). PCNA positivity is particularly visible at 4 months after the initiation of exposure to CS on the epithelial cells of airways and on their lower bounding layer cells of DBA/2 (Fig. 7C) and C57BL/6 strain (Fig. 7D), as well as in the central part of the lung parenchyma and in subpleural zone of DBA/2 (Fig. 7E) and of C57BL/6 mouse (Fig. 7F).
Representative histologic section after immunostaining for proliferating cell nuclear antigen (PCNA). (A and B) Lung slices from DBA/2 (A) and C57BL/6 (B) control mice showing no reaction for proliferating cell nuclear antigen (PCNA) on lung and airway structures. (C and D) Airway structures from DBA/2 (C) and C57BL/6 (D) CS-exposed mice at 4 months showing a clear positivity of proliferating cell nuclear antigen staining on airway cells (>). (E and F) Lung parenchyma cells from DBA/2 (E) and C57BL/6 (F) CS-exposed mice at 4 months showing a positive reaction for proliferating cell nuclear antigen (>) in peripheral and subpleural areas. (A–F) Scale bars = 100 µm. Abbreviation: CS, cigarette smoke.
Early Changes in the Expression of SIRT-1 Characterizes Airways Epithelial Cells of DBA Mice
It has been recently reported that NAD-dependent deacetylase sirtuin-1 (SIRT-1) plays an important role in the prevention of lung cellular responses and airway remodeling in mice and in COPD patients by reducing premature cellular senescence.
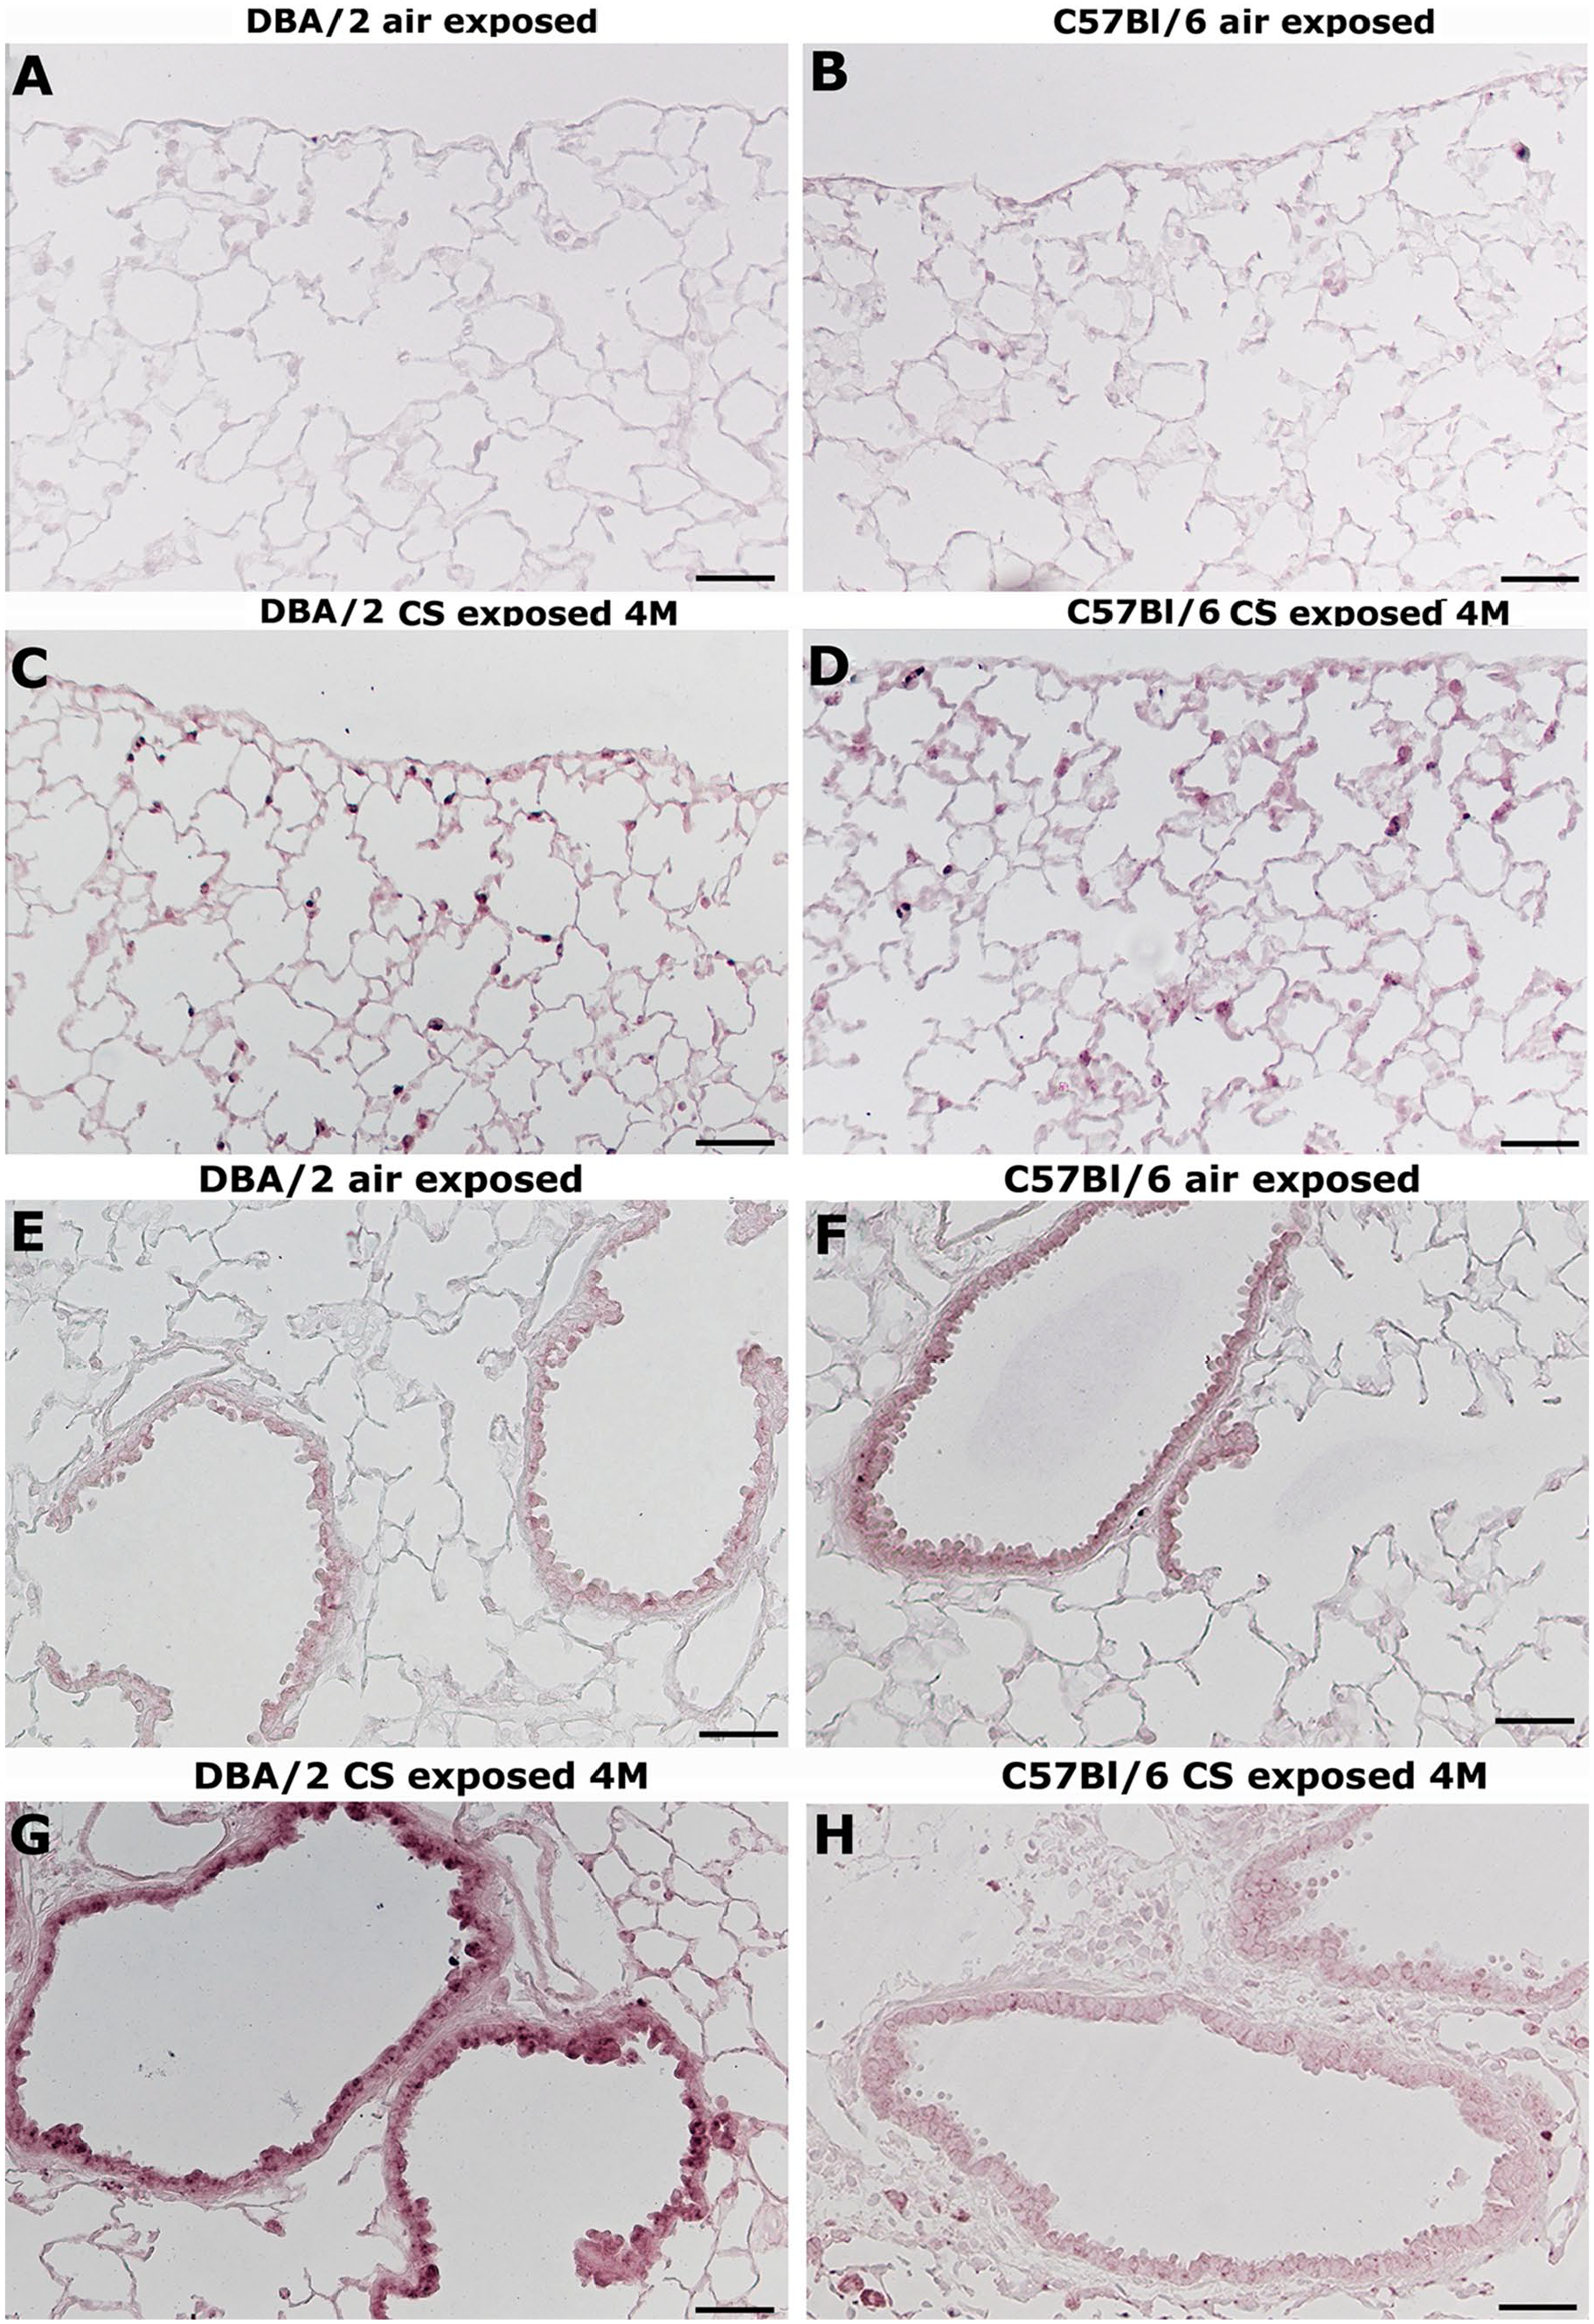
In the authors’ series, we observe positive staining for SIRT-1 in the lungs of air-exposed animals from both strains that is especially evident in airways epithelial cells (Fig. 8A and B). The exposure to CS results in an attenuation of SIRT-1 expression in airways epithelial cells that is appreciable in DBA/2 mice as early as 1 month onwards from the start of the experiment (Fig. 8C and E). In contrast, C57BL/6 mice maintain a weak SIRT-1 positivity for up to 4 months after smoke exposure (Fig. 8D and F) and show a complete disappearance at 7 months from the start of the experiment (data not shown).
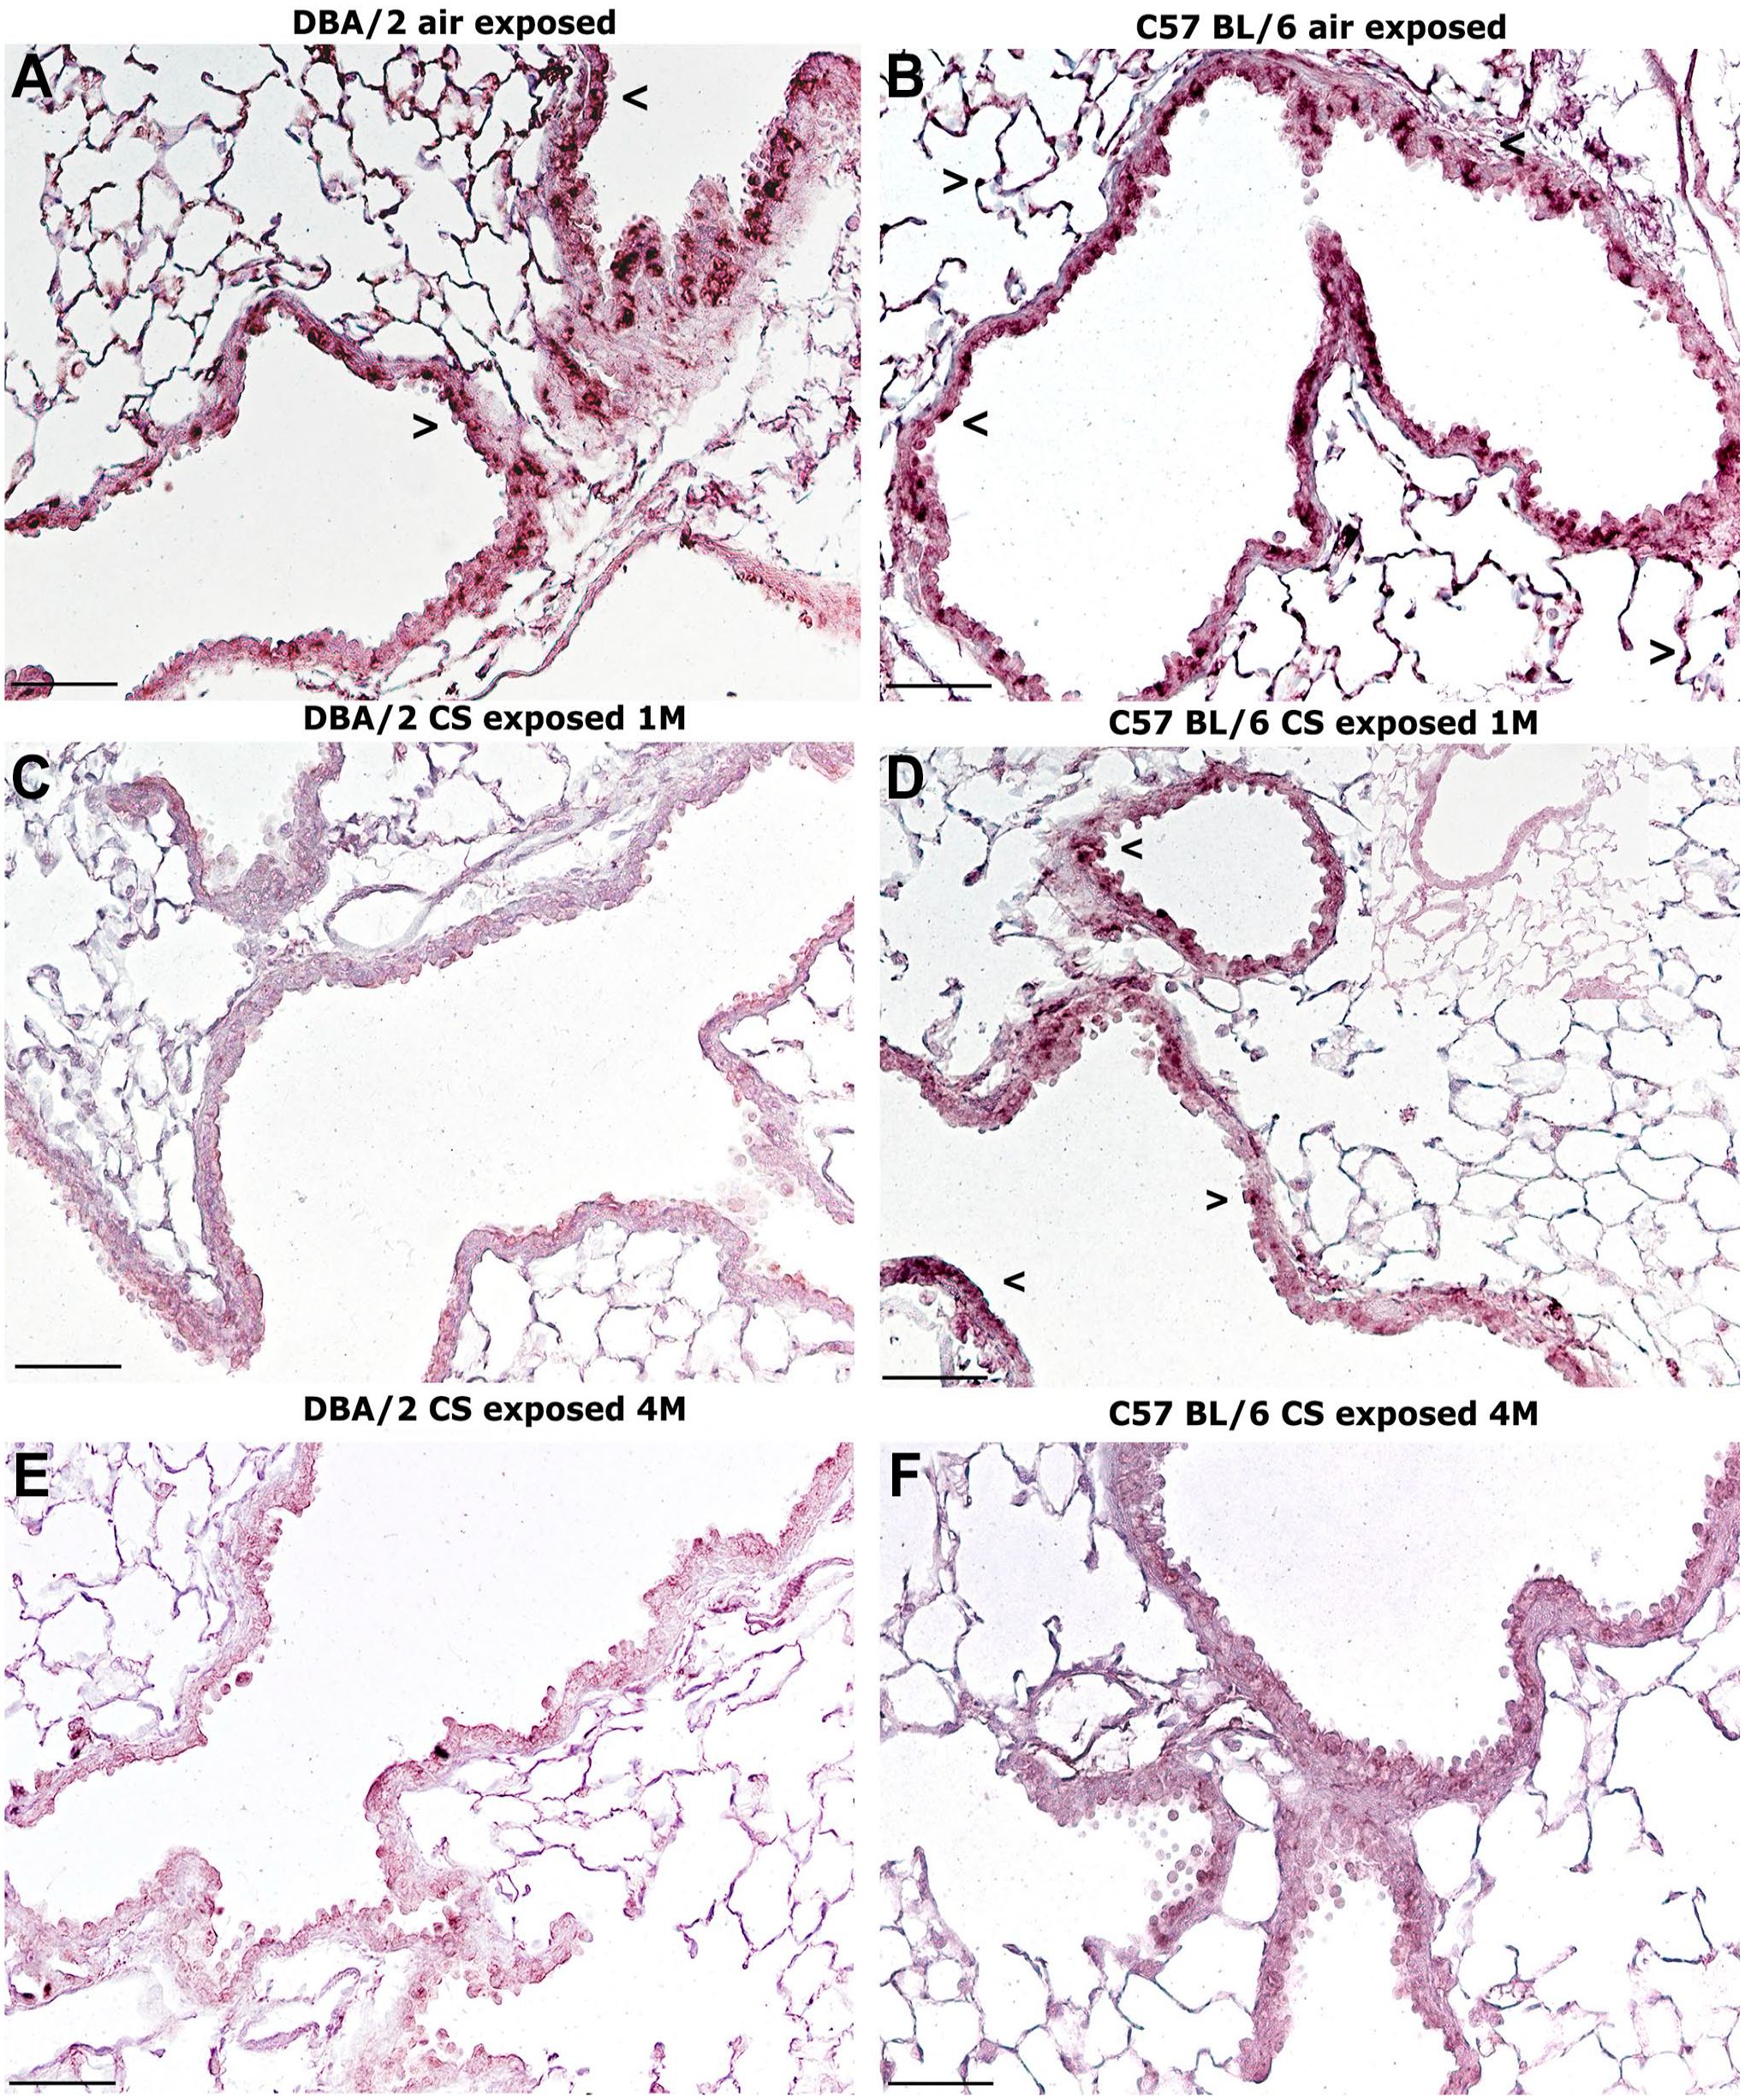
Immunohistochemical reaction for NAD-dependent deacetylase SIRT-1. (A and B) Positive staining for SIRT-1 in the lungs of air-exposed animals from DBA/2 (A) and C57BL/6 (B) mice is seen in alveolar and airway epithelial cells (>). (C and D) At 1 month of CS exposure, decreased expression of SIRT-1 is observed in DBA/2 mice (C), when a faint positivity is still maintained in C57BL/6 mice (D). (E and F) At 4 months of CS exposure, very little or no reaction is observed in C57BL/6J (E) and DBA/2 (F) mice. (A–F) Scale bars = 100 µm. Abbreviations: NAD, nicotinamide adenine dinucleotide; SIRT-1, sirtuin-1; CS: cigarette smoke.
The number of SIRT-1 positive cells in small airways of both mouse strains and at the various times is reported in Fig. 9.
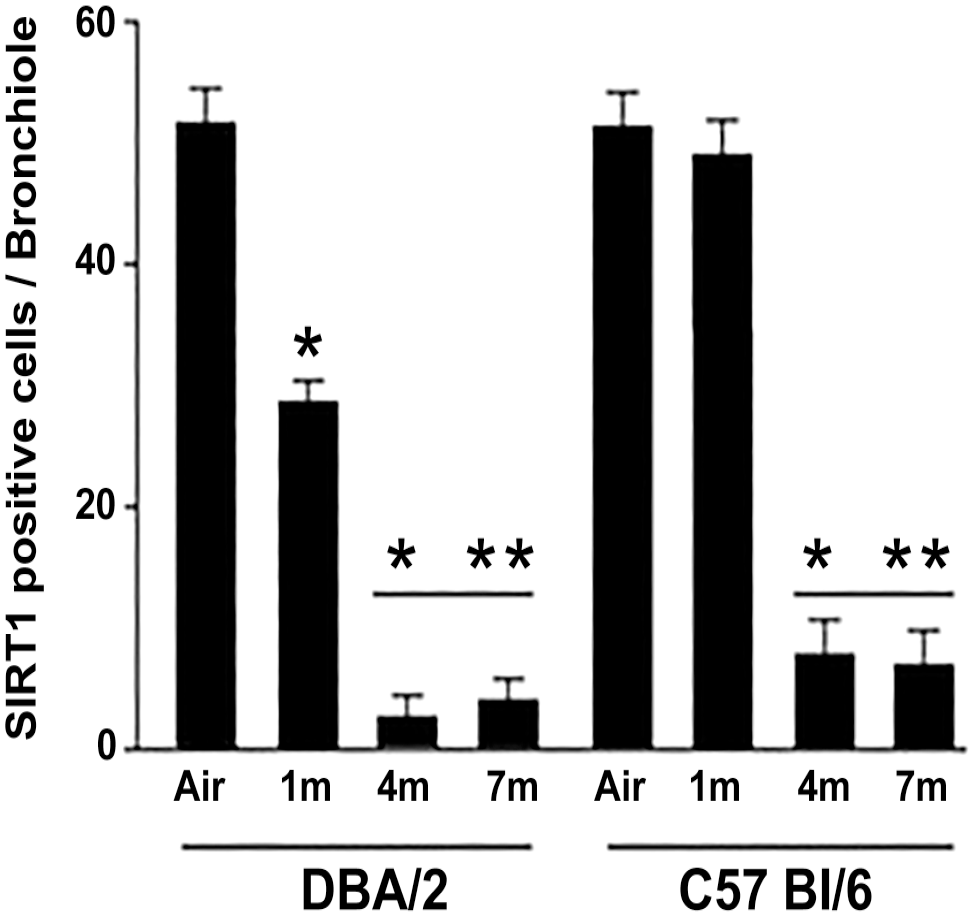
SIRT-1 positive cells in small airways at the various times from the start of the experiments. The number of individual cells staining positive for SIRT-1 in small airways structures was counted using a light microscopy and expressed as the number of cells per bronchiole with 150–200 µm internal diameter. A minimum of ten bronchioles was counted per each animal. Error bars indicate mean ± SD. Abbreviations: SIRT-1, sirtuin-1; SD, standard deviation.*p<0.05 versus air controls: **p<0.05 versus smoking mice at 1 month of exposure.
Apoptosis in Lung Parenchyma and Peribronchial Areas
Lung slices of DBA/2 and C57BL/6 mice from air control group do not reveal positivity for cleaved caspase-3 (Fig. 10A, B, E, and F).
Representative immunohistochemical reaction for cleaved Caspase-3 in mouse lungs from the different experimental groups. (A and B) Immunohistochemical analysis reveals no evident reaction of cleaved caspase-3 in bronchial epithelial cells and in lung parenchyma from DBA/2 (A) and C57BL/6 (B) mice exposed to room air. (C and D) After 4 months of CS exposure, a widespread reaction for cleaved caspase-3 is observed in the lung parenchyma from DBA/2 (C) and C57BL/6 (D) mice. This reaction is evident at the time when the development of emphysema is not fully complete. (E and F) A faint reaction of cleaved caspase-3 is seen in cells of the airways structures and in lung parenchyma from DBA/2 (E) and C57BL/6 (F) mice exposed to room air. (G and H) After 4 months of CS exposure an almost absence of positivity is seen in the sub-bronchiolar fibromuscular layer of DBA/2 (G) and C57BL/6 (H) mice. A positivity for cleaved caspase-3 is seen in several epithelial cells lining airways of DBA/2 mice. (A–H) Scale bars = 50 µm. Abbreviation: CS: cigarette smoke.
Representative sections of lung parenchyma of smoking mice from DBA/2 and C57BL/6 strains at 4 months of exposure are shown in Fig. 10C and D, respectively. As reported in previous study, the exposure to CS in mice is associated by a significant increase of alveolar macrophage and lung epithelial cell apoptosis. 11 In the present series, at 4 months of exposure several apoptotic cells (cleaved caspase-3 positive) are uniformly distributed throughout the parenchyma in CS-exposed mice of both strains (Fig. 10C and D). This feature is consistent with the uniform dilation of the air spaces that develops in these strains (Table 3). The appearance of apoptosis is particularly evident at 4 months when the dilation of the air spaces is not yet fully developed. On the contrary, at 4 months of smoking exposure, an almost complete absence of cleaved caspase-3 positive cells is seen in peribronchial areas of both strains (Fig. 10G and H).
Discussion
Airway remodeling consists in a modification of structural cells and tissues leading to the development of a new airway-wall structure which can be present in chronic pulmonary disease such as asthma or COPD. In COPD, principal among these changes is airways fibrosis with an increase in smooth muscle mass and goblet cell hyperplasia/metaplasia.
Airways fibrous remodeling is a common feature of COPD. 29 Clinical studies carried out in patients within each GOLD stage have shown that as the disease progresses, there is an increase in airway wall thickness which can also be largely attributed to this process. 30 The airways fibrous remodeling can affect lung function parameters in COPD, influencing a rapidly progressing phenotype in quickly declining patients. 30 This can result in airway constriction in smoking individuals with COPD. 31 Thus, the potential therapeutic approaches for targeting contractile myofibroblasts in the pulmonary structures of the different COPD phenotypes is one of the major therapeutic goals to be pursued in the care of COPD patients. At the present time, there is no specific and effective treatment for this condition, and current therapeutic success is unsatisfactory because of limited insight into the pathogenic mechanisms leading to collagen accumulation in particular sites of the pulmonary interstitium and around small bronchioles. Several stimuli and putative mediators in the induction of fibrous remodeling in COPD have also been considered. These include DNA damage induced by oxidants, cellular senescence with the expression of SASPs involved in processes affecting transcription (i.e., epigenetic alteration) and metabolism (i.e., fibrotic cytokines), and the lack of apoptosis mechanisms.
The role of oxidative damage and cell senescence in the development of fibrous remodeling in COPD is still an object of research. One of the major impediments for understanding the underlying pathogenic mechanisms is the limited access to human samples, which are available only from lung explants and autopsy specimens at very late stage of disease. Thus, a clear correlation between oxidative stress, cellular senescence, and fibrous remodeling is not found in human studies, nor in laboratory animal studies. In the latter studies, the increase or the decrease in several factors secreted by senescent cells and involved in the remodeling process have been highlighted, but there have been no indications of their lung compartmentalization or of what happens at the various anatomical sites in which fibrotic remodeling develops.
In this study, we demonstrate that in sites in which airways fibrous remodeling develops, the phenotypic change in fibroblasts and myofibroblasts is preceded by the decreased expression of SIRT-1, which parallels the increased expression of p16ink4A and MyoD and other senescence-secreted factors, including some fibrogenic cytokines such as TGF-β, PDGF-B, and CTGF. These cytokines, whose expression is nearly absent in airway epithelial cells of untreated mice or unaffected humans, is highly expressed after exposure to CS beneath the basement membranes where fibrotic remodeling originates. 32 This can profoundly and permanently alter the composition of the extracellular matrix in the sense of fibrosis 33 and can promote in concert the differentiation of myoblasts into myofibroblasts, as well as their metabolic activation, 34 because of the increase in the expression of alpha SMA.
Of interest, changes in SIRT-1 expression appear very early in DBA/2 mice, preceding the development of lung air space enlargements and airways changes. In C57BL/6 mice, changes in SIRT-1 expression appear later but still precede airways remodeling as well as alveolar changes.
The decreased expression of SIRT-1 in both strains of mice can enhance cellular senescence and the expression of SASPs such as p16ink4A, which prompts the cells to go into senescence, leading to the arrest of the G1 cell cycle 35 and MyoD, which induces cell cycle arrest and at the same time promotes the cellular terminal differentiation of fibroblasts into myofibroblasts.36,37 MyoD also determines resistance to apoptosis in senescent myofibroblasts and opposes their dedifferentiation. 37
Notably, the appearance of apoptotic cells in both strains is particularly evident in lung parenchyma at the time when the dilation of the air spaces is not yet fully developed (at 1 and 4 months after CS exposure). It may be speculated that apoptotic cell death in these areas could be the initiator of emphysema by facilitating the influx of neutrophil elastase or other proteases into the alveolar septum, 27 which can cause elastinolysis, lung elastin loss,7,9,38 and breaks in the alveolar walls.7,39 On the contrary, at the same time points, we found a lack and an almost complete absence of apoptotic cells in subpleural and sub-bronchial areas, respectively. This may contribute to the onset of fibrous remodeling in these strains via blocking the apoptotic pathway. Apoptosis mediated by p16ink4A in sub-bronchial areas may be ineffective because of the Bcl-2 decline, as described in G-1 arrested myofibroblasts, 40 which can be favored and induced by persistent expression of MyoD.
The different extent and time of development of these phenotypic changes we observed after exposure to CS in the two strains appears to be strongly associated with the different sensitivity to oxidative stress, toward which the DBA/2 strain is particularly prone. This conclusion is based on the extent and anatomical localization of DNA damage produced by toxic oxygen radicals as determined by immunohistochemical positivity for 8-hydroxy-2′ deoxyguanosine (8-OHdG), an oxidative DNA adduct. 41 A more marked positivity of 8-OHdG in cells of the subpleural areas, of the central parts of the lung parenchyma, and of airways and their fibromuscular layers is already evident at 4 months of exposure in the DBA/2 strain as compared with the C57BL/6 strain.
It has long been known that damage related to oxidative stress can induce cell senescence and may favor aging and the development of several associated diseases.14,15
In the past, interest in potential therapeutic approaches to target stromal cells has predominantly focused on antioxidants, which have the potential to suppress senescence and inflammatory SASPs, or TGF-β, the most important fibrogenic cytokine. Unfortunately, these two strategies have so far not produced satisfactory results. The neutralization by antibodies or the inhibition of the TGF-β receptor, which can attenuate fibrous remodeling in laboratory animals,42–44 can have significant safety concerns in humans due to the possibility of autoimmune diseases due to a lack of immunoregulation in the absence of this factor.45,46 In addition, antioxidant therapy, as demonstrated by extensive clinical studies, has not given rise to real beneficial effects. 47 Consequently, other strategies should be adopted to attenuate the fibrotic remodeling and thus prevent disease progression and improve the quality of life of COPD patients. These should include new strategies to target age-associated pathological dysfunction to promote myofibroblast dedifferentiation or the apoptotic clearance of senescent cells, which may be more effective than therapeutic strategies that block fibrosis development. The identification of novel senolytic or senomorphic agents, which induce the selective death of senescent cells or suppress senescence markers such as SASPs, respectively, could be of enormous importance for the development of new therapies.48,49
The findings reported in this paper strongly support such new studies.
Assuming that the mouse data are relevant to humans, the results of the present study suggest that a combination of senolytic and senomorphic drugs may dampen or prevent disease progression in COPD patients. Preclinical studies to be conducted by immunohistochemistry on murine lung compartments under the experimental conditions reported in the current work could guide the development of future viable therapies for some COPD phenotypes.
Some limitation to this study could be advanced. Due to the experimental approach of this study based mainly on immunohistochemistry, we decided not to use stereological measurements for emphysema as those suggested in ATS documents 50 to reduce potential sources of bias-associated paraffin embedding. These include determination of the Lm, ISA, and the number of alveoli in glycol methacrylate (GA) embedded tissue. The use of GA embedding strongly reduce this effect but unfortunately, it is also known that GA is unsuitable for immunohistochemical investigations, since GA and aldehyde fixation may impair antigenicity more than formaldehyde that can be used for paraffin embedding. 51 Furthermore, many established stains, including stains for immunohistochemistry might be a problem in plastic sections. 52
However, as reported in the Introduction section, this study has been performed to complete previous studies on airways remodeling on the same mouse strains (C57BL/6 and DBA/2) in which in a series of studies we evaluated and verified the presence of true emphysema by investigating additional biochemical (i.e. total lung elastin and desmosine) and morphological parameters, such as destructive index (DI)7,38,39 according to Eidelman and coworkers. 53 These two parameters are closely associated to alveolar destruction, one major features of pulmonary emphysema that distinguishes it from other conditions in which there is only dilatation of the air spaces without rupture of the septa.
Supplemental Material
sj-docx-1-jhc-10.1369_00221554231204926 – Supplemental material for Immunohistochemical Study of Airways Fibrous Remodeling in Smoking Mice
Supplemental material, sj-docx-1-jhc-10.1369_00221554231204926 for Immunohistochemical Study of Airways Fibrous Remodeling in Smoking Mice by Emilia Balzano, Giovanna De Cunto, Chiara Goracci, Barbara Bartalesi, Eleonora Cavarra, Giuseppe Lungarella and Monica Lucattelli in Journal of Histochemistry & Cytochemistry
Footnotes
Appendix
Competing Interests
The author(s) declared no potential conflicts of interest with respect to the research, authorship, and/or publication of this article.
Author Contributions
All authors have contributed to this article as follows: conceptualization, investigation, and writing—original draft preparation (EB, GDC), formal analysis, validation (EB, CG, BB), data curation (EB, CG, BB, EC), methodology (EC), writing—review and editing and funding acquisition (GL, ML), and supervision (ML).
Funding
The author(s) disclosed receipt of the following financial support for the research, authorship, and/or publication of this article: This study was supported by a grant Ministero dell’Istruzione, dell’Università e della Ricerca, Rome, Italy (Grant # 2008T5BLWA) (GL) and University Siena (Grant # 122004) (ML).
Ethics Approval
The study contains mice only. Approval was obtained from the Ethics Committee of the University of Siena and the Italian Health Ministry (no. 186/2015-PR).
References
Supplementary Material
Please find the following supplemental material available below.
For Open Access articles published under a Creative Commons License, all supplemental material carries the same license as the article it is associated with.
For non-Open Access articles published, all supplemental material carries a non-exclusive license, and permission requests for re-use of supplemental material or any part of supplemental material shall be sent directly to the copyright owner as specified in the copyright notice associated with the article.