
Abstract
Multiplex immunofluorescence (MxIF) images provide detailed information of cell composition and spatial context for biomedical research. However, compromised data quality could lead to research biases. Comprehensive image quality checking (QC) is essential for reliable downstream analysis. As a reliable and specific staining of cell nuclei, 4′,6-diamidino-2-phenylindole (DAPI) signals were used as references for tissue localization and auto-focusing across MxIF staining–scanning–bleaching iterations and could potentially be reused for QC. To confirm the feasibility of using DAPI as QC reference, pixel-level DAPI values were extracted to calculate signal fluctuations and tissue content similarities in staining–scanning–bleaching iterations for identifying quality issues. Concordance between automatic quantification and human experts’ annotations were evaluated on a data set consisting of 348 fields of view (FOVs) with 45 immune and tumor cell markers. Cell distribution differences between subsets of QC-pass vs QC-failed FOVs were compared to investigate the downstream effects. Results showed that 87.3% FOVs with tissue damage and 73.4% of artifacts were identified. QC-failed FOVs showed elevated regional gathering in cellular feature space compared with the QC-pass FOVs. Our results supported that DAPI signals could be used as references for MxIF image QC, and low-quality FOVs identified by our method must be cautiously considered for downstream analyses.
Introduction
As an innovative technique capable of detecting multiple antibodies at single-cell resolution while preserving spatial context, multiplex immunofluorescence (MxIF) has become a powerful tool to interrogate the tumor immune microenvironment (TIME). 1 For each tissue sample, MxIF technique produces multi-channeled image data, the pixel intensity values of which correspond to enrichment of different protein markers at the spatial location.
To quantify enrichment of many proteins, MxIF images were obtained through multiple staining, scanning, and bleaching iterations (also known as imaging rounds). In each iteration, the antibody of interest was conjugated with fluorescent tags, scanned, and then subjected to dye inactivation (bleaching) to remove the fluorescent signal. Autofluorescence (AF) removal 2 algorithms were then applied to the aligned raw images for generating OME-TIFF files, 3 which is a standard BioFormats file type for downstream analysis. Given this complexity of MxIF image acquisition, many quality issues may occur during both routine slide preparation and digital processing. Unintentionally ignoring these quality issues could result in misinterpretations in downstream analysis.4–6 For example, tissue damage is a significant quality issue and can occur more frequently on the formalin-fixed paraffin-embedded (FFPE) tissue microarray slides than FFPE whole tissue sectioning. However, it is hard for the user to be aware of this quality issue by observing only immune marker images, as tissue loss could be visually equal to absence of immune markers. Halo artifact is another quality issue which shows irrational amount of marker upregulations caused by tissue contamination and microwave-mediated antigen retrieval. 7 With potentially increased application of MxIF and other multiplex spatial analysis platforms in research and clinical practice, quality control could be critical for the success of these studies.
Traditionally, image quality control has been performed by manual spot checking randomly selected images or all images, which is highly labor intensive, often subjective, and not practical approach for large-scale studies. Accumulating research supports conducting image quality checking (QC) using computational methods.8,9 One of the most widely used is a type of method that leverages statistical characteristic of pixel values within images. For example, Janowczyk et al. 9 developed an integrative quality control tool to identify artifacts and cohort-level outliers within H&E slides. This comprehensive evaluation tool integrates many image quality measurements, such as pixel value histograms. However, many image quality metrics fail in the MxIF setting. As in MxIF images, tissue content and marker expression level vary from case to case. Those metrics based on pixel value distribution of marker images mainly reflect biological attributes (e.g., cell composition, tissue basis) rather than image qualities. Another type of method leverages prior knowledge of some specific artifacts. For example, sharp edges in Fourier frequency domain cause ringing effects in filtering results. To address this, Koho et al. 10 developed sophisticated methods to restore fluorescence images with ring artifacts. Moreover, there is a type of method that uses several images taken from a single field of view (FOV) for QC. One typical example has been used in the auto-focusing system within the slide scanner. In the scanning process, many images were captured for the same FOV at different lens positions (Z coordinate), and the scanner only delivered the sharpest image to users by comparing the blurriness of all the acquired images for a given FOV.11,12 The strategy that uses each image as reference to others for relative quality comparison provides simple but robust solution for QC.
Specifically, in MxIF imaging process, 4′,6-diamidino-2-phenylindole (DAPI) serves as a constant and internal control, reliably staining cell nuclei with high specificity (independent of other cellular stains in the panel design). Hence, in the sequential staining–scanning–bleaching iterations, DAPI signals play an irreplaceable role in tissue localization and auto-focusing for the imaging system. Considering DAPI staining was performed in every staining–bleaching iteration during MxIF acquisition, in the ideal situation there should be no DAPI signal fluctuations between imaging iteration. Based on this foundational role in MxIF imaging process, as shown in Fig. 1, we proposed to use DAPI as a reference to identify quality issues by measuring DAPI signal fluctuations and pairwise similarity between DAPI staining across imaging iterations. Our assessments suggest that a DAPI-referenced quality evaluation approach can be used to flag significant quality issues, such as tissue damage and halo artifacts. This approach can provide simple, robust, and automatic measures for quality control in MxIF techniques without adding additional bench work or manual analytical burden.
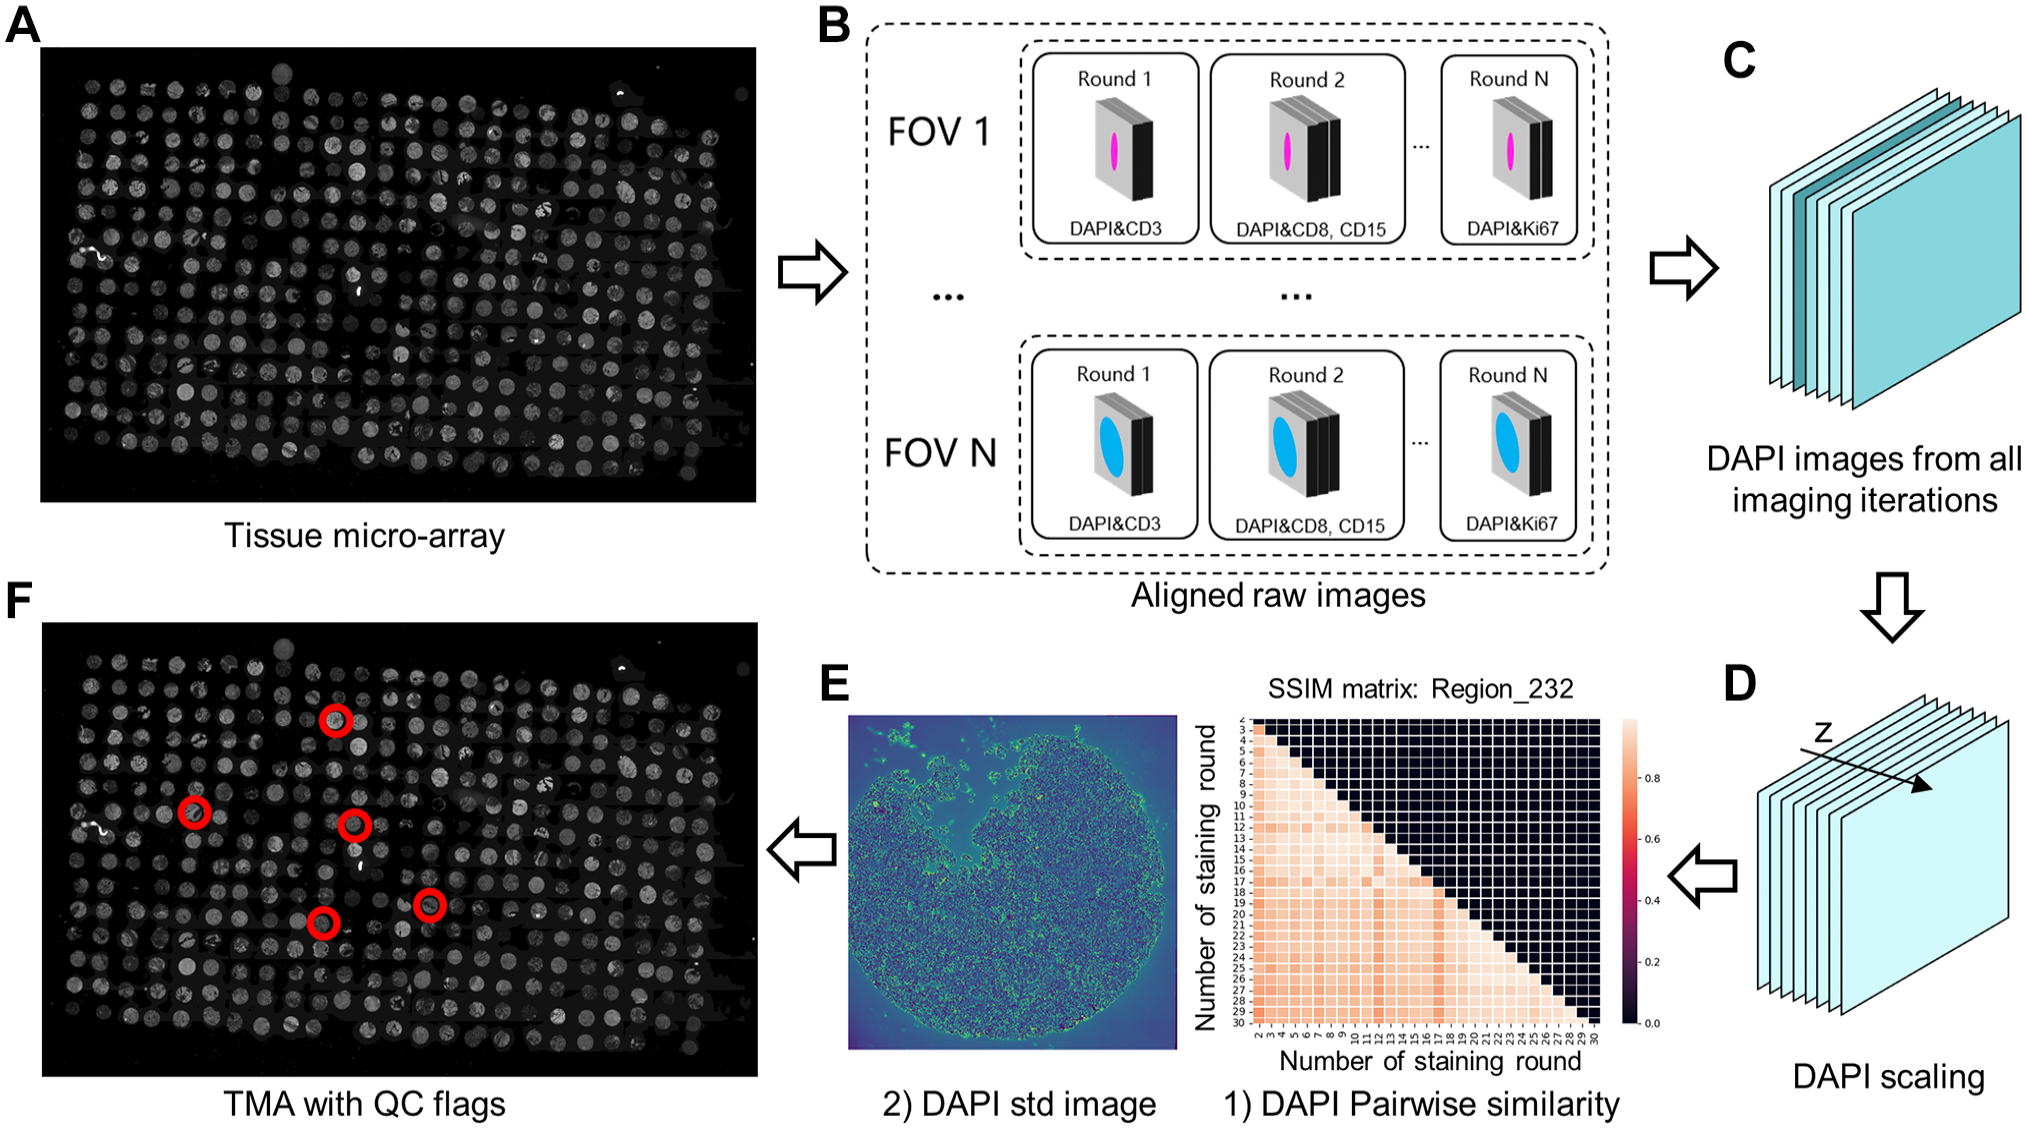
Overview of workflow. (A) Tissue micro-array (TMA) prepared for scanning. (B) Aligned raw images from multiple imaging iterations from the scanner. (C) DAPI images from the aligned raw images. (D) DAPI images were normalized to the same scale. (E) (1) Pairwise similarity of DAPIs were calculated and visualized as an array; (2) DAPI standard deviation was calculated along z direction in D). (F) FOVs with quality issues were detected and highlighted based on DAPI standard deviation and pairwise similarity. Abbreviations: FOV, fields of view; DAPI, 4′,6-diamidino-2-phenylindole; TMA, tissue micro-array; SSIM, structural similarity index measure; QC, quality checking.
Materials and Methods
Image Acquisition and Preprocessing
Our MxIF experiment was conducted on a 5-µm FFPE tissue micro-array (TMA), comprising 348 tissue cores obtained from patients with high-grade serous ovarian cancer (HGSOC). According to the panel design, 45 protein markers in total were applied to this TMA through a series of 32 staining–scanning–bleaching rounds. The slides were scanned by GE INCell Analyzer 2500, with each FOV representing a tissue core. For each FOV, raw images were obtained from 32 imaging rounds. Using DAPI as the reference, raw images were aligned to each other with the software provided by the vendor on the imaging workstation. AF removal, via non-negative matrix factorization, 13 was also employed within the vendor software to generate marker images, which were saved to individual channels within OME-TIFF files.
Imaging Quality Annotation
To facilitate domain expert review for the purpose of annotating image quality, standard OME-TIFF files were created by combining AF removed marker images belonging to the same FOV into a multiplex channel image. The OME-TIFF files were then loaded into an MxIF image visualization tool named QuPath 14 for pathologists’ visual checking. Within QuPath, marker images were visualized by selecting toggle buttons corresponds to marker names. Three aspects of image quality issues were annotated: (1) occurrence of tissue damage; (2) occurrence of halo artifacts; (3) overall quality of marker images. The first two were annotated as true (occurrence) or false (non-occurrence), and the third one was annotated with four degrees (poor, fair, good, excellent). Image quality assessments were manually recorded into a spreadsheet with respect to different FOVs and markers.
DAPI-Referenced Evaluation
In the ideal situation of MxIF imaging (without considering tissue damage, contamination, alignment or focus issues, etc.), DAPI signal at a location should be a constant value, as the tissue and DAPI staining on the slide does not change. Based on this assumption, we proposed to capture MxIF image quality issues using DAPI as the reference. For each FOV, two metrics, tissue content similarity and DAPI signal fluctuation were calculated based on DAPI image channels. Considering the small size of our developing data set, threshold-based method was used to detect quality issues. By stepwise increasing (step = 0.1) the threshold values for both metrics, quality issue detection performance (precision, recall, and F1 score) was updated accordingly. The maximum F1 score was used to index the best threshold value within all searching steps.
Tissue Content Similarity
Because there are many staining–scanning–bleaching iterations in MxIF imaging, some on-slide tissue cores could be washed away in subsequent rounds. Consequently, the washed away regions could be mistakenly read as low marker expression. Thus, FOVs with tissue damage should be discarded to avoid further errors in downstream analysis.
As a significant quality issue, tissue damage can be detected by measuring the similarity of tissue content between current and previous DAPI imaging rounds. Considering camera settings in each round could be different, DAPI values at the same spot could be different. We choose structural similarity index measure (SSIM) 15 to measure tissue content similarity, because this metric captures image content (structure) rather than pixel value differences. DAPI values from imaging iterations were extracted from aligned raw images in our data set, and then pairwise SSIMs were calculated. For each FOV, accumulated on-slide tissue content variation can be formulated as
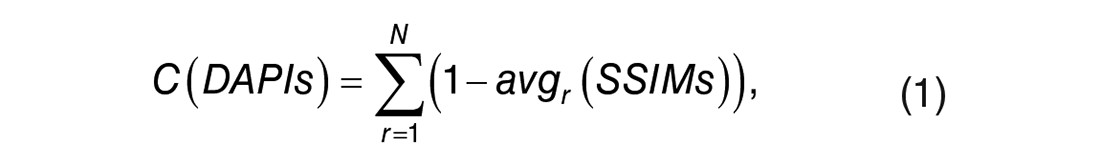
in which
DAPI Signal Fluctuation
Other than tissue damage, MxIF image quality could be affected by other factors, resulting in DAPI signal fluctuations. For example, dust, residual chemicals, and other tissue contaminations in imaging rounds could cause halo-like artifacts in both DAPI and marker images.16,17 We proposed using standard deviation of DAPI signals to capture this type of quality issue. From aligned raw images, DAPI images corresponding to imaging iterations were extracted and used to calculate standard deviation for each FOV, which was defined as below:

The N denotes the total number of imaging rounds.
Downstream Analysis
To investigate how our QC method affects the downstream analysis, we divided our data set into two groups of FOVs depending on the FOV passed or failed in our QC and denoted as HQ (high-quality) group and LQ (low-quality) group, respectively. For each group of FOVs, we conducted the same cell segmentation and feature extraction process. First, DeepCell’s 18 mesmer model, whole-cell compartment was run to segment the cells within MxIF images using DAPI and Nakaptase channels. They were chosen as the channels have the highest contrast for cellular compartments, and Nakaptase was the primary membrane maker used by the original source to train the model initially. While there is one DeepCell model per component, we retained only the whole cell, as the results of the multiple models result in mismatched segmentation masks. Second, the resulting whole-cell segmentation masks were imported into QuPath to generate “CellDetectionObjects,” via an API-based groovy script, thus getting summary metrics14,19 as the quantitative cell features for subtyping. Each cell was characterized with two types of features: (1) morphological features (such as area, circularity, and solidity) and (2) staining features (the aggregated pixel intensity’s mean, standard deviation, and median of each marker).
To compare cellular distribution differences, cells from the HQ and LQ groups were visualized as distribution maps by projecting cellular features to lower dimensions using uniform manifold approximation and projection (UMAP). 20 Within each distribution map, cell densities were calculated to enhance the visualization of cell distribution discrepancies using kernel density estimation (KDE).21,22
Results
Qualitative Assessment
As shown in Fig. 2, three patterns were found in tissue content similarity arrays and DAPI std images: (1) all the pairwise similarities were close to one, the highest value of SSIM, and DAPI stds were low (Fig. 2, FOV_1); (2) DAPI similarities dropped at a specific round and remained low in the subsequent rounds, and DAPI stds were mildly increased (Fig. 2, FOV_2); (3) DAPI similarities only dropped in some rounds but were high in the remaining rounds, and DAPI stds increased significantly (Fig. 2, FOV_3). By referring to the original images, we found pattern 1 indicates tissue remained intact during all the imaging rounds (Fig. 2A, FOV_1), which is fundamental for acquiring high-quality marker images and there was no obvious artifact detected in DAPI channels. In contrast, pattern 2 of tissue content similarity arrays (Fig. 2B, FOV_2) implies significant tissue loss or tearing (Fig. 2A, FOV_2), which could result in a case dropout in downstream analysis. Pattern 3 of tissue content similarity arrays (Fig. 2B, FOV_3) indicates there are DAPI image content variations in some but not all subsequent imaging rounds, which could be significant enough to affect the quality of marker images acquired from a subset of imaging rounds. As shown in Fig. 2A, FOV_3, there were halo artifacts in DAPI channels detected in rounds 7 and 19 (Supplementary Fig. 1). Meanwhile, the DAPI std image (Fig. 2C, FOV_3) highlights the artifacts involved regions.
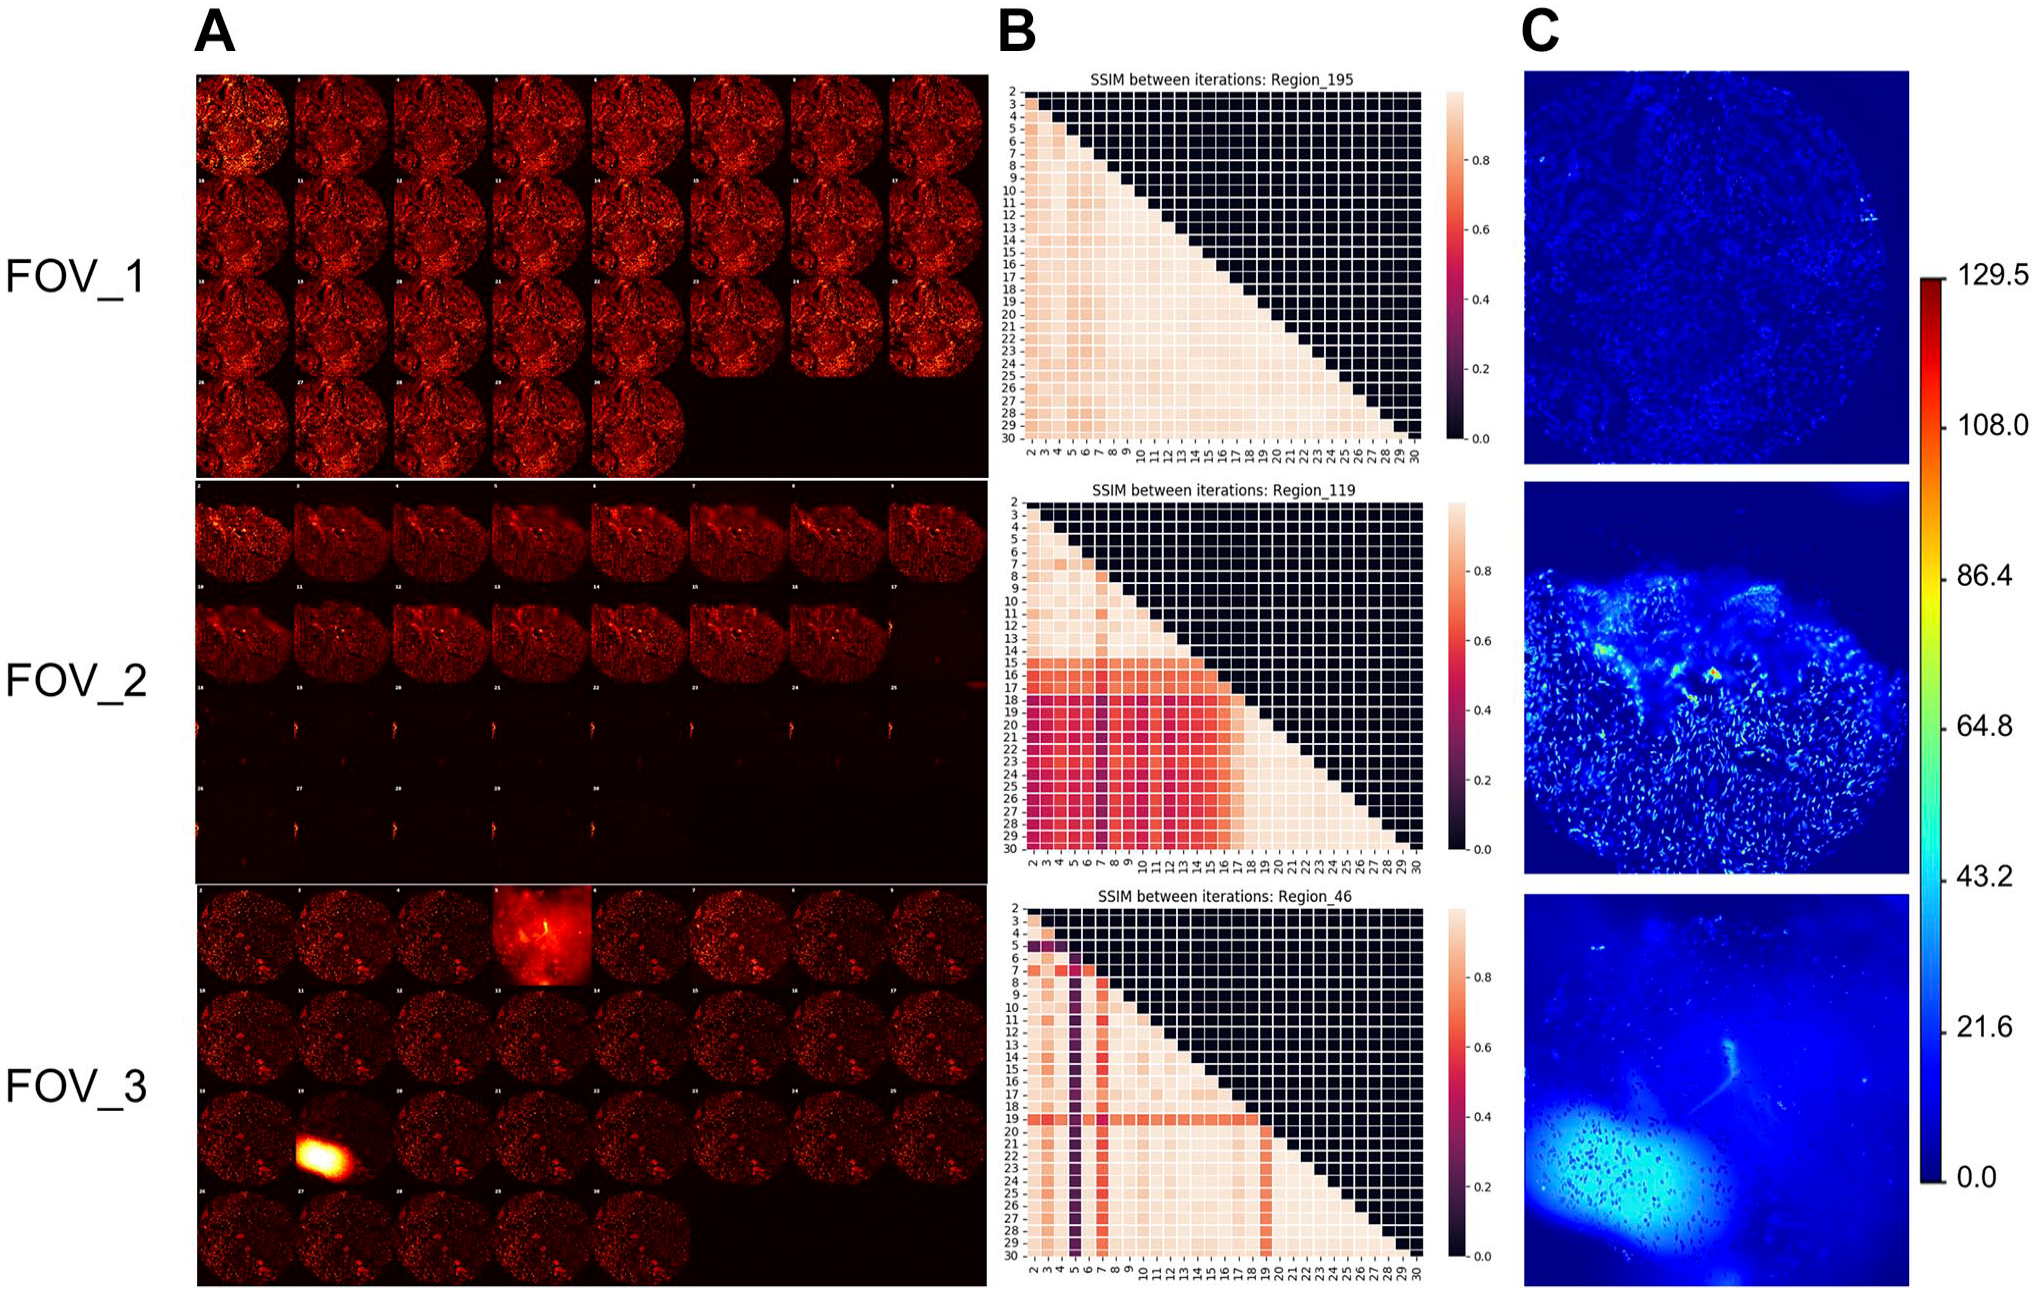
Example FOVs and their tissue content pairwise similarity array and 4′,6-diamidino-2-phenylindole (DAPI) standard deviation images. (A) DAPI signal from all the imaging rounds; (B) DAPI pairwise similarity arrays; (C) DAPI standard deviation images. Abbreviation: FOV, fields of view; SSIM, structural similarity index measure.
To assess the feasibility of identifying quality issues using our evaluation metric, a scatter plot was generated to show the concordance between manual and our DAPI-referenced evaluation (Fig. 3). In the scatter plot, each dot corresponds to a non-DAPI marker image (DAPIs were not marker images, and they were not shown in this plot). The x-axis of the plot represents the accumulation of
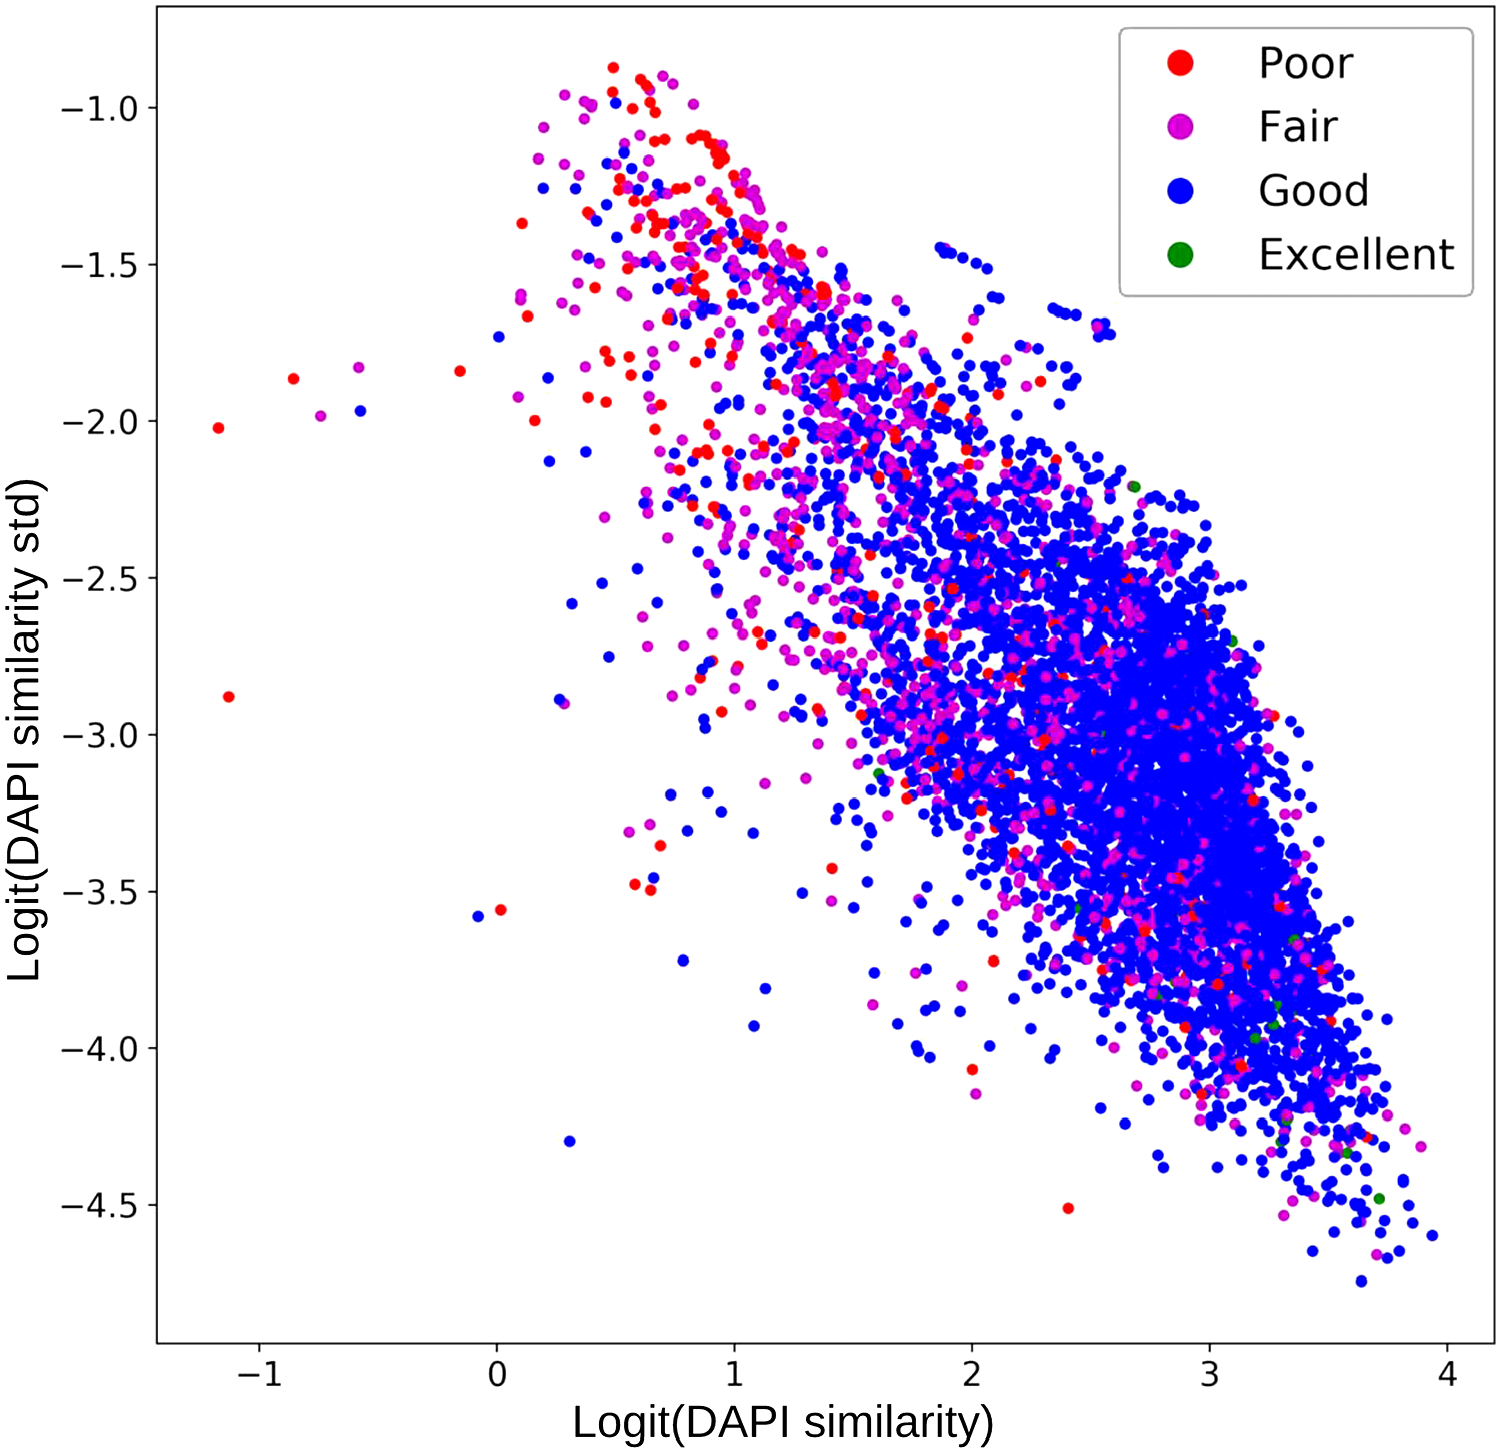
Marker image quality scatter plot. The colors of the dots were encoded with pathologists’ quality annotations. Most samples in the red circle were low-quality marker images. The x-axis denotes the 4′,6-diamidino-2-phenylindole (DAPI) similarity; y-axis denotes the diversity of DAPI similarity. Each colored dot represents a marker image. Coordinates of the dots were transformed using logit function.
Quantitative Assessment
To confirm this threshold-based method could detect tissue damage and halo artifacts, statistics of our QC metrics were calculated. For
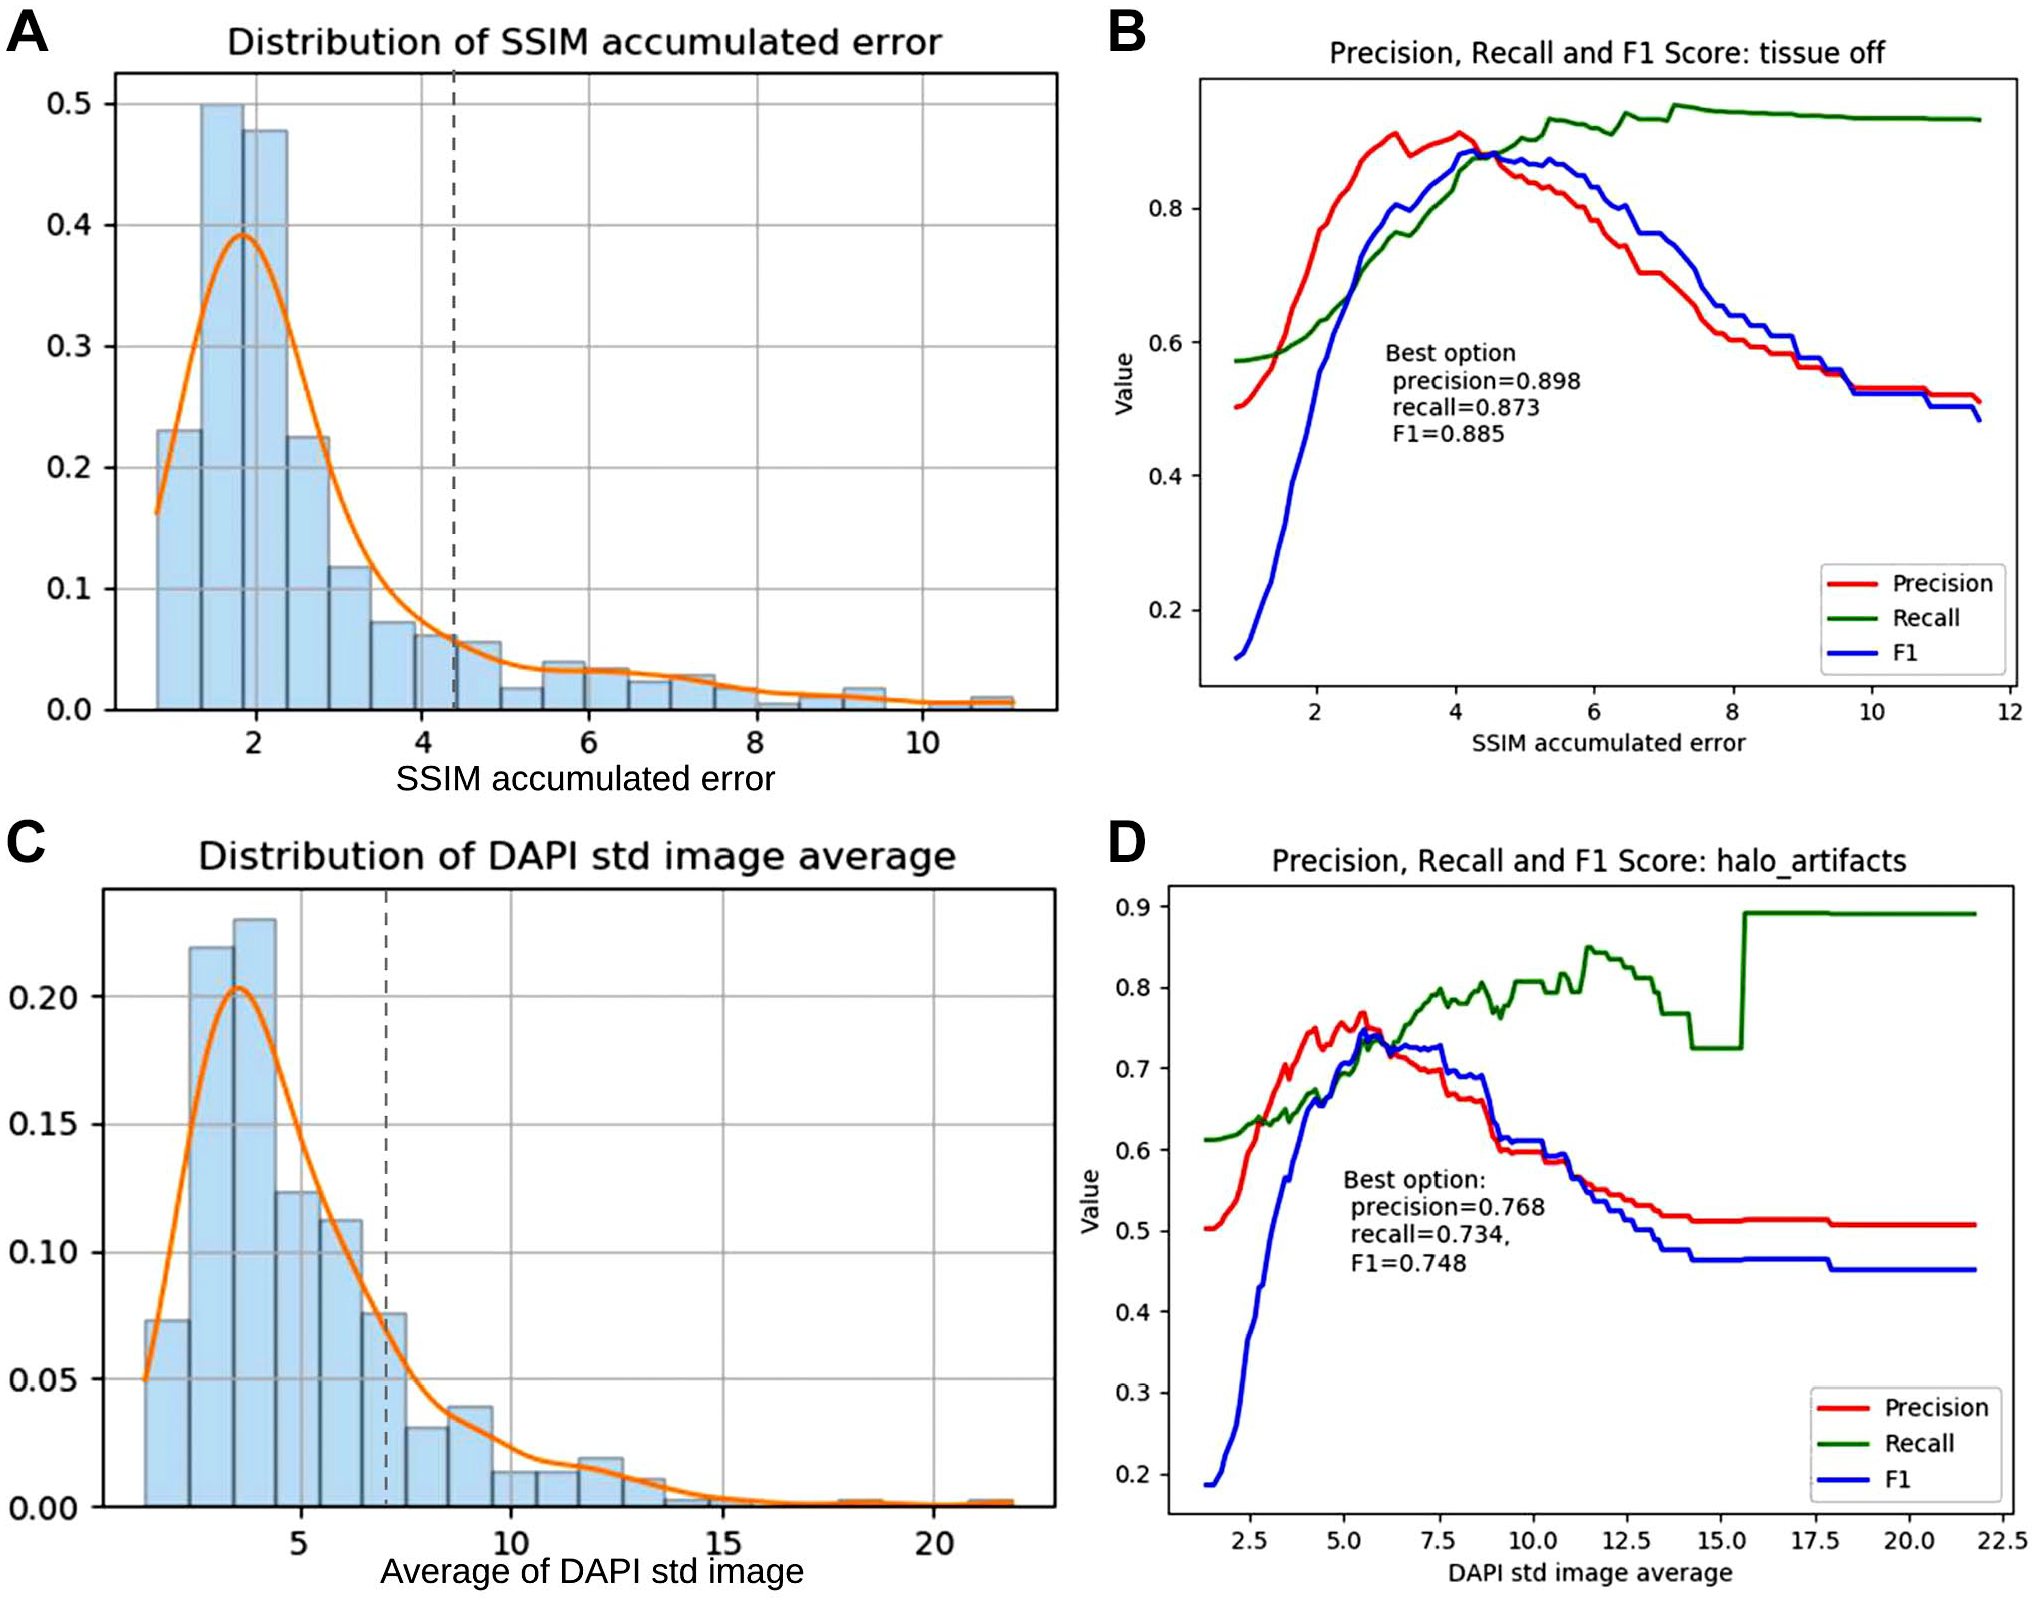
Distributions of QC metrics and performance of threshold-based quality issue detection. (A) Distribution of SSIM measured tissue content dissimilarity. Dashed line was used to label the optimal threshold. (B) Performance of detecting tissue damage with respect to different thresholds of accumulated SSIM error. (C) Distribution of the average of DAPI standard deviation (std) images. Dashed line was used to label the optimal threshold. (D) Performance of detecting halo artifacts with respect to different thresholds of averaged DAPI std. Abbreviations: QC, quality checking; SSIM, structural similarity index measure; DAPI, 4′,6-diamidino-2-phenylindole.
By thresholding
Effect of Poor Quality
For all the cells across all the FOVs (n=348), 240 cellular features in total were extracted to characterize cells within MxIF images. By projecting cells from high dimension features space into two dimensions, a scatter plot was generated to show global cell distributions. As shown in Fig. 5A left sub-figure, using UMAP projection axis x = 0, cells can be clearly divided into two clusters. After mapping the cells back to the original images, we found cells to the left were stroma cells, whereas the cells to the right were tumor cells (Fig. 5A right sub-figure). This result suggested that MxIF quality issues have limited impact on differentiating tumor and stroma cells, which could result from dramatic differences in protein marker expressions in these two cell subtypes.
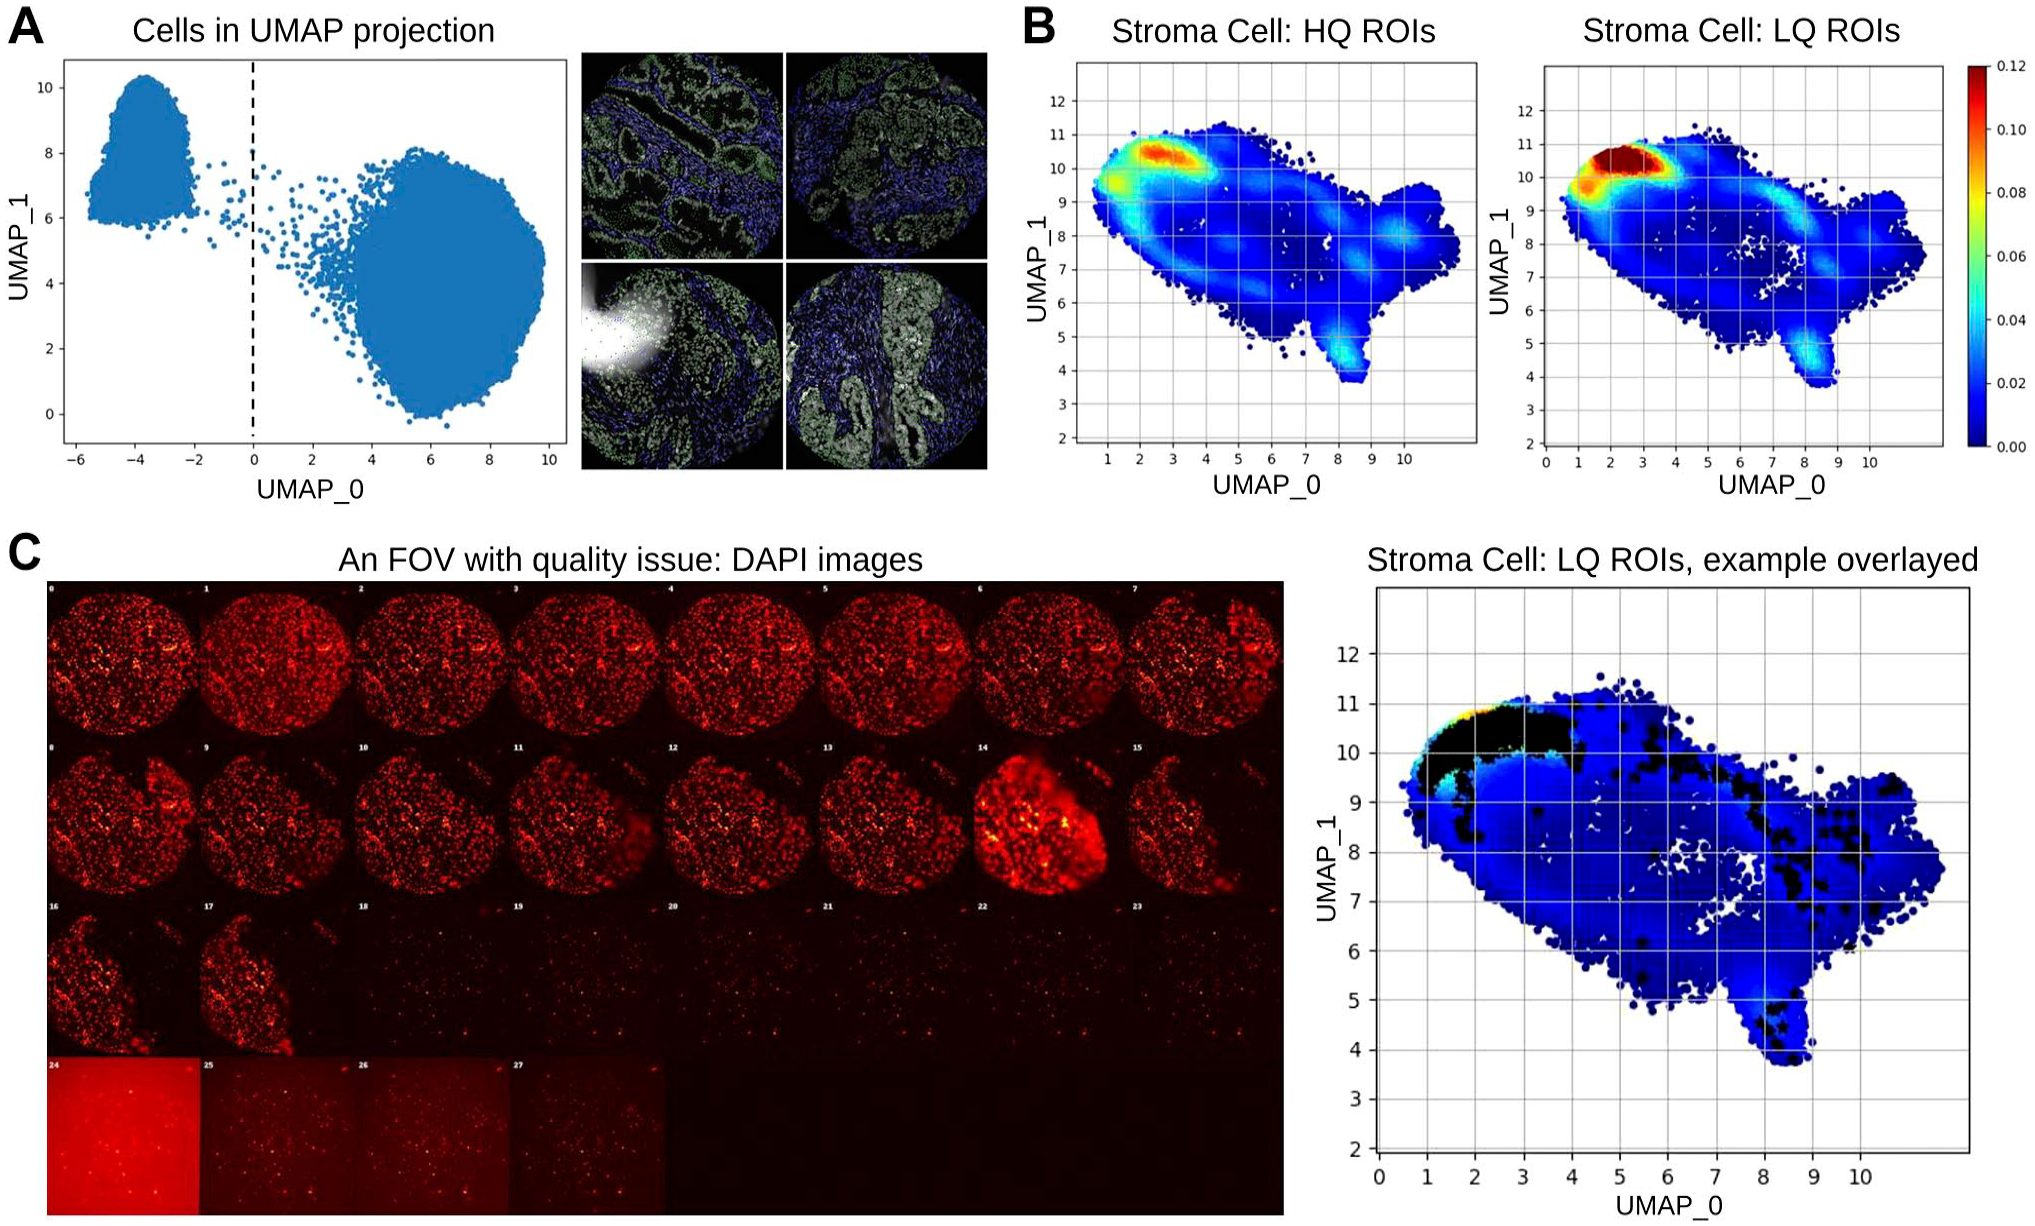
Effect on cell classification. (A) Cells can be divided into two clusters based on UMAP projection. By mapping the cells back to DAPI channel (gray), we found one cluster is tumor (green) the other is stroma (blue). (B) In the projection of stroma cell distribution, LQ group presented higher density in some regions. (C) An example FOV with significant quality issue. The stroma cell distribution of this FOV was overlayed (black stars) on the overall stroma cell distribution. Abbreviations: UMAP, uniform manifold approximation and projection; LQ, low quality; FOV, fields of view; HQ, high quality; DAPI, 4′,6-diamidino-2-phenylindole.
Because immune cells are nurtured by stroma in TIME and play important roles in tumor responses, many studies focus on investigating cell–cell interactions within stroma.23–25 Thus, we compared the detailed stroma cell distribution differences between HQ and LQ groups. Based on our previous quantitative assessment, 69 LQ FOVs (in which Ntissue_damage = 26, Nhalo_artifacts = 45) were identified. An unsupervised method (using x < 0 as criteria, as shown in Fig. 5A) was used to extract stroma cells from the cell population within HQ and LQ groups, respectively. In our data set, less stroma cells were detected in the LQ group. To get balanced cell samples to show distribution differences, stroma cells within HQ groups were randomly sampled according to the number of stroma cells in LQ group. Then, stroma cells from the two groups were projected into a two-dimension space using the same UMAP projection. Within the projection maps, cell densities were also calculated and visualized with the same color bar. As shown in Fig. 5B, the LQ group presented dramatically higher (more than 20%) stroma cell density than the HQ group in a local region of the projection map (colored with dark red according to the cell density color bar).
Furthermore, we confirmed this locally elevated cell density was caused by cells from low-quality FOVs. As shown in Fig. 5C, cells (marked with black stars) from a representative FOV with tissue damage and halo artifacts aggregated to the dark red regions. This result suggests that in low-quality FOVs identified by our method, some cells may have scrambled cellular features caused by image quality issues. For example, tissue damage causes downregulation of markers, whereas halo artifacts cause upregulation of markers. Thus, our QC method could be helpful in pursuit of reliable downstream cell classifications by identifying and excluding low-quality FOVs from further investigation.
Discussion
Although MxIF techniques provide an innovative way to reveal detailed histopathological characteristics and complex spatial relationships between cells, data quality could be compromised within iterative staining–scanning–bleaching imaging protocols. Serving as a well-established marker indicating the presence of nuclei, DAPI is highly reproducible across all multiplex immunostaining platforms. Although it is widely used as a reference for tissue localization and auto-focusing across MxIF staining–scanning–bleaching iterations, it was unknown if DAPI could be used as a reference for image QC. Identifying the feasibility of using DAPI as a QC reference could provide additional data quality measurements for higher reliability in downstream analysis, without disturbing established MxIF imaging protocols.
In this article, we leveraged the specificity of MxIF image acquisition, where DAPI images were obtained in every staining–scanning–bleaching iteration. By measuring DAPI signal consistency at both the structural level (tissue content similarity) and pixel level (DAPI signal fluctuation), we achieved encouraging performances on detecting two significant quality issues: tissue damage and halo artifacts. Notably, our QC method does not require additional steps in the staining process by leveraging a highly reliable marker that is universally rooted in many multiplex immunostain platforms. The quality measurement can be automated by the DAPI channel–referenced evaluation, which is highly scalable, reproducible, and objective without significant need for manual intervention. Moreover, we revealed that image quality issues have limited impact on tumor stroma cell classification, but cellular features within QC-failed FOVs were not reliable for stroma cell subtyping. These results provide valuable references for creating data selection criteria and study design guidance.
Based on our tissue damage identification results, we found tissue damage was more likely to occur in tissue cores located near the edge of the slides. Although more TMAs are required to prove our assumption, this data-driven discovery matches immunologists’ observation. We noticed that halo artifacts were highly related to regional highlights within DAPI std images. Potentially, this regional high DAPI variation could further provide referential confidence/calibration to marker expression levels. For overall image quality evaluation, we noticed many low- and high-quality samples entangled in the middle of Fig. 3, implying MxIF QC is a non-trivial task, and many other quality issues remain to be resolved. In the downstream cell distribution analysis, besides scrambled cellular features in the LQ group, we found that cell counts in the LQ group were three times lower than that in the HQ group (n=408,323 vs 147,839). Pathologists were invited to check the original MxIF images and estimate cell counts within LQ and HQ groups. Manual review suggests that quality issues, rather than tissue differences between the two groups, contribute more to the decreased cell counts in the LQ group. In LQ groups, many cells cannot be detected with our cell detection methods, especially in halo artifacts regions. Meanwhile, we found DAPI quality could be defective even in the first imaging round, which emphasized the importance of QC before any downstream analysis. Moreover, within the distribution map (Fig. 5B), we noticed that cell distributions in HQ and LQ groups share similar patterns. There could be two reasons contributed to this: (1) there could be “high quality” sub-regions within LQ FOVs; (2) there could be undetected LQ FOVs within HQ group. This result implies that MxIF image quality issues could be caused by many factors and cannot be fully identified with simple or single evaluation metric.
Due to the availability of quality annotation, our method was only quantitatively tested on one TMA from GE INCell Analyzer. In this study, using FOVs from the same TMA allowed us to control other factors that could be covariate of image qualities, such as batch effect in slide scanning, number of imaging iterations. Based on the straightforward design, the proposed method is supposed to be adaptable to other MxIF platforms that also leverage similar multiplexed approaches. Although we have tested our method on one of our previous melanoma slide (consists of 37 FOVs), 26 and got similar results to the downstream analysis (Supplementary Fig. 2), further quantitative evaluations could be conducted when explicit quality annotations are available. Another flaw of our study is using simple threshold methods to identify MxIF quality issues. Threshold-based methods are simple but could be low in accuracy and poor in generalizability. However, developing the advanced classification methods to identify image quality issues is not the emphasis of this work. The main contribution of our work is that we demonstrated DAPI images from MxIF platform could not only be used as a reference for tissue localization and auto focusing, but also be used as references for QC purposes.
DAPI images from iterative staining–scanning–bleaching imaging process can be used as references for MxIF image QC. Image quality issues (such as tissue damage and halo artifacts) can be identified by measuring DAPI image content similarity and pixel value fluctuation. Within the identified low-quality FOVs, cellular features were not reliable for downstream analysis. This method generated results in line with expectations of pathologist, thus further boosting confidence in the ability to automate the detection of erroneous IF characterization and serious but expected flaws in the microscope acquisition of these types of images.
Supplemental Material
sj-tiff-1-jhc-10.1369_00221554231161693 – Supplemental material for Multiplex Immunofluorescence Image Quality Checking Using DAPI Channel–referenced Evaluation
Supplemental material, sj-tiff-1-jhc-10.1369_00221554231161693 for Multiplex Immunofluorescence Image Quality Checking Using DAPI Channel–referenced Evaluation by Jun Jiang, Raymond Moore, Clarissa E. Jordan, Ruifeng Guo, Rachel L. Maus, Hongfang Liu, Ellen Goode, Svetomir N. Markovic and Chen Wang in Journal of Histochemistry & Cytochemistry
Supplemental Material
sj-tiff-2-jhc-10.1369_00221554231161693 – Supplemental material for Multiplex Immunofluorescence Image Quality Checking Using DAPI Channel–referenced Evaluation
Supplemental material, sj-tiff-2-jhc-10.1369_00221554231161693 for Multiplex Immunofluorescence Image Quality Checking Using DAPI Channel–referenced Evaluation by Jun Jiang, Raymond Moore, Clarissa E. Jordan, Ruifeng Guo, Rachel L. Maus, Hongfang Liu, Ellen Goode, Svetomir N. Markovic and Chen Wang in Journal of Histochemistry & Cytochemistry
Footnotes
Competing Interests
The author(s) declared no potential conflicts of interest with respect to the research, authorship, and/or publication of this article.
Author Contributions
JJ, RM, CW conceived of the presented idea. JJ and RM wrote the code to implement the proposed method. CEJ and RG provided quality annotations for all the MxIF images. RLM, EG and SNM contributed to prepare the tissue and scan the images for research. HL, CW, EG and SNM supervised this work. All authors discussed the results and contributed to the final manuscript.
Funding
The author(s) disclosed receipt of the following financial support for the research, authorship, and/or publication of this article: This research is partially supported by National Institutes of Health (R01CA260259), Bristol Myers Squibb (BMS) (CA209-7XD), Mayo Clinic Cancer Center (P30CA015083), Mayo Clinic Ovarian Cancer SPORE (P50 CA136393), and Mayo Clinic Center for Individualized Medicine.
Data Accessibility Statement
All the code for this article is publically available on GitHub (https://github.com/smujiang/MxIF_DAPI_ref_QC). Quality checking reports can be generated using the client code. As shown in ![]() , the report shows potential quality issues and allows efficient manually screening.
, the report shows potential quality issues and allows efficient manually screening.
Supplemental Material
The supplemental material is available in the online version of the article.
References
Supplementary Material
Please find the following supplemental material available below.
For Open Access articles published under a Creative Commons License, all supplemental material carries the same license as the article it is associated with.
For non-Open Access articles published, all supplemental material carries a non-exclusive license, and permission requests for re-use of supplemental material or any part of supplemental material shall be sent directly to the copyright owner as specified in the copyright notice associated with the article.