
Abstract
Transcriptomic and proteomic profiling classify bladder cancers into luminal and basal molecular subtypes, with controversial prognostic and predictive associations. The complexity of published subtyping algorithms is a major impediment to understanding their biology and validating or refuting their clinical use. Here, we optimize and validate compact algorithms based on the Lund taxonomy, which separates luminal subtypes into urothelial-like (Uro) and genomically unstable (GU). We characterized immunohistochemical expression data from two muscle-invasive bladder cancer cohorts (n=193, n=76) and developed efficient decision tree subtyping models using 4-fold cross-validation. We demonstrated that a published algorithm using routine assays (GATA3, KRT5, p16) classified basal/luminal subtypes and basal/Uro/GU subtypes with 86%–95% and 67%–86% accuracies, respectively. KRT14 and RB1 are less frequently used in pathology practice but achieved the simplest, most accurate models for basal/luminal and basal/Uro/GU discrimination, with 93%–96% and 85%–86% accuracies, respectively. More complex models with up to eight antibodies performed no better than simpler two- or three-antibody models. We conclude that simple immunohistochemistry classifiers can accurately identify luminal (Uro, GU) and basal subtypes and are appealing options for clinical implementation.
Introduction
Pioneering work performed by several groups has characterized the genomic profiles of muscle-invasive bladder cancer (MIBC), and the application of unsupervised hierarchical clustering has revealed molecular subtypes with distinct biological behaviors and variation in clinical course.1 –5 A newer mRNA-based consensus subtyping scheme summarizes these subtypes, and at the top hierarchical level divides MIBCs into luminal-like and basal-like subtypes, which represent divergent differentiation pathways for benign urothelial cells.2,6 However, the complexity of transcriptomic profiling methods and the variable sampling of tumor and stromal (benign supportive or immune) cells have hindered the development of reliable and cost-effective molecular subtyping algorithms required to establish their clinical utility. 7 Immunohistochemistry (IHC) has emerged as an appealing alternative to mRNA-based subtyping. IHC captures most of the major subtypes and is resistant to artifacts stemming from sample-to-sample variation in tumor and stromal content.7 –10 IHC assays are routinely employed in surgical pathology labs providing an opportunity, should the need arise, to develop simple, accurate, and clinically tractable algorithms to identify biologically and clinically relevant subtypes.
Multiple studies have leveraged key biological features of luminal and basal subtypes using IHC, demonstrating high accuracy in identifying mRNA subtypes.2,9,11– 15 For example, over the last three decades, work on the Lund bladder cancer taxonomy has progressed from an initial reliance on mRNA 1 to a taxonomy defined solely by IHC subtypes reflecting protein expression levels in cancer cells.7,14 To identify Lund IHC subtypes, a comprehensive panel of 24 key IHC features was previously distilled into 13 core IHC assays, which can be used to identify five main tumor-cell-intrinsic subtypes in MIBC: genomically unstable (GU), urothelial-like (Uro), basal/squamous cell carcinoma-like (basal/SCCL), mesenchymal-like (Mes-like), and small cell/neuroendocrine-like (NE-like). These IHC subtypes reflect the biological heterogeneity of MIBC tumors, mediated by diverse pathogenic mechanisms. At the mRNA and protein expression levels, luminal subtypes (Uro and GU) express markers associated with luminal differentiation programming, such as GATA-binding protein 3 (GATA3), forkhead box A1 (FOXA1), and peroxisome proliferator-activated receptor gamma (PPARG)16,17; however, Uro and GU subtypes differ in the expression of retinoblastoma protein (RB1), fibroblast growth factor receptor 3 (FGFR3), cyclin D1 (CCND1), and cyclin-dependent kinase inhibitor 2A (CDKN2A, which encodes for the p16 protein).1,7,14,15 Conversely, the basal subtype expresses basal urothelial markers, such as keratin 5 (KRT5), keratin 14 (KRT14), epidermal growth factor receptor (EGFR), P-cadherin, and CD44, in addition to markers associated with squamous epithelial programs, such as desmocollin 2/3 (DSC2/3), desmoglein 3 (DSG3), desmoplakin (DSP), and keratin 6 (KRT6).16,17 The distinction between the two luminal subtypes, Uro and GU, is not universal across all subtyping schemes but aligns with a recent international consensus scheme, 18 where the corresponding subtypes are called luminal papillary and luminal unstable, respectively. However, a clinically tractable method for IHC subtyping would require a much simpler algorithm with fewer antibody assays. To our knowledge, no such method has been developed to distinguish between Uro and GU subtypes.
Importantly, bladder cancer molecular subtypes have been associated with different prognostic and predictive outcomes.18 –24 Broadly, tumors of the basal subtypes are aggressive and have been associated with poor prognosis, whereas luminal subtypes have been associated with improved survival. 1 –7,18 However, the GU luminal subtype may represent an important exception, demonstrating a worse prognosis compared with its Uro (also luminal) counterpart.6,18 Moreover, among luminal tumors, those with genomic instability have demonstrated better responses to neoadjuvant chemotherapy and immunotherapy.21,23,24 These predictive and prognostic associations highlight the potential value of distinguishing between Uro and GU luminal subtypes to fulfill the clinical potential of molecular subtyping for defining appropriate treatment strategies. However, there have also been contradictory findings with respect to the prognostic implications of these subtypes due to variable approaches to cohort assembly, subtyping taxonomy, and molecular profiling methodology. Thus, a robust IHC assay for molecular subtyping could accelerate investigations to clarify these clinical associations.
We recently proposed a compact Lund taxonomy subtyping model using antibodies against GATA3, KRT5, and p16 to identify basal, Uro, and GU subtypes, which represent the three main MIBC subtypes and comprise more than 90% of all MIBC cases. 10 This panel utilized three readily available IHC assays that are widely used in surgical pathology laboratories (see Supplemental Table 1), suggesting a simple, cost-effective, and accessible algorithm for use across clinical centers.25 –28 Furthermore, this model proposes that the rare NE-like and Mes-like subtypes demonstrate distinctive morphologies that would trigger additional pathological review and are, therefore, unlikely to require additional IHC stains. 10 Recent work translated mRNA-based Lund subtypes to IHC-based assays using 13 core IHC assays.7,14 These data enable us to test the accuracy of this three-antibody algorithm. To do so, we first characterized the expression patterns and the extent of overlap among core IHC markers between the key Lund subtypes (basal/Uro/GU). We initially determined the accuracy of a three-antibody algorithm using GATA3, KRT5, and p16. We then systematically analyzed the performance of other simplified models using key IHC assays, in addition to more complex models incorporating additional proteins. To further interrogate the potential of these models for clinical use, we compared quantitative image analysis data with protein expression patterns that can be visually recognized by a pathologist.
Materials and Methods
IHC Staining, Score Calculations, and Subtype Definitions
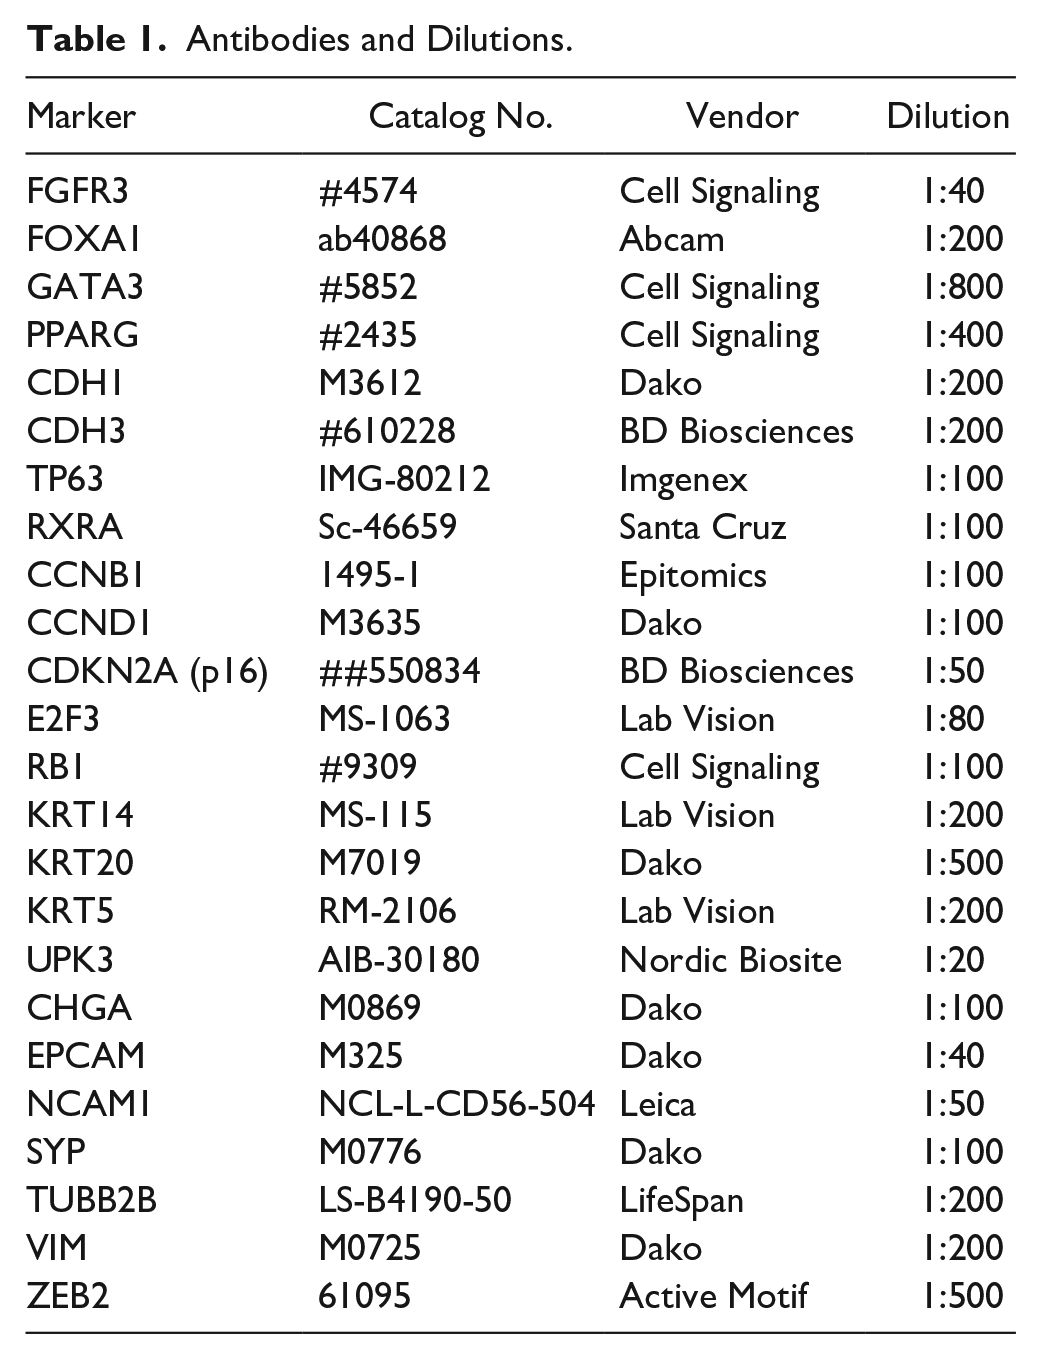
This study was performed using previously published data (Lund 2012 and Lund 2017).1,6 Data assessed included photomicrographic images of tissue microarray sections stained 6 with antibodies against key subtyping proteins: cyclin B1 (CCNB1), CCND1, cadherin 1 (CDH1), cadherin 3 (CDH3), CDKN2A (p16), chromogranin A (CHGA), E2F transcription factor 3 (E2F3), epithelial cell adhesion molecule (EPCAM), FGFR3, FOXA1, GATA3, KRT5, KRT14, keratin 20 (KRT20), neural cell adhesion molecule (NCAM1), PPARG, RB1, retinoid X receptor A (RXRA), synaptophysin (SYP), tumor protein 63 (TP63), tubulin beta 2B class IIb (TUBB2B), uroplakin 3 (UPK3), vimentin (VIM), or zinc finger E-box binding homeobox 2 (ZEB2). Each tissue microarray core was evaluated individually and was included for analysis if the core contained >50 cancer cells. A maximum of two cores were available per sample, and one core was sufficient for subtype assignment if staining patterns were assessed for all IHC stains. When two cores were available, the IHC values were averaged between the two cores. The primary antibodies and conditions are summarized in Table 1.
Antibodies and Dilutions.
IHC subtype assignment was previously determined by calculating a definition score, using 13 key IHC features to assign samples to Uro, basal, GU, NE-like, and Mes-like subtypes. 7 IHC expression was reported using an intensity scale (0–3), a percentage scale (percentage positive tumor cells, 0–9, in bins of 10%), or both. For CCNB1, RB1, and TP63, the intensity was disregarded, and only the percentage of positive tumor cells was reported (range: 0–9). For all remaining features, the intensity alone (range: 0–3), or the intensity multiplied by the percentage of positive cells (range: [0–3] × [0–0.9] = 0–2.7), was reported.
The Lund group1,7 used these scores to calculate definition scores and assign tumor-cell phenotypes as described in Table 2. Briefly, the highest positive score (>0.6) for any of the Mes-like, basal/SCC-like, and Sc/NE-like subtype definitions classified these cases. For scores <0.6, a case is classified as Uro/UroB if the definition score is >0.6. If the case definition score is <0.6, it is defined as genomically unstable (this phenotype is, thus, defined as the opposite as that for Uro/UroB). These tumor-cell phenotypes were used in the current study as class labels in all subsequent analyses.
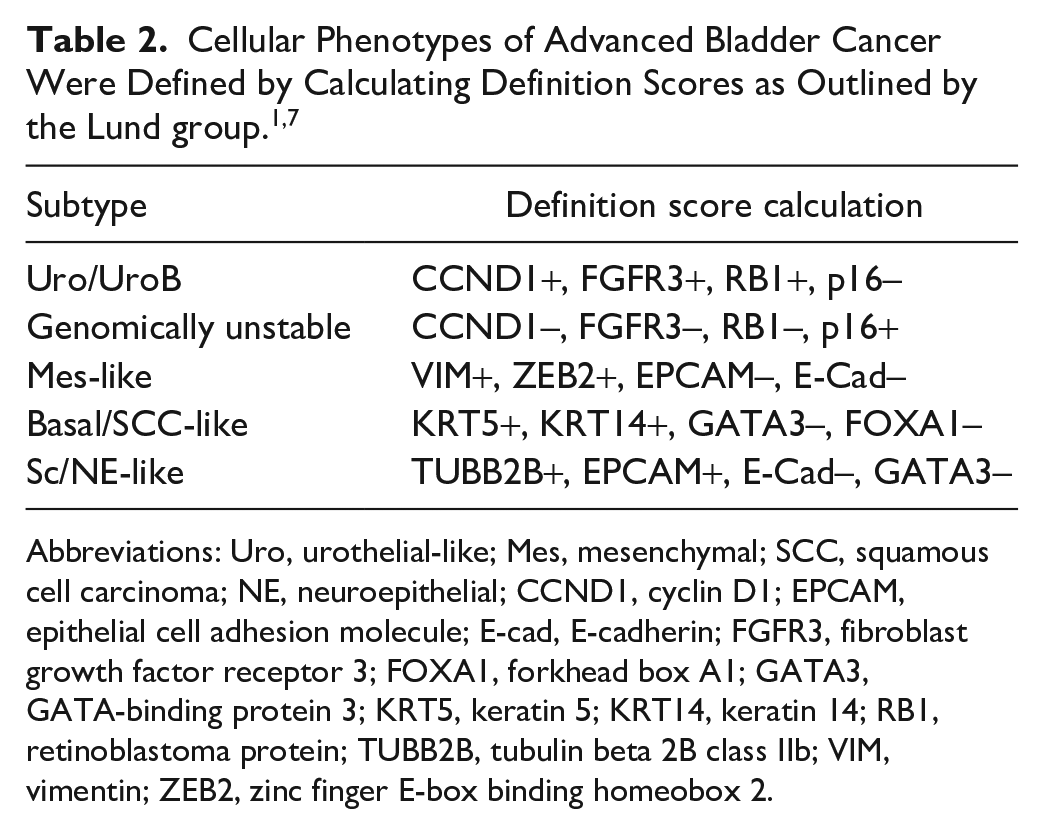
Abbreviations: Uro, urothelial-like; Mes, mesenchymal; SCC, squamous cell carcinoma; NE, neuroepithelial; CCND1, cyclin D1; EPCAM, epithelial cell adhesion molecule; E-cad, E-cadherin; FGFR3, fibroblast growth factor receptor 3; FOXA1, forkhead box A1; GATA3, GATA-binding protein 3; KRT5, keratin 5; KRT14, keratin 14; RB1, retinoblastoma protein; TUBB2B, tubulin beta 2B class IIb; VIM, vimentin; ZEB2, zinc finger E-box binding homeobox 2.
Cohort Description and Data Scaling
Data were available for a total of 327 MIBC samples,1,7 including 193 samples with complete expression data for all 24 proteins. The patient characteristics of the samples used are detailed in Table 3. Adequate outcome information was available for the 2017 cohort, including 163 patients treated with curative intent. Due to the small number of Mes-like and Sc/NE-like tumors (n=16), model-building was restricted to subtypes for which adequate statistical power was available. A total of 177 samples of basal, Uro, and GU subtypes from the 2017 Lund dataset 7 were included and used for further analysis. Descriptions of the evaluation and the original scaling of proteins are described in Table 4 and Supplemental Fig. 1. As previously described, 15 samples were classified as one of five KRT5 expression patterns or proximity scores (all, diffuse, multiple layers, one-layer, or no staining). KRT5 score values were calculated as the proximity score multiplied by the percentage of positively stained tumor cells, 15 as summarized in Table 4 and Supplemental Fig. 1. All expression values were scaled to yield a tumor-cell score (TCS), ranging from 0 to 1, for subsequent statistical analysis. Scores for each protein were normalized to the range maximum, as indicated in Table 4.
Patient Characteristics of Lund 2012 and 2017 Datasets.
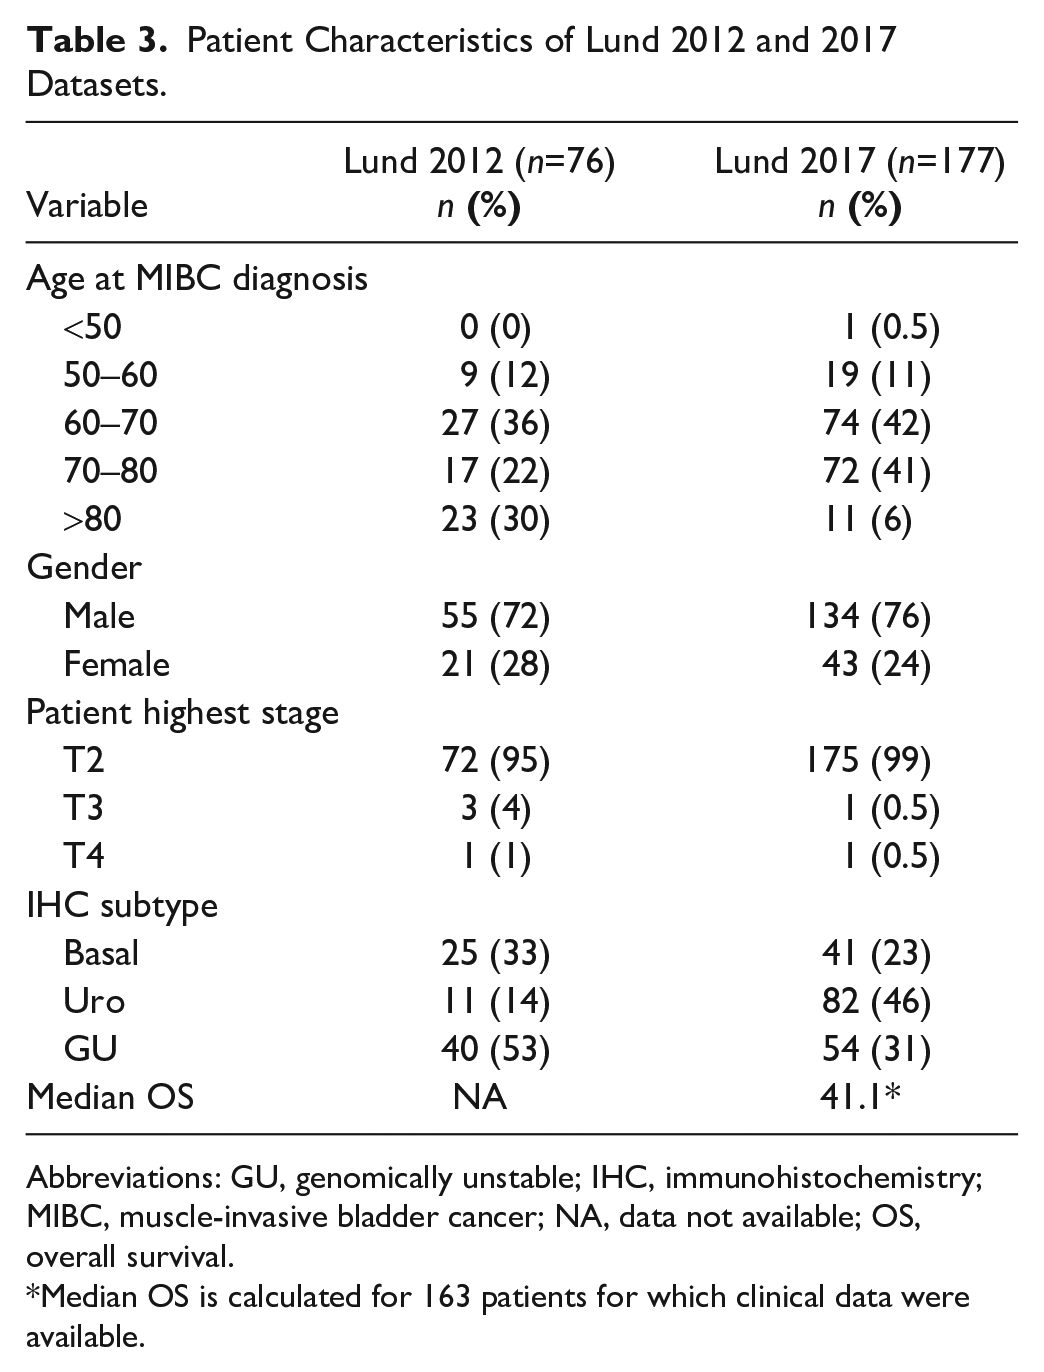
Abbreviations: GU, genomically unstable; IHC, immunohistochemistry; MIBC, muscle-invasive bladder cancer; NA, data not available; OS, overall survival.
Median OS is calculated for 163 patients for which clinical data were available.
Original Scoring of IHC Features and Scaling Across Datasets.
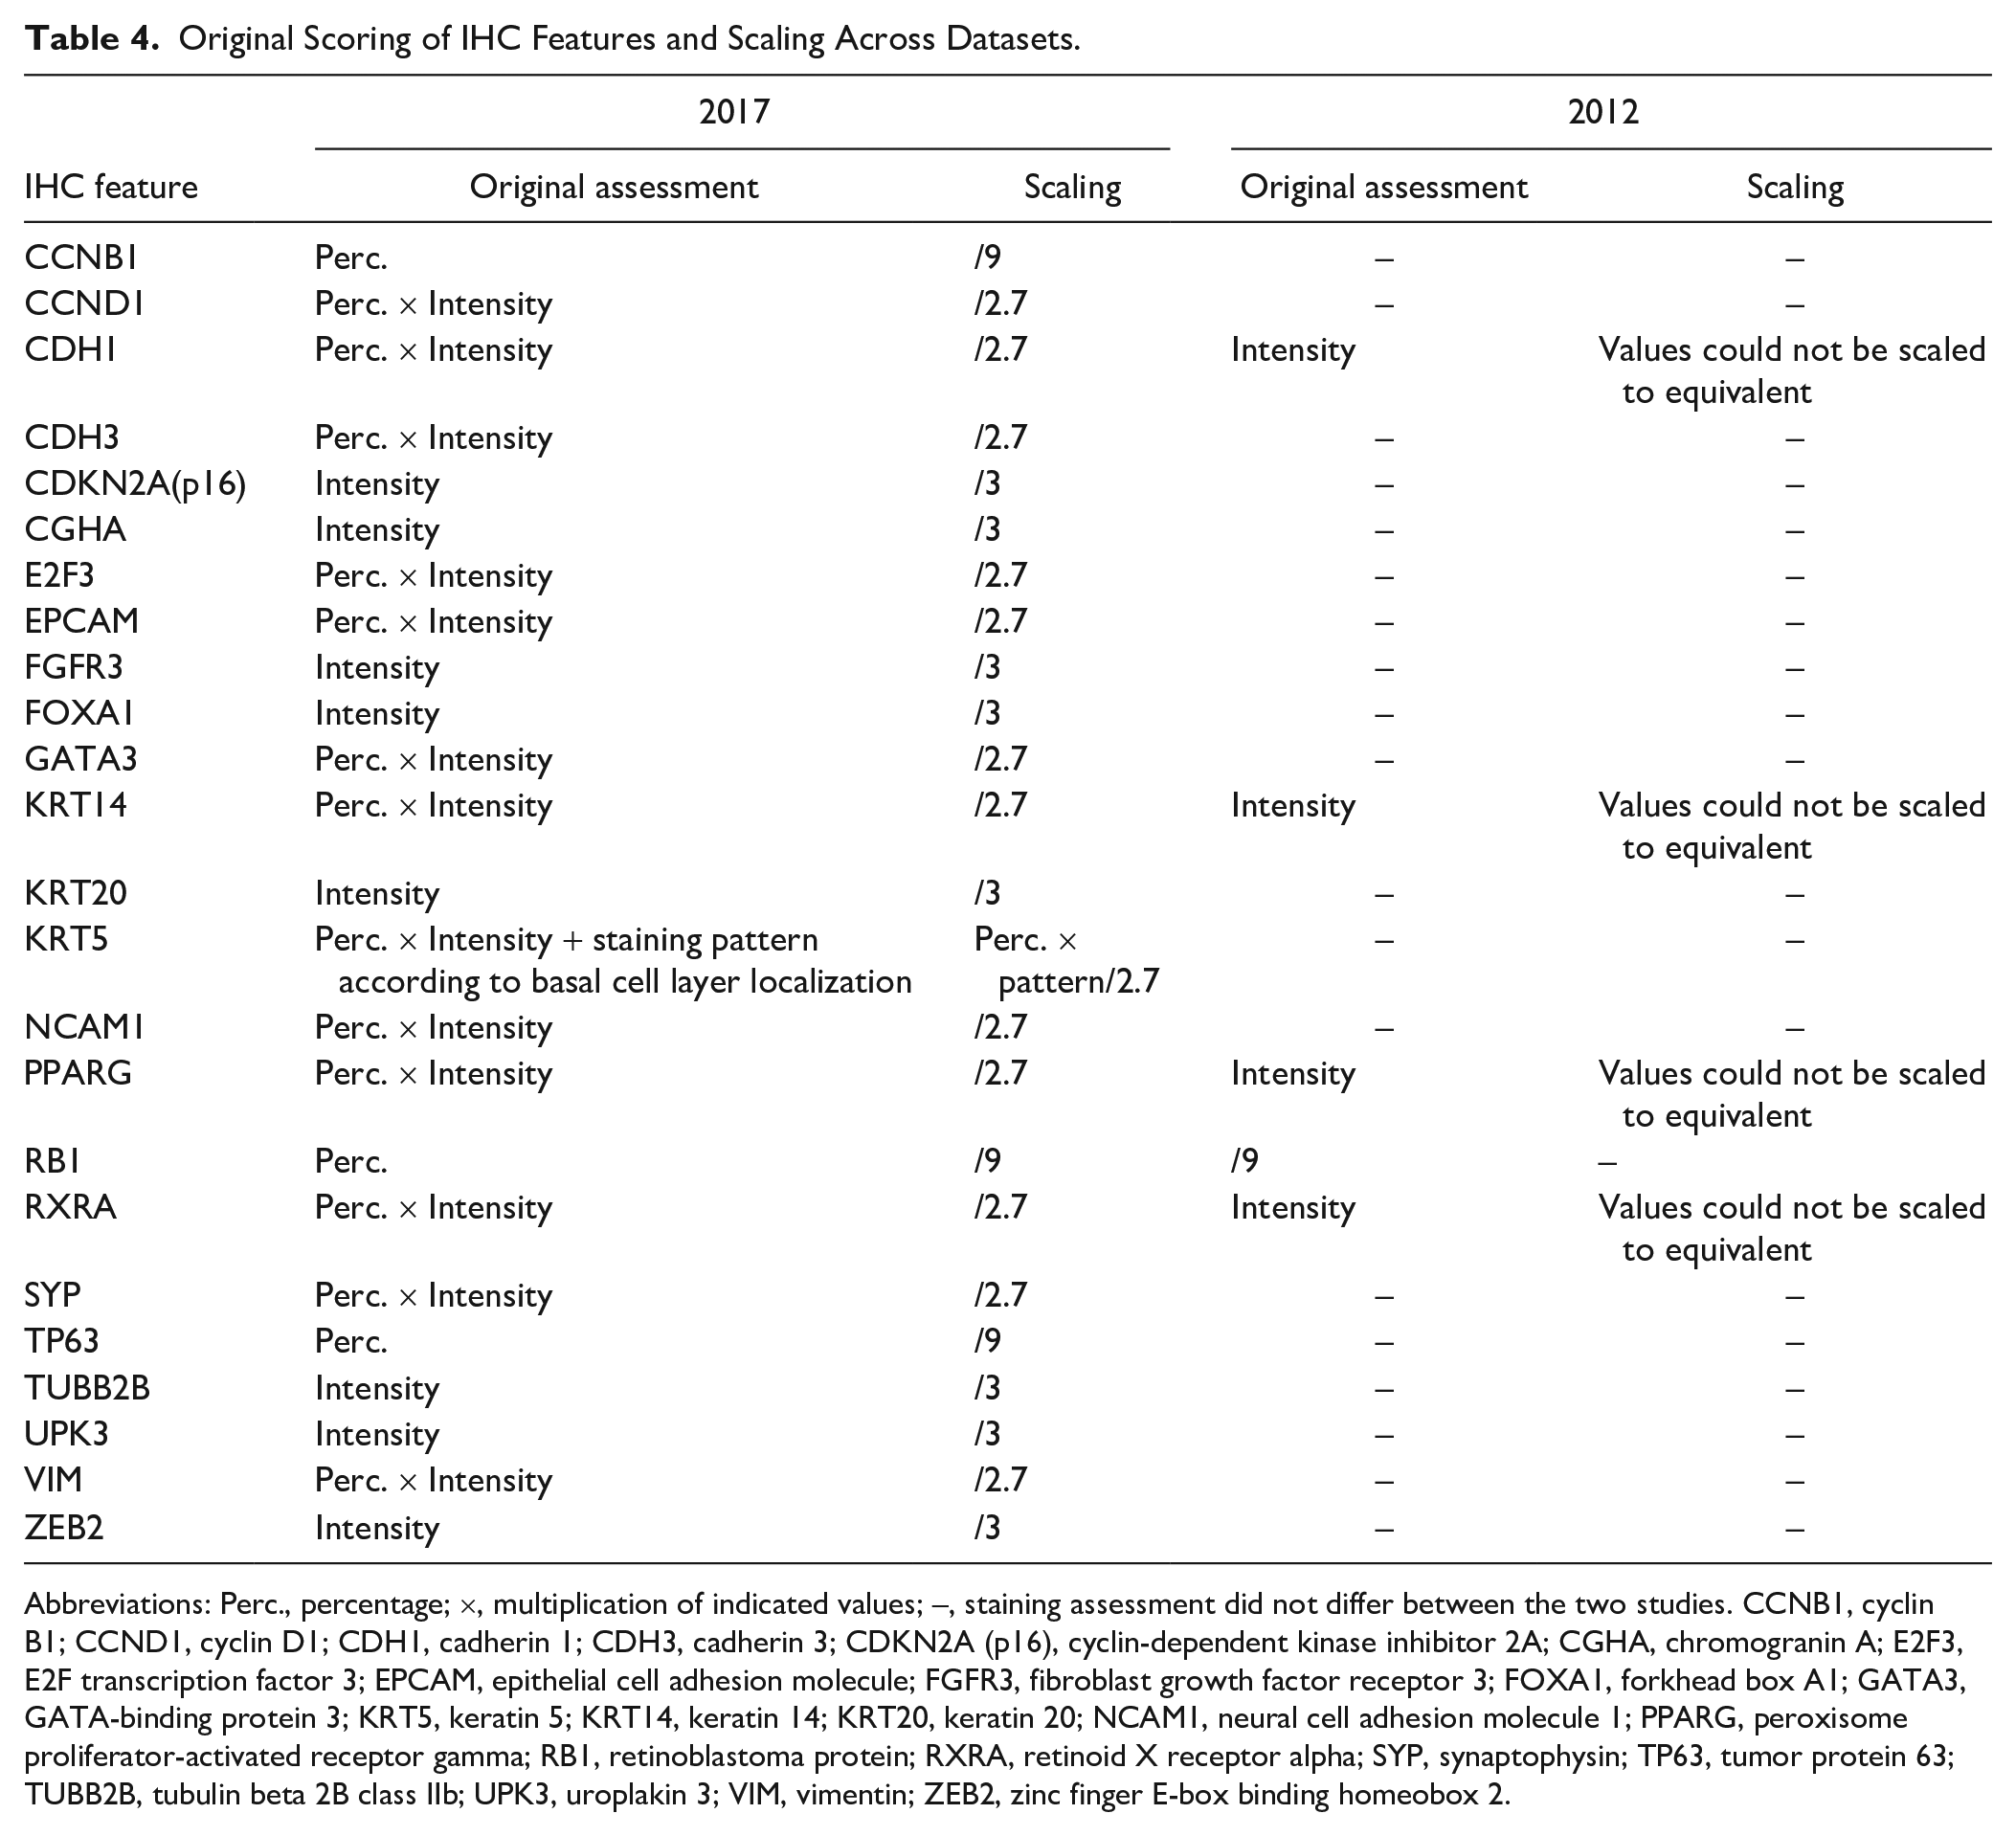
Abbreviations: Perc., percentage; ×, multiplication of indicated values; –, staining assessment did not differ between the two studies. CCNB1, cyclin B1; CCND1, cyclin D1; CDH1, cadherin 1; CDH3, cadherin 3; CDKN2A (p16), cyclin-dependent kinase inhibitor 2A; CGHA, chromogranin A; E2F3, E2F transcription factor 3; EPCAM, epithelial cell adhesion molecule; FGFR3, fibroblast growth factor receptor 3; FOXA1, forkhead box A1; GATA3, GATA-binding protein 3; KRT5, keratin 5; KRT14, keratin 14; KRT20, keratin 20; NCAM1, neural cell adhesion molecule 1; PPARG, peroxisome proliferator-activated receptor gamma; RB1, retinoblastoma protein; RXRA, retinoid X receptor alpha; SYP, synaptophysin; TP63, tumor protein 63; TUBB2B, tubulin beta 2B class IIb; UPK3, uroplakin 3; VIM, vimentin; ZEB2, zinc finger E-box binding homeobox 2.
Data Summary
Statistical analysis was performed in R version 4.1.0. Supervised hierarchical clustering and Spearman correlation analyses were performed to visualize the expression patterns of 24 proteins across all 193 samples. To identify groupings of similar samples, we performed principal components analysis (PCA) and visualized the results using the “FactoMineR” package. In the PCA, the expression patterns of the 24 available proteins were used as features to identify basal, Uro, and GU samples (n=177). To select proteins (features) for use as a subtype classifier, a series of binary receiver operating characteristic (ROC) curve analyses were performed for each of the 24 proteins using the “pROC” package in the R environment. All survival analyses were completed in R using the survival, survminer, and ggsurvplot packages.
Model-building
Decision tree model-building was conducted using the rpart package. Decision tree models in rpart were initially restricted to GATA3, KRT5, and p16 to assess the performance of these antibodies in classifying luminal/basal or Uro/GU/basal subtypes. Next, all 24 protein features were analyzed in rpart, and the simplest model(s) with the highest accuracy was assessed. All decision trees were specified as classification trees using a complexity parameter (cp) of 0.05 to prevent overfitting. The robustness of models was assessed by comparing the performance of trained models against their accuracy when applied to a separate validation set. Four-fold cross-validation with uniformly distributed training (75%) and validation (25%) sets was used to determine the dominant tree structure, which was defined as the model structure that emerged most frequently during cross-validation (Supplemental Figs. 2 and 3). Accuracy was reported rather than balanced accuracy due to low sample numbers in the basal subtype, which overweighs classification inaccuracy.
To assess the extent to which constraining models to 2 or 3 proteins reduced their accuracy, we employed a multiclass decision tree that incorporated a larger number of proteins using the “sklearn” and “graphviz” libraries in python. The dataset was split into training (75%) and validation (25%) datasets. To train the model and prevent overfitting, we followed a stratified K-fold cross-validation (K = 10) approach. The balanced accuracy of the mean and the standard error of the mean (SEM) were used to evaluate model performance. Optimal tree depth was determined by running K-fold cross-validation (K = 5). The “entropy” score was considered a measure of impurity in the binary classification. Performance metrics (recall, precision, and F1 scores) were determined. The precision score indicates a measure of how many correct positive class predictions are made (true positives / true positives + false positives). Recall (sensitivity) indicates the number of correct positive class predictions made by a classifier (true positives / true positives + false negatives). The F1 score is the weighted average of precision and recall scores.
Results
Visualizing Protein Expression, Quantifying Redundancy, and Identifying Subtype-defining Features
Characterizing Expression Patterns
Initially, we visualized the interaction between protein expression patterns and IHC subtypes and quantified the redundancy between IHC features. Using supervised hierarchical clustering of all MIBC samples (n=193), we visualized the expression of 24 IHC features across three subtypes (basal/Uro/GU). We observed the expected associations between subtypes and key molecular features (Fig. 1A). Luminal (Uro and GU) tumors showed distinctly high expression levels of GATA3, EPCAM, and FOXA1, whereas basal tumors showed the enhanced expression of basal keratins, such as KRT5 and KRT14. Spearman correlation analysis of IHC expression values quantified the extent of the overlap between these features, which showed that protein characteristic of luminal subtypes, such as GATA3 and FOXA1, showed strong positive correlations (r = 0.6), as did features of basal differentiation, such as KRT5 and KRT14 (r = 0.69) (Fig. 1B). Protein expression also reflected underlying subtype-specific pathogenic mechanisms. RB1 and p16 expression levels were negatively correlated (r = −0.5), reflecting their epistatic relationship in cell cycle regulation: The loss of either tumor suppressor is sufficient to disable the G1–S cell cycle checkpoint.7,29 This genomic circuitry is further highlighted by positive correlations between RB1 and CCND1 protein levels (r = 0.59) (Fig. 1B), as CCND1 activates RB1, indicating an intact RB1 pathway. 7
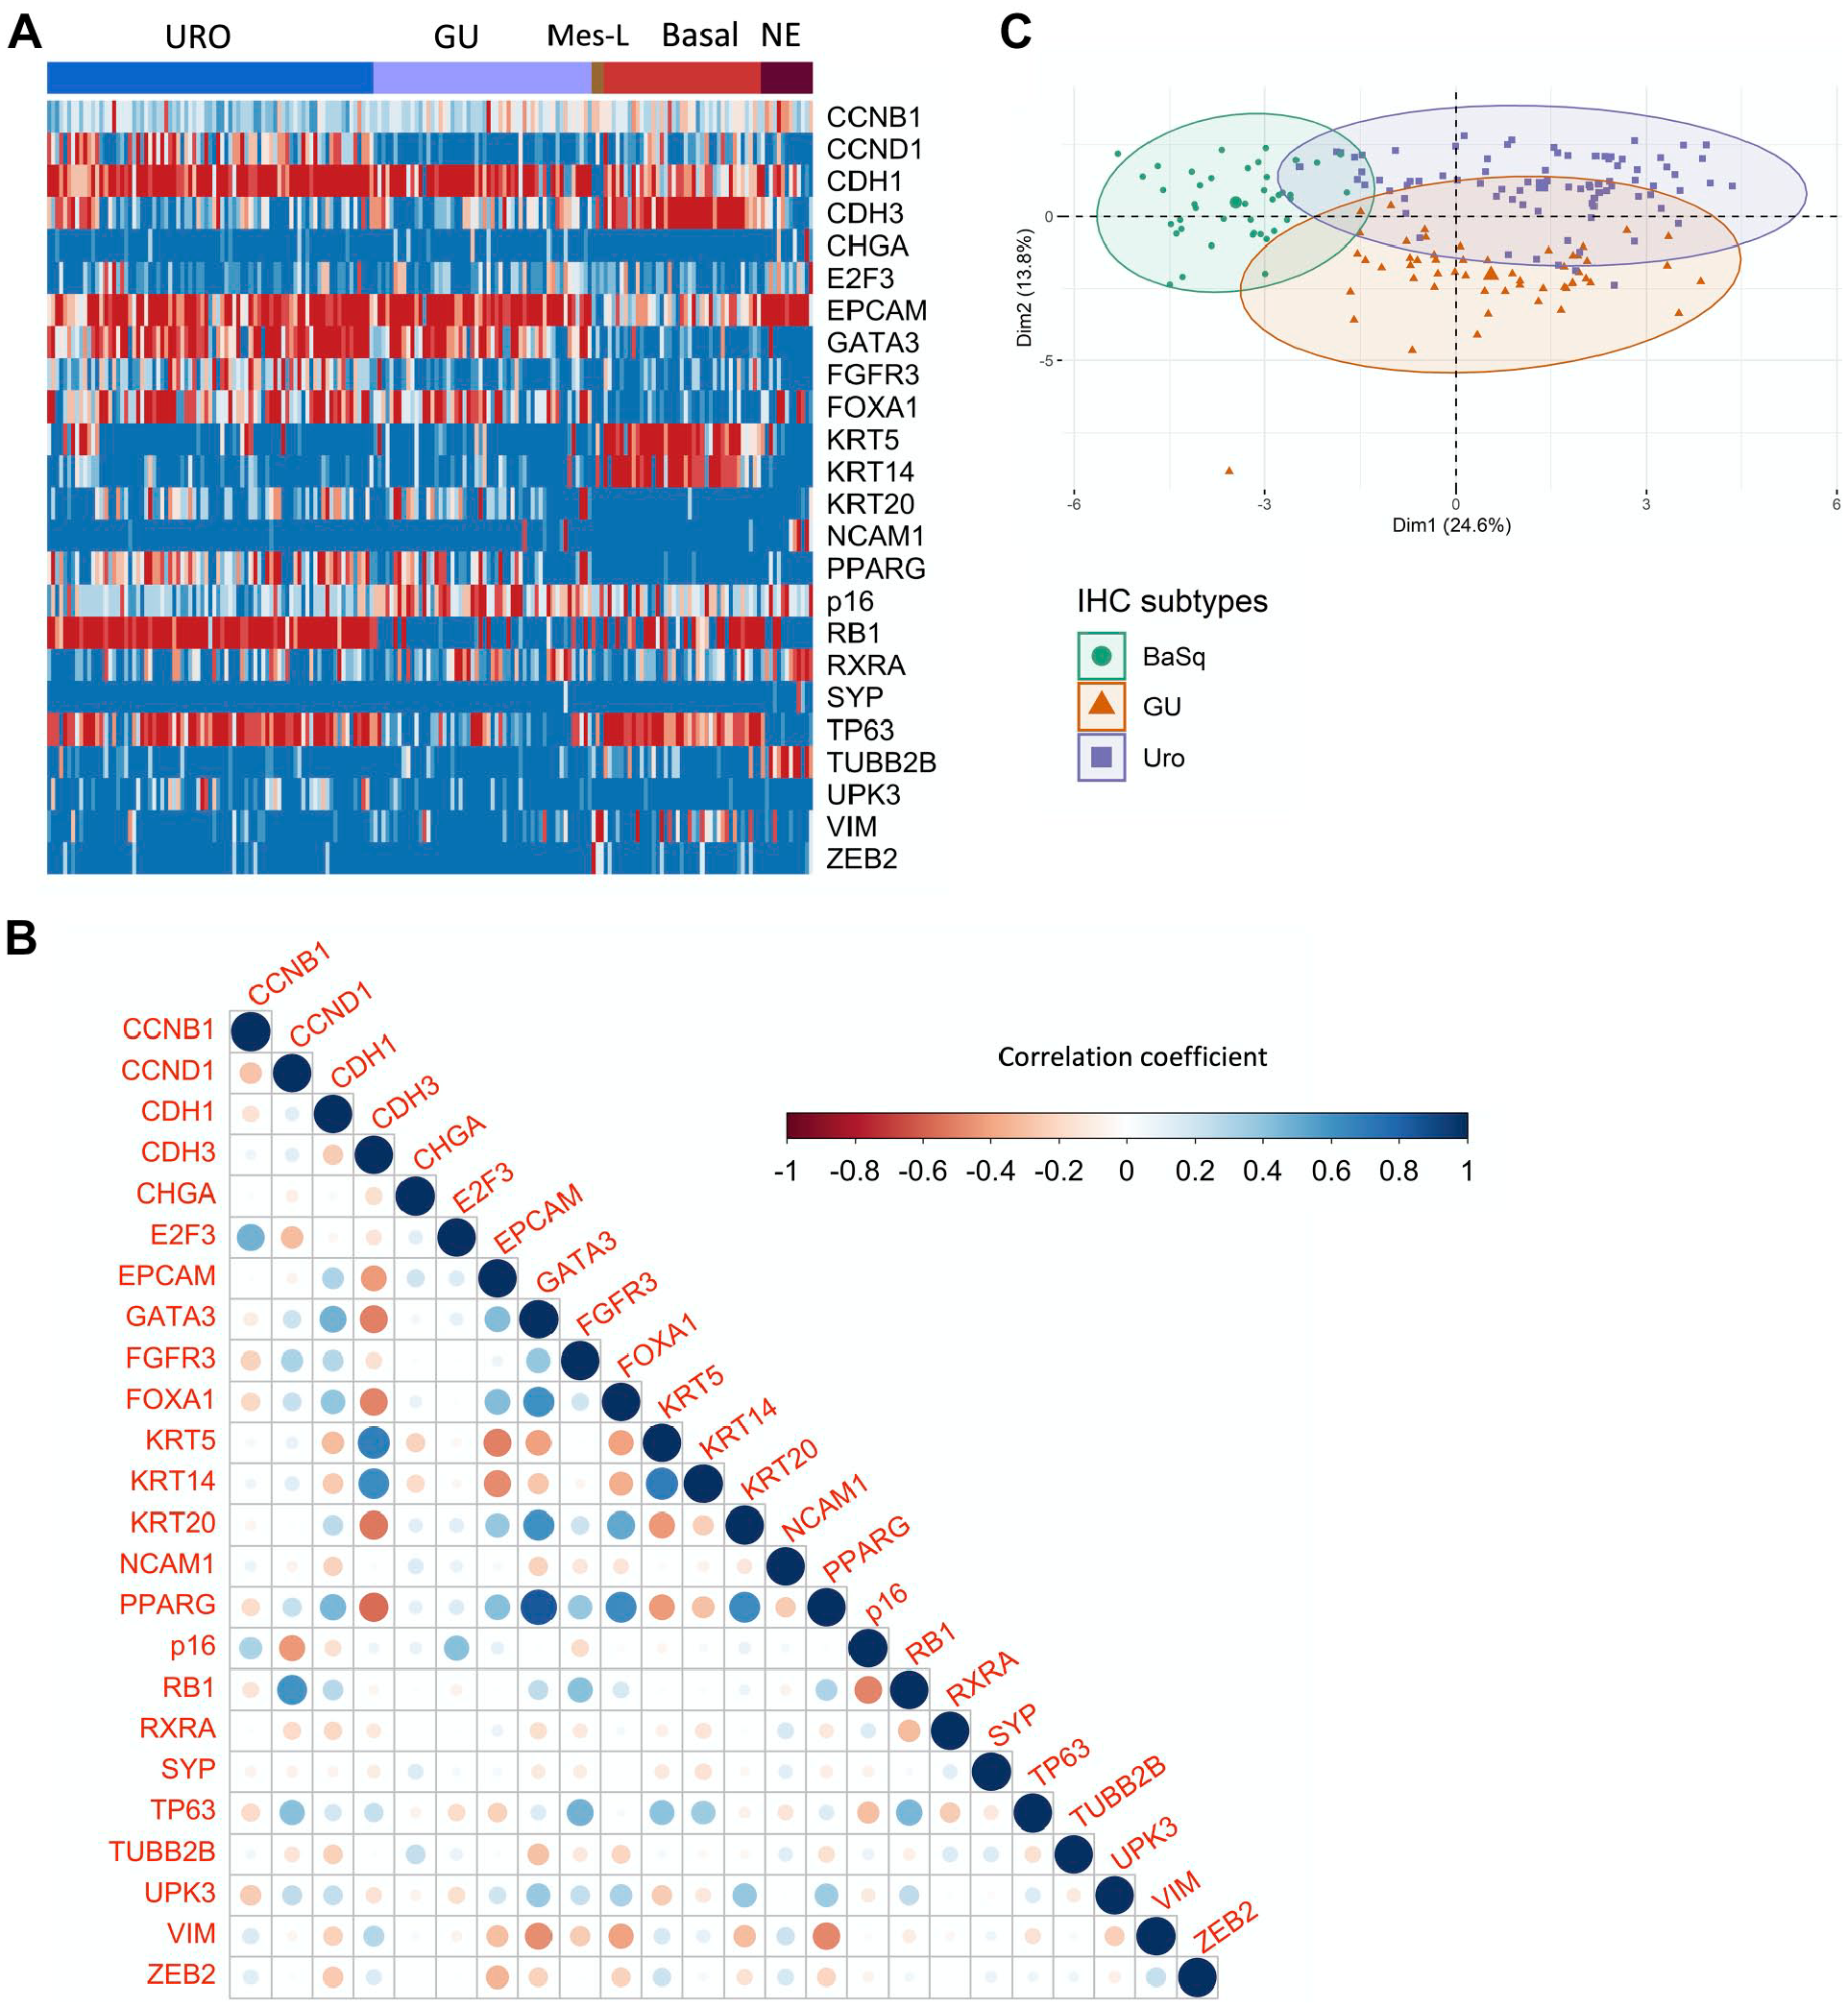
Redundancy of protein features and their relationships with basal and luminal subtypes. (A) Supervised clustering of immunohistochemistry (IHC) expression values recapitulates the expected patterns, defining tumor-cell phenotypes based on IHC subtypes. (B) Spearman correlation coefficients for the IHC expression levels of 24 proteins in all samples (n=193). Dot sizes correspond to correlation strengths. (C) Principal components analysis incorporating IHC expression data for urothelial-like (Uro), genomically unstable (GU), and basal (BaSq) subtypes. Abbreviations: Mes-L, mesenchymal-like; NE, neuroendocrine; CCNB1, cyclin B1; CCND1, cyclin D1; CDH1, cadherin 1; CDH3, cadherin 3; CDKN2A (p16), cyclin-dependent kinase inhibitor 2A; CGHA, chromogranin A; E2F3, E2F transcription factor 3; EPCAM, epithelial cell adhesion molecule; FGFR3, fibroblast growth factor receptor 3; FOXA1, forkhead box A1; GATA3, GATA-binding protein 3; KRT5, keratin 5; KRT14, keratin 14; KRT20, keratin 20; NCAM1, neural cell adhesion molecule 1; PPARG, peroxisome proliferator-activated receptor gamma; RB1, retinoblastoma protein; RXRA, retinoid X receptor alpha; SYP, synaptophysin; TP63, tumor protein 63; TUBB2B, tubulin beta 2B class IIb; UPK3, uroplakin 3; VIM, vimentin; ZEB2, zinc finger E-box binding homeobox 2.
We used PCA to reduce the dimensionality of the protein expression data, which revealed samples clustered according to subtypes. Overlap was observed between subtypes, which was most extensive between the two luminal subtypes, Uro and GU (Fig. 1C). Interestingly, as previously demonstrated by mRNA profiling of the “Urobasal b” phenotype, 1 the basal cluster overlapped more strongly with the Uro subtype than with the GU subtype. These observations highlight the redundant functions of several proteins in molecular subtyping and suggest an opportunity to build more compact classifiers using fewer features.
Clarifying Subtype-defining Features
To identify and quantify which IHC features are the most informative for building compact classifiers, we used the area under the ROC curve (AUC) analysis to rank the associations of individual proteins with the luminal/basal classes and with individual Lund subtypes (basal/Uro/GU). We identified KRT14, KRT5, CDH3, FOXA1, GATA3, PPARG, RB1, CCND1, CDKN2A (p16), FGFR3, and TP63 as the most effective protein features for classifying subtypes, as all yielded AUCs above 80% (Table 5). As expected, key proteins that were previously selected as defining tumor-cell phenotypes 7 achieved the highest accuracies. For example, in discriminating between basal and luminal subtypes, the basal keratins were associated with the highest accuracies of 94.39% (95% confidence interval [CI]: 91%–97%) for KRT5 and 94.11% (95% CI: 89%–99%) for KRT14 (Table 5). The most accurate protein features for discriminating between Uro and GU subtypes were RB1 (92.62%, 95% CI: 87%–98%), CCND1 (92.62%, 95% CI: 87%–98%), and p16 (92.62%, 95% CI: 87%–98%) (Table 5).
Ranked Performances of the Top 10 Proteins for Identifying Subtypes in the ROC Analysis.
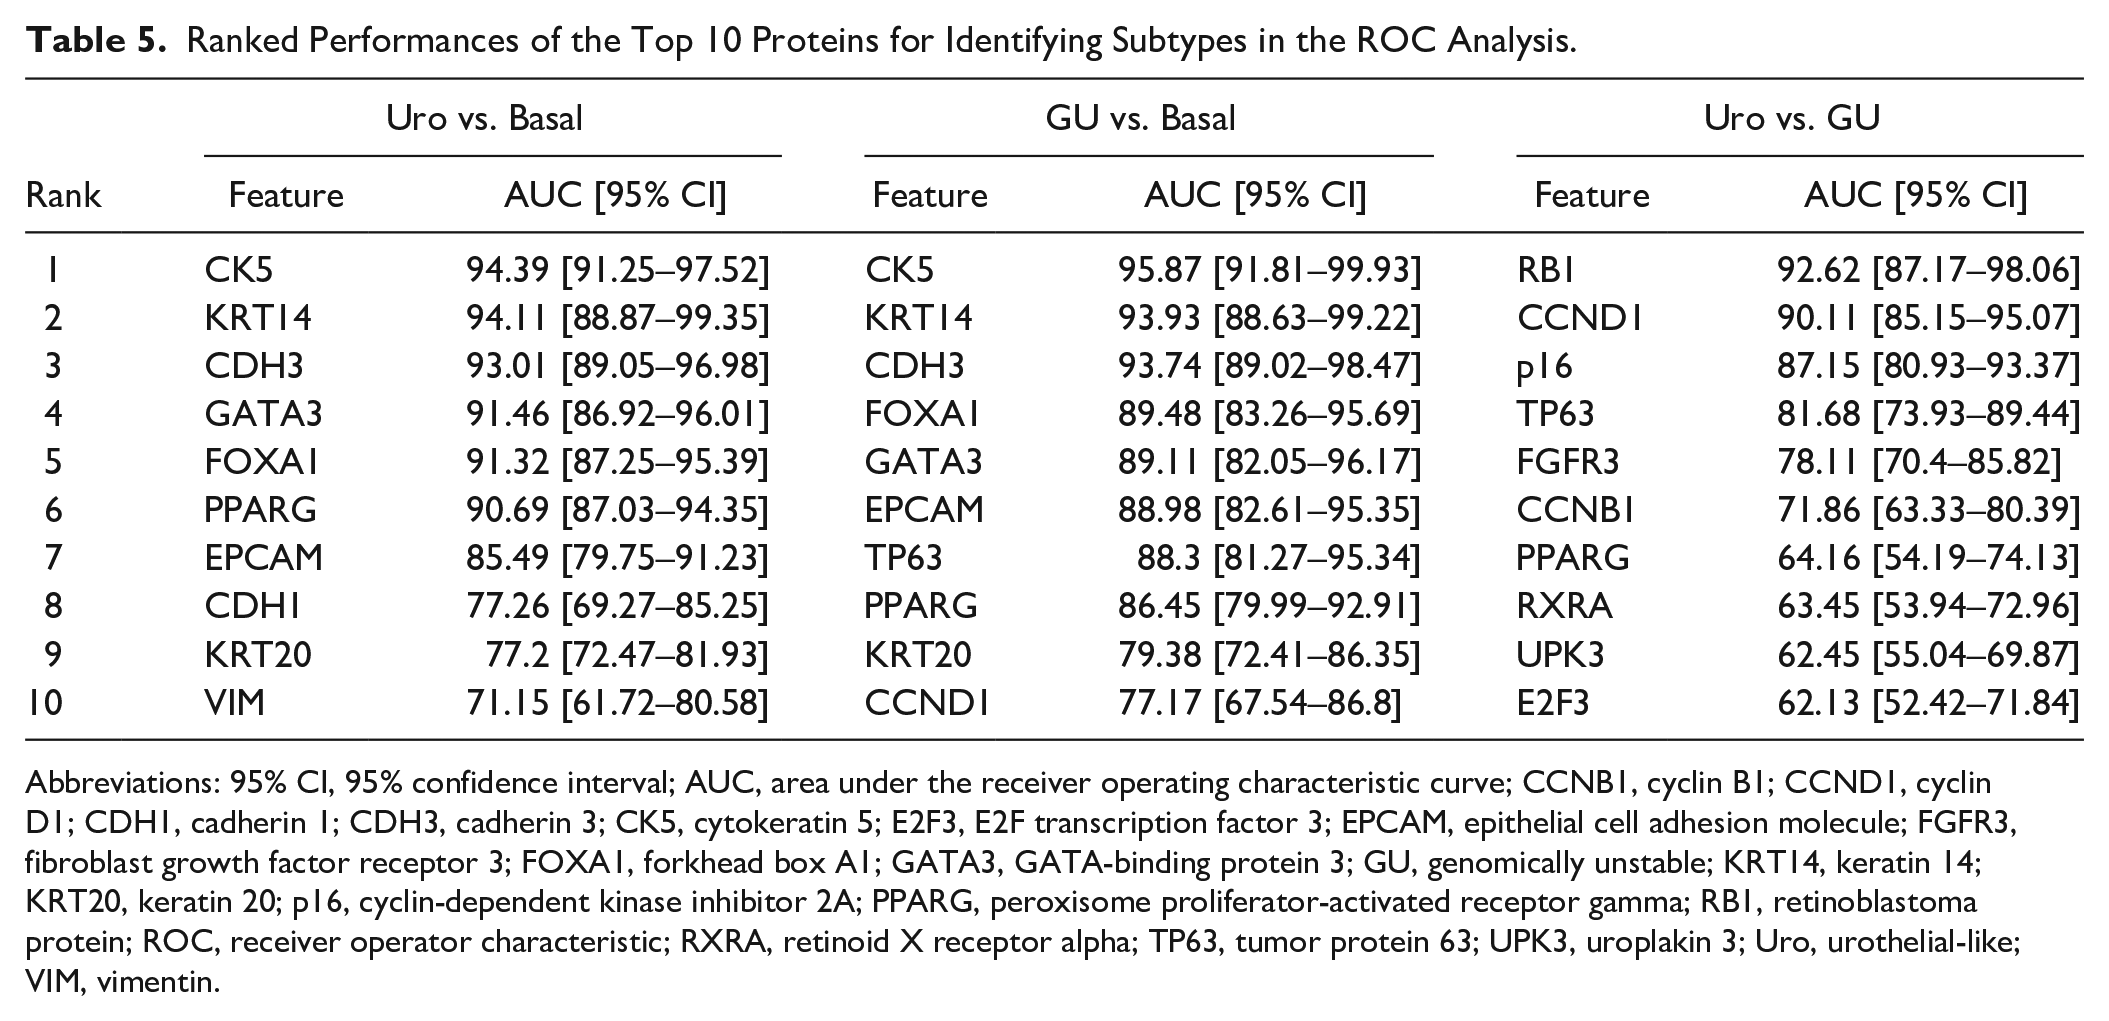
Abbreviations: 95% CI, 95% confidence interval; AUC, area under the receiver operating characteristic curve; CCNB1, cyclin B1; CCND1, cyclin D1; CDH1, cadherin 1; CDH3, cadherin 3; CK5, cytokeratin 5; E2F3, E2F transcription factor 3; EPCAM, epithelial cell adhesion molecule; FGFR3, fibroblast growth factor receptor 3; FOXA1, forkhead box A1; GATA3, GATA-binding protein 3; GU, genomically unstable; KRT14, keratin 14; KRT20, keratin 20; p16, cyclin-dependent kinase inhibitor 2A; PPARG, peroxisome proliferator-activated receptor gamma; RB1, retinoblastoma protein; ROC, receiver operator characteristic; RXRA, retinoid X receptor alpha; TP63, tumor protein 63; UPK3, uroplakin 3; Uro, urothelial-like; VIM, vimentin.
Importantly, several proteins were highly correlated with each other (Fig. 1B), in addition to a given subtype, and could individually identify either basal (KRT14, KRT5) or luminal (CDH3, FOXA1, and GATA3) tumors with high accuracy. These observations of protein expression redundancies suggested that an accurate subtype classification model could be built based on fewer protein features. The ranked accuracies of all 24 proteins are presented in Supplemental Table 2.
Determining the Most Parsimonious Models to Accurately Identify Subtypes
Basal/Luminal Classification Using GATA3 and KRT5
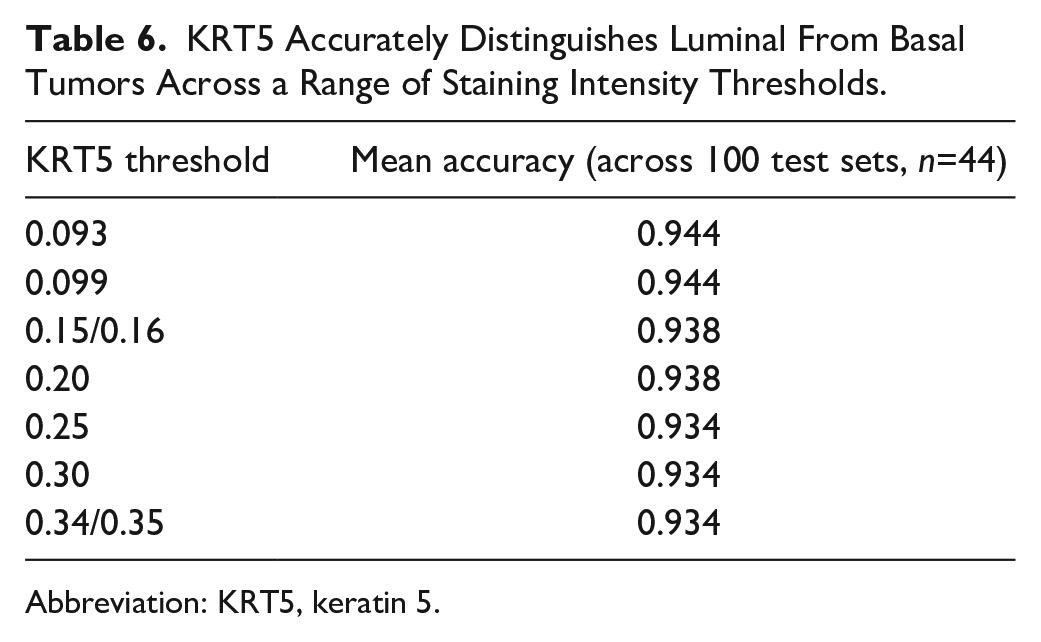
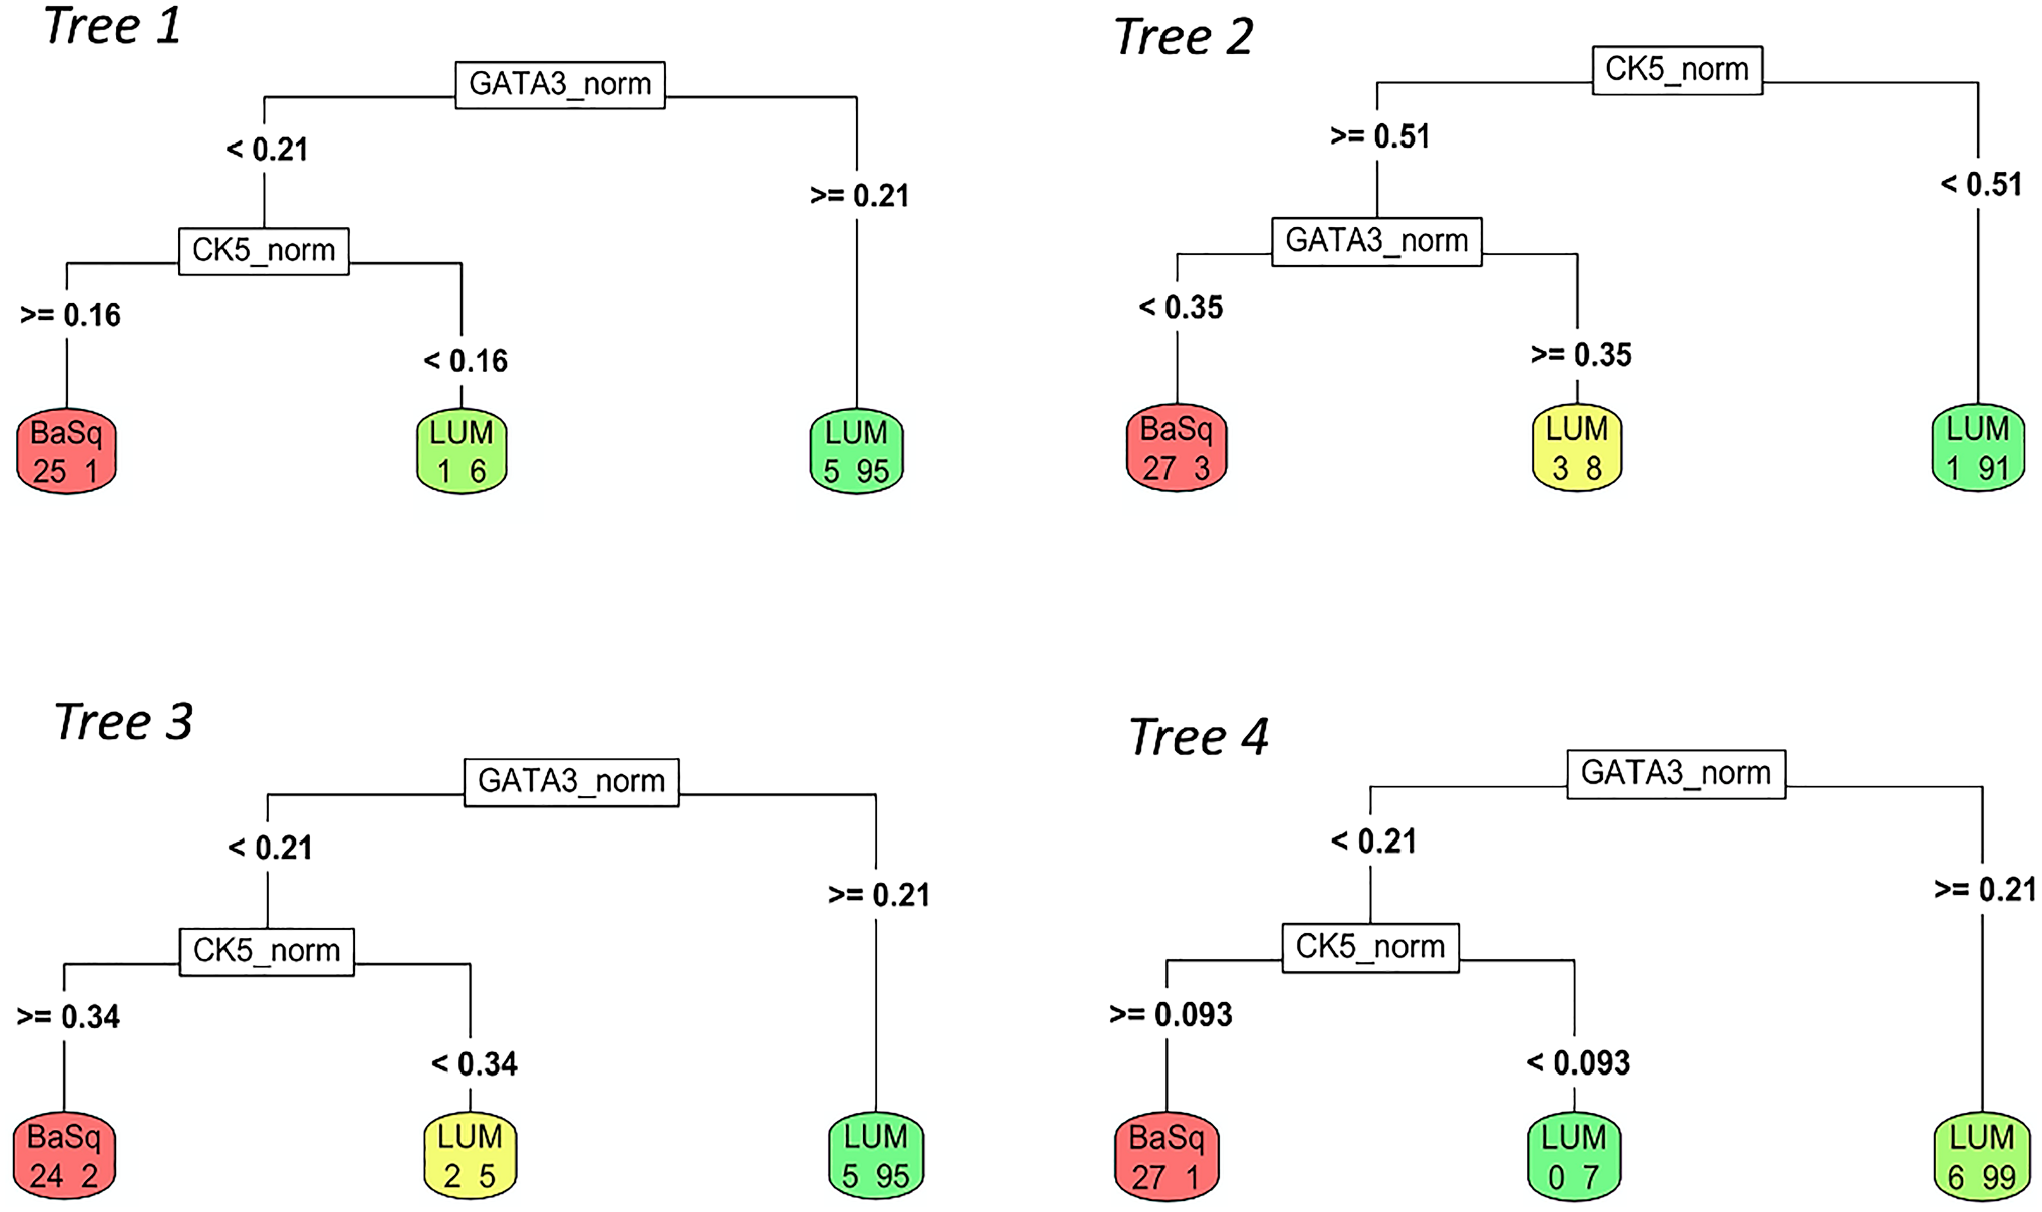
We focused initially on the performance of a previously proposed model, 10 which incorporates GATA3, KRT5, and p16 to discriminate basal and luminal subtypes. Others have reported that the combination of GATA3 and KRT5 can identify basal and luminal subtypes with more than 90% accuracy.13,14 Using available Lund datasets of samples subtyped using both mRNA expression and IHC analysis,1,7 we explored the utility of GATA3 and KRT5 for top-level basal/luminal classification. The 4-fold cross-validation of a decision tree classifier using uniformly distributed training sets (n=133) identified a dominant tree structure with three branches that used GATA3, followed by KRT5 (Fig. 2A, Supplemental Fig. 2). The tree is initially split by GATA3 expression, with high GATA3 expression (TCS ≥ 0.21) identifying luminal cases. Among samples with low GATA3 expression, a separate branch is created according to KRT5 expression, which is high for basal cases and low in a second subset of luminal cases (Fig. 2A). Across the trees with this dominant structure, a threshold of 0.21 was consistently chosen for GATA3, whereas KRT5 demonstrated a range of thresholds, from 0.09 to 0.34, with high resulting accuracies in separate validation sets (Supplemental Fig. 2, Supplemental Table 3). We then sampled iteratively across 100 random validation sets to determine the KRT5 threshold with the highest resulting accuracy. The tested thresholds included those provided by the resulting dominant trees (e.g., 0.09, 0.16, 0.34), as well as any intermediate values within 0.05 increments. Using these 100 validation sets, we calculated the mean accuracy for each threshold and visualized the distribution of accuracies (Table 6). For the range of KRT5 thresholds between 0.09 and 0.34, luminal/basal classification rates remained highly accurate, at 93% to 94%.
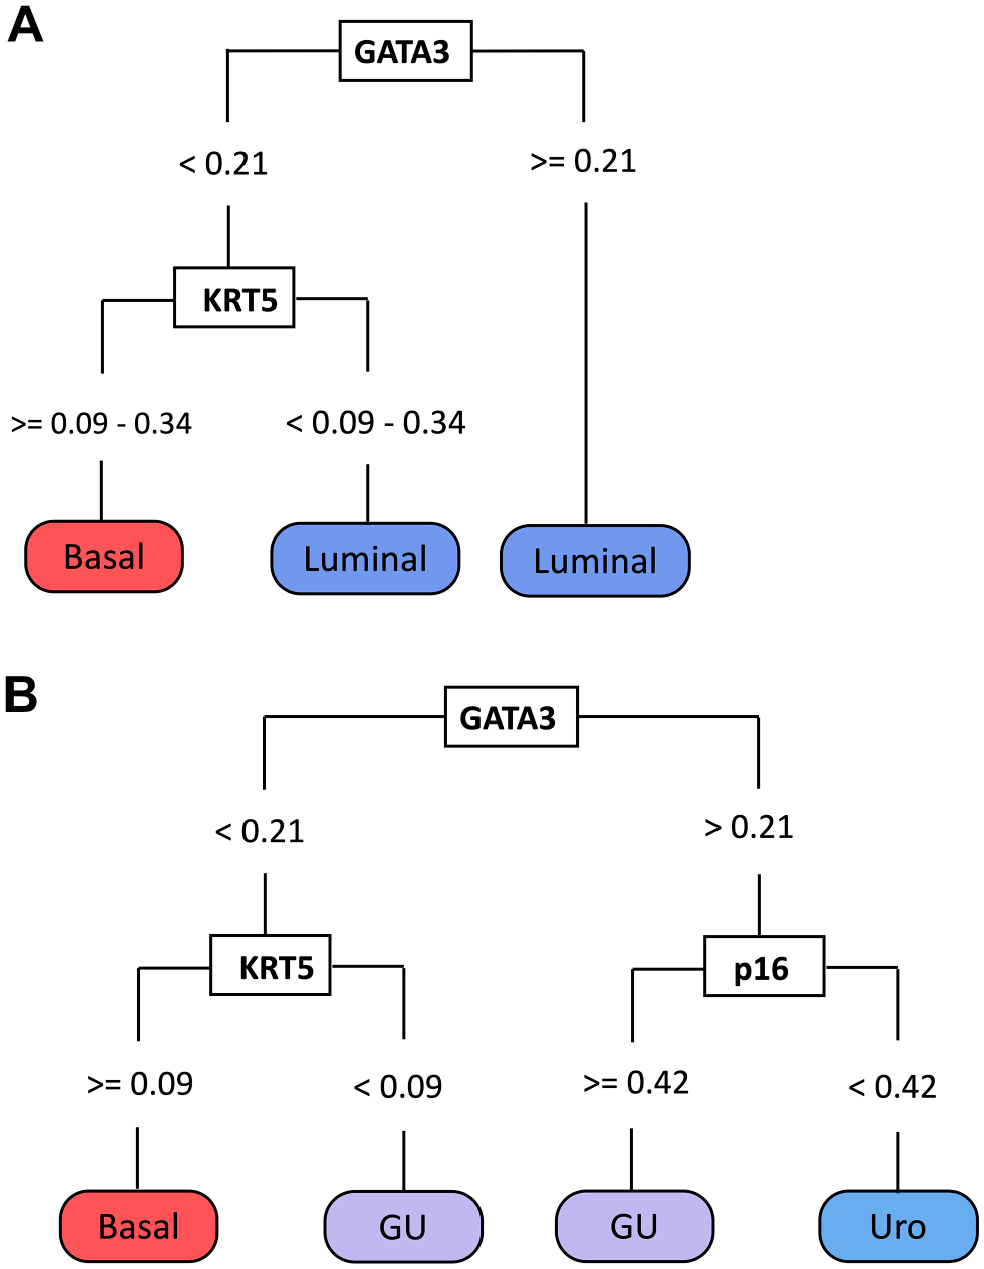
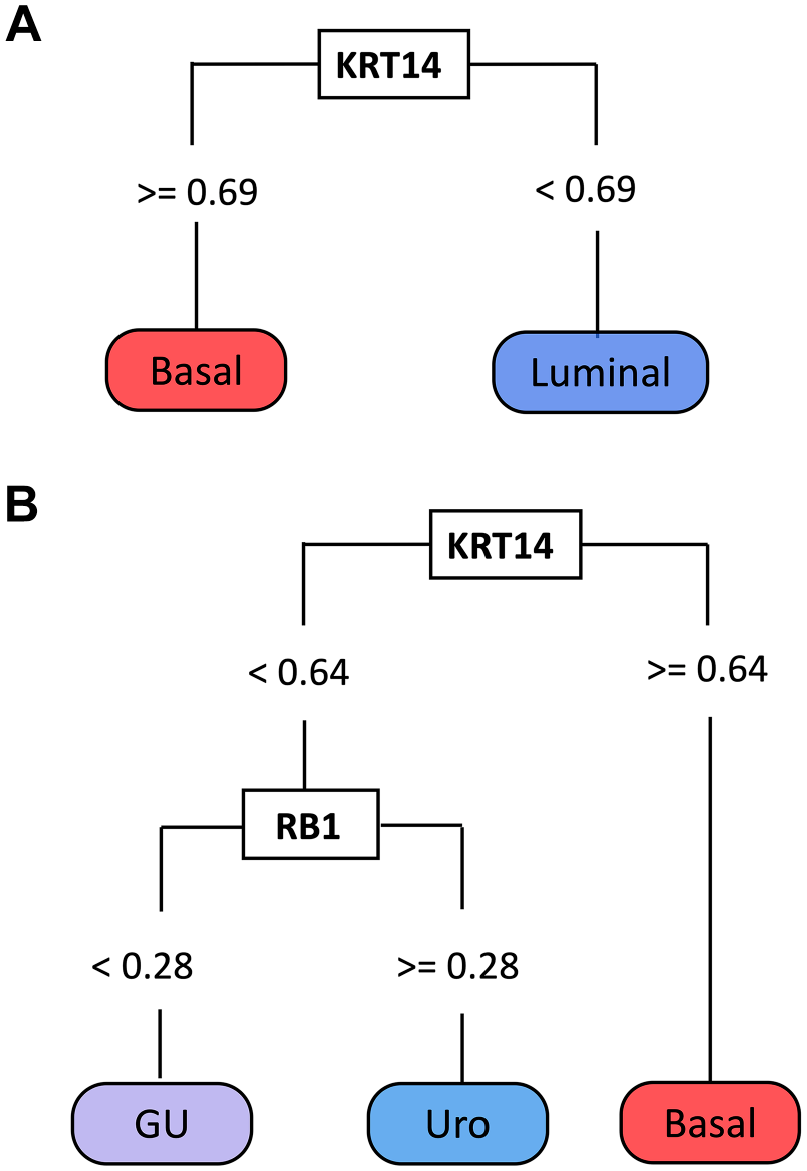
Decision tree classifiers using GATA3, KRT5, and p16 to identify luminal-basal and urothelial-like (Uro), genomically unstable (GU), and basal subtypes. (A) Identification of luminal and basal subtypes using GATA3 and KRT5. (B) Identification of basal, Uro, and GU subtypes using GATA3, KRT5, and p16. Abbreviations: GATA3, GATA-binding protein 3; KRT5, keratin 5; p16, cyclin-dependent kinase inhibitor 2A.
KRT5 Accurately Distinguishes Luminal From Basal Tumors Across a Range of Staining Intensity Thresholds.
Abbreviation: KRT5, keratin 5.
To further test the classification accuracy of this model, we trained the model using the 2017 Lund cohort 7 and validated the model using a separate Lund 2012 cohort. 1 This resulted in the same tree structure of GATA3 followed by KRT5, with similar thresholds (0.21 and 0.099, respectively) and an accuracy of 91% (95% CI: 82%–96%) (Fig. 2A). As a result, we concluded that GATA3 and KRT5 could classify MIBC samples into luminal and basal subtypes with >90% accuracy (Table 7).
Performance of Simple Classifiers.
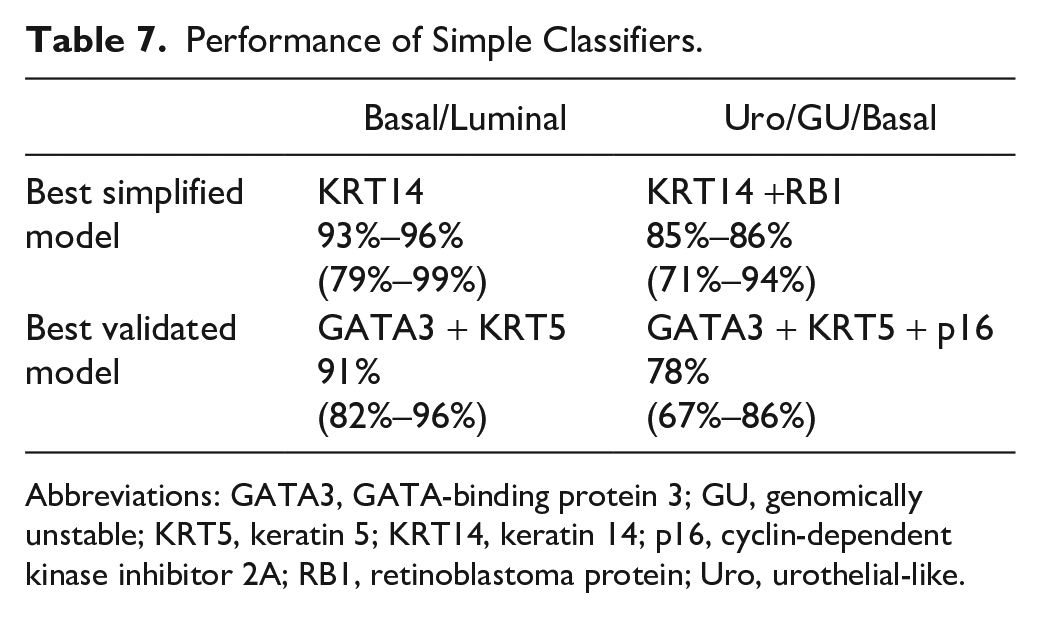
Abbreviations: GATA3, GATA-binding protein 3; GU, genomically unstable; KRT5, keratin 5; KRT14, keratin 14; p16, cyclin-dependent kinase inhibitor 2A; RB1, retinoblastoma protein; Uro, urothelial-like.
Uro, GU, and Basal Subtype Classification Using GATA3, KRT5, and p16
Next, we assessed the ability of p16 to identify Uro and GU subsets among luminal tumors by adding p16 to the GATA3 and KRT5 model. Similar to the basal/luminal classification analysis, we used the 2017 Lund cohort 7 (n=177) as a training set and an additional MIBC Lund cohort 1 (2012 cohort, n=76) as a validation set. The resulting tree demonstrated four branches (Fig. 2B, Supplemental Fig. 3). The first node separated tumors positive for GATA3 into the luminal branch, followed by the detection of high p16 expression to distinguish GU from Uro tumors. This tree suggested that tumors with low GATA3 and KRT5 expression should be classified as GU, whereas KRT5-positive tumors that are negative for GATA3 are classified as basal. The accuracy of the dominant model using GATA3, KRT5, and p16 was 78% (95% CI: 67%–86%) in the validation set. Importantly, using this approach revealed similar thresholds for GATA3 (0.21) and KRT5 (0.099) as the previous basal/luminal classification model and the initial cross-validation, indicating that these thresholds are likely robust (Fig. 2B, Supplemental Table 4). Therefore, we concluded that the use of all three antibodies could classify MIBC samples into basal/Uro/GU subtypes with approximately 78% accuracy (Table 7).
Clinical Outcomes Using Parsimonious Subtype Classification Models
The clinical significance of subtyping has been previously investigated in a variety of cohorts, so we next investigated whether overall survival was significantly different based on the basal/luminal and basal, Uro and GU classification models established above. In accordance with the original mRNA subtyping data, the log-rank p value for overall survival was not significant when stratified by basal/luminal (Fig. 3A) or basal/Uro/GU (Fig. 3B).
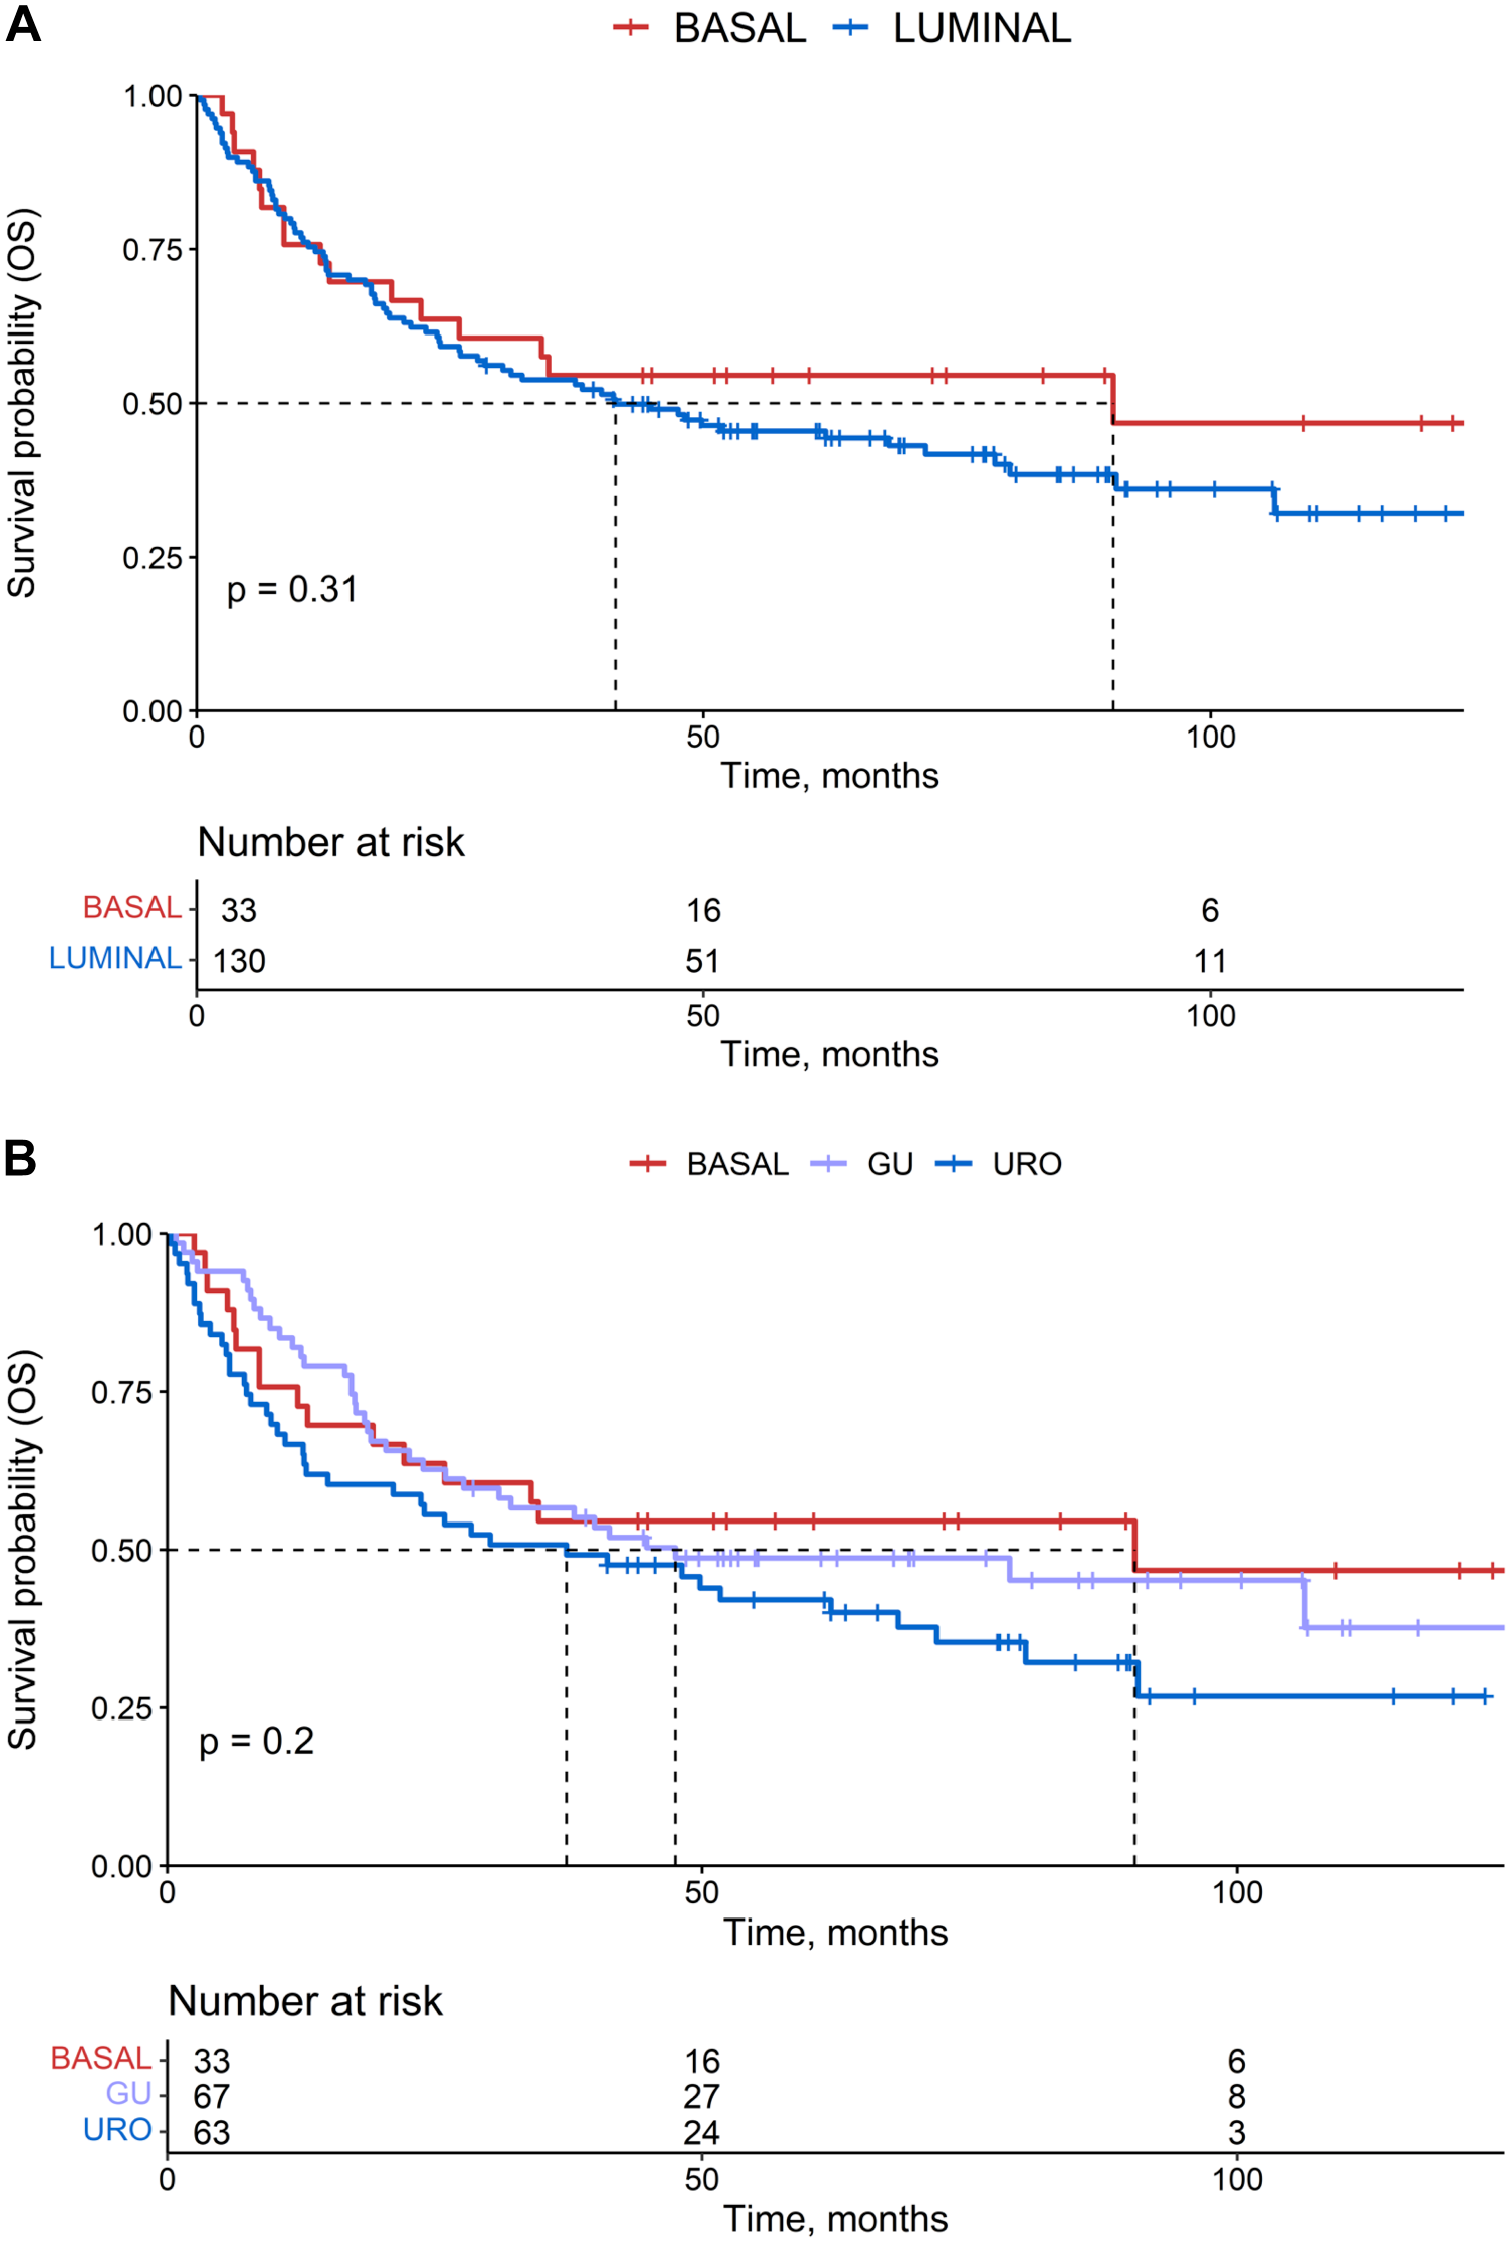
Kaplan–Meier survival analyses. (A) Overall survival of muscle-invasive bladder cancer (MIBC) patients stratified by luminal (blue) or basal (red) immunohistochemistry (IHC) subtype assignment. (B) Overall survival of MIBC patients stratified by urothelial-like (URO) (blue), genomically unstable (GU) (purple), or basal (red) IHC subtype assignment. The p values are listed according to log-rank test.
Optimizing Decision Tree Models for Parsimony and Accuracy
Basal/Luminal Classification Using KRT14
We next expanded our model-building to determine which of the 24 IHC features could generate the simplest model with improved classification accuracy. Using the same 4-fold cross-validation method on uniform training and validation sets, we identified a dominant tree structure that separated two branches using only KRT14 (threshold = 0.69) (Fig. 4A). This tree classified tumors with high KRT14 expression (TCS > 0.69) as basal, whereas tumors with low KRT14 expression (TCS < 0.69) were classified as luminal. Interestingly, this KRT14 threshold (0.69) was identical across all training cross-validation iterations and, therefore, did not require additional bootstrapping to optimize the thresholds with the highest accuracy. Throughout cross-validation iterations, the accuracy of this model remained high, ranging from 93% to 96% (95% CI: 0.79%–0.99%). We were unable to test the accuracy of this dominant tree structure in independent validation sets (2017 cohort) due to differing KRT14 assessment methods between the 2012 cohort, which assessed intensity only and the 2017 cohort, which assessed intensity and percent positive cells.1,7 However, these findings suggested that KRT14 can provide more accurate identification of basal and luminal subtypes than KRT5, and additional testing is warranted to identify the overall accuracy of KRT14 across multiple cohorts.
Decision tree classifiers using KRT14 and RB1. (A) KRT14 identifies luminal and basal subtypes. (B) KRT14 and RB1 identify urothelial-like (Uro), genomically unstable (GU), and basal subtypes. Abbreviations: KRT14, keratin 14; and RB1, retinoblastoma protein.
KRT14 and RB1 for Classifying Basal, Uro, and GU Subtypes
As described above, we continued model-building by examining all 24 IHC features to identify the simplest model for identifying the three dominant MIBC subtypes (basal, Uro, and GU). Several models used only two proteins, KRT14 (threshold = 0.64) followed by RB1 (threshold = 0.28), and achieved accuracies of 85% to 86% (95% CI: 0.71%–0.94%) (Fig. 4B, Table 7). This model classified tumors with high KRT14 protein expression as basal, whereas low KRT14 expression was classified as luminal. Luminal tumors were then subdivided into Uro and GU subtypes based on the positive and negative expression of RB1, respectively. KRT14 was assessed differently in the 2017 and 2012 cohorts,1,7 preventing the further examination of these models in independent validation sets. However, the promising accuracies of these simplified models using KRT14 and RB1 suggest that these proteins may serve as useful subtyping features.
Do Additional Protein Features Improve Subtyping?
To determine whether applying constraints on the number of features significantly reduced the accuracy of subtyping, we removed those constraints and built models including up to eight proteins. To assess which IHC features could be added to improve classification accuracy, we generated multiclass decision tree classifiers optimized to identify basal, Uro, and GU tumors. For feature selection, we considered proteins with AUC values ≥80% for the classification of samples into basal, Uro, or GU subtypes. Using these more expansive parameters, the most accurate decision tree incorporated KRT5, KRT14, GATA3, FOXA1, EPCAM, TP63, RB1, and CCND1 into four decision nodes (Fig. 5), in which each decision node corresponds to a branch in the tree. Following 10-fold stratified cross-validation, this model achieved a balanced accuracy of 85.6% ± 0.07% in the training set. When applied to the validation set, the accuracy decreased slightly to 82% (Table 8). Thus, adding more proteins did not improve the accuracy compared with the previously identified parsimonious models. The performance metrics of the model are summarized in Table 8, which shows that the model achieved the highest precision (1.00) for the identification of the GU subtype but with limited sensitivity (0.64). F1 scores, representing the weighted mean of recall (sensitivity) and precision for identifying each class (basal, 0.80; Uro, 0.85; GU, 0.78), indicate good accuracy for identifying individual subtypes (Table 8).
Performance Statistics of the Optimal Classifier Model on the Validation Dataset (n=45).
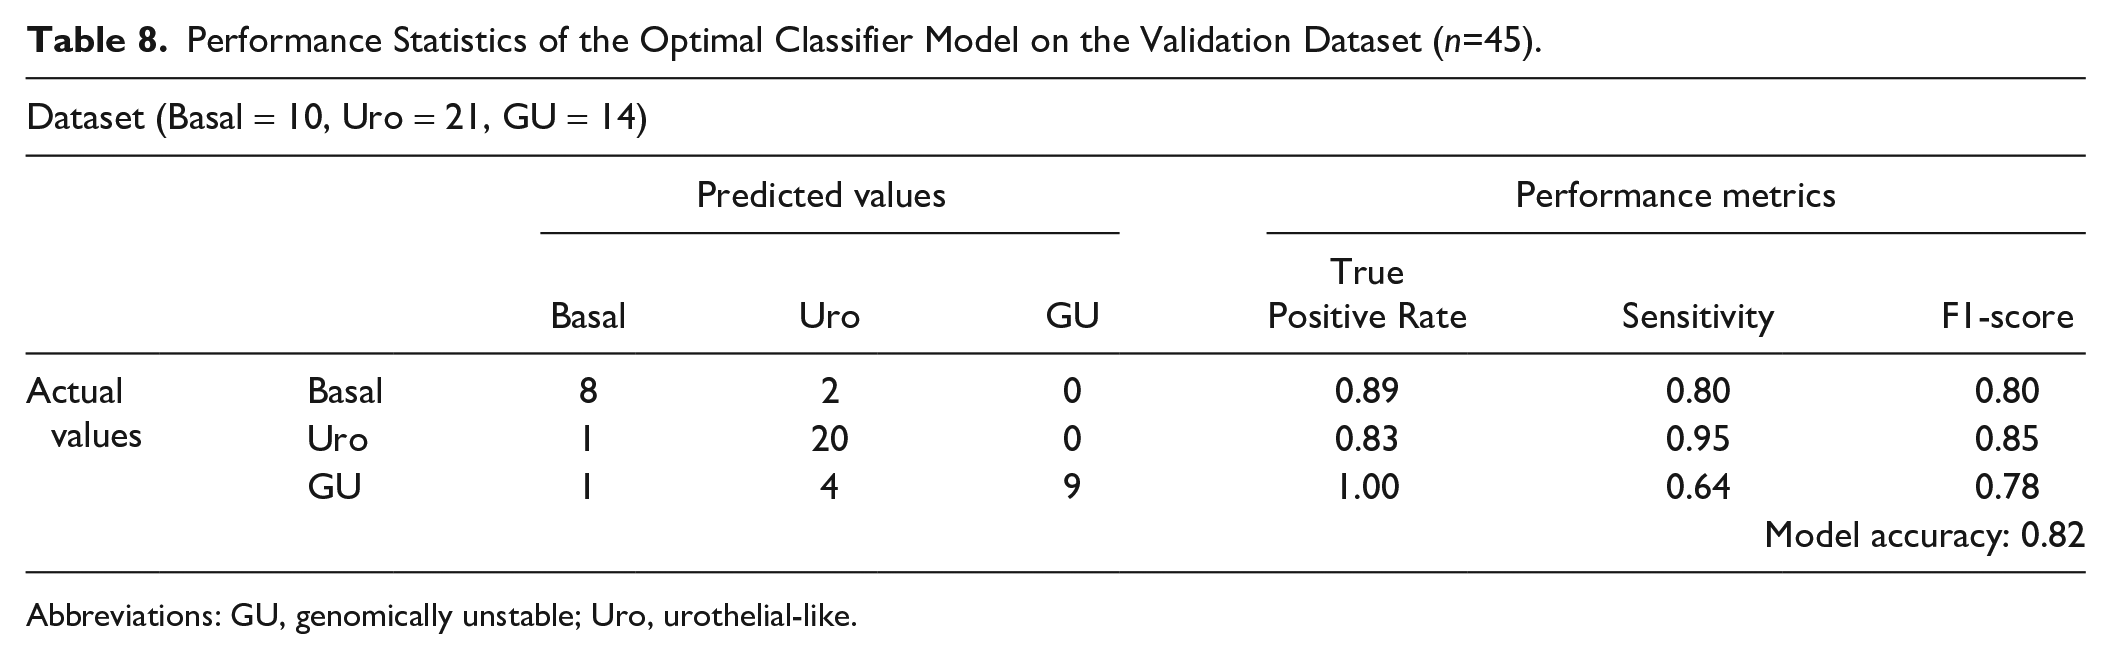
Abbreviations: GU, genomically unstable; Uro, urothelial-like.
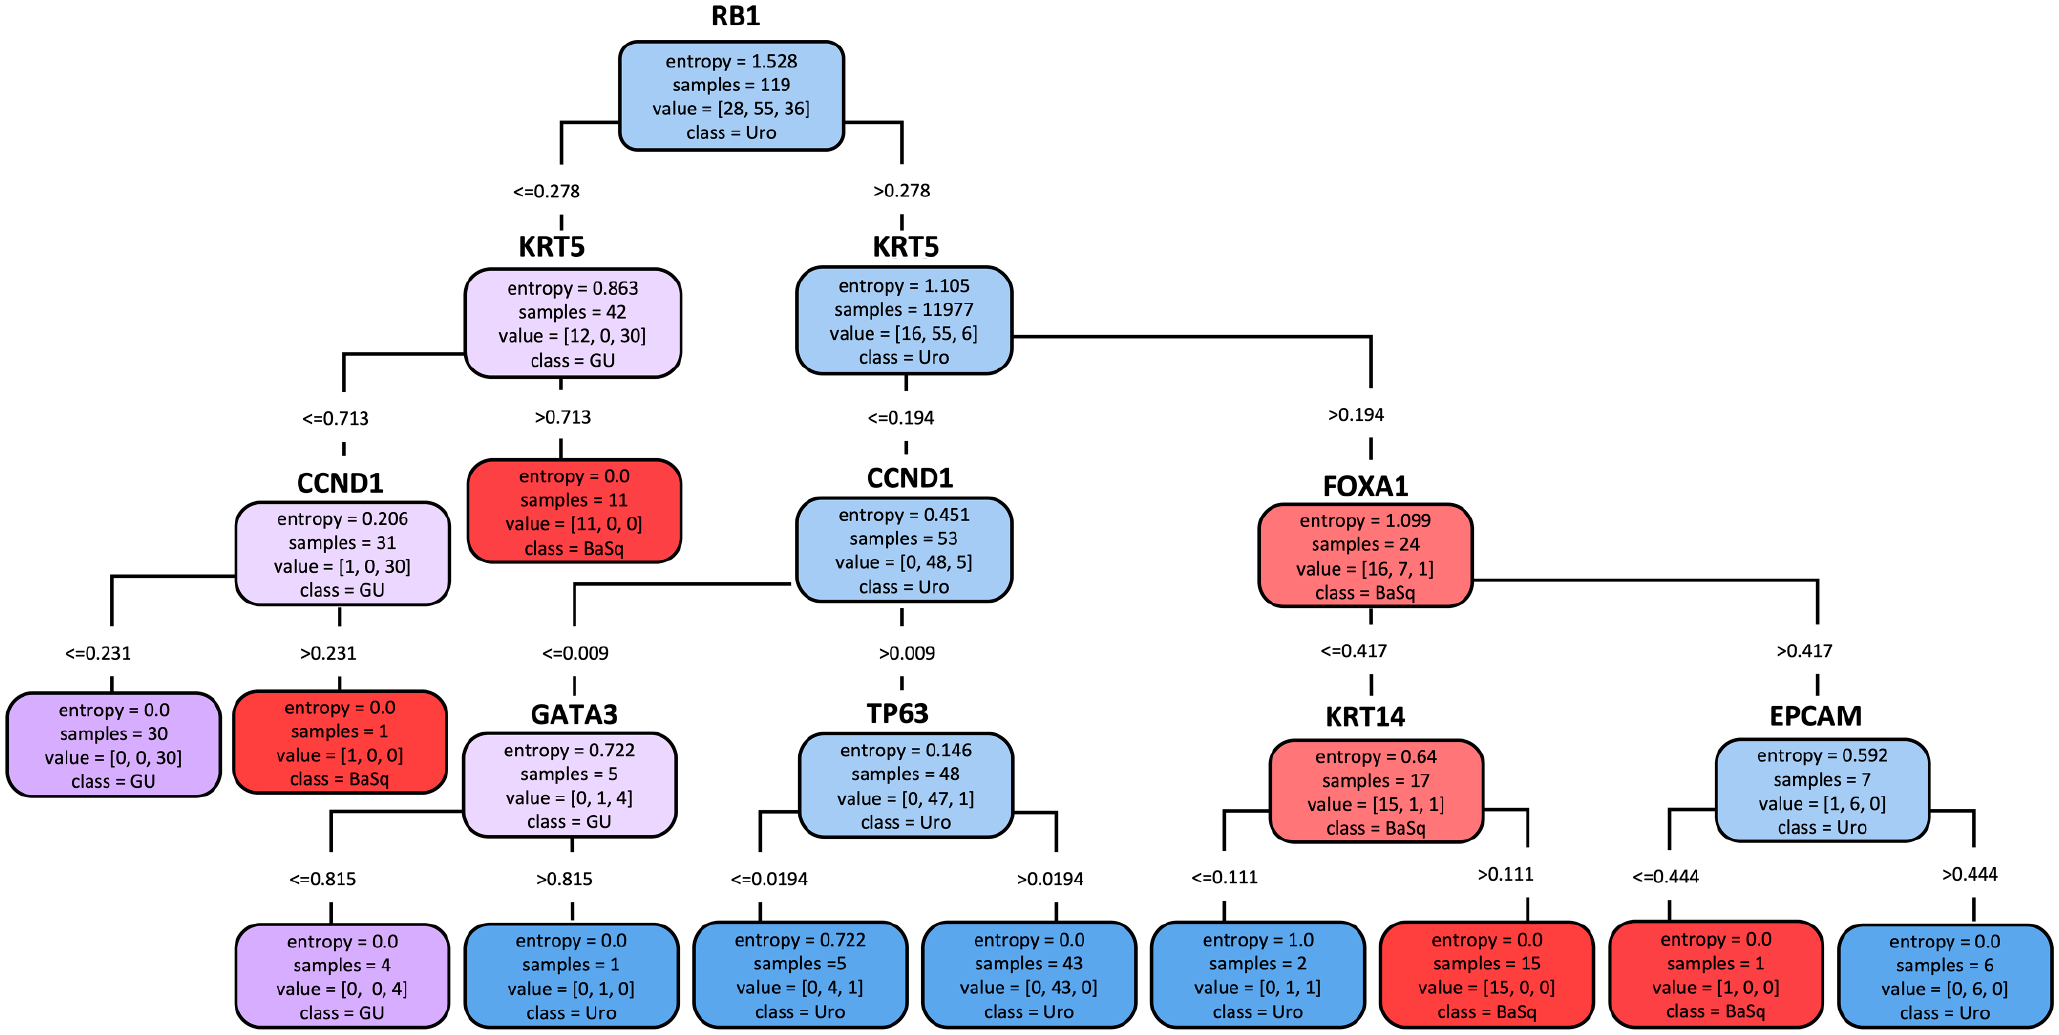
A multiclass decision tree classifier for MIBC subtypes achieves similar accuracy as simplified decision tree models. The model with optimal performance used RB1, CK5, CCND1, FOXA1, GATA3, TP63, KRT14, and EPCAM. Almost all final entropy scores were zero, indicating correct classification. As expected, the model had the greatest difficulty assigning urothelial-like (Uro) and genomically unstable (GU) subtypes in the terminal leaves of the tree, where entropy >0. Abbreviations: CK5, cytokeratin 5; CCND1, cyclin D1; EPCAM, epithelial cell adhesion molecule; FOXA1, forkhead box A1; GATA3, GATA-binding protein 3; KRT14, keratin 14; MIBC, muscle-invasive bladder cancer; RB1, retinoblastoma protein; TP63, tumor protein 63.
Interestingly, this model suggested a top-level division based on RB1 expression, which primarily serves to separate the Uro and GU subtypes. The model further selected CCND1 to distinguish GU tumors from both Uro and basal subtypes. However, CCND1 expression in this model only classified a small number of samples (one GU sample from the basal subset and four GU samples from the Uro subset). Similarly, the incorporation of GATA3 into the model distinguished one GU sample from the Uro subset. TP63 was incorporated into the model because GU tumors show low TP63 expression compared with Uro tumors. These observations indicate that the majority of Uro and GU samples can effectively be discriminated using a top-level division based on RB1 expression, with the third- and fourth-level branches providing little additional value.
Visualizing IHC Staining and the Distributions of Protein Expression Patterns
Distributions of IHC Staining Patterns
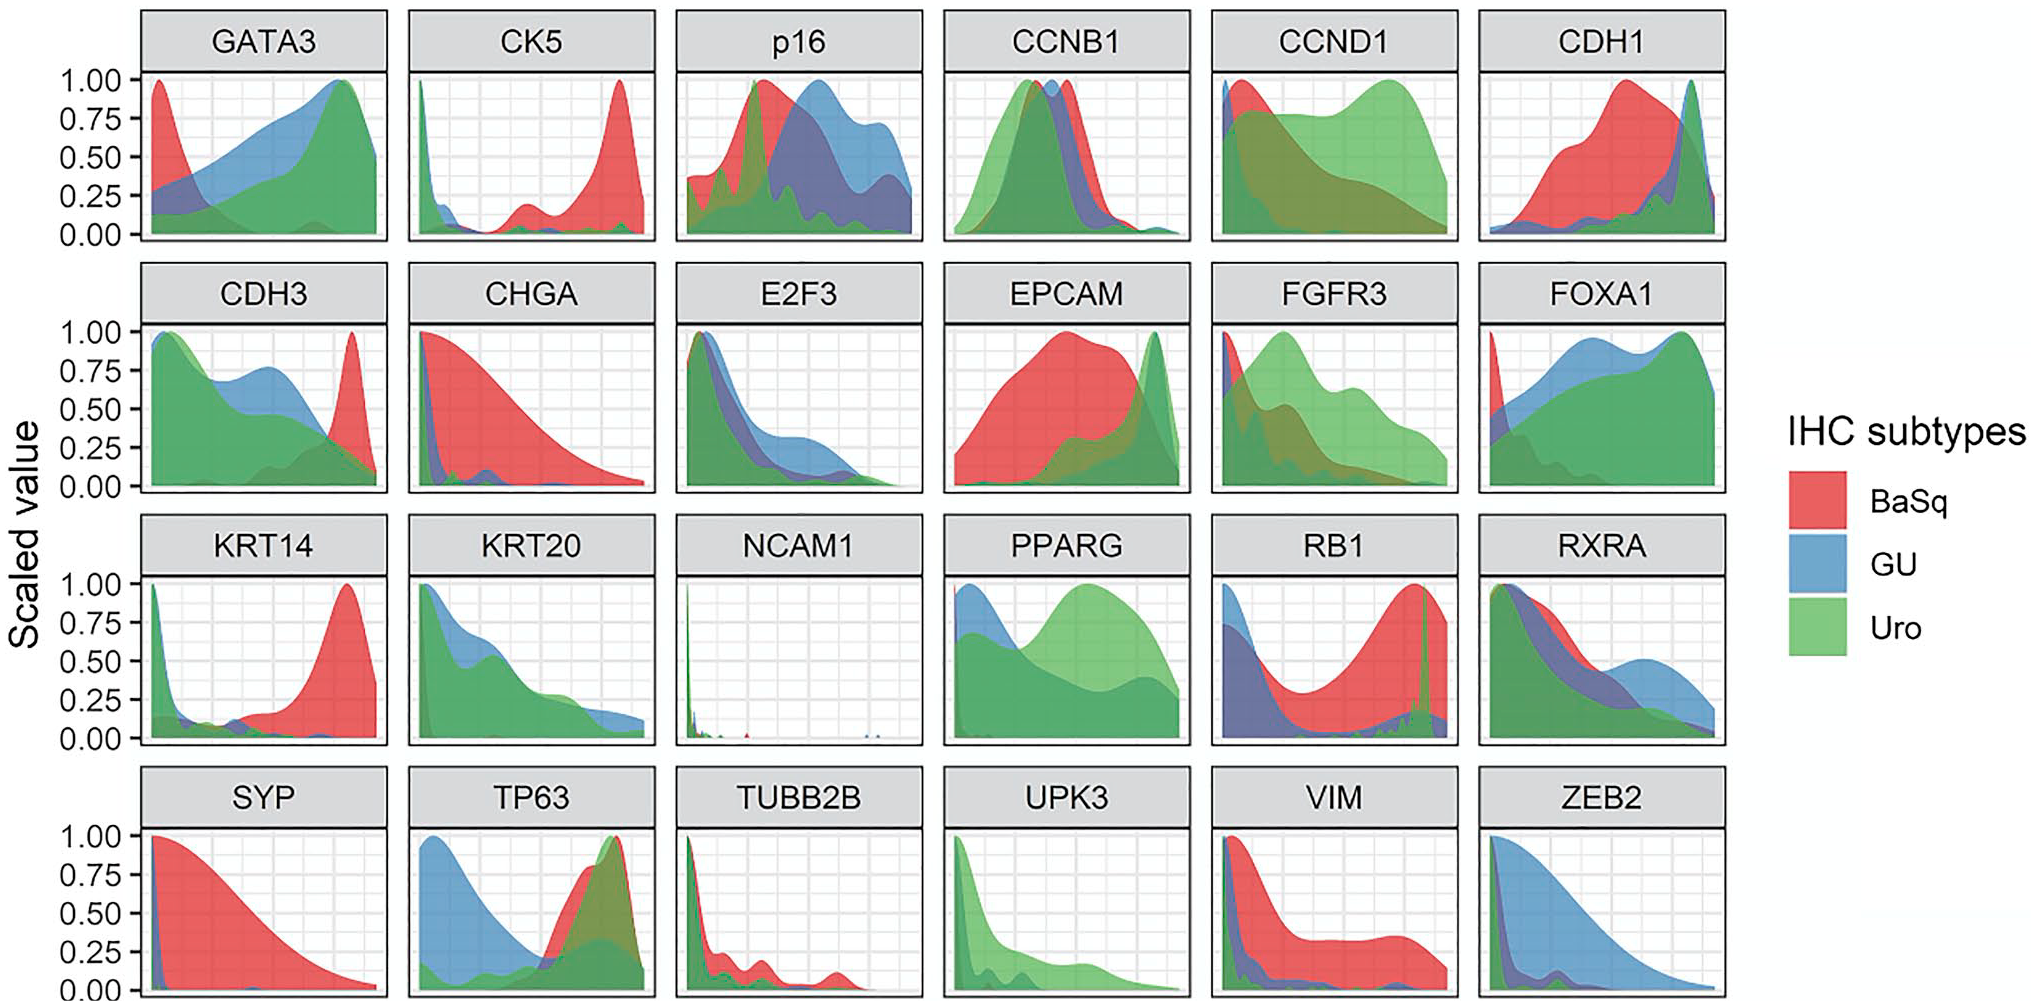
To characterize IHC staining patterns as they are likely to be evaluated during pathological practice, we visually evaluated the expression of key proteins according to subtype (Fig. 6). Nuclear GATA3 staining was typically homogeneous across the cancer cells in each tissue microarray core. However, proteins such as CCND1 and RB1 showed greater heterogeneity, both within a given core and across paired cores for the same sample. Cytoplasmic KRT14 and KRT5 staining remained localized to the basal cell layer for low TCS values (TCS of 0–0.2) and appeared progressively more diffuse and homogeneous with increasing TCS values (Fig. 6). For KRT14, the threshold range (0.64–0.68) indicated that expression beyond 2 to 3 cell layers from the basal epithelium defined the basal subtype from luminal tumors. By contrast, the KRT5 TCS threshold range fell slightly lower (0.09–0.34) and served primarily to separate the basal subtype from the GU subtype. Thus, in the GATA3/KRT5/p16 model, high GATA3 expression defined the Uro subtype, whereas the expression of KRT5 beyond a single cell layer distinguished the basal subtype from GU (Fig. 2B).
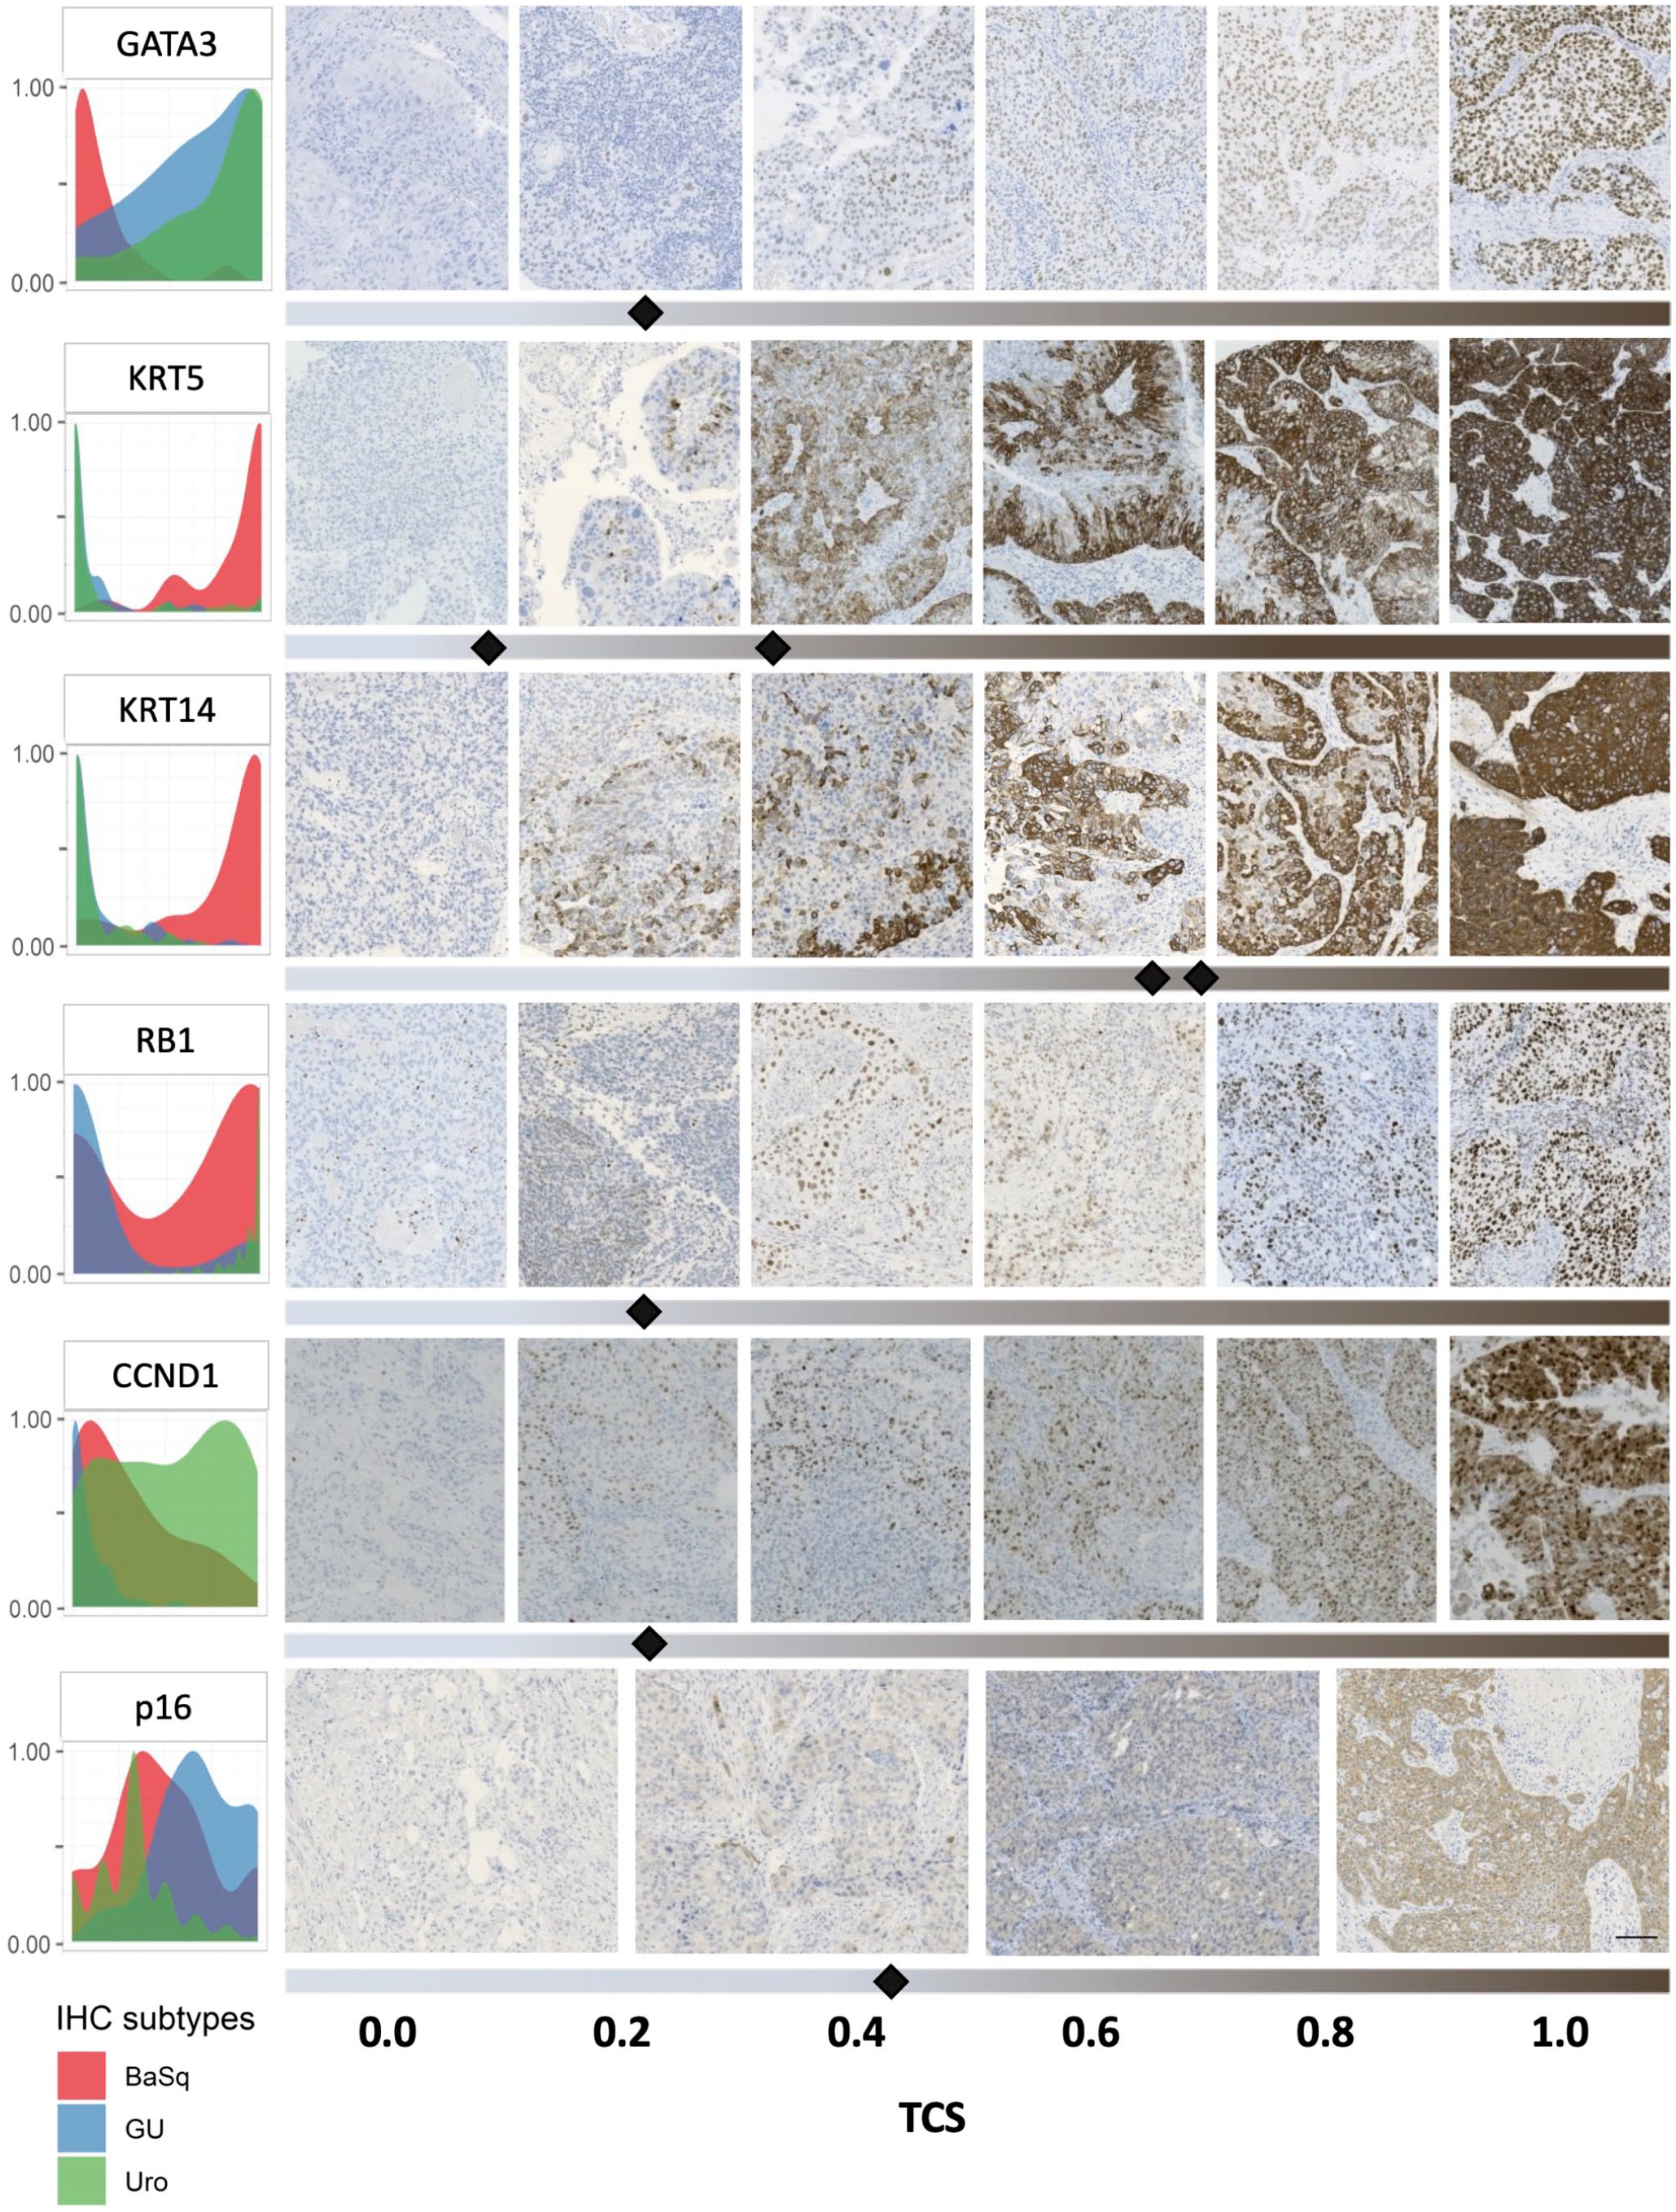
Subtype-specific expression patterns and distributions of key proteins highlight their utility for classifying bladder cancers. Density plots (left) show the expression distributions of key proteins across samples of the basal (BaSq, red), genomically unstable (GU, blue), and urothelial-like (Uro, green) subtypes (right). Visualization of immunohistochemistry (IHC) staining intensities and their respective tumor-cell score (TCS) values. Representative staining for samples below and above the threshold values (indicated by black diamonds) are shown by thresholding bars below IHC images. Multiple diamonds indicate upper and lower limits of threshold ranges. The scale bar is 200 µm.
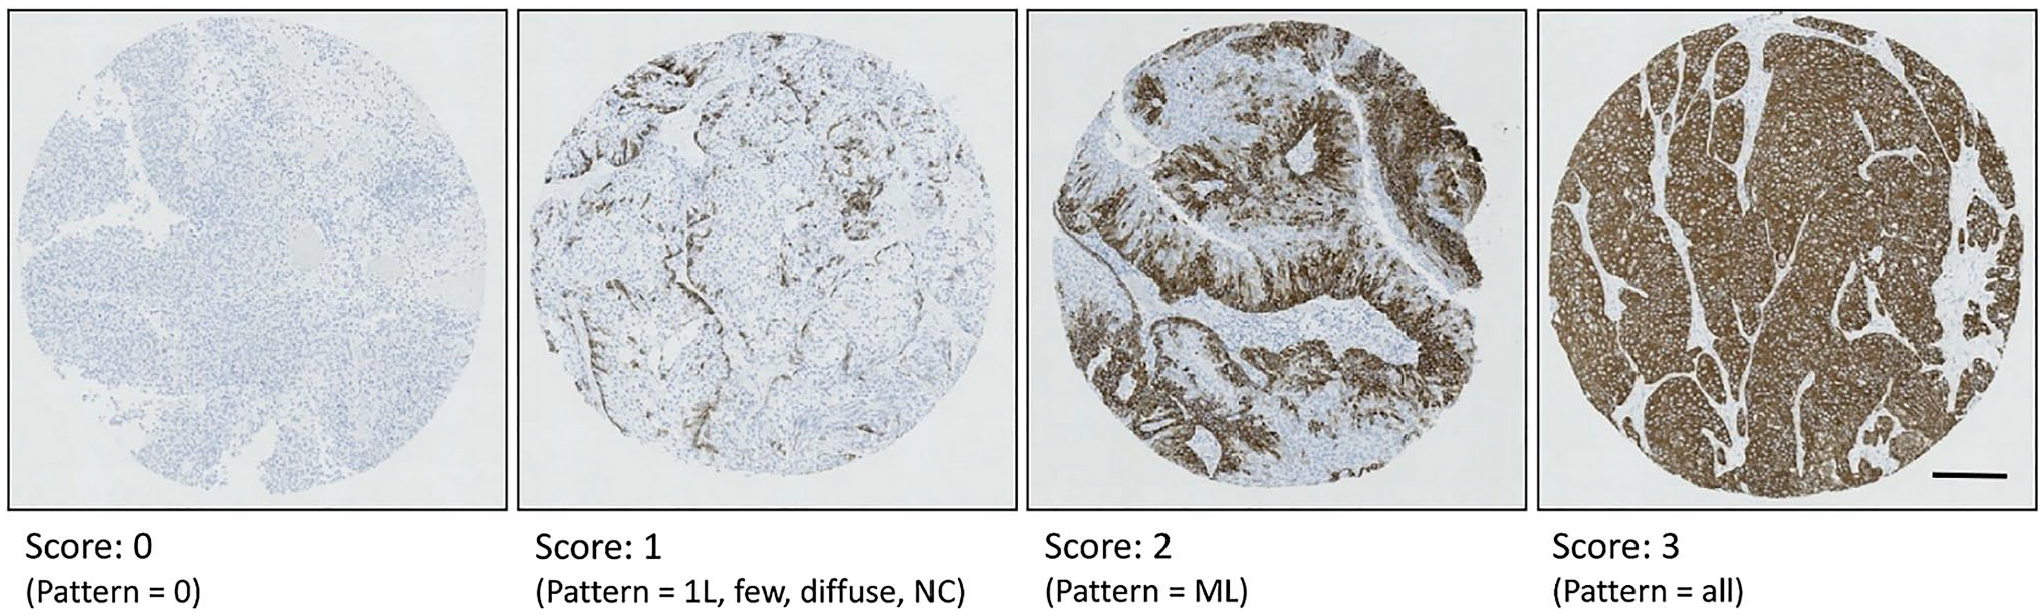
Representative IHC staining patterns for assessment of KRT5. Scores of 0 represent no staining for KRT5. Scores of 1 represent minimal staining of KRT5 where staining is diffuse or localized to the basal cell layer as a single layer (1L) or non- continuous (NC) layer. Scores of 2 represent KRT5 staining that extends from the basal cell layer across multiple layers (ML). Scores of 3 represent homogeneous KRT5 staining across all cell layers. Scale bar represents 200 μm.
Decision tree models using GATA3 and KRT5 identify basal and luminal subtypes across four-fold cross validation with similarly structured trees. Dominant model found in three of four cross validation iterations first uses high GATA3 to identify luminal (LUM) tumours, using a consistent tumour cell score of >0.21. Next, high KRT5 separates basal (BaSq) tumours from a smaller group of luminal tumours with low KRT5 using variable KRT5 thresholds.
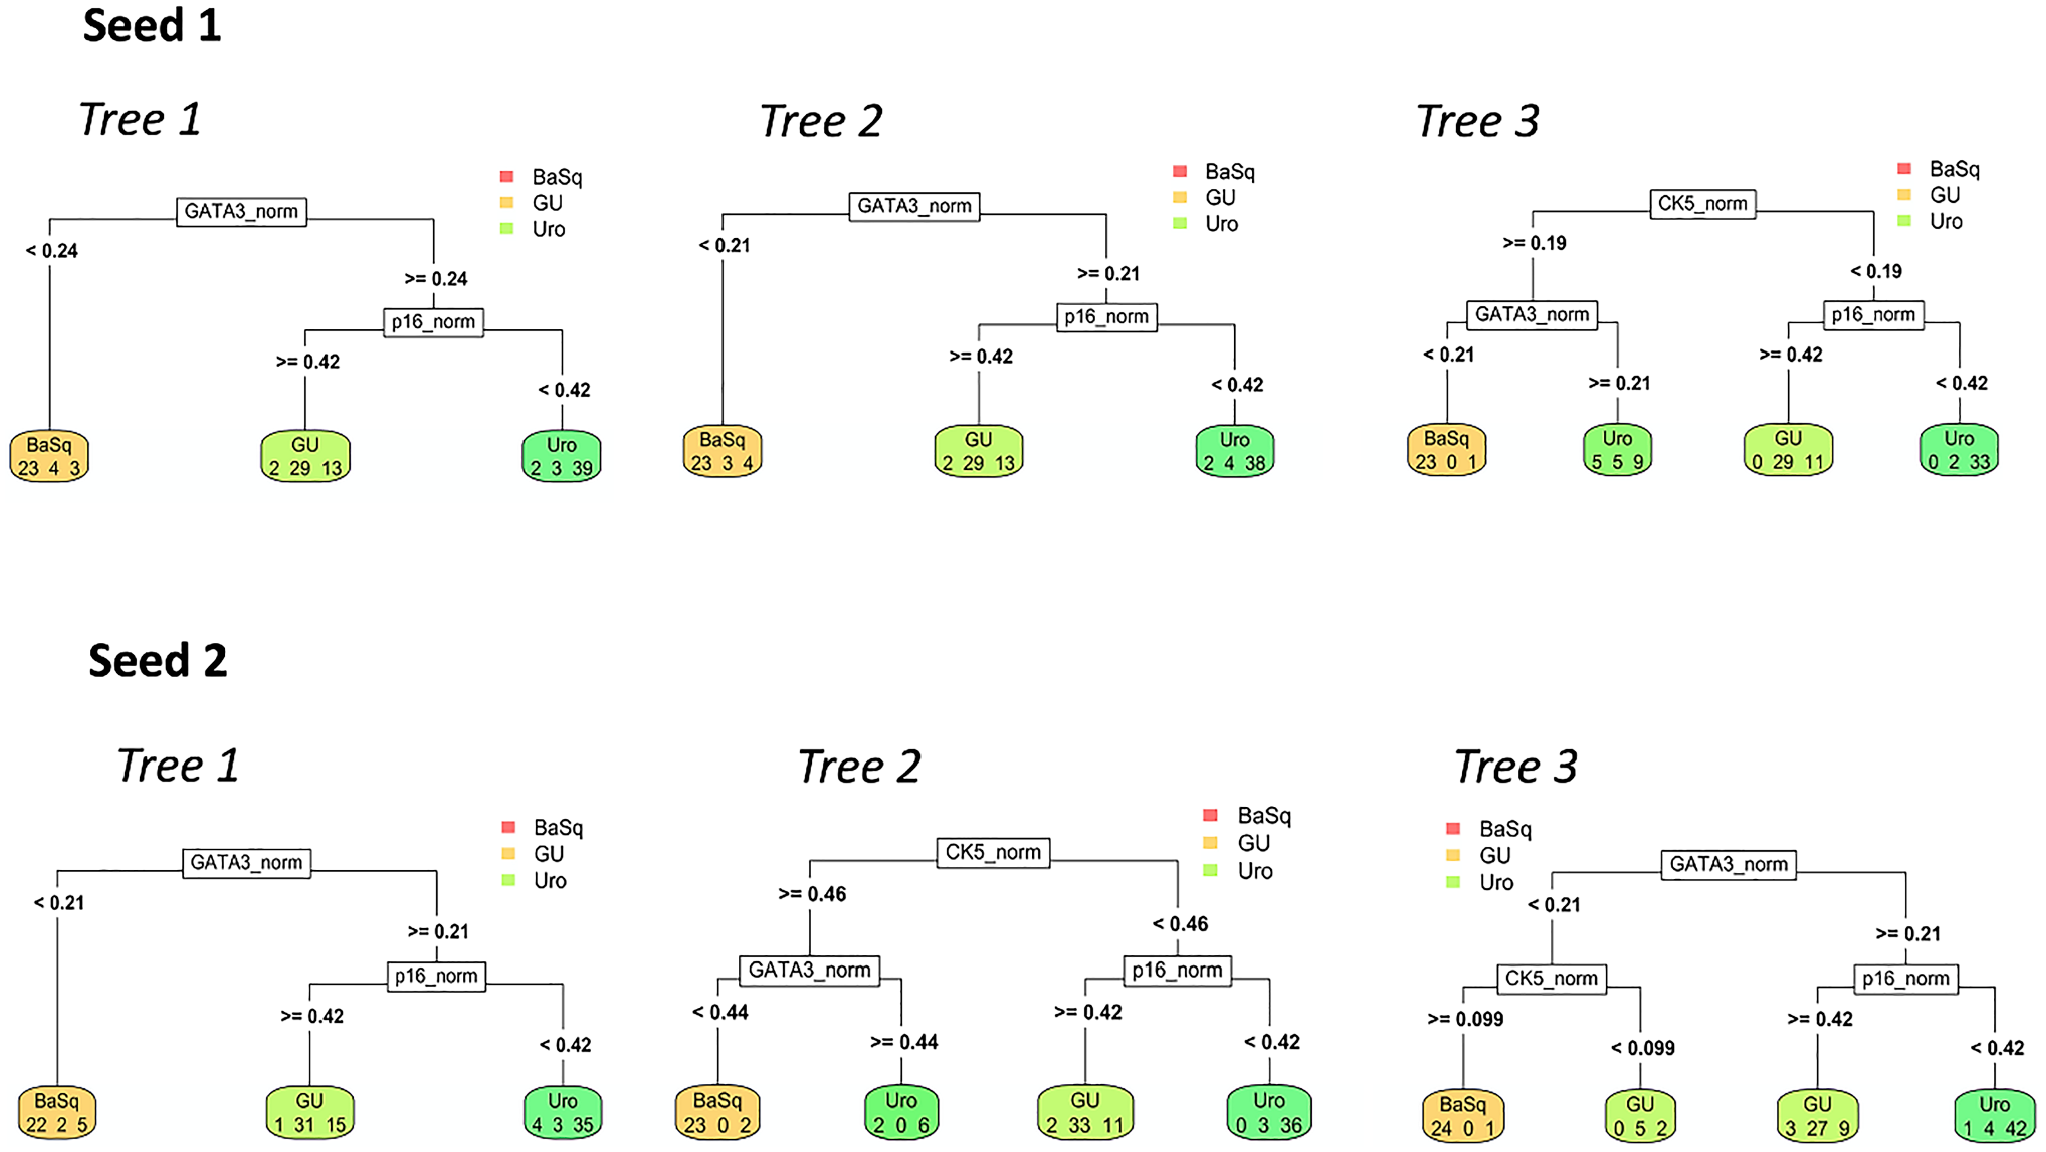
Decision tree models using GATA3, KRT5 and p16 identify Uro, GU and basal subtypes across three-fold cross validation using two random seeds (combinations of samples). Cross-validation methods identified the same tree structure compared to using separate testing (Lund 2017) and validation (Lund 2012) cohorts. This tree structure uses low GATA3 expression (tumour cell score <0.21) to identify basal (BaSq) tumours. High GATA3 expression combined with high p16 expression (tumour cell score >0.42) distinguished genomically unstable (GU) tumours, whereas high GATA3 expression and low p16 expression distinguished urothelial-like (Uro) tumours.
Subtype-specific expression patterns and distributions of additional key proteins highlight their utility for classifying bladder cancers. Density plots show the expression distributions of additional key proteins across tumours of the basal (BaSq, red), genomically unstable (GU, blue), and urothelial-like (Uro, green) subtypes.
Ideal biomarkers selected for clinical use should show clear and subtype-specific differences in expression levels that can be recognized by pathologists without reliance on computerized quantitative analysis. To address these concerns, we visualized the distributions of IHC expression patterns across samples for all subtypes (Fig. 6, Supplemental Fig. 4). For GATA3, KRT14, KRT5, and RB1, this analysis revealed binary expression patterns, indicating a rational threshold for characterizing positive and negative expression patterns (Fig. 6). Markedly different distribution patterns were observed between luminal and basal subtypes for KRT14 and KRT5. Although GATA3 expression was slightly more variable, a clear separation between subtypes could still be distinguished. By contrast, p16 expression patterns showed greater variability, with a wide distribution of patterns across all subtypes and a large number of samples showing intermediate staining. However, p16 staining appears bimodal across luminal subtypes, further supporting the usefulness of p16 for distinguishing Uro from GU tumors. CCND1 also showed a large number of intermediate staining values. Although CCND1 was indicated as a strong predictor of Uro versus GU subtypes, the large degree of overlap in staining intensities for this protein across these two subtypes may limit its utility for distinguishing between them. Interestingly, the thresholds determined during parsimonious model-building broadly correspond with the intersection points of curves in distribution plots (Fig. 6), indicating that the thresholds identified by the decision tree models are robust and represent rational cutoff points for visual assessment by pathologists.
Discussion
In this work, we characterized patterns of IHC protein expression and determined the accuracies of simple and complex decision tree models for classifying the three principal MIBC molecular subtypes. We expanded upon previous literature to identify parsimonious models capable of discriminating two luminal subtypes (Uro and GU) that represent distinct molecular mechanisms of oncogenesis that may affect response to therapy or prognosis.1,7,14,15 This work identified GATA3, KRT5, and p16 as an attractive set of clinically available antibodies, capable of achieving at least 78% accuracy for the identification of Uro, GU, and basal subtypes, with 91% accuracy for luminal/basal classification. Using more limited data, this work further identified a classification model using KRT14 and RB1 that could prove even more efficient and accurate than the model based on GATA3, KRT5, and p16. Importantly, the decision tree–based models presented here were optimized for parsimony, using a stepwise system that recapitulates how pathologists use IHC in clinical practice.
By exploring IHC expression patterns through clustering, correlation, and PCA analyses, we were able to quantify the associations of these IHC features with each other and with IHC-based subtypes, further highlighting the fundamental associations of the 24 previously selected proteins with subtype biology and underlying genomic circuitry1,5– 8 (Fig. 1). As expected, these analyses showed the most similarity between the Uro and GU clusters due to the shared expression of luminal differentiation markers, whereas only a small amount of overlap was observed between the Uro and basal clusters. Several studies have proposed a combination of two to four luminal and basal protein features, such as FOXA1, GATA3, KRT5/6, and KRT14, for bladder cancer subtyping.11 –13 In this work, we showed that the expression patterns of these protein features share a high degree of overlap, suggesting that the use of all of these assays may be redundant for subtype identification. Furthermore, binary ROC analyses demonstrated the comparable accuracies of these proteins for basal/luminal classification. The current work suggests that some of these previously published models may be simplified to a single protein feature or the use of one basal and one luminal protein feature.
GATA3 and KRT5 have specifically been proposed by multiple groups as the best set of features for luminal-basal classification8,9 with more than 90% accuracy. Early work by Dadhania et al. 8 and a more recent study by Guo et al. 9 distilled a large panel of genomic markers and key IHC proteins down to UPK2, KRT20, GATA3, KRT5, and KRT14 as the defining IHC features of basal and luminal subtypes. 9 IHC evaluation on whole slides revealed that GATA3, KRT14, and KRT5 showed the most consistent staining patterns. Further logistic regression analyses determined GATA3 and KRT5 as the best pair of protein features, with robust and reproducible staining patterns.8,9 However, these previous studies used IHC expression to classify mRNA subtypes, not IHC subtypes. Despite differences in subtype labeling and classifier building, we arrived at a similar conclusion with respect to the accuracy of a model using only GATA3 and KRT5, complementing prior work and highlighting the robustness of these markers for classification purposes. Importantly, we also observed similar patterns of homogeneous GATA3 and KRT5 staining within and between samples from the same patient. Although we were unable to compare this expression with staining patterns at the whole slide level, the work by Guo et al. demonstrated concordance of subtype and staining patterns between tissue microarrays and whole slides.
Although several studies have explored the use of simple IHC assays for basal and luminal subtyping, to our knowledge, few studies have sought to identify the GU subtype, which represents both a biologically and clinically distinct luminal group. In models that aimed to identify basal, Uro, and GU subtypes, the model using GATA3, KRT5, and p16 achieved 78% accuracy, whereas the model using only KRT14 and RB1 achieved approximately 85% accuracy. Although the findings using the models based on KRT14 and RB1 are preliminary, they indicate that these two proteins may provide a simpler and more accurate classification result. The multiclass model also suggested the use of RB1 to distinguish GU from Uro tumors, in agreement with the protein rankings based on ROC analysis and the simplified model (Fig. 5). These findings support the utility of using RB1 to identify GU tumors, with CCND1 and TP63 identified as potential validation stains for the GU subtype.
The NE-like and Mes-like subtypes appear to demonstrate low expression of luminal and basal markers, as well as RB1, which might favor the use of the GATA3/KRT5/p16 classification system over the KRT14/RB1 classification, as the former would be more likely to correctly distinguish GATA3−/KRT5− mesenchymal tumors from their GATA3+/KRT5− counterparts. As proposed previously, 10 the pathologist should be able to recognize NE-like and Mes-like variant histology by the presence of sarcomatous or neuroendocrine differentiation, allowing the subtyping of these rare tumors to be confirmed using traditional IHC and morphological assessment methods rather than the proposed algorithms. Additional studies in populations highly enriched for rare subtypes remain necessary to validate this approach. The classifiers developed here were designed for use in subtyping typical urothelial carcinomas, which comprise more than 90% of primary MIBCs in most published series. 10
The use of KRT14 as a univariate luminal/basal classifier is supported by biological evidence that KRT14 is a defining feature of the least differentiated stem cell–like basal cells of benign bladder urothelium, preceding the expression of KRT5 and KRT20, which are found in intermediate and differentiated umbrella cells, respectively. 30 Previous work identified three differentiation states in urothelial carcinoma, defined as basal (KRT14+, KRT5+, KRT20−), intermediate (KRT14−, KRT5+, KRT20−), and differentiated (KRT14−, KRT5−, KRT20+). 30 Thus, KRT5 can be used to identify both intermediate and basal cell differentiation, whereas KRT14 is specific for basal cell differentiation.
Although this work suggests that KRT14 and RB1 can serve as useful protein features for subtype identification, the accessibility and reproducibility of these assays across clinical centers may pose a barrier to implementation. For the initial model we developed, we selected GATA3, KRT5, and p16 because they represent key IHC features with assays that are widely available in clinical laboratories. In a sampling of clinically oriented pathology publications, RB1 and KRT14 were found to be less popular IHC targets and, therefore, might be less widely available (Supplemental Table 1).
Aside from the widespread availability of these antibodies, another trade-off emerged between accuracy and simplicity. The multiclass model that included the expression of eight proteins (Fig. 4) achieved 82% to 86% accuracy, which was a slight improvement over the GATA3 and KRT5 model (Fig. 2) and approximately equivalent to the model using KRT14 and RB1 (Fig. 3). Although the inclusion of additional IHC features may be beneficial for clarifying subtypes, the multiclass decision tree classifier was also much more complex, providing more opportunities for error. In addition, this classifier requires the use of too many antibodies to be easily implemented while providing only negligible improvements in theoretical accuracy.
We describe algorithms using routinely available antibodies which have been validated and optimized across centers as these are less vulnerable to variations in staining. However, it is important to note that such assays may require subsequent optimization according to the use of different antibody clones and that staining intensity thresholds may be sensitive to these and other changes. For example, the p16 assay used in the studies analyzed here showed a lower dynamic range than an assay used in subsequent work. 31 Thus, implementing this classifier will require normalizing differences in dynamic range between assays and centers, including necessary control tissues.
Additional studies will be necessary to validate the accuracies of the identified models and to investigate the utility of the identified cutoff values as visually assessable thresholds. In this work, we elaborate on specific numeric cutoff points to explore and visually represent the expression patterns of various proteins. Although the scoring system used here requires several steps and the provided thresholds would require validation, the simple binary expression patterns demonstrated by key markers suggests that these could easily be translated into a binary system feasible for pathology practice. Guo et al. demonstrated that such a system is possible using GATA3 and KRT5 expression. Furthermore, they showed that the translation of this work from tissue microarray to whole slides is highly concordant and represents a clinically feasible method of IHC staining assessment. We worked with previously assessed IHC expression data obtained from tissue microarrays, but ultimately, the assessment of whole slides will be required to identify the impacts of intratumoral heterogeneity on the ability of the suggested algorithms to reliably identify these expression patterns.
The existence of molecular subtypes in bladder cancer is well established1 –6 and signifies distinctive pathways for bladder carcinogenesis and progression. However, the clinical utility of molecular subtyping in general, and for the Lund Taxonomy specifically, varies across studies and therefore is in equipoise. Challenges in resolving this controversy include variable approaches to assembling research cohorts, inconsistent subtyping schemes, and lack of easily implementable assays. In concordance with previous work exclusively using these data,7,32 we found no significant differences in survival between subtypes. However, other work with larger and more heterogeneous cohorts has found prognostic and predictive associations for the Lund taxonomy. 2 –8,18– 24 Importantly, additional work using GATA3, KRT5, and p16 IHC to identify Uro, GU, and basal subtypes found significant differences in disease-specific survival between the basal and Uro subtypes, suggesting the potential clinical utility of a three-antibody assay. 33 Critical to future investigations is the validation of a robust and efficient assay such as the IHC-based classification models described here.
The limitations of this work include the relatively small number of samples assessed, particularly after separating the samples into training and validation sets. Although the clinical actionability of transcriptomic subtypes has been investigated, these models must be explored specifically with respect to the clinical actionability of IHC subtypes. However, the simplicity of these IHC-based models compared with the complexity of transcriptomic profiling provides opportunities for accelerating subtyping approaches in both research and clinical practice. Although this study was restricted to the MIBC setting, the provided datasets also included non-muscle-invasive bladder cancers (NMIBCs), although an insufficient number of samples were available for building separate models. Future work should assess the similarity of constructed models for subtyping classification in the NMIBC setting.
Altogether, this work clarifies the utility of GATA3, KRT5, and p16 IHC for identifying Uro, GU, and basal subtypes, which are variably associated with distinct biological, predictive, and prognostic phenotypes and together comprise the vast majority of MIBCs. We showed that a simple immunohistochemical decision tree classifier designed to distinguish among these subtypes achieved approximately 78% accuracy in the identification of basal/Uro/GU subtypes, with >90% accuracy for distinguishing basal/luminal subtypes. Although the depth of a transcriptomic classification method may ultimately provide more comprehensive information, transcriptomics is expensive, laborious, challenged by variation in tumor-cell content between samples. With single cell resolution and a faster and far less expensive workflow, a surrogate IHC classifier may serve as an effective strategy that can accelerate subtyping research, and if appropriate, be more readily implemented in clinical practice.
Supplemental Material
sj-docx-1-jhc-10.1369_00221554221095530 – Supplemental material for Immunohistochemical Assays for Bladder Cancer Molecular Subtyping: Optimizing Parsimony and Performance of Lund Taxonomy Classifiers
Supplemental material, sj-docx-1-jhc-10.1369_00221554221095530 for Immunohistochemical Assays for Bladder Cancer Molecular Subtyping: Optimizing Parsimony and Performance of Lund Taxonomy Classifiers by Céline S.C. Hardy, Hamid Ghaedi, Ava Slotman, Gottfrid Sjödahl, Robert J. Gooding, David M. Berman and Chelsea L. Jackson in Journal of Histochemistry & Cytochemistry
Footnotes
Competing Interests
The author(s) declared no potential conflicts of interest with respect to the research, authorship, and/or publication of this article.
Author Contributions
CLJ and DMB conceived the study. CSCH, HG, and CLJ wrote the manuscript. CLJ, HG, and AS analyzed the data. CLJ, HG, and AS generated the figures. GS collected the original data and conceived the IHC-based profiling methods described in this study. RJG contributed to the bioinformatic analyses presented in ![]() to 3. All authors edited the manuscript and approved the final version submitted for publication.
to 3. All authors edited the manuscript and approved the final version submitted for publication.
Funding
The author(s) disclosed receipt of the following financial support for the research, authorship, and/or publication of this article: This study was conducted with the support of the Ontario Institute for Cancer Research through funding provided by the Government of Ontario (D.M.B.). Additional support was provided by the Cancer Research Society and Bladder Cancer Canada through the Operating Grant Funding Program (D.M.B.) and the Swedish Cancer Society (G.S.).
References
Supplementary Material
Please find the following supplemental material available below.
For Open Access articles published under a Creative Commons License, all supplemental material carries the same license as the article it is associated with.
For non-Open Access articles published, all supplemental material carries a non-exclusive license, and permission requests for re-use of supplemental material or any part of supplemental material shall be sent directly to the copyright owner as specified in the copyright notice associated with the article.