
Abstract
The tight junction membrane protein claudin 1 and the adherens junction protein E-cadherin play critical roles in cell–cell communication and in cell signaling. As a result, their protein levels and distribution in cancer have been a focus of cancer researchers in recent years. The loss of sensitivity to contact inhibition and the establishment of invasive properties in cancer are thought to be a result of the mislocalization of these membrane proteins to the cytoplasm. However, reports on their distribution and levels have been inconsistent. It is therefore critical that the techniques used to determine the cellular localization of these proteins be both consistent and reliable. This study was undertaken to determine the optimal fixation method, methanol or formalin, for the detection of claudin 1 and E-cadherin by immunofluorescence in five different human breast cancer cell lines. Both methods exhibited staining of the cell membrane and cytoplasm, but the strongest and most distinct signals were obtained using methanol fixation. Interestingly, cell-specific differences were also observed that appeared to be associated with levels of claudin 1 and E-cadherin as seen by Western blotting. Therefore, when evaluating cellular localization of the junction proteins claudin 1 and E-cadherin, expression level and cell type differences must be considered:
Keywords
Introduction
Members of the claudin and cadherin families are essential components of the tight and adherens junctions of epithelial cells, respectively. 1 The “loosening” of these intercellular junctions contributes to the mechanisms underlying tumor development. 2 Although the majority of invasive breast cancers display reduced levels of claudin 1, 3 elevated levels are seen in the luminal-like human breast cancer cell line, MCF-7, and in some aggressive breast cancers of the basal-like molecular subtype.4,5 Also, in addition to its membrane location, claudin 1 has been detected in the cytoplasm of specific tumor cells or under certain conditions,6–8 suggesting that both level of expression and location are important with regard to functionality.
Epithelial cadherin (E-cadherin) has been shown to directly contribute to the maintenance of the epithelial cell phenotype with a downregulation seen during epithelial to mesenchymal transition (EMT), a process reported to drive cancer invasion and metastasis. 9 As with claudin 1, alternate cellular locations for E-cadherin have been described, hinting at potential roles in the cytoplasm or nucleus.10,11
In addition, collaborative interactions between tight and adherens junctions are proposed in basal-like breast cancer subtype 7 where the downregulation of E-cadherin is associated with claudin 1 overexpression.
As both downregulation and upregulation of claudin 1 and E-cadherin expression in breast cancer progression have been reported,4,9,12,13 knowing the exact localization of these proteins is essential, as their cellular distribution can influence their specific roles within the cell. Therefore, it is critical that this localization is not the result of artifacts due to techniques used for their detection. Although Western blotting and immunofluorescence both assess the levels of these proteins, 14 immunofluorescence allows their localization to specific cellular compartments. As fixation is the first step in the immunofluorescence protocol, it is important that both cellular architecture and antigen accessibility are preserved. For these reasons, we have compared the suitability of two fixation methods, using methanol or formalin, to detect claudin 1 and E-cadherin by immunofluorescence in different human breast cancer cell lines.
Materials and Methods
Cell Lines
The breast epithelial cell line (MCF-10A1) and human breast cancer cell lines (T47D, MDA-MB-468, MCF-7, MDA-MB-231, and BT-20) were all obtained from ATCC (Manassas, VA). The canine kidney cell line MDCK-II and the cervical cancer cell line Hela were also obtained from ATCC and used as positive and negative controls, respectively. MDA-MB-231 and BT-20 were cultured in Eagle’s Minimum Essential Medium (Lonza Inc; Basel, Switzerland) with 10% fetal bovine serum (FBS) and supplemented with 50 U/ml penicillin, 50 mg/ml streptomycin, and 1 mM pyruvate (all purchased from Hyclone Laboratories Inc.; Logan, UT). All other cell lines were maintained in high glucose Dulbecco’s Modified Eagle’s Medium supplemented with 10% FBS, 1% glutamine and 1% penicillin/streptomycin, and 10 μg/ml bovine insulin (Sigma-Aldrich; St Louis, MO). All cells were grown in a humidified incubator maintained at 37°C and 5% CO2 saturation.
Western Blot Analysis
Cells grown in T25 culture flasks were lysed in 400 µl hot 1× sodium dodecyl sulfate (SDS) loading buffer (50 mM Tris HCl, pH 6.8, 100 mM DTT, 2% SDS, 0.1% bromophenol blue, and 10% glycerol). Samples were boiled for 10 min, and sonicated and centrifuged at 10,000g for 10 min at room temperature. The supernatants were transferred to new tubes and subsequently used for Western blot analysis. Samples were electrophoresed in 10% SDS PAGE for E-cadherin and 15% SDS PAGE for claudin 1 and human glyceraldehyde 3-phosphate dehydrogenase (GAPDH). The separated proteins were transferred to nitrocellulose membranes and blocked with 2.5% milk in tris-buffered saline (TBS) for 60 min at room temperature before adding the primary antibodies (see Table 1) in 2.5% milk TBS and incubated at 4°C overnight. The membranes were subsequently washed (3 × 5 min) in TBS containing 0.1% Tween-20 (TBS-T) at room temperature and then incubated with the secondary antibodies in 2.5% milk TBS at 1:2500 dilution for 1 hr at room temperature. The membranes were then washed with TBS-T (3 × 5 minutes), developed with Immobilon chemiluminescence substrate (Millipore Corporation; Burlington, MA), and imaged using a C-digit blot scanner (LI-COR; Lincoln, NE).
List of Antibodies.
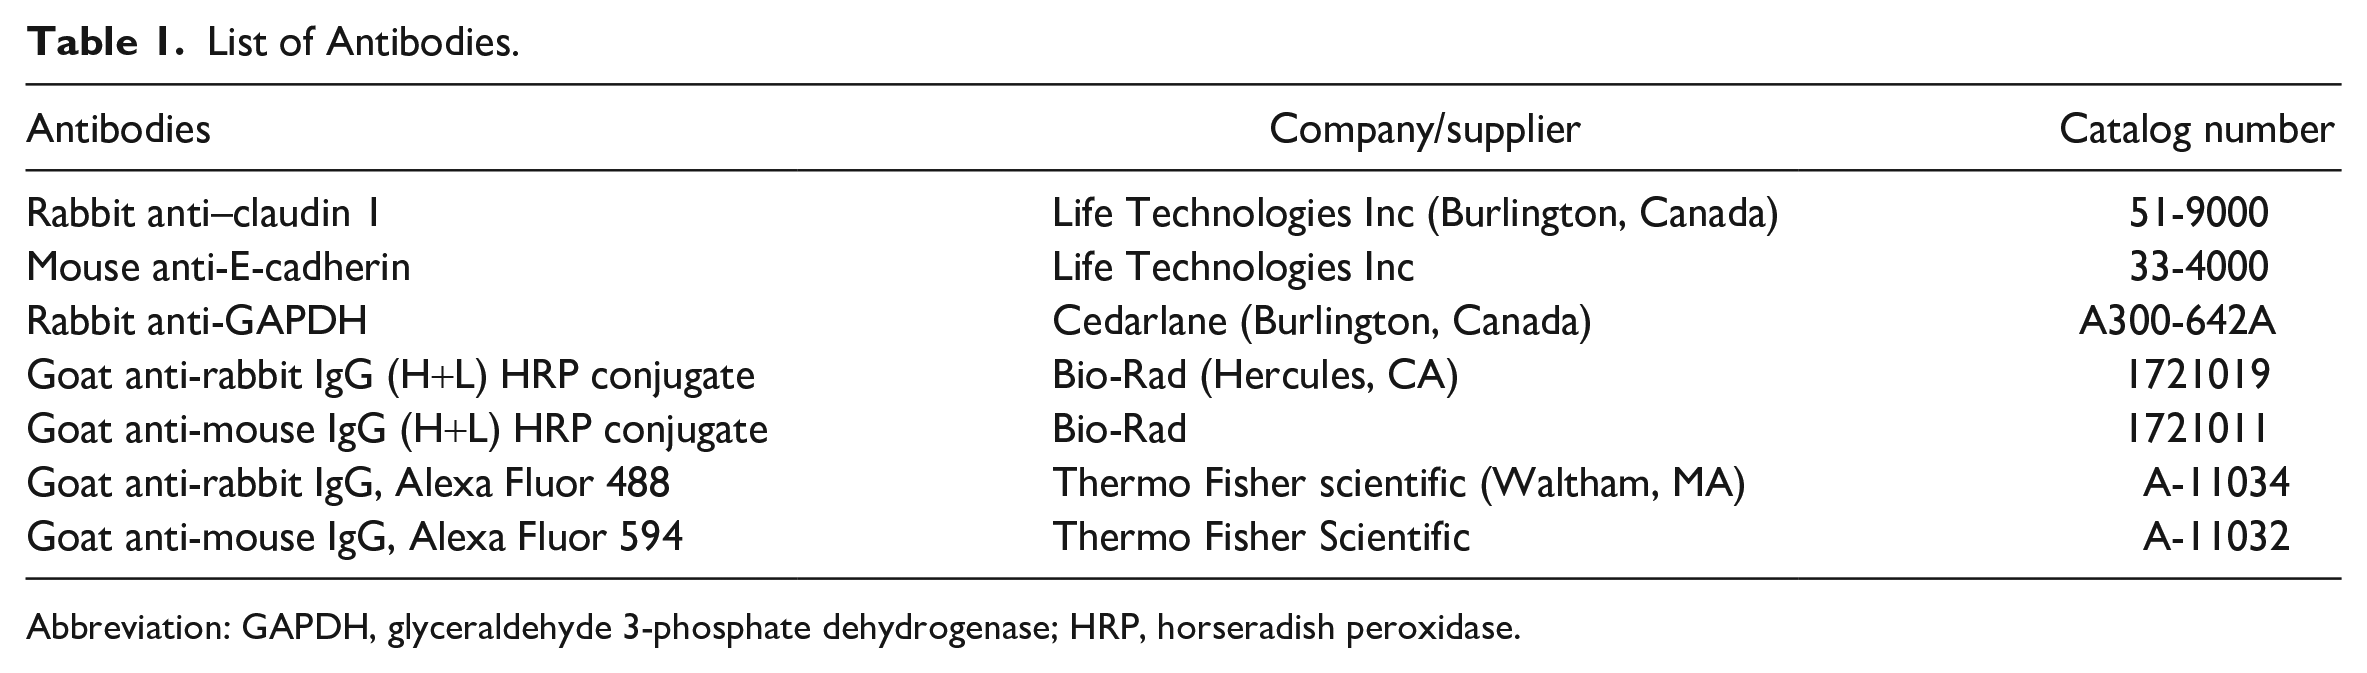
Abbreviation: GAPDH, glyceraldehyde 3-phosphate dehydrogenase; HRP, horseradish peroxidase.
Immunofluorescence Microscopy
Methanol and Formaldehyde Fixation
Cells were grown on coverslips for 48 hr and fixed with either methanol or formaldehyde.
Coverslips were fixed with ice-cold 100% methanol for 15 min and washed (3 × 5 min) with 1× phosphate-buffered saline (PBS). The cells were then permeabilized with 0.2% Triton-X in PBS for 5 min at room temperature, washed once with 1× PBS, and blocked with 1% bovine serum albumin (BSA) in PBS for 60 min at room temperature.
Alternatively, coverslips were fixed with 4% formaldehyde for 15 min and washed (3 × 5 min) with 1× PBS. The cells were then permeabilized with 0.5% Triton-X in PBS for 5 min at room temperature, washed once with PBS, and blocked with 5% milk in PBS for 60 min at room temperature.
Immunodetection
Coverslips were incubated overnight with primary antibodies: mouse anti-E-cadherin and rabbit anti-claudin 1 (1:100 dilution for both antibodies in 1% BSA in PBS) at 4C in a humid chamber. The coverslips were washed (3 × 5 min) with PBS and incubated with secondary antibodies (anti-rabbit conjugated with Alexa-Fluor 488 and anti-mouse conjugated with Alexa-Fluor 594) diluted 1:750 in 1% BSA in PBS, for an hour at room temperature. Subsequently, the cover slips were washed (3 × 5 min) in PBS. 4′,6-diamidino-2-phenylindole (100 ng/ml PBS) was used to stain the cell nucleus for 90 sec and then washed once with PBS. The cover slips were mounted on slides using FluorSave (Calbiochem; Billerica, MA). Images were acquired with the Zeiss LSM 710 Confocal Laser microscope and analyzed using the Zen Software (Black Edition).
Results
Western Blot Analysis of Claudin 1 and E-Cadherin
Western blot analysis was used to establish the levels of claudin 1 and E-cadherin in multiple breast cancer cell lines (T47D, MDA-MB-468, MCF-7, MDA-MB-231, BT-20) and MCF-10A1. In addition, MDCK-II and Hela cells were used as positive and negative controls, respectively (Fig. 1). Strong signals corresponding to claudin 1 were detected in MCF-10A1, T47D, MDA-MB-468, and BT-20. A modest, but detectable signal was seen in MCF-7, whereas MDA-MB-231 breast cancer cells did not express claudin 1 at a detectable level. Similarly, all breast cell lines except MDA-MB-231 expressed robust levels of E-cadherin (Fig.1).
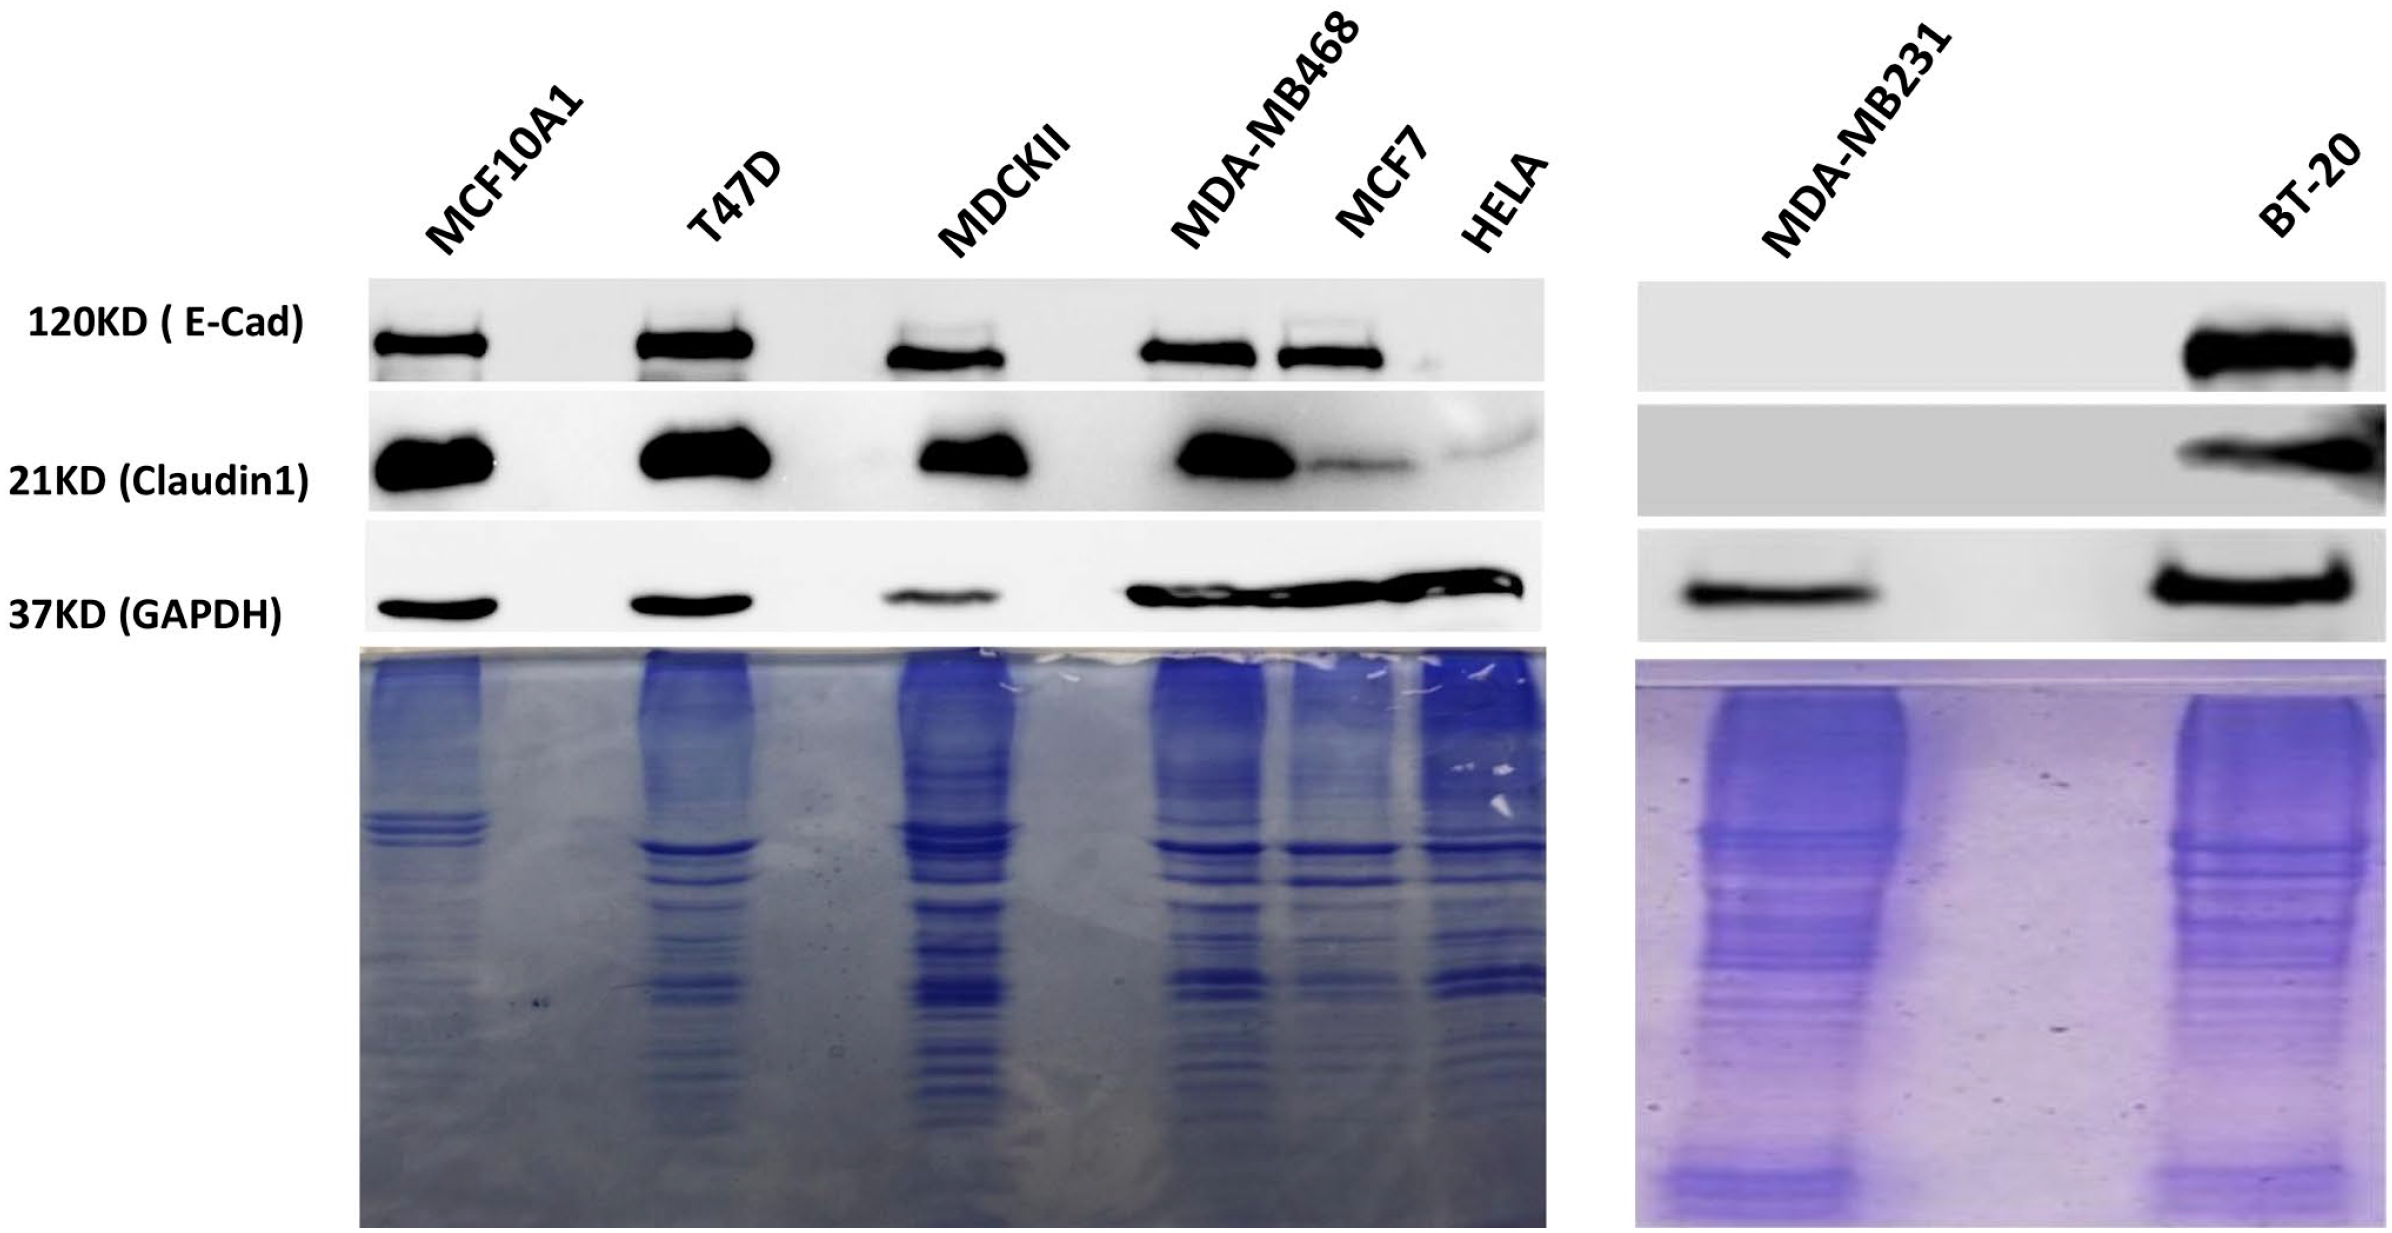
Detection of E-cadherin and claudin 1 in different cell types by Western blot analysis: The cells ( MCF-10A1, T47D, MDCKII, MDA-MB-468, MCF-7, Hela, MDA-MB-231, and BT-20 cells) were lysed and subjected to Western blot analysis using antibodies against E-cadherin and claudin 1. Human GAPDH was used as loading control. In addition, the Coomassie gels are shown to demonstrate equal loading of samples. Abbreviation: GAPDH, glyceraldehyde 3-phosphate dehydrogenase.
Methanol Fixation Resulted in Stronger Immunofluorescence Signals for Claudin-1 and E-Cadherin Compared With Formaldehyde Fixation in Human Breast Cancer Cell Lines
Immunofluorescence microscopy was used to compare the expression and cellular localization of claudin 1 and E-cadherin in the breast cancer cells following either methanol or formaldehyde fixation before immunostaining. Immunofluorescence images of the methanol fixed cells exhibited very strong and consistent signals for both claudin 1 and E-cadherin on the surface of all cells except Hela and MDA-MB-231 (Fig. 2). This corroborates the results observed by Western blotting. However, when formaldehyde was used for fixation, the signal appeared to be mostly nonspecific cytoplasmic and nuclear fluorescence, except for the nontumorigenic epithelial cell line, MCF-10A1 (Fig. 3). These weak and inconsistent signals were observed in all other breast cancer cell lines assessed in this study.
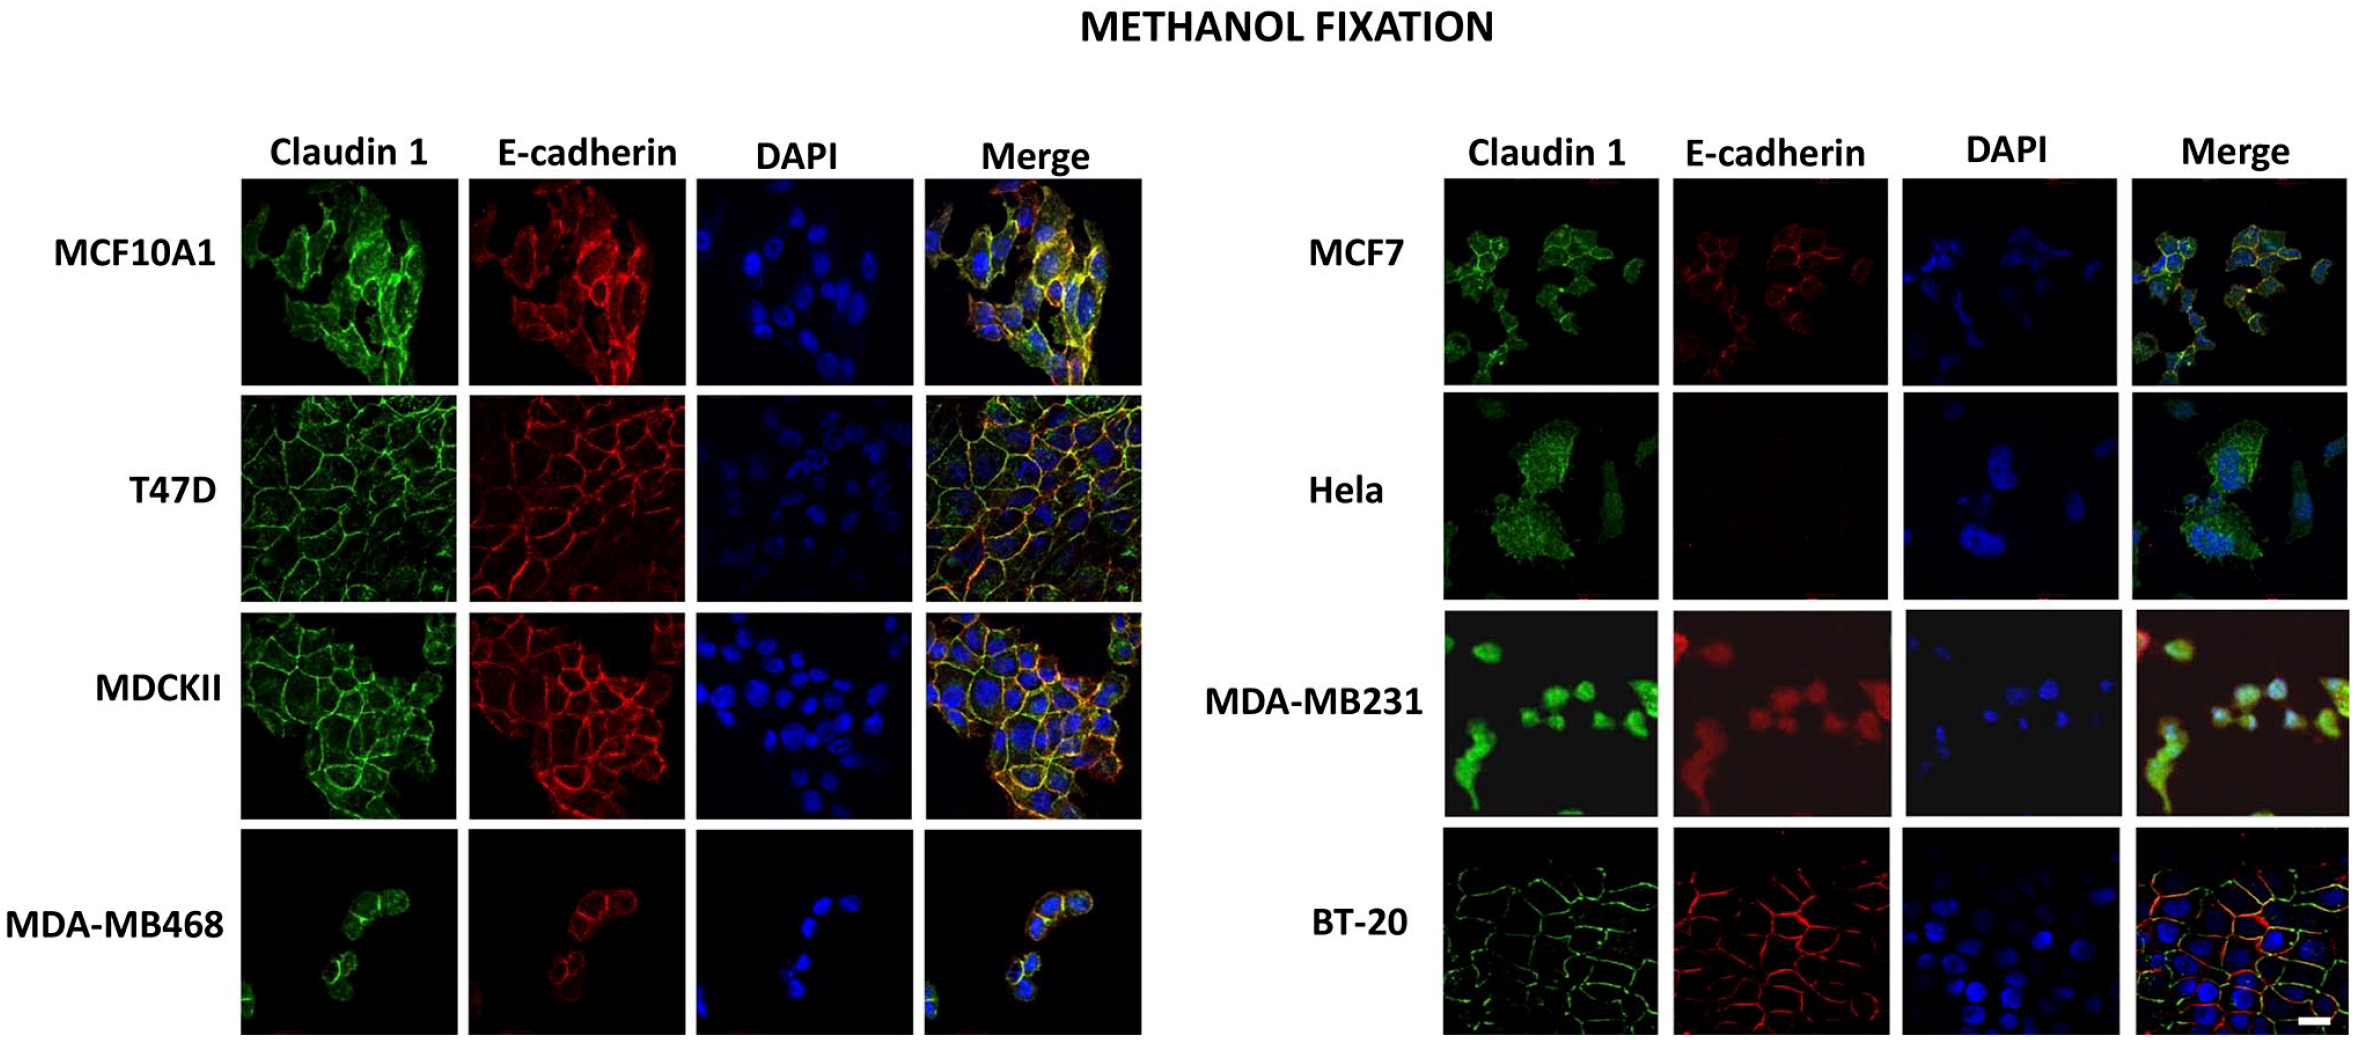
Immunofluorescent detection of E-cadherin and claudin 1 in different cell lines following methanol fixation: MCF-10A1, T47D, MDCKII, MDA-MB-468, MCF7, Hela, MDA-MB-231, and BT-20 cells were grown on coverslips and fixed using ice-cold 100% methanol. The cells were subsequently probed with fluorescence-tagged antibodies against E-cadherin (green) and claudin 1 (red), and the nuclei were stained with DAPI (blue). Scale bar: 20 µm. Abbreviation: DAPI, 4′,6-diamidino-2-phenylindole.
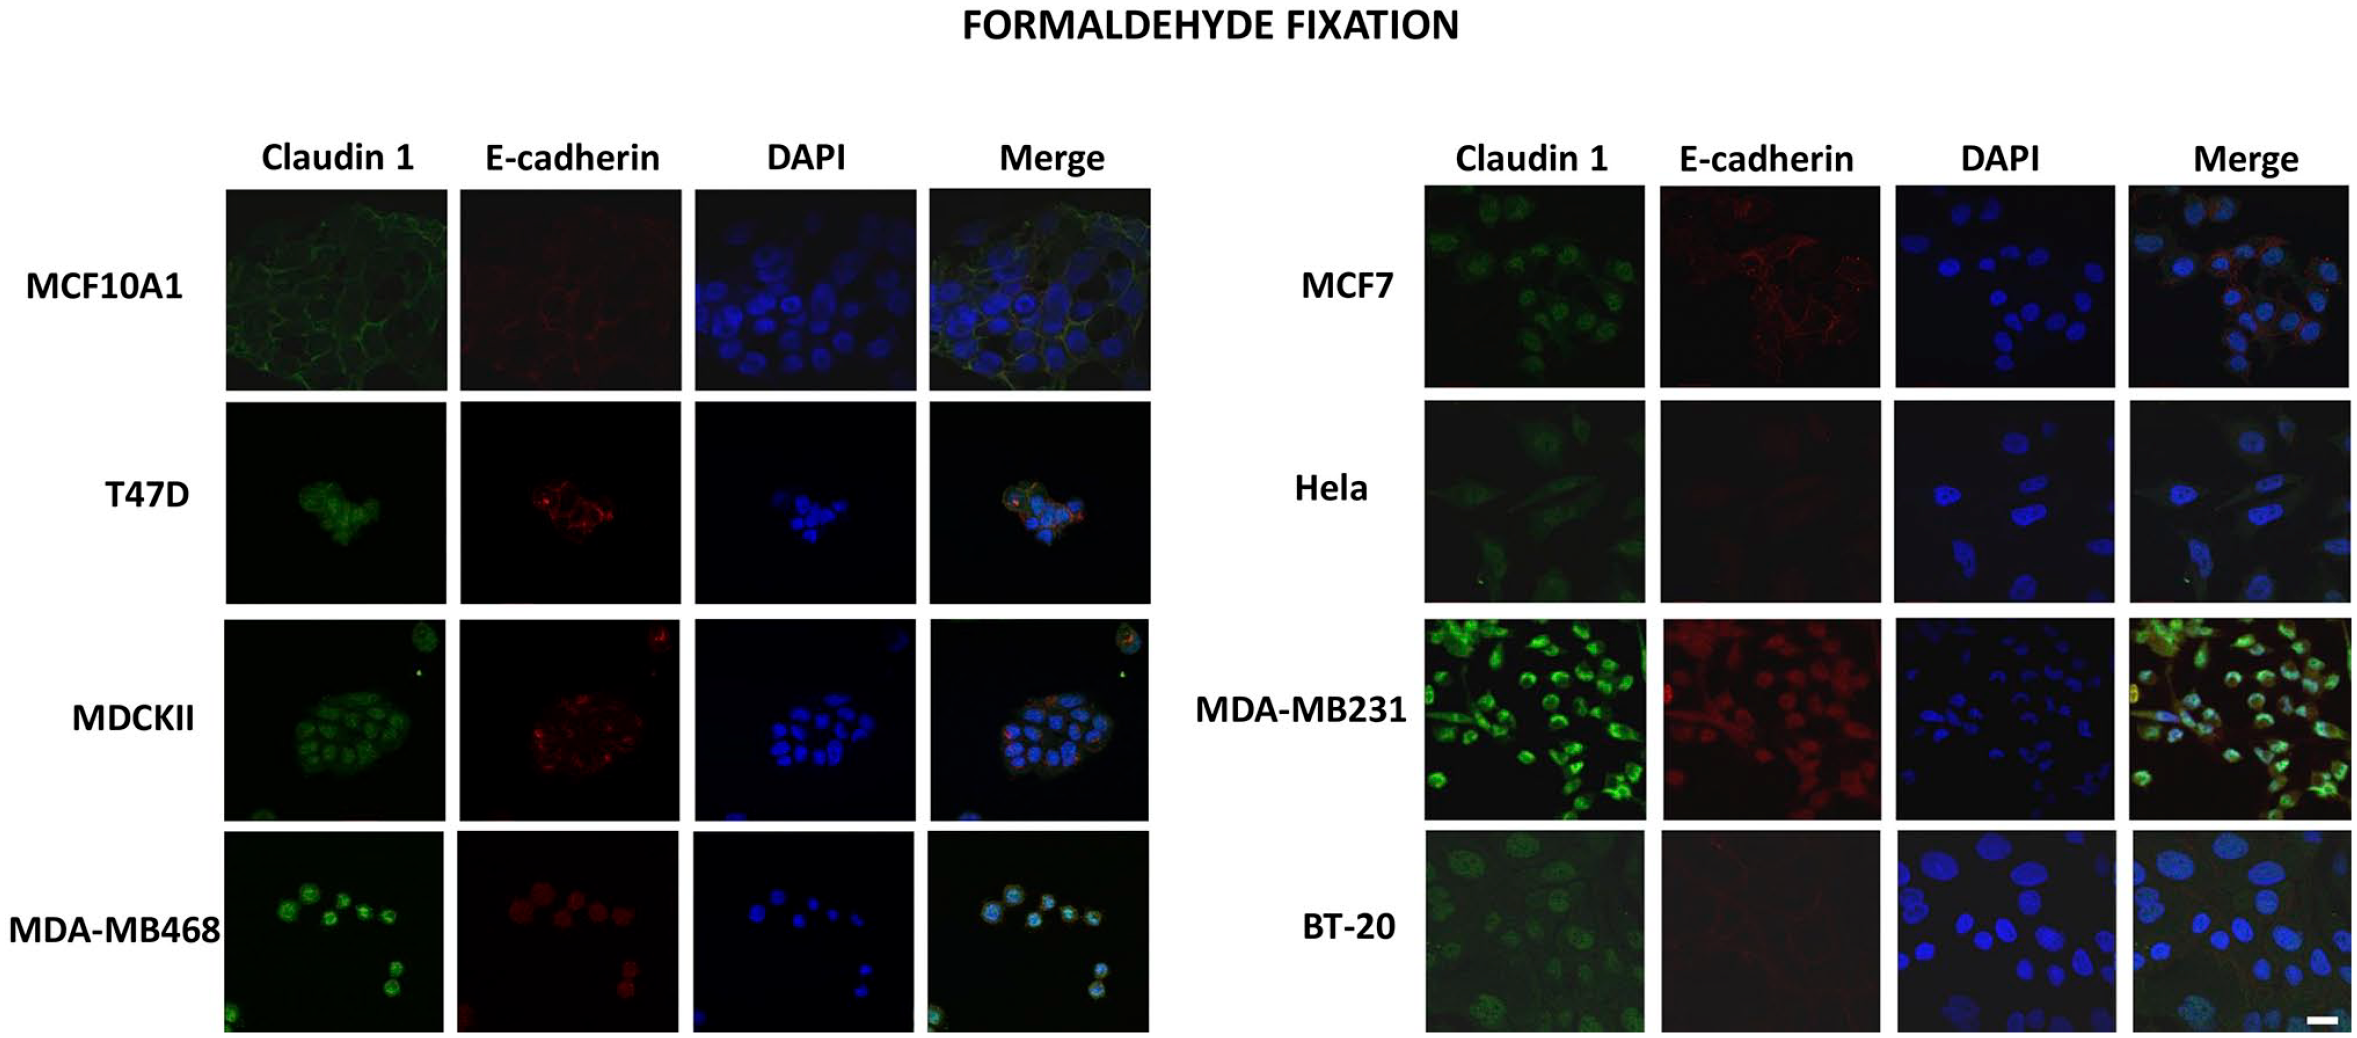
Immunofluorescent detection of E-cadherin and claudin 1 in different cell lines following formaldehyde fixation: MCF-10A1, T47D, MDCK-II, MDA-MB-468, MCF-7, Hela, MDA-MB-231, and BT-20 cells were grown on coverslips and fixed using 4% formaldehyde. The cells were subsequently probed with antibodies against E-cadherin (green) and claudin 1 (red), and the nuclei were stained with DAPI (blue). Scale bar: 20 µm. Abbreviation: DAPI, 4′,6-diamidino-2-phenylindole.
Discussion
Changes in the expression and/or localization of claudin 1 and E-cadherin have been observed in breast cancer and are associated with cancer aggressiveness.5,9 Immunofluorescence remains the most common technique, in both research and clinical settings, to detect these proteins and establish their localization in biological specimens and cells in culture. The fixation phase (with either formaldehyde or alcohol-based fixatives) is the first step during immunofluorescence detection. Because they are affordable, easy to use, and rapidly permeate but also preserve tissue samples for a long duration, 15 formaldehyde-based fixatives have been used over the years as a preferred method for tissue fixation, especially for clinical samples. Despite its useful properties, formaldehyde has been found to be carcinogenic and can crosslink proteins, thereby limiting antigen detection in specific samples. 16 As a result, antigen retrieval processes are often necessary before immunofluorescence to enhance antigen (protein) detection in formaldehyde-fixed samples. 16 Due to the disadvantages of formaldehyde fixation, alcohol-based fixatives, including methanol are currently used as alternatives in both clinical and research applications. 17 Alcohol-based fixatives do not crosslink proteins, are less toxic, and the tissues are well preserved for downstream applications. 17 However, alcohol-based fixatives can often shrink and harden tissue samples and lyse red blood cells, 17 thereby negatively impacting the detection of certain proteins.
In previous studies, we reported on the immunofluorescence detection of claudin 1 and E-cadherin in breast cancer cells using methanol fixation. 14 Other groups have also described the use of formaldehyde fixation for claudin 118 and E-cadherin 19 immunofluorescence in breast cancer cells. In other cell models, formaldehyde or alcohol-based fixatives (including methanol) have alternatively been used for the immunofluorescence detection of claudin 118,20,21 or E-cadherin.22,23 Interestingly, the direct comparison of different fixing protocols including formaldehyde and methanol fixation for the detection of claudin 1 in airway epithelial cells concluded that methanol fixation was optimal to obtain consistent and reliable signals. 24 Altogether, these observations strongly suggest that the best fixation method depends on the sample type, cell type, or experimental conditions. Therefore, it was important to define the optimal fixation method to accurately detect claudin 1 and E-cadherin and their cellular localization for breast cancer research applications. In this study, we compared the use of formaldehyde and methanol as fixatives for the detection of claudin 1 and E-cadherin by immunofluorescence in breast cancer cell lines.
Before performing immunofluorescence on the breast cancer cell lines (T47D, MDA-MB-468, MCF-7, MDA-MB-231 and BT-20) and MCF-10A1, we first evaluated the levels of claudin 1 by Western blot analysis and detected claudin 1 in all cell lines except MDA-MB231. This was not surprising because MDA-MB231 cells are a known model of “claudin-low” triple-negative breast cancer 25 and do not express detectable levels of claudin 1. In addition, we also observed that apart from MDA-MB-231, there were high levels of E-cadherin in all other breast cell lines studied (Fig.1). It should be noted that in MDA-MB-231 cells, E-cadherin expression was reported to be suppressed by promoter methylation. 26 In MDCK-II cells, the loading control (GAPDH) appears less than other cell lines (Fig. 1). This is likely due to the antibody against human GAPDH not recognizing GAPDH in the canine MDCKII cell line as strongly. However, the Coomassie-stained gels confirmed an equivalent amount of protein for each sample (Fig. 1).
Breast cancer cell lines fixed with methanol before immunostaining exhibited stronger signals for both claudin 1 and E-cadherin than formaldehyde-fixed cells (Fig. 2). and the protein levels detected by immunofluorescence correspond with those observed by Western blot analysis. Collectively, our results suggest that formaldehyde fixation method is not optimal for the detection of claudin 1 and E-cadherin by immunofluorescence, which is consistent with previous studies supporting the use of methanol for immunofluorescence.14,24 Furthermore, in line with the current literature, 14 the cells analyzed had claudin 1 mainly localized to cell membranes, but also detected in reduced amounts in the cytoplasmic compartment, particularly in MCF-10A1 cells.
A possible explanation for the improved results obtained with methanol fixation in our study is that the alcohol dehydrates cells instantly and removes lipids from membranes. Membrane proteins are precipitated and therefore allow easy access and detection. 27 Formaldehyde fixation may not be ideal, because as an aldehyde it can mildly oxidize reduced carbon- or nitrogen-creating bonds between proteins and lipids. 28 These bonds may mask some claudin 1– and E-cadherin-recognized epitopes, resulting in an inefficient recognition of the proteins by their antibodies. Potential reasons for inconsistencies reported in other studies may be due to differences in the cell types studied or differences in experimental conditions.
Interestingly, in cells expressing high levels of claudin and E-cadherin such as MCF-10A1, the characteristic staining wire pattern observed was still visible despite the lower signal obtained with formaldehyde fixation. This suggests that formaldehyde fixation can capable of provide positive results in certain cell types. Indeed, some studies have shown good immunofluorescence signals for claudin 1 and E-cadherin using formaldehyde fixation as well.18,19
In conclusion, our results show that use of methanol fixation was more accurate and reliable than formaldehyde fixation to assess the localization of claudin 1 and E-cadherin by immunofluorescence microscopy in human breast cancer cell lines. In addition, results obtained using methanol fixation concurred with the Western blot results, further supporting the reliability and validity of methanol fixation. However, our study also indicates that expression levels and cell type differences should also be considered when evaluating the cellular localization of these junction proteins.
Footnotes
Acknowledgements
The authors thank all the members of Dr. Myal’s laboratory and Dr. Leygue’s laboratory for technical assistance during this study. They also thank the Genomic Centre for Cancer Research and Diagnosis, CancerCare Manitoba Research Institute, for use of their microscopes.
Competing Interests
The author(s) declared no potential conflicts of interest with respect to the research, authorship, and/or publication of this article.
Author Contributions
CAE, MA, MH, and LELT carried out the study; EL and YM were involved in project administration and supervision; EL and YM were involved in resources; CAE, MA, and MH were involved in visualization; CAE, LELT, and BN were involved in writing—original draft; CAE, MA, MH, LELT, BN, EL, and YM were involved in writing—review and editing. All authors have read and agreed to the published version of the manuscript.
Funding
The author(s) disclosed receipt of the following financial support for the research, authorship, and/or publication of this article: This work was supported by the CancerCare Manitoba Foundation (grant number: 761038013, 2017) and the Natural Sciences and Engineering Research Council of Canada, NSERC (grant number: RGPIN/5539, 2014). The funding agencies were not involved in study design; in the collection, analysis, and interpretation of data; in the writing of the report; and in the decision to submit the article for publication.