
Abstract
The mouse line carrying the Tg(Tyr-NRAS*Q61K)1Bee transgene is widely used to model in vivo NRAS-driven melanomagenesis. Although the pathological features of this model are well described, classification and interpretation of the resulting proliferative lesions—including their origin, evolution, grading, and pathobiological significance—are still unclear and not supported by molecular and biological evidence. Focusing on their classification and grading, this work combines histopathology and expression analysis (using both immunohistochemistry [IHC] and quantitative PCR) of selected biomarkers to study the full spectrum of cutaneous and lymph nodal melanocytic proliferations in the Tg(Tyr-NRAS*Q61K)1Bee mouse. The analysis of cutaneous and lymph nodal melanocytic proliferations has demonstrated that a linear correlation exists between tumor grade and Ki-67, microphthalmia-associated transcription factor (MITF), gp100, and nestin IHC, with a significantly increased expression in high-grade lesions compared with low-grade lesions. The accuracy of the assessment of MITF IHC in melanomas was also confirmed by quantitative PCR analysis. In conclusion, we believe the incorporation of MITF, Ki-67, gp100, and nestin analysis into the histopathological classification/grading scheme of melanocytic proliferations described for this model will help to assess with accuracy the nature and evolution of the phenotype, monitor disease progression, and predict response to experimental treatment or other preclinical manipulations.
Introduction
Activating mutations of NRAS have been reported at a relatively high frequency in human melanocytic lesions, including congenital nevi and primary and metastatic melanomas.1–4 A missense point mutation of NRAS, targeting codon 61 (lysine for glutamine amino acid substitution Q61K) or, much less frequently, codons 12 and 13, represents a recurrent genetic alteration that is considered responsible for skin melanomagenesis in about 15–20% of melanoma patients. Mutation at any of these codons produces similar pathomolecular effects by locking GTPase NRas into its active conformation with constitutive oncogenic signaling through a variety of pathways, most notably the MAPK/ERK and PI3K/AKT pathways.5,6
NRAS mutations occur at a fairly constant rate in all non-uveal sites of melanoma, including sun-exposed and non-sun-exposed skin, and mucosal and acral sites of origin. This distribution contrasts with BRAF mutations, which are more common in intermittently sun-exposed skin, and KIT mutations, which are present predominantly in mucosal and acral melanomas. Also, in contrast to BRAF, NRAS mutations are rarely present in benign melanocytic nevi, with the exception of congenital nevi. More importantly, NRAS-mutant melanomas are generally associated with aggressive clinical behavior and poor prognosis.7–9
To study the oncogenic potential of constitutively activated mutant GTPase NRas in melanomagenesis, a transgenic mouse line overexpressing the human NRAS Q61K mutant allele under the mouse tyrosinase promoter for selective melanocytic lineage targeting (Tg(Tyr-NRAS*Q61K)1Bee) was generated (www.informatics.jax.org/allele/key/56367). Originally described by Ackermann and colleagues, 10 the Tg(Tyr-NRAS*Q61K)1Bee mouse line raised considerable interest, mainly because of the spontaneous development of cutaneous melanomas (CM) with putative metastatic involvement of both loco-regional lymph nodes and distant sites (primarily lungs). Drastically increased phenotype penetrance (from less than 30% to more than 95%) as well as shortened tumor latency (from over 1 year to about 6 months) was also obtained by crossing this transgenic line into a Cdkn2a-deficient (Cdkn2atm1Rdp; www.informatics.jax.org/allele/MGI:1857942) background which is characterized by the loss of both p16 and p19 alternative splice products of this gene. 10 Despite the fact that the introduction of the Cdkn2atm1Rdp allele is also associated with an increase in early development of cancers of non-melanocytic origin (i.e., sarcoma and lymphoma), the resulting mouse line has gained wide popularity as one of the few consistently reproducible genetically engineered mouse (GEM) models of metastasizing CM. Following these initial observations, the Tg(Tyr-NRAS*Q61K)1Bee background has quickly become a reference genetic system where to explore in vivo candidate gene function, investigate the role of cooperating mutations, validate biomarkers, and test therapeutic strategies.11–16
Despite the considerable reliance on this specific mouse model for preclinical research, description and interpretation of the complex phenotype associated with the Tg(Tyr-NRAS*Q61K)1Bee transgene have been often ambiguous and largely inconsistent among different authors.12,17,18 In an effort to establish a consensus, Campagne and colleagues proposed a histopathological classification scheme of melanocytic proliferations developed by mice carrying the Tg(Tyr-NRAS*Q61K)1Bee transgene and the Cdkn2atm1Rdp null allele. Their work provides a systematic compilation of morphological algorithms that define distinct melanocytic lesion categories. However, criteria for lesion classification are based on a purely descriptive histopathological approach and interpretation of histogenesis, and grade of the diverse categories of melanocytic proliferations is not supported by molecular and/or biological evidence. 18
The aim of our study is to provide a comprehensive pathological description of the full spectrum of murine melanocytic proliferations driven by the Tg(Tyr-NRAS*Q61K)1Bee transgene focusing on their grading and biological significance. Drawing from the seminal observations made by Campagne and colleagues, 18 we have revisited the original histopathological characterization of the lesions occurring in this mouse line to establish accurate grading criteria. To this end, we have analyzed different categories of melanocytic proliferations based on the expression level and distribution of relevant biomarkers, including microphthalmia-associated transcription factor (MITF), melanocyte protein PMEL (gp100), nestin, and proliferation marker protein Ki-67.
Materials and Methods
Animals and Husbandry
For this work, we considered melanocytic proliferations from 23 mice carrying the Tg(Tyr-NRAS*Q61K)1Bee transgene (www.informatics.jax.org/allele/key/56367). The generation of the transgenic mouse line has been described elsewhere.10,19 The oncogenic NRAS transgene was combined with monoallelic or biallelic germline loss of Cdkn2a (Cdkn2atm2.1Rdp; www.informatics.jax.org/allele/MGI:1857942) in 5 and 18 mice, respectively. Unlike the Cdkn2atm1Rdp allele originally used by Ackermann and colleagues, where both p16 and p19 tumor suppressor proteins are deleted,10,20 the Cdkn2atm2.1Rdp allele results in loss of p16 while expression of p19 is maintained. 21 The mice were kept in a specific pathogen-free animal facility (ULB-Cancer Research Center, Université Libre de Bruxelles, Brussels, Belgium) in accordance with the institutional guidelines regarding the care and use of laboratory animals, and all procedures were approved by the Institutional Ethics Committee (Agreement: LA1230572). The mice were evaluated clinically 2× to 3× per week for body weight changes and general condition, as well as for the presence, appearance, and evolution of cutaneous melanocytic lesions. Mice with cutaneous lesions were euthanized when skin lesions exceeded 1 cm3 or when body weight loss was greater than 20%. Similarly, mice that did not exhibit cutaneous lesions were euthanized as soon as body weight loss was greater than 20% or if any other sign of significant suffering was detected. After euthanasia, cutaneous and peripheral lymph nodal lesions were recorded and harvested. The abdominal, thoracic, and cranial cavities were opened and evaluated for the presence of macroscopically visible melanocytic lesions. Affected organs were harvested and evaluated histologically (Supplemental Table S2).
Pathological Classification and Grading of Melanocytic Lesions
Tissue sample preparation for histopathological examination was performed as previously reported. 22 In agreement with the classification scheme proposed by Campagne and colleagues, 18 cutaneous melanocytic lesions were categorized into four distinct entities: (1) hyperplasia of dendritic melanocytes, without atypia, in the upper dermis (nevus, type A lesion; Supplemental Fig. 1); (2) micronodular hyperplasia of epithelioid/spindloid melanocytes, without atypia, in the deep dermis/subcutis (nevus, type B lesion; Supplemental Fig. 2); (3) atypical hyperplasia of epithelioid/spindloid melanocytes usually affecting the upper/mid dermis (dysplastic nevus, type C lesion; Supplemental Fig. 3); and (4) melanoma primarily involving dermis and subcutis (type D lesion; Supplemental Fig. 4). The same four lesion categories proposed by Campagne and colleagues 18 for the classification of melanocytic proliferations in the lymph nodes were not considered in our study. Lesions in the lymph nodes were instead classified as low- or high-grade, depending on the extent of tissue invasion/effacement and the presence or absence of cytological features of malignancy (Supplemental Figs. 5 and 6). For all the lymph nodal melanocytic proliferations and for type C and D cutaneous lesions, features such as predominant cellular morphology (i.e., small or large epithelioid, spindle, etc.) and degree of pigmentation (i.e., heavily or poorly pigmented) were also considered. The sporadic melanocytic proliferations detected in the lungs and meninges have been described histopathologically but not graded (Supplemental Figs. 7 and 8). A detailed characterization of the pathological features for the full spectrum of melanocytic proliferations associated with the Tg(Tyr-NRAS*Q61K)1Bee transgene, including the histopathological criteria adopted for their differentiation, is available in the Supplemental Material (Document S1).
Immunohistochemistry (IHC), Immunofluorescence (IF), and Reverse Transcription Quantitative Polymerase Chain Reaction (RT-qPCR)
For chromogenic IHC, slides were deparaffinized in xylene and rehydrated in ethanol series (100%, 95%, and 70%) and distilled water. Endogenous peroxidase inhibition was achieved by incubating the slides in 3% hydrogen peroxide for 15 min at room temperature. Epitope retrieval was performed in citrate buffer (pH 6) using the 2100 Retriever. Sections were blocked in 1% BSA solution for 40 min at room temperature and then incubated overnight at 4C with the primary antibody. A series of melanocyte lineage-specific markers including melanocyte protein PMEL (best known as gp100; ab137078, rabbit monoclonal, 1/200 working dilution; Abcam, Cambridge, MA), transcription factor SOX-10 (sc-17342, goat polyclonal, 1/200 working dilution; Santa Cruz Biotechnology, Santa Cruz, CA), nestin (HBA026111, rabbit polyclonal, 1/4000 working dilution; Atlas Antibodies), and MITF (HPA003259, rabbit polyclonal, 1/800 working dilution; Atlas Antibodies, Stockholm, Sweden), as well as proliferation marker protein Ki-67 (MA5-14520 clone SP6, rabbit polyclonal, 1/200 working dilution; ThermoFisher Scientific, Rockford, IL) were assessed. IHC expression of GFAP (Z0334, rabbit polyclonal, 1/4000 working dilution; Agilent Dako, Santa Clara, CA), nerve growth factor receptor (NGFR; 8238, rabbit monoclonal, 1/200 working dilution; Cell Signaling Technology, Danvers, MA), and UCH-L1 (also known as PGP9.5; AB5925, rabbit polyclonal, 1/1000 working dilution; Millipore Sigma, St. Louis, MO) was also assessed on selected lesions. For rabbit primary antibodies, the EnVision+/horseradish peroxidase (HRP) anti-rabbit IgG polymer detection kit (K400311-2; Agilent Dako) was used according to the manufacturer’s protocol. For goat primary antibodies, the ImmPRESS HRP anti-goat IgG polymer detection kit (MP-7405; Vector Laboratories, Burlingame, CA) was used according to the manufacturer’s protocol. Immunoreactivity was finally revealed via 3-amino-9-ethylcarbazole (AEC+ Code K3461; Agilent Dako) chromogen reaction. Slides were counterstained in hematoxylin (MHS32-1L; Millipore Sigma) and mounted with a glycerin-based mounting medium (GG1-15ML; Millipore Sigma). IF combining Ki-67 and SOX-10 or Ki-67 and the macrophage marker AIF1 (best known as Iba1; ab5076, goat polyclonal, 1/600 working dilution; Abcam) was also performed on a set of samples. Pretreatment of slides was identical to the one used for chromogenic IHC. Sections were blocked in 1% BSA solution (A2153-10G; Millipore Sigma) for 40 min at room temperature and then incubated overnight at 4C with the primary antibodies. For Ki-67, an Alexa Fluor 488–conjugated donkey anti-rabbit IgG (H + L) secondary antibody (A-21206; ThermoFisher Scientific) was used. For SOX-10 and AIF-1, an Alexa Fluor 555–conjugated donkey anti-goat IgG (H + L) secondary antibody (A-21432; ThermoFisher Scientific) was used. Both secondary antibodies were incubated at room temperature for 45 min with a concentration of 5 µg/mL.
A quantitative evaluation of MITF, SOX-10, and Ki-67 staining was performed by counting hyperplastic/neoplastic melanocytes in each lesion and recording the fraction of positive cell over the total number of cells counted. The evaluation was performed using the Cell Counter function (Image J; https://imagej.nih.gov/ij/) on 100× objective fields randomly selected within each considered lesion. For cutaneous lesions, a minimum of 100 cells were counted for A and B lesions, 200 cells for C lesions, and 400 cells for D lesions. For lesions in the lymph nodes, a minimum of 150 cells were counted for low-grade lesions and 200 cells for high-grade lesions. Duplex immunofluorescence for Ki-67 and SOX-10 also allowed the assessment of Ki-67-positive cells normalized to the total number of SOX-10-positive cells. For gp100 and nestin, a semiquantitative evaluation was performed, and based on the relative percentage of positive mutant melanocytes identified in each lesion, a score from 0 through 3 was assigned (see Supplemental Table S1 for the definition of the scoring criteria).
Quantitative PCR for MITF and Sox10 was performed on selected type D cutaneous lesions as previously reported. 19
Statistical Analysis
For the different markers considered in this work, the distributions of the values extrapolated from the study of the expression levels were further analyzed statistically to identify any significant trend, association, and/or correlation across the diverse categories and grades of cutaneous and lymph nodal melanocytic proliferations. Meningeal and pulmonary lesions were excluded from the statistical analysis because of the limited number of observations available for these two affected tissues. The data were assessed for normality using Shapiro–Wilk’s tests and are described as mean and standard deviation or median and interquartile range. The data included multiple observations from the same subject (i.e., mouse), and potential subject effect was evaluated using mixed effects linear regression with subsequent pairwise comparisons between groups corrected for multiplicity using the Bonferroni method. Correlation between continuous variables was calculated as Pearson’s r using robust estimates of standard error. Comparison of continuous data between pigmented and poorly pigmented groups used Wilcoxon rank-sum test and between large, small, or other cell morphology used Kruskal–Wallis test. Comparison of counts and proportions was performed using Fisher’s exact test. Box and whisker plots were created, wherein the line represents the median value, the box encompasses the interquartile range, and whiskers extend to 1.5× the interquartile range from the 25th and 75th percentile values. A value of p<0.05 was considered significant. The Stata software Version 16.1 (StataCorp.; College Station, TX) was used for statistical analysis, and Prism Version 8.3 (GraphPad Software; La Jolla, CA) was used to generate the graphs.
Results
Pathological Description of the Model with Classification and Grading of Melanocytic Proliferations
A detailed pathological description of the full spectrum of melanocytic proliferations observed in this study, including their classification and grading criteria, is available in the Supplemental Material (Document S1). Animal data, including age at sacrifice, clinical observations, main gross pathological findings at the time of necropsy, and histopathological classification of the reported lesions, are summarized in the Supplemental Table S2. A total of 99 proliferative lesions of possible melanocytic origin were identified in the 23 mice considered in this study, with 79 cutaneous, 15 lymph nodal, 3 pulmonary, and 2 meningeal lesions. All four types of cutaneous lesions were represented (A: n=23; B: n=22; C: n=14; D: n=20). Ten high-grade and five low-grade lymph nodal lesions could be clearly distinguished. The actual metastatic or primary nature of most melanocytic proliferations observed in the lymph nodes remained undetermined. Although a number of nodal lesions were associated with high-grade cutaneous lesions in the field of lymph drainage, not all exhibited similar histopathological features and cellular morphology as the coexisting cutaneous lesion(s). Some affected lymph nodes were, on the contrary, not associated with any detectable cutaneous or visceral lesion. The pulmonary lesions seen in three mice had a clear metastatic nature, with multifocal metastases ranging from small intravascular or interstitial aggregates of neoplastic cells to larger, macroscopically visible, nodular metastases (Supplemental Fig. 7). The pulmonary metastases were also accompanied by high-grade cutaneous or lymph nodal lesions with matching morphological features that were therefore considered the most likely primary source of the metastatic spread. The meningeal lesions were primarily distributed on the surface of the frontal cortical region and base of olfactory bulbs (Supplemental Fig. 8), suggesting a primary origin from the resident melanocyte population that is well represented in these meningeal districts. Neoplastic lesions of non-melanocytic origin were extremely rare and included a hepatic hemangiosarcoma and a hepatosplenic histiocytic sarcoma (Supplemental Table S2).
Expression of Melanocytic Markers
A complete overview of the results of IHC and qPCR experiments across the full list of melanocytic proliferations considered in this study is available in the Supplemental Material (Table S2). For the quantitative/semiquantitative IHC assessment, the statistical distributions of the values for each lesion category are reported in Table 1.
Quantitative and Semiquantitative Assessment of Immunohistochemistry for Each Cutaneous and Lymph Nodal Melanocytic Lesion.
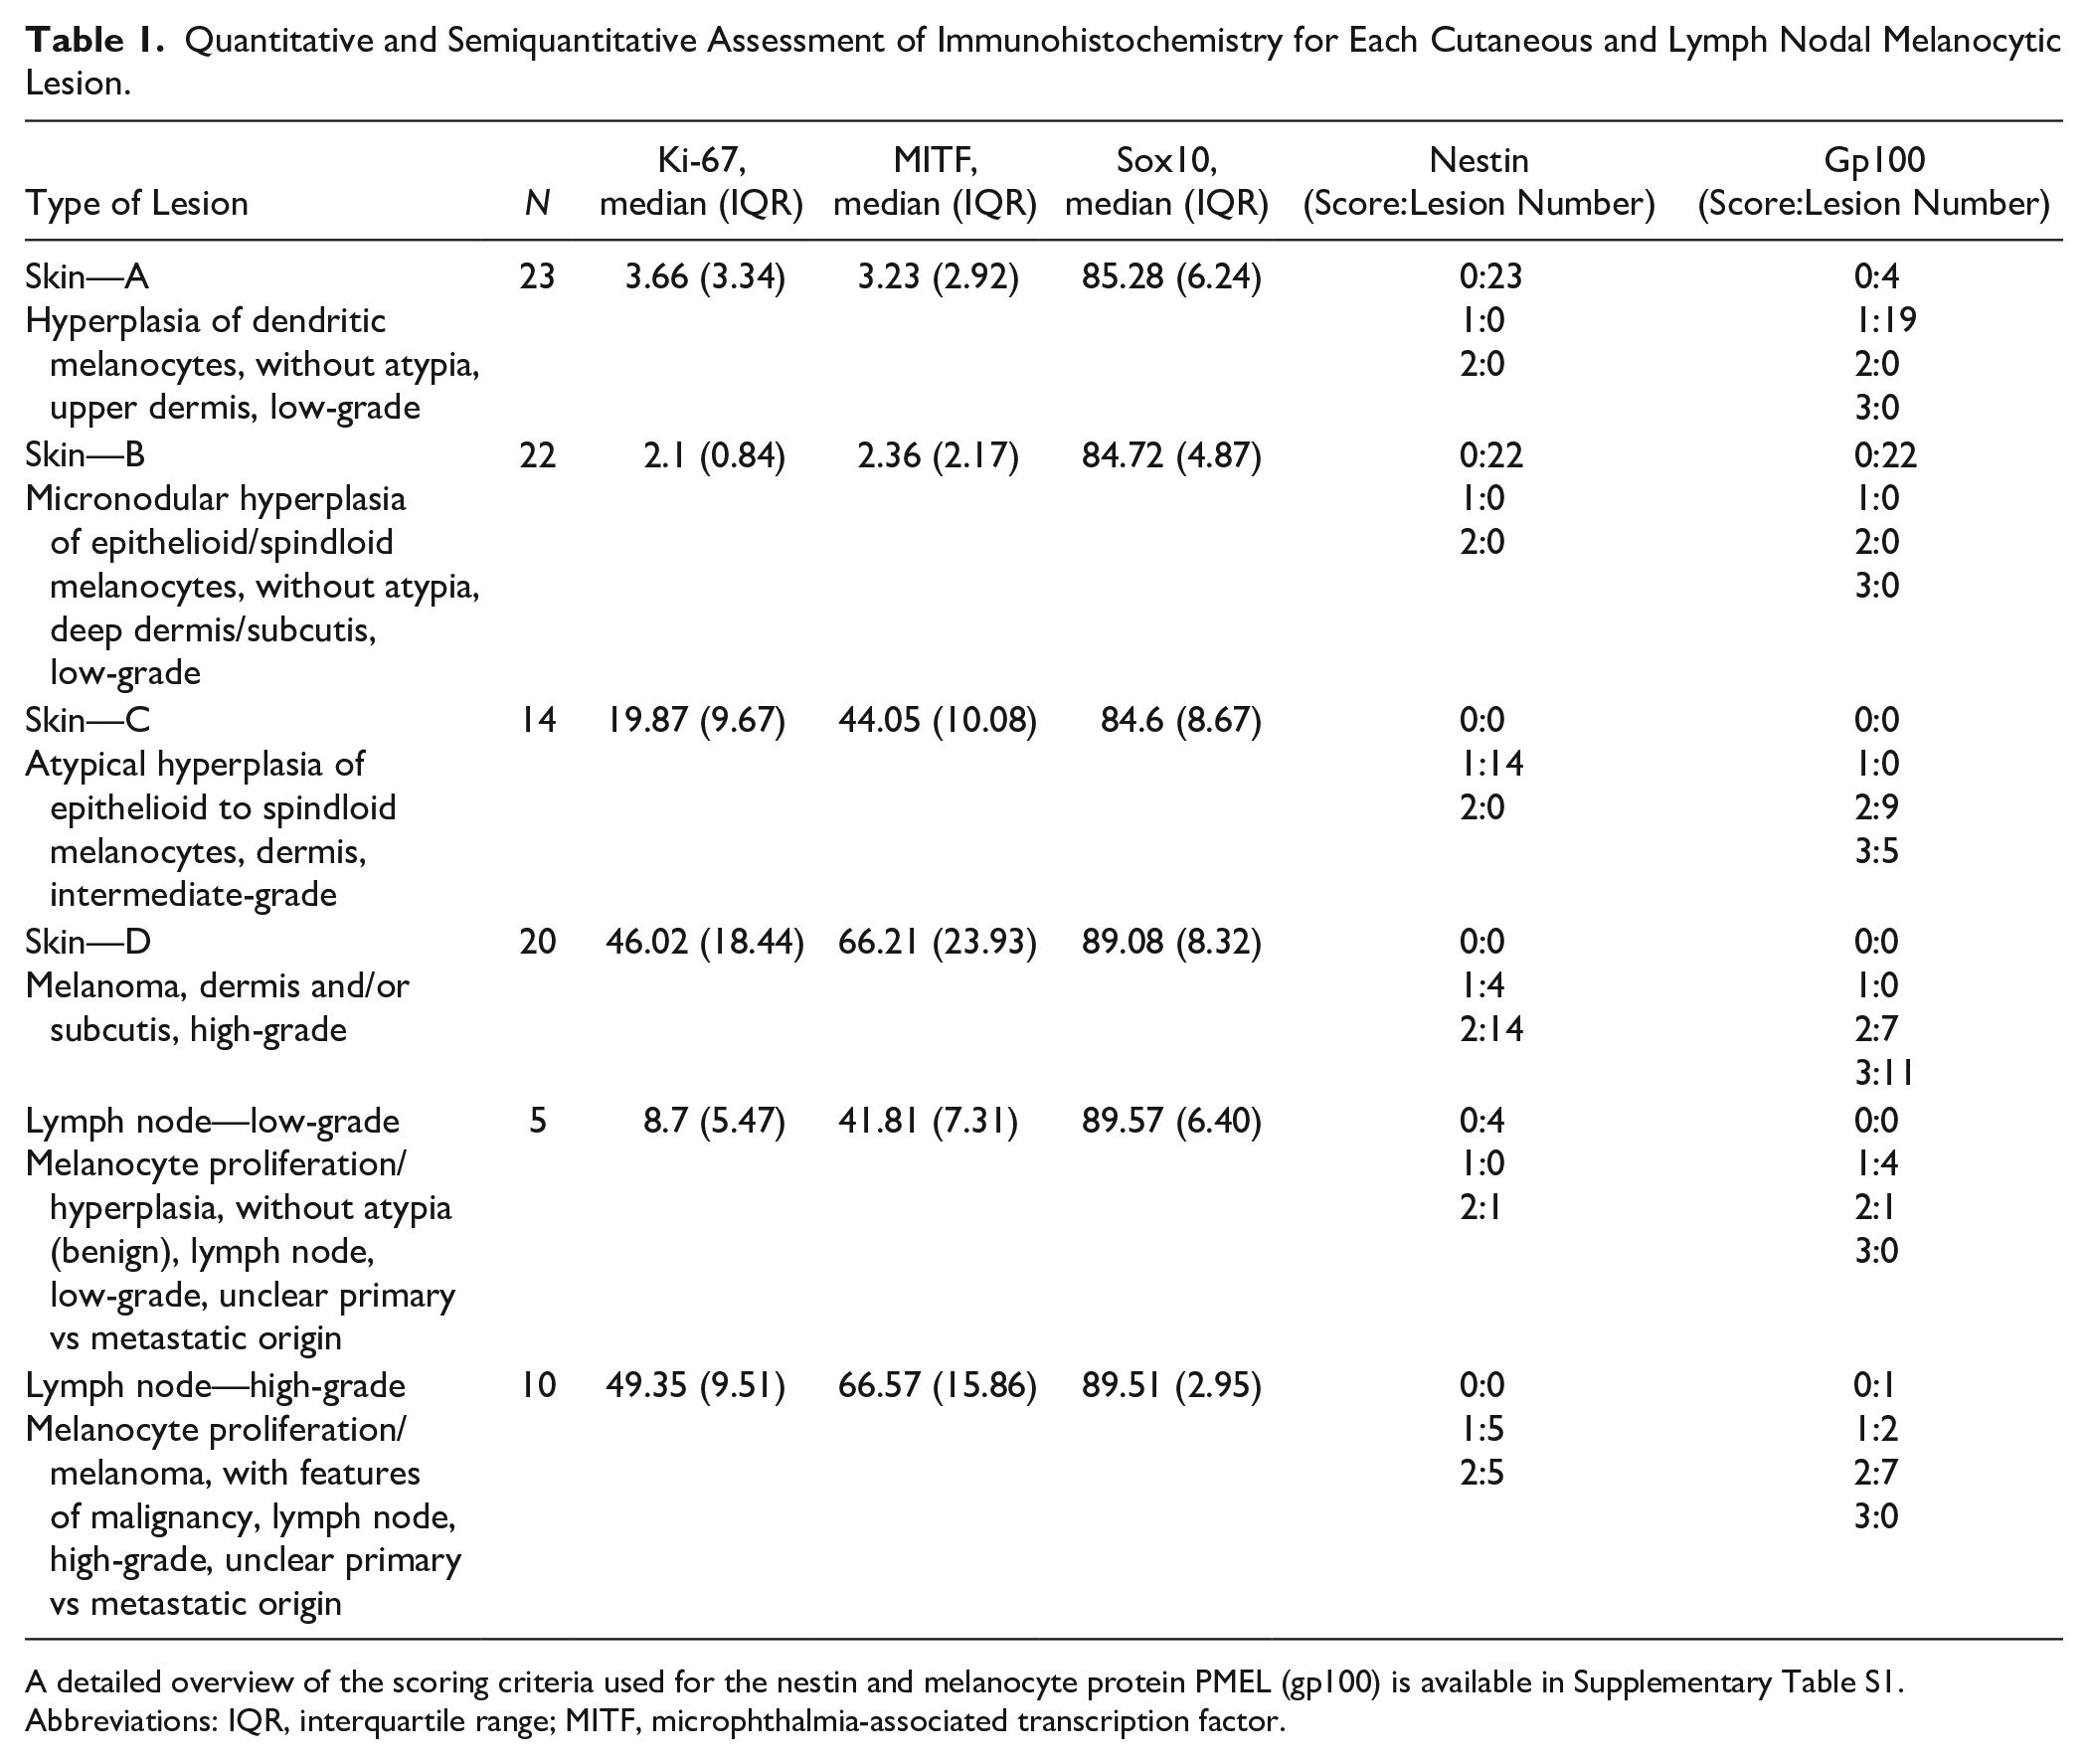
A detailed overview of the scoring criteria used for the nestin and melanocyte protein PMEL (gp100) is available in Supplementary Table S1. Abbreviations: IQR, interquartile range; MITF, microphthalmia-associated transcription factor.
Two poorly pigmented cutaneous masses originally classified as D lesions displayed a peripheral nerve sheath tumor–like phenotype characterized by prevalent spindle cell morphology and expression of neural markers including GFAP, nestin, NGFR, UCH-L1 (also known as PGP9.5), and SOX-10, but lack of classical melanocyte markers, such as gp100 and MITF (the latter both via IHC and RT-qPCR) (Supplemental Fig. 9). Because of this divergent neuroid phenotype, these two tumors were excluded from the D lesion group for any of the subsequent statistical analyses.
Diffuse SOX-10 expression was seen by IHC across all types of melanocytic proliferations and in all affected organs. Levels of SOX-10 expression in the different categories of melanocytic proliferations did not exhibit any statistically significant variation (Fig. 1A and B; Supplemental Fig. 13).
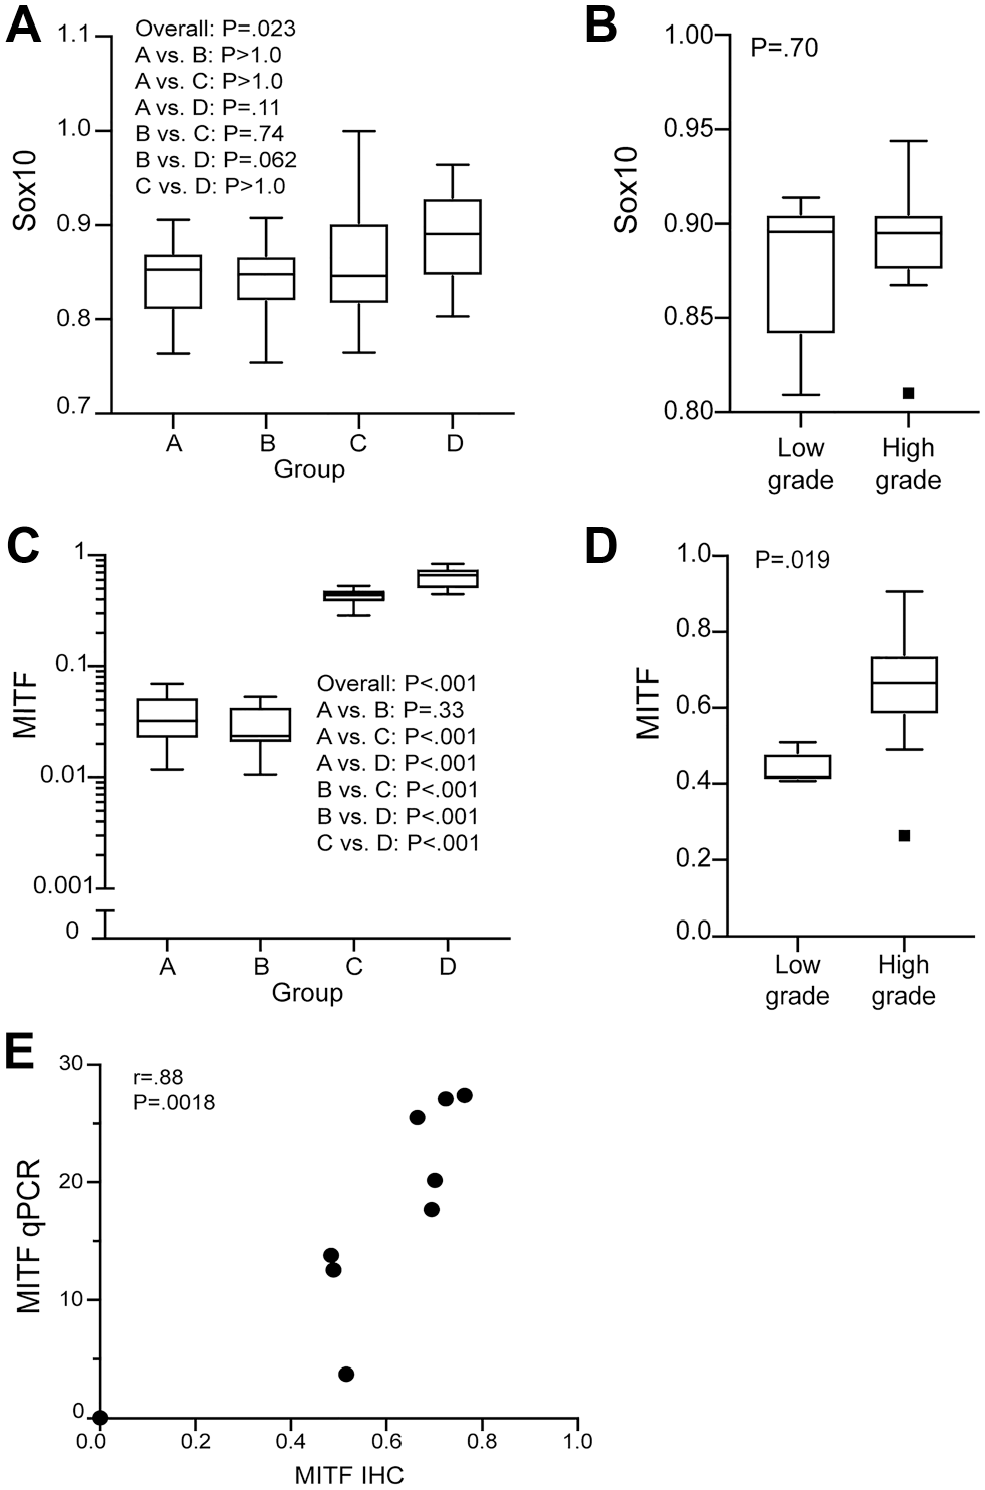
Expression analysis of Sox-10 and MITF across the entire spectrum of melanocytic proliferation observed in the Tg(Tyr-NRAS*Q61K)1Bee transgenic mouse model (A–D). Immunohistochemical Sox-10 expression was observed diffusely throughout all types of cutaneous and lymph nodal melanocytic lesions without statistically significant variation (A, B). Immunohistochemical MITF expression was present in all lesion types with a statistically significant increase in high-grade lesions (type C and D cutaneous and high-grade lymph nodal lesions) (C, D). The data are represented in box and whisker plots, wherein the line represents the median value, the box encompasses the interquartile range, and the whiskers extend to 1.5 times the interquartile range from the 25th and 75th percentile values. p<0.05 was considered significant. A strong linear correlation exists between the immunohistochemistry (IHC) and RT-qPCR expression of MITF in type D cutaneous lesions (E). Correlation between continuous variables was calculated as Pearson’s r using robust estimates of standard error. Abbreviation: MITF, microphthalmia-associated transcription factor; RT-qPCR, reverse transcription quantitative polymerase chain reaction.
MITF-positive melanocytic cells were also represented across all types of melanocytic proliferations and in all affected organs. However, both in the skin and in the lymph nodes, a significant association between MITF-positive cell ratio and lesion grade was observed with increased levels of MITF in high-grade proliferations and minimal expression in low-grade lesions, especially in the cutaneous type A and B lesions (Figs. 1C and D, 3A and B, and 4A and B). Interestingly, in the skin, a clear separation between type C and D lesions could be also inferred based on MITF IHC. To validate the accuracy of MITF expression as assessed by IHC, selected type D lesions were also analyzed via RT-qPCR. In this context, a strong (positive) linear correlation between IHC and RT-qPCR expression levels was demonstrated (Fig. 1E).
IHC expression of gp100 was described in all lesion categories except for type B lesions where melanocytes were distinctively negative for this marker. Similar to the results observed for MITF, a trend toward increased gp100 expression in high-grade lesions emerged for both cutaneous and lymph nodal proliferations (Figs. 2A and B, 3C and D, and 4C and D; Supplemental Fig. 13).
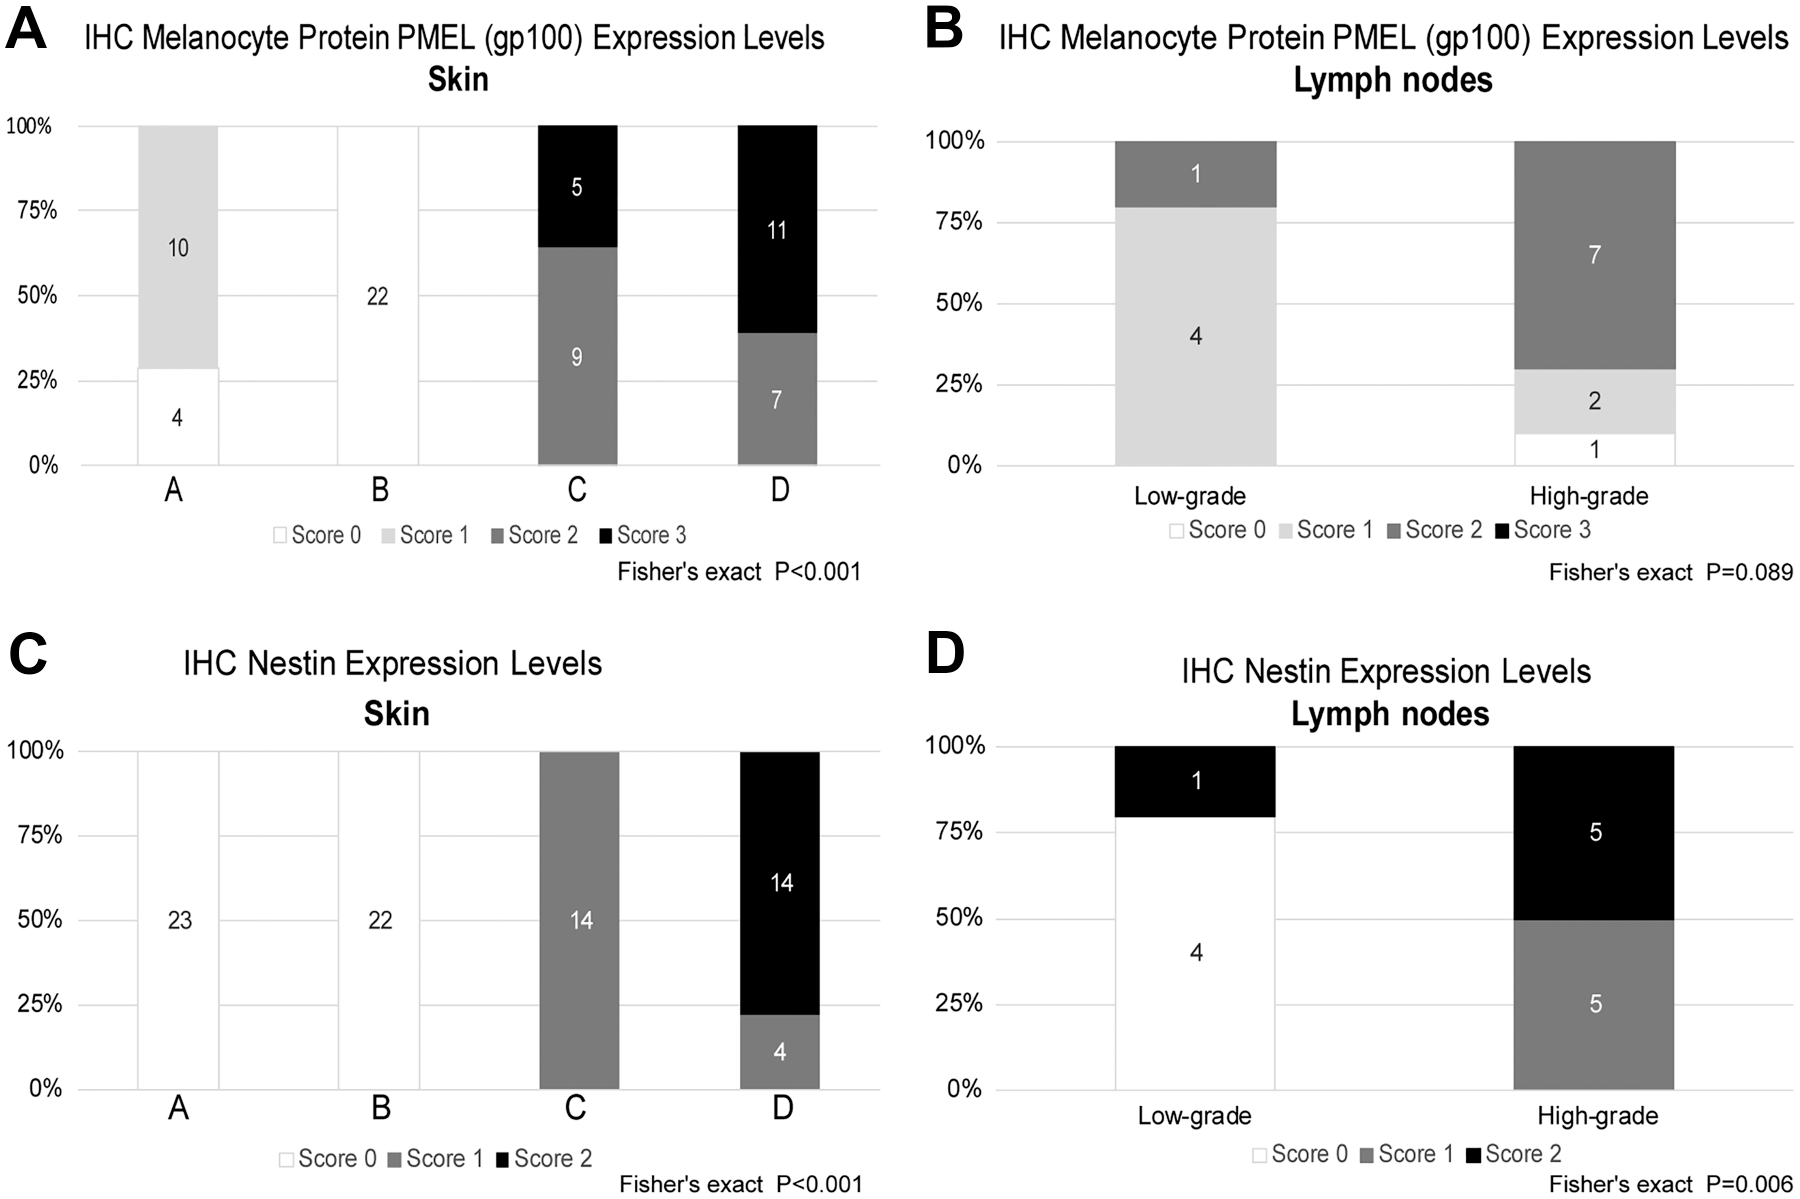
Analysis of melanocyte protein PMEL (gp100) and nestin immunohistochemical expression across the entire spectrum of melanocytic proliferation observed in the Tg(Tyr-NRAS*Q61K)1Bee transgenic mouse model. Except for type B lesions, where melanocytes were distinctively negative, immunohistochemical expression of melanocyte protein PMEL (gp100) was seen in all lesion categories with a statistically significant increase in expression in high-grade lesions (A, B). Nestin expression was mostly limited to high-grade lesions in the skin and lymph nodes (C, D). Comparison of counts and proportions was performed using Fisher’s exact test. p<0.05 was considered significant. Abbreviation: IHC, immunohistochemistry.
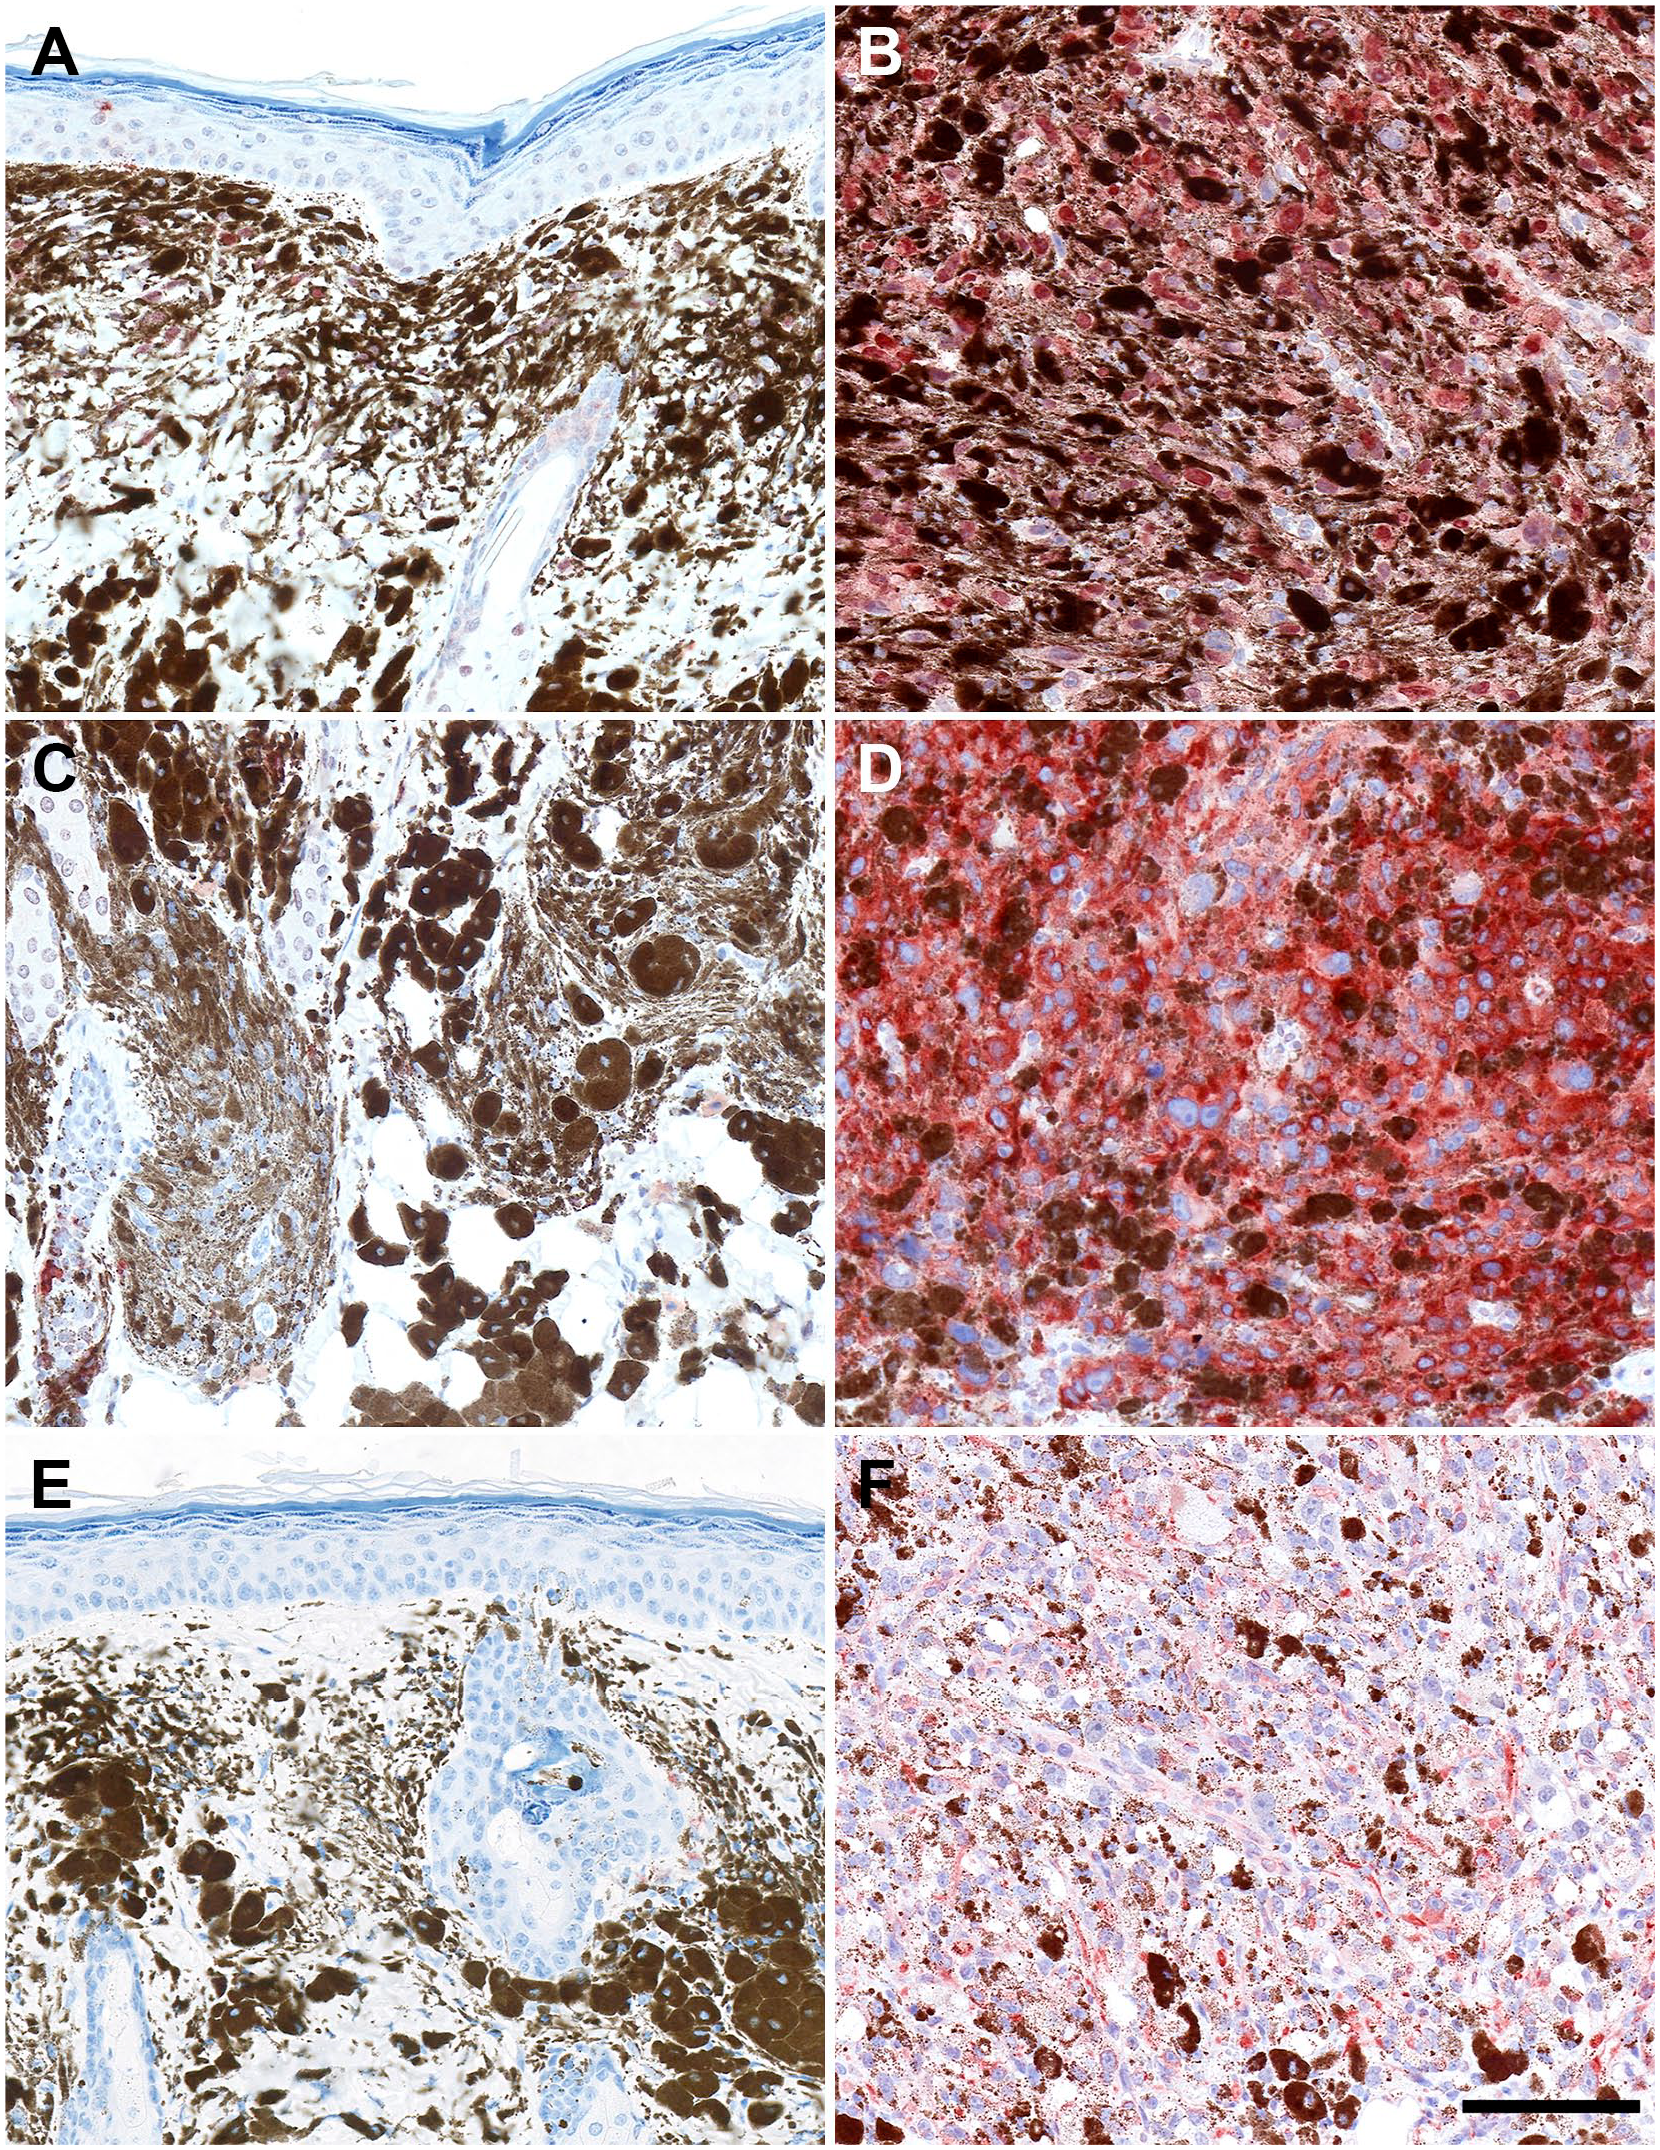
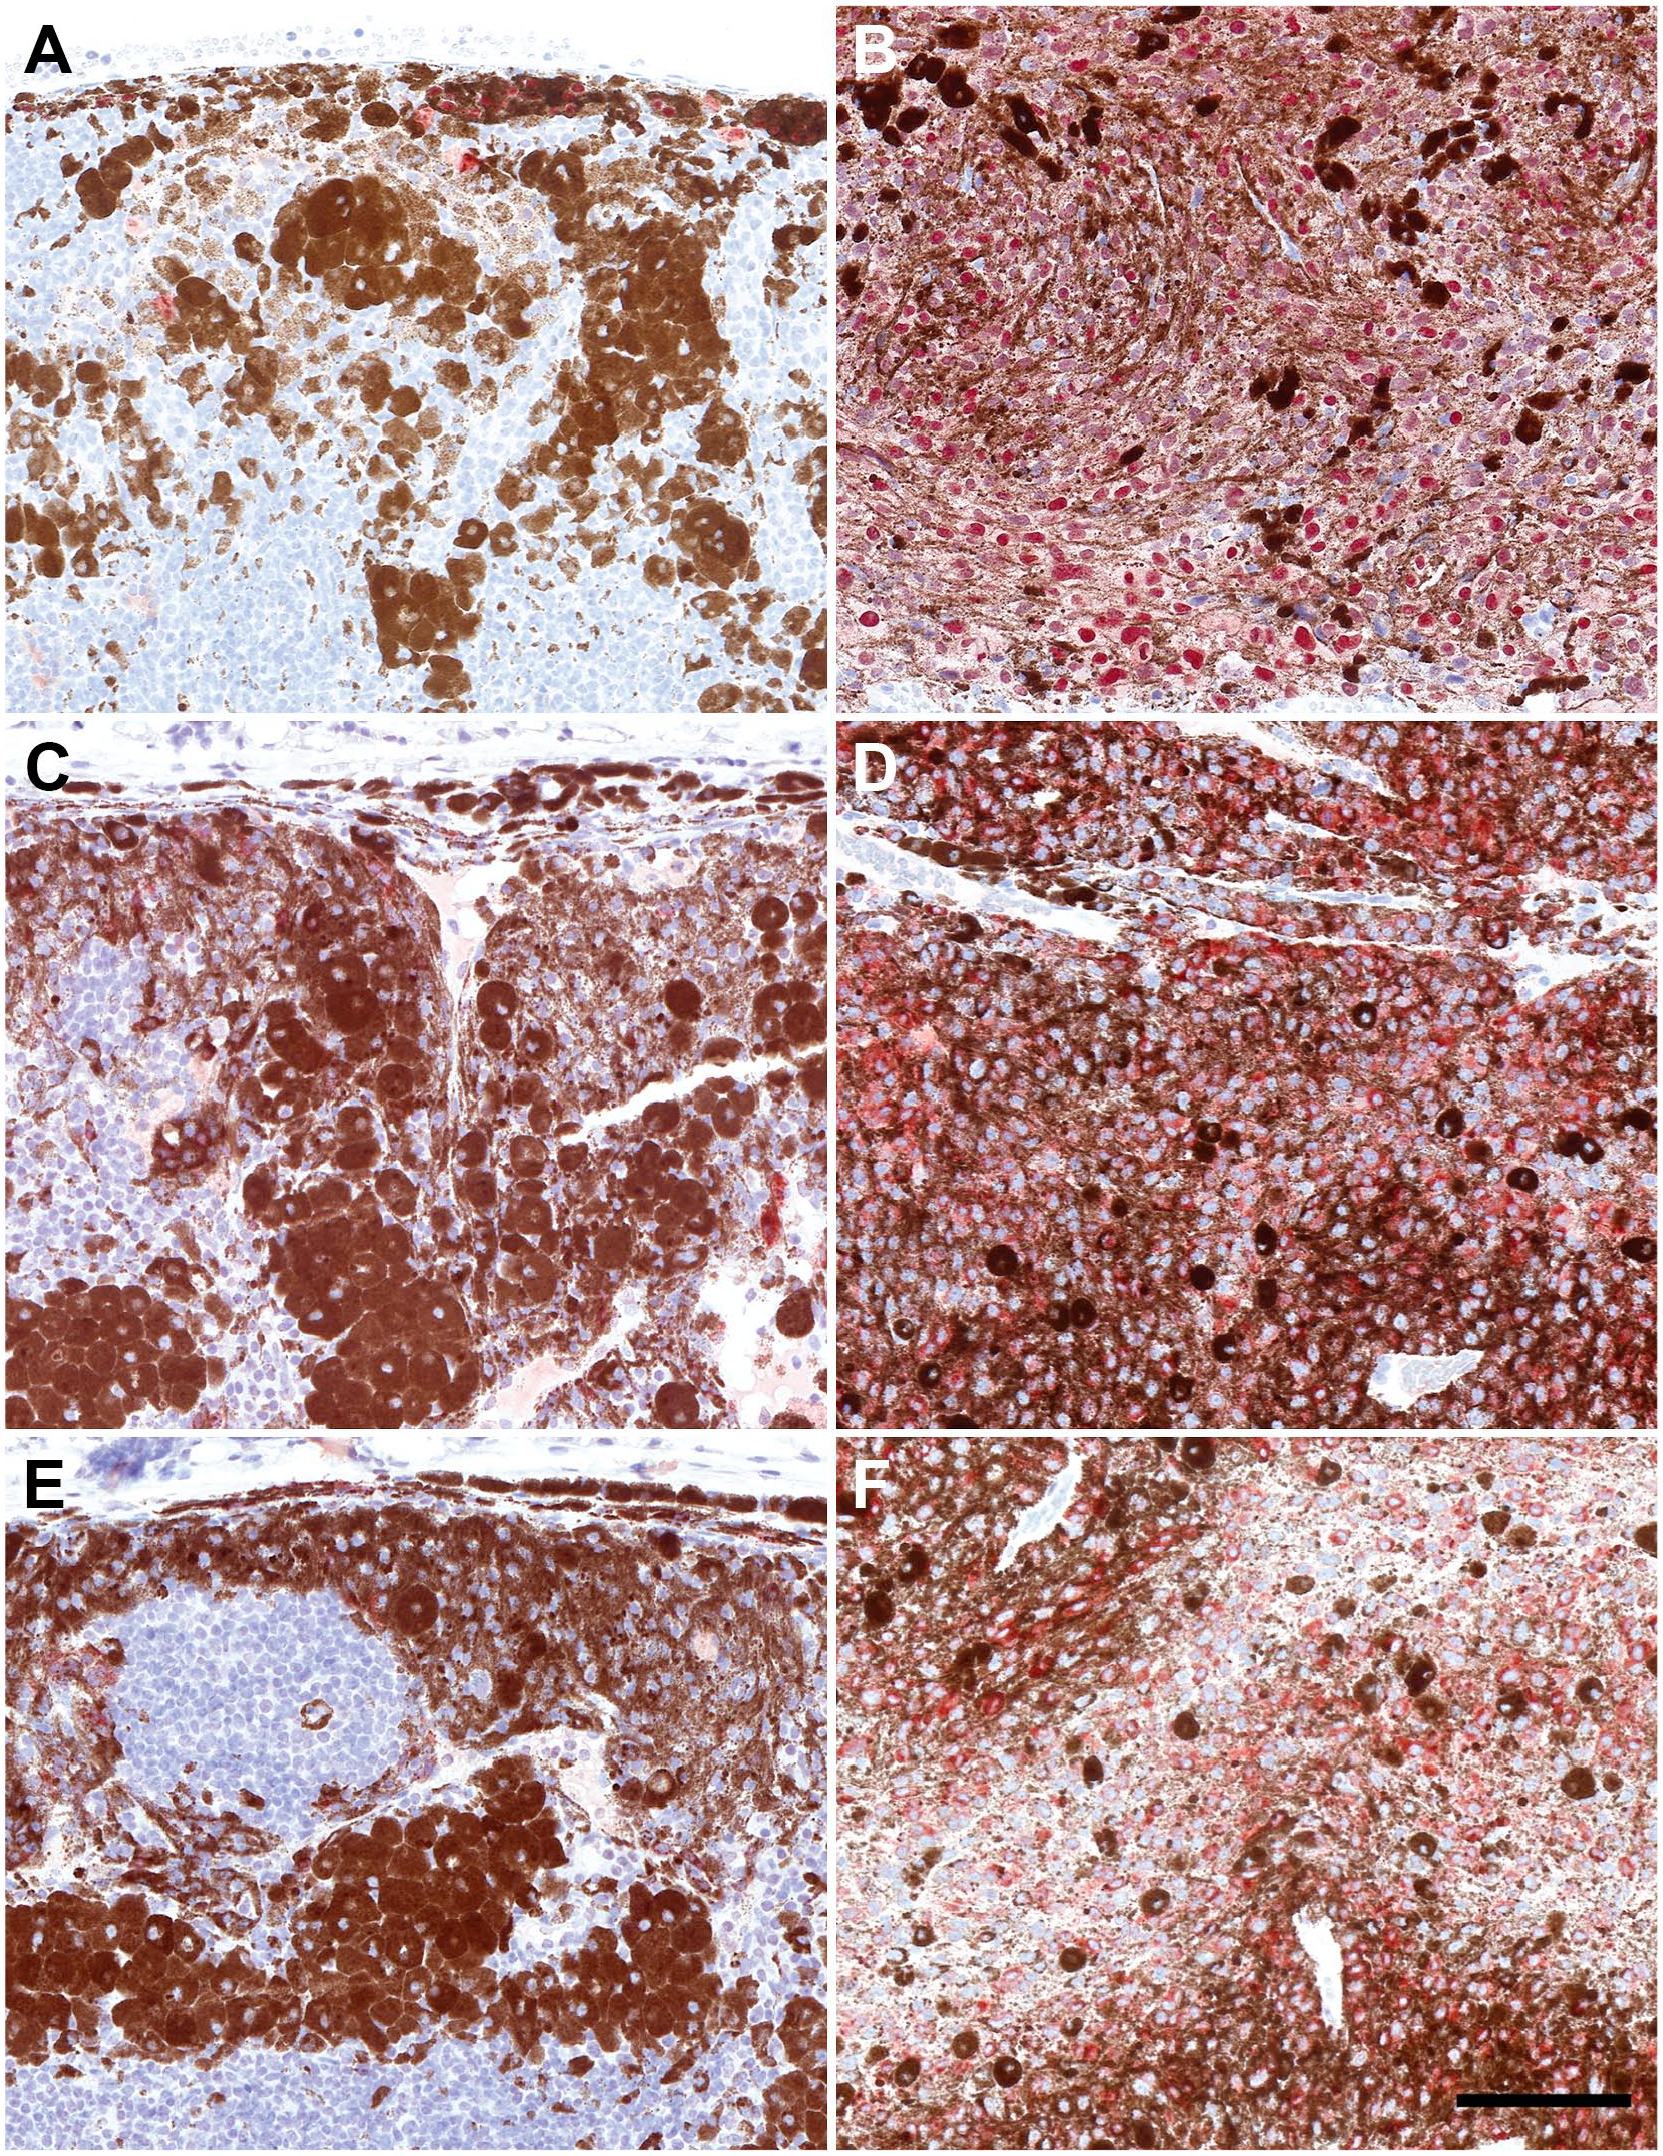
Tg(Tyr-NRAS*Q61K)1Bee transgenic mouse model and representative images of low- and high-grade cutaneous melanocytic lesions stained with MITF (A, B), melanocyte protein PMEL (gp100) (C, D), and nestin (E, F). For all three markers, a statistically significant increase is seen in high-grade lesions compared with low-grade lesions. Type A lesion MITF (A), type D lesion MITF (B), type A lesion nestin (C), type D lesion nestin (D), type B lesion PMEL (gp100) (E), and type D lesion PMEL (gp100) (F). Scale bar = 100 µm (for all panels). Abbreviation: MITF, microphthalmia-associated transcription factor.
Tg(Tyr-NRAS*Q61K)1Bee transgenic mouse model and representative images of low- and high-grade lymph nodal melanocytic lesions stained with MITF (A, B), melanocyte protein PMEL (gp100) (C, D), and nestin (E, F). For all three markers, a statistically significant increase is seen in high-grade lesions compared with low-grade lesions. Low-grade lesion MITF (A), high-grade lesion MITF (B), low-grade lesion nestin (C), high-grade lesion nestin (D), low-grade lesion PMEL (gp100) (E), and high-grade lesion PMEL (gp100) (F). Scale bar = 100 µm (for all panels). Abbreviation: MITF, microphthalmia-associated transcription factor.
In the skin, minimal and moderate IHC expression of nestin was described in type C and D lesions, respectively. No nestin expression was observed in the low-grade lesion categories type A and B. A similar association between levels of nestin expression and lesion grade was evident also in lymph nodal proliferations, with minimal to moderate IHC labeling recorded in high-grade lesions, whereas low-grade lesions were mainly negative (Figs. 2C and D, 3E and F, and 4E and F; Supplemental Fig. 13).
Proliferative Activity
The IHC analysis of the proliferative activity revealed that, both in the skin and in the lymph nodes, a clear association between Ki-67-positive cell ratio and lesion grade exists, with significantly increased proliferation in high-grade categories compared with low-grade lesions (Figs. 5A and B and 6A–F; Supplemental Fig. 13). No significant changes in Ki-67 values were found when type D skin lesions have been sorted and compared based on pigmentation levels or main cytological features of neoplastic melanocytes (Fig. 5C and D). In most of the proliferative lesions analyzed in this work, the proliferation of NRAS mutant melanocytes was accompanied by the concomitant expansion/hyperplasia of other cell populations, predominantly melanophages, which morphologically can be challenging to separate from the actual melanocytic component. Therefore, it has been critical to ensure that the assessment of the Ki-67 values in the single-stained chromogenic IHC samples is specific for the proliferation of mutant melanocytes without including melanophages or any other cell populations. To this end, the results of chromogenic Ki-67 IHC have been compared with the data resulting from the parallel analysis of IF samples where Ki-67-positive nuclei were counted only within the SOX-10-positive population of mutant melanocytes. Overall, the two sets of samples exhibited very similar results with a highly significant linear correlation between them (Fig. 5E). These outcomes confirmed the accuracy of the Ki-67 counts as assessed in the single-stained chromogenic IHC samples and indicated that the fraction of Ki-67-positive non-melanocytic cells populating the analyzed lesions is most likely negligible. Further supporting this evidence, IF staining combining the macrophage marker Iba1 and Ki-67 did not reveal any Ki-67 and Iba1 double-positive cell (Supplemental Fig. 10). Interestingly, the distribution of the Ki-67-positive cell ratio across the diverse lesion categories closely mirrored the pattern described for MITF. In this context, a highly significant linear correlation was demonstrated between Ki-67 and MITF values (Fig. 5F).
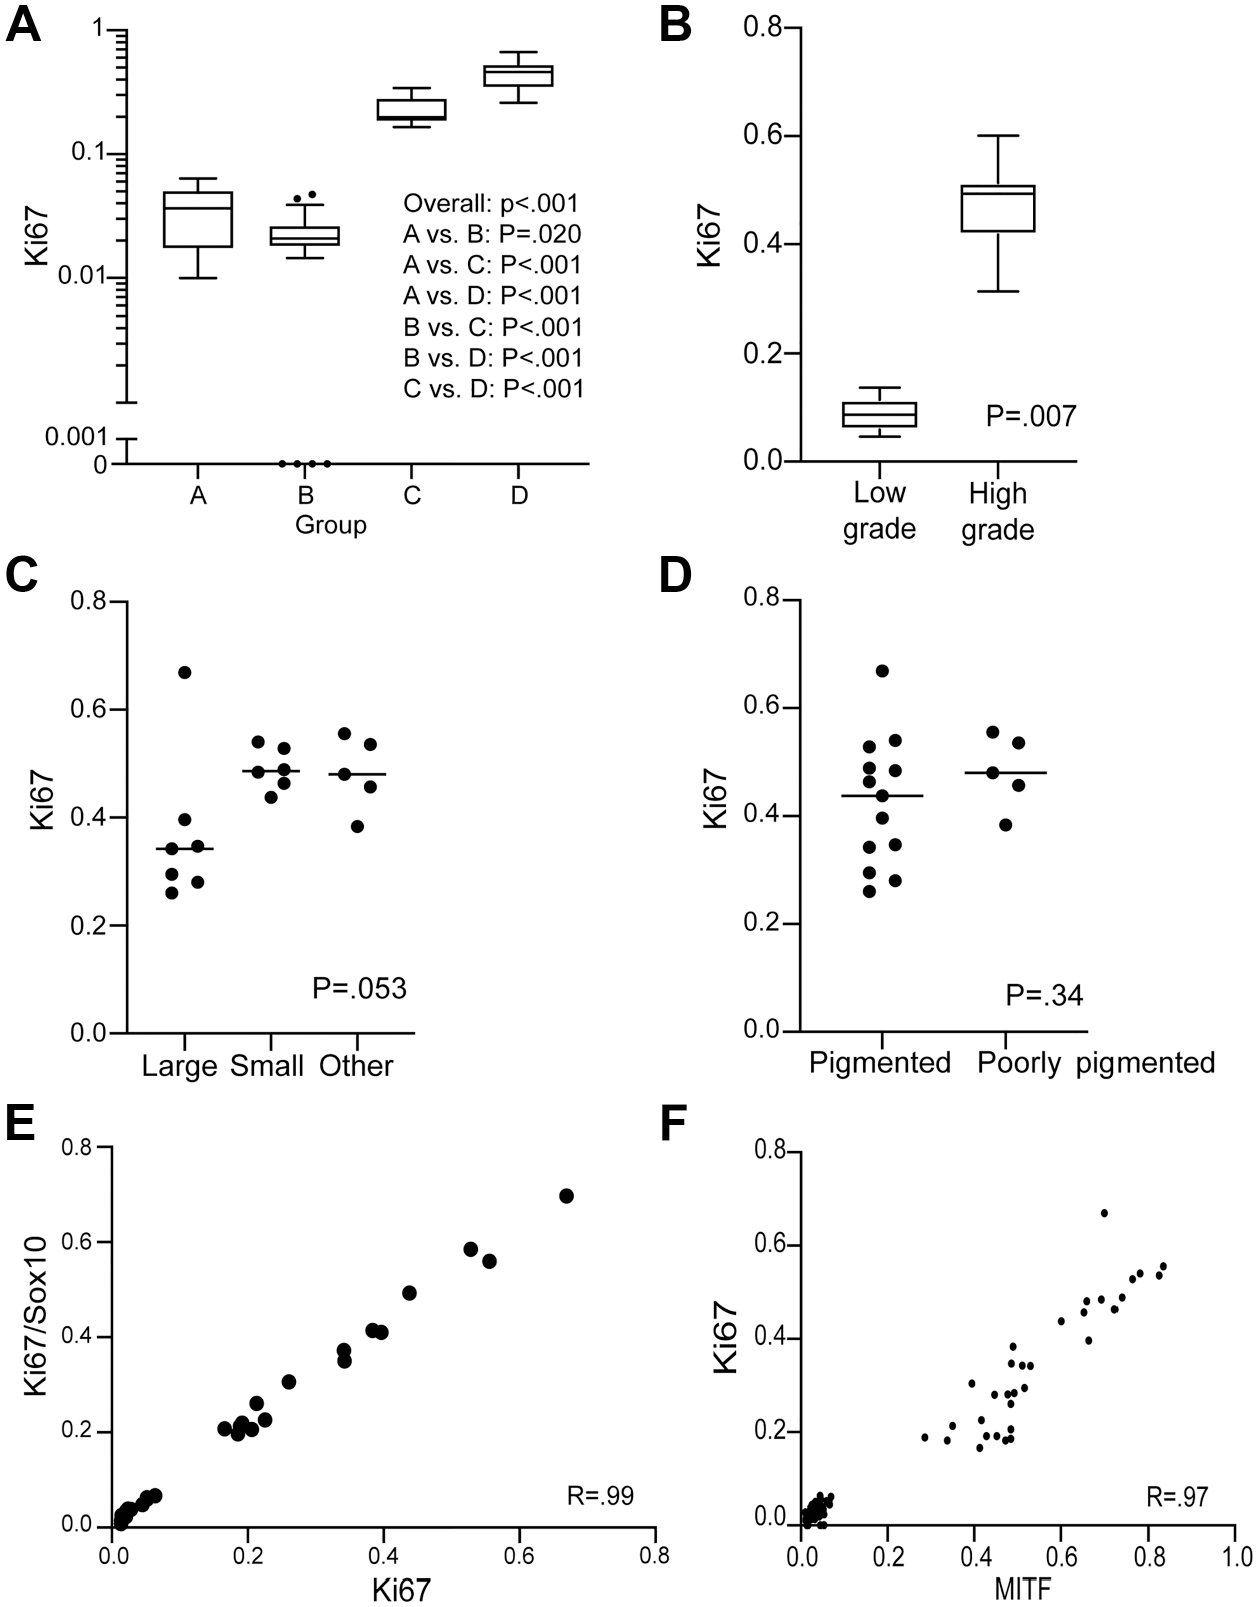
Analysis of Ki-67 immunohistochemical expression across the entire spectrum of melanocytic proliferation observed in the Tg(Tyr-NRAS*Q61K)1Bee transgenic mouse model. Ki-67 expression shows a statistically significant increased expression in high-grade categories compared with low-grade lesions (A, B). No obvious difference in proliferation rate is seen when comparing cell morphology (C) and level of pigmentation (D). A highly significant linear correlation between single-stain chromogenic Ki-67-positive cell counting and colocalized Ki-67 and Sox10 dual-positive cell counting confirms the vast majority of proliferating cells to be of melanocytic origin (E). A strong linear correlation between MITF and Ki-67 expression exists in all lesion types (F). Correlation between continuous variables was calculated as Pearson’s r using robust estimates of standard error. Abbreviation: MITF, microphthalmia-associated transcription factor.
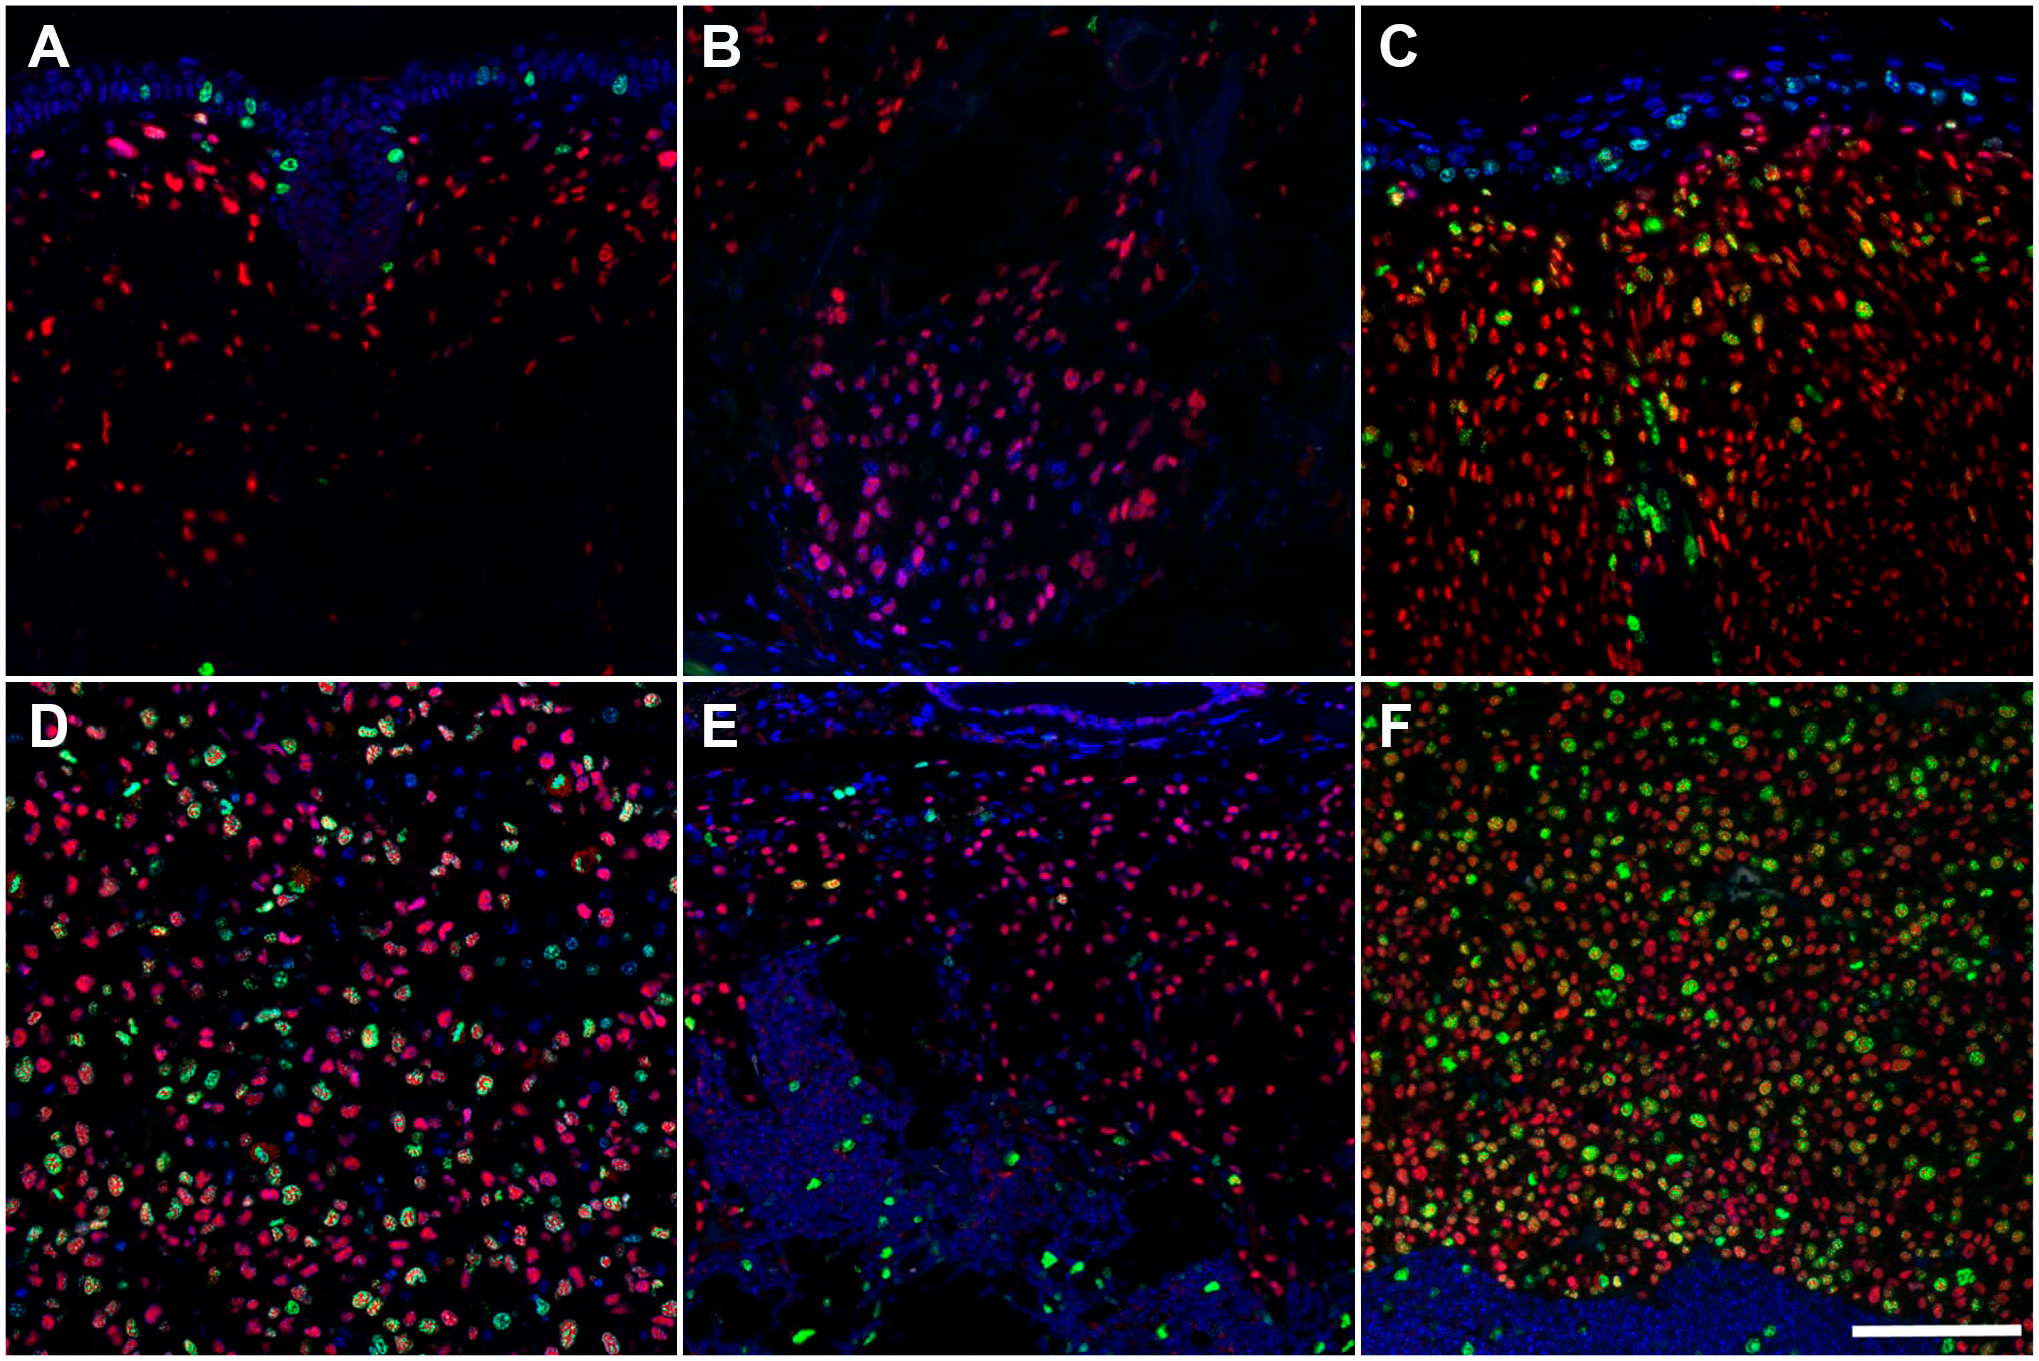
Representative images of duplex immunofluorescence analysis of Sox-10 and Ki-67 expression across the entire spectrum of melanocytic proliferation observed in the Tg(Tyr-NRAS*Q61K)1Bee transgenic mouse model (A–F). An increase in proliferation rate is seen in high-grade categories (C, D, F) compared with low-grade lesions (A, B, E). Cutaneous type A (A), type B (B), type C (C) and type D (D) lesions. Low-grade (E) and high-grade (F) lymph nodal lesions. Scale bar = 100 µm (for all panels).
Discussion
GEM models recapitulating recurrent genetic lesions of human CM are widely used in the preclinical setting to study in vivo the molecular pathogenesis of skin melanomagenesis. 23 However, fundamental differences exist between humans and mice regarding the biology of melanocytes, including their development, identity, distribution in the diverse cutaneous and non-cutaneous compartments, and susceptibility to malignant transformation.23,24 These inherent interspecies variations represent a major obstacle for the generation of autochthonous murine models that closely mimic the salient clinicopathological features of human CM.24–26 According to the Clark’s model, most human CM originate within the interfollicular epidermis and invade the dermis during the vertical growth phase of tumor progression.27,28 Distinctively, mouse skin lacks melanocytes in the interfollicular epidermis, with the skin of the tail, sole of the foot, and ear being the only exceptions. 29 Therefore, unless relevant oncogenic mutations are specifically targeted to the melanocytes populating the skin of these locations, CM reproduced in GEM models predominantly develop from dermal or hair follicle–associated melanocytes with no involvement of the interfollicular epidermis. This is especially true for those models exploiting the mouse tyrosinase promoter/enhancer regions to drive the expression of oncogenes.24–26 Due to these differences, the use of classical staging criteria for human skin melanomas, such as Breslow’s depth and Clark’s level of invasion or tumor ulceration, was not attempted. 30 The origin of neoplastic cells in pigmented epithelioid melanocytomas (PEM)/animal-type melanomas (ATM) in human patients has been reported to arise from the hair follicle and within an intradermal nevus, which is somewhat reminiscent of the lesions seen in mice. 31
Spontaneous melanomagenesis in other animal species, including canine, porcine, and equine melanomas, has been proposed as a better translational approach compared with GEM models. However, although some equine and canine melanomas have been shown to carry a similar mutation as the human mutant NRAS oncogene, these still represent the minority of cases.32,33 In this regard, the preclinical value of modeling melanoma in these larger animals has been limited, especially for the discovery of targeted therapy. In addition, unlike the mouse, these domestic species are not amenable for genetic manipulations, which greatly prevents their utilization to address specific mechanistic questions concerning the molecular aspects of melanomagenesis.
Therefore, despite all their limitations, GEM models of melanomagenesis proved to be and still represent a very instrumental preclinical tool, allowing gene discovery, combinatorial drug testing, and definition of tumor evolution models within an autochthonous microenvironment including a fully competent immune system setting.23,34,35 As currently there are no GEM lines that can faithfully reproduce the full sequence of events that characterize the Clark’s model of CM origin and progression, it becomes imperative to have a thorough understanding of the pathobiology of each murine model to identify specific disease features that may have preclinical relevance and translational potential. To this aim, our study contributes a comprehensive pathological assessment of the full spectrum of proliferative lesions driven by the oncogenic mutant NRAS in the mouse. Importantly, our works incorporates the analysis of relevant biomarkers in an attempt to improve the discrimination and overall biological interpretation of the diverse melanocytic lesion categories encountered in this model.
Based on the classification scheme previously developed by Campagne and colleagues, 18 we considered four lesion categories (i.e., lesion types A–D) to describe the cutaneous melanocytic proliferations. In their work, Campagne and colleagues proposed the use of the same four lesion types also for the classification of melanocytic proliferations in lymph nodes. Conversely, in line with the original description of the Tg(Tyr-NRAS*Q61K)1Bee transgenic mouse model reported by Ackermann and colleagues, 10 lymph nodal lesions in our study were simply classified as low-grade (interpreted as benign melanocyte hyperplasia) or high-grade (interpreted as malignant melanocyte proliferation) depending on the extent of tissue invasion/effacement and the presence or absence of cytological features of malignancy. In this context, we determined that the classification criteria used for the skin did not apply to the lymph node. In fact, the topographical distribution of melanocytic proliferations within the dermis and their relation to adnexa represent important cues to distinguish among diverse lesion categories in the skin, and these features cannot be assessed and translated into a different anatomic setting such as the lymph node.
While in some instances the metastatic nature of lymph nodal lesions included in our study could be assumed based on the identical morphology of neoplastic structures in the skin and regional lymph nodes, in other cases this correlation could not be made. Cutaneous melanocytic lesions in draining areas of affected lymph nodes were either significantly different in cellular morphology or absent all together. The metastatic versus primary nature of lymph nodal lesions remains, therefore, undetermined. Previous investigations have independently reported morphological discrepancies between melanocytic lesions in the skin and draining lymph nodes, as well as the development of melanocytic proliferations in the lymph nodes not associated with primary cutaneous lesions (or any other organs).10,18 Altogether, these observations leave open the hypothesis that in mice carrying the Tg(Tyr-NRAS*Q61K)1Bee transgene, lymph nodes might represent a primary site of melanomagenesis. Interestingly, primary lymph nodal nevi and melanomas without associated cutaneous or mucosal lesion have been described in humans.36,37 Benign melanocytic rests with striking histopathological similarities to the low-grade lesions observed in the mouse lymph nodes are also frequently diagnosed in melanoma patients.10,38 In conclusion, although metastatic dissemination to the lymph nodes has been reported as a distinct feature of mice carrying the Tg(Tyr-NRAS*Q61K)1Bee transgene,10,39,40 ad hoc investigations using lineage tracing approaches and/or test by transplantation are necessary to determine the metastatic potential of CM in this model.
Both in the skin and in the lymph node, we observed widespread expression of SOX-10 in melanocytic proliferations without any significant variations across different lesion categories. The transcription factor Sox10 is a key regulator of neural crest development and is expressed throughout all stages of melanocyte differentiation.41,42 Shakhova and colleagues 12 demonstrated that SOX-10 is a very sensitive and reliable marker for the identification of both human and murine melanocytic proliferation driven by the NRAS oncogene. The same study also proved that Sox10 haploinsufficiency efficiently counteracts melanomagenesis in Tg(Tyr-NRAS*Q61K)1Bee mice (regardless of their Cdkn2a status), establishing the critical role that Sox10 plays in promoting the formation and maintenance of both low- and high-grade melanocytic lesions. Because of its diffuse expression across the entire spectrum of murine melanocytic proliferations driven by the Tg(Tyr-NRAS*Q61K)1Bee transgene, SOX-10 per se does not have practical diagnostic utility for the determination of lesion grade. Nevertheless, the use of SOX-10 IHC can be helpful when the histopathological identification of small melanocytic proliferations is made particularly challenging by the massive accumulation of melanophages. In addition, as illustrated in our assessment of the proliferative activity, multiplex IF including SOX-10 represents a valuable strategy to normalize the expression analysis of a specific molecular target to the melanocyte population.
Our data indicate that, for both skin and lymph node, MITF expression is significantly associated with lesion grade with a remarkable increase in MITF levels in high-grade melanocytic proliferations and minimal expression in low-grade lesions. Interestingly, an identical trend has been observed for Ki-67, establishing an important positive correlation among MITF expression levels, proliferation, and histopathological grade in oncogenic NRAS-driven mouse melanomagenesis. Further underlying the value of the classification scheme proposed by Campagne et al., 18 compared with type A and B lesions, a significant increase in MITF and Ki-67 expression has been consistently detected in cutaneous type C lesions, which are considered intermediate-grade entities comparable to dysplastic nevi in humans and potential precursors of melanomas. 17
Under physiological conditions, MITF acts as a master regulator of melanocyte differentiation, proliferation, and survival, 43 and its main function appears to be well conserved across species.44,45 However, MITF plays a multifaceted role during melanomagenesis, and its complex biology in this setting has produced seemingly conflicting notions.46–49 On the one hand, the transcriptional program orchestrated by MITF is crucial to maintain melanocyte survival during transformation and promote melanoma expansion and progression.43,50 In oncogenic NRAS-driven melanoma, the MITF/BCL2 axis is also important to confer resistance to MEK inhibitors and prevent apoptosis in transformed melanocytes. 51 On the other hand, both in human and in murine oncogenic NRAS-driven melanoma, MITF downregulation appears necessary to activate an epithelial-to-mesenchymal transition (EMT)-like process, known as phenotype switching, that contributes to the acquisition of an invasive and metastatic state, as well as resistance to multiple targeted drugs.52–58 According to this paradigm, the phenotypic plasticity that characterizes malignant melanocytes allows for a very dynamic and finely tunable regulation of MITF transcriptional program. Although melanoma cells expressing MITF at high level exhibit a proliferative phenotype, low activity of MITF is related to invasive potential. Finally, long-term MITF downregulation drives cell senescence.47,58,59 It is unclear how the interpretation of the findings emerging from our study may align with this complex mechanistic scenario. We can speculate that the significantly increased expression of MITF and Ki-67 in high-grade lesions is compatible with a prevalent proliferative phenotype, whereas the scarce expression of MITF and Ki-67 in low-grade lesions may reflect the development of oncogene-induced senescence, which is a well-documented outcome in mouse models of melanoma.60,61 Nevertheless, as demonstrated by a growing number of clinical studies across different species, increased expression of Ki-67 in melanocytic proliferations is significantly associated with features of malignancy and poor prognosis, including worse survival, metastatic progression, high recurrence rate, and therapeutic resistance.62–67
As seen for MITF and Ki-67, the evaluation of nestin IHC resulted in a sharp separation between high-, intermediate-, and low-grade lesions in the skin as well as high- and low-grade lesions in the lymph node. Notably, nestin expression in Tg(Tyr-NRAS*Q61K)1Bee transgenic mice has been previously described by Ackermann and colleagues 10 in their original characterization of the model. Similar to what we observed, they reported nestin expression only in a small fraction of malignant melanocytes from high-grade lesions, such as primary melanoma and metastases, whereas virtually no expression is present in low-grade lesions. 10 Nestin is an intermediate filament protein that was first described as a marker of neural progenitor cells during development of the central nervous system. In humans, nestin has emerged as a prognostic marker more strongly expressed in CM, compared with benign melanocytic skin lesions, and increasingly expressed in advanced-stage melanomas.68–70 Interestingly, the same is also true for the distinction of benign and malignant melanocytic proliferations in lymph nodes. 71
Both for cutaneous and for lymph nodal proliferations, an increase in gp100 expression was observed in high-grade lesions. The melanocyte protein PMEL (also referred to as PMEL, gp100, HMB-45, or Pmel17), a transmembrane glycoprotein specifically involved in the maturation of melanosomes in pigment cells, is known to be differentially expressed in different subsets of cutaneous melanocytes and in the resulting proliferative lesions including nevi and melanomas. 72 Remarkably, type B lesions included in our study were consistently negative for gp100 expression. In the Tg(Tyr-NRAS*Q61K)1Bee transgenic model, the four main types of skin lesions (from type A to type D) were originally identified in a putative increasing order of malignancy and progression. 18 However, the lack of gp100 expression clearly separates type B lesions from other types of skin proliferations. This suggests that type B lesion might not be part of the proposed linear progression of skin melanomagenesis, and distinct origins and/or divergent pathways of differentiation should be considered for this lesion category.
Curiously, two of the mice included in our study developed cutaneous tumors characterized by a peripheral nerve sheath tumor–like phenotype. Poorly pigmented neoplasms with similar characteristics have already been described in a mouse model of melanoma driven by an inducible oncogenic Braf allele under the Tyr promoter. 26 Lineage tracing experiments clearly confirmed that these tumors originate from hair bulb melanocytes following a divergent pathway of differentiation reminiscent of the one observed in human melanomas with neurotization and/or Schwannian differentiation.26,73
An additional aspect of novelty included in our work is the use of mice carrying the Cdkn2atm2.1Rdp mutant allele where p16 function is impacted, whereas p19 expression is preserved. This allelic variant is different from the Cdkn2atm1Rdp mutation originally used by Ackermann and colleagues, as well as in many subsequent works, where both p16 and p19 functions are lost.10,18,20 One of the major drawbacks of the Cdkn2atm1Rdp germline mutation is that the loss of tumor suppressor functions of both p16 and p19 results in the early development of spontaneous sarcoma and hematolymphoid malignancies with high penetrance. 20 Therefore, in the context of Tg(Tyr-NRAS*Q61K) transgenic mouse model, the advantage of replacing the Cdkn2atm1Rdp allele with the Cdkn2atm2.1Rdp mutation is the reduced penetrance of these spontaneous non-melanocytic neoplasms. 21
A limitation of our study has been the lack molecular and genomic analysis on each individual melanocytic lesion. While a more comprehensive molecular profiling was outside the scope of our experiment, we recognize the importance of addressing such aspect in future studies. This would allow for a more granular refinement of lesion classification combining both clinicopathological features and associated oncogenic mechanisms. A deeper understanding of the molecular profile of different melanocytic proliferations would also promote the generation of more accurate mouse-specific classification terms, avoiding the use of questionable diagnostic designations, such as nevi, that represent unique human entities.17,18
In conclusion, our study delineates the diverse pathological outcomes of oncogenic NRAS-driven melanomagenesis in the widely used Tg(Tyr-NRAS*Q61K) transgenic mouse. The integration of MITF, Ki-67, gp100, and nestin analysis into the histopathological classification/grading scheme of melanocytic proliferations described for this model provides an accurate means to establish nature and evolution of the phenotype, monitor disease progression, and predict response to experimental treatment or other preclinical manipulations.
Supplemental Material
sj-pdf-1-jhc-10.1369_0022155420977970 – Supplemental material for Classification and Grading of Melanocytic Lesions in a Mouse Model of NRAS-driven Melanomagenesis
Supplemental material, sj-pdf-1-jhc-10.1369_0022155420977970 for Classification and Grading of Melanocytic Lesions in a Mouse Model of NRAS-driven Melanomagenesis by Charles-Antoine Assenmacher, Sara F. Santagostino, Mark A. Oyama, Jean-Christophe Marine, Elise Bonvin and Enrico Radaelli in Journal of Histochemistry & Cytochemistry
Footnotes
Acknowledgements
We thank Lorna Adoyo Omodho (VIB-KU Leuven Center for Cancer Biology) and Annick Francis (KU Leuven Stem Cell and Developmental Biology Department) for their help with sample preparation.
Author Contributions
ER and EB conceived and designed the study; ER, EB, and JCM contributed samples, reagents, and/or other analytical tools; ER, EB, and CAA collected the data; ER, CAA, SFA, and MAO analyzed the data; ER and CAA wrote the paper; all authors have read and approved the final version of the manuscript.
Competing Interests
The author(s) declared no potential conflicts of interest with respect to the research, authorship, and/or publication of this article.
Funding
The author(s) disclosed receipt of the following financial support for the research, authorship, and/or publication of this article: The generation of the transgenic mice was funded by a grant from the Fonds de la Recherche Scientifique (FNRS). No other funding was received for the publication of this manuscript.
References
Supplementary Material
Please find the following supplemental material available below.
For Open Access articles published under a Creative Commons License, all supplemental material carries the same license as the article it is associated with.
For non-Open Access articles published, all supplemental material carries a non-exclusive license, and permission requests for re-use of supplemental material or any part of supplemental material shall be sent directly to the copyright owner as specified in the copyright notice associated with the article.