
Abstract
Picrosirius red (PSR) staining is generally used to evaluate liver fibrosis; however, PSR sometimes causes nonspecific nuclear staining. In this study, we evaluated the ability of phosphomolybdic acid (PMA) pretreatment to prevent nonspecific nuclear staining by PSR. In a manual evaluation of 27 non-tumor samples from patients with hepatocellular carcinoma, nonspecific nuclear staining was observed in 3.7% of PMA-treated specimens, compared with 85.2% of untreated specimens. Conversely, computer-assisted image analysis (CAIA) identified nonspecific nuclear staining in 0% of PMA-treated samples, vs 44.4% of untreated samples. Surprisingly, after mounting, PMA-treated specimens exhibited a blue tinge because of molybdenum blue (MB) production following sunlight exposure or virtual slide scanning. Using UV cut film, MB production induced by sunlight exposure was prevented; however, the film did not prevent MB production during virtual slide scanning. Moreover, only blue light–emitting diode exposure resulted in a blue tinge in PMA solution. Our data indicated that PMA pretreatment is effective for evaluating liver fibrosis using CAIA. Meanwhile, improvements in virtual slide scanning protocols would directly improve the quality of PMA-pretreated specimens subjected to CAIA:
Keywords
Introduction
Chronic hepatitis, a serious liver infection commonly caused by hepatitis B or C virus infection, non-alcoholic steatohepatitis, and other conditions, eventually leads to liver cirrhosis and hepatocellular carcinoma. Interferon-γ (IFN-γ) has recently been used in the treatment of viral hepatitis, and the therapeutic effect has been evaluated using various serum indices and histopathological examination of liver tissue. The use of histological indices, including the Ishak score1–5 and the Histological Activity Index (HAI) score, is limited by interobserver variance. 6 Recently, specimens have been objectively evaluated by quantifying collagen fibers using image analysis.3,4,7,8 For example, Goodman et al. 3 observed a 65% increase in fibrosis 48 weeks after the initial evaluation, although Ishak stage was unchanged in 64% of patients. Similarly, Hui et al. 4 reported that Ishak stages 1–3 and 4–6 can be discriminated via image analysis of picrosirius red (PSR)-stained specimens.
Several staining methods such as Sirius red staining, Masson’s trichrome staining, elastica van Gieson staining, orcein staining, and immunohistochemistry for collagen and α-smooth muscle actin are used to evaluate liver fibrosis.7,9,10 Moreover, PSR staining was used in most reports as a single dye, and the contrast between picric acid background and Sirius red F3B–stained collagen fibers is clear using PSR staining than other methods.1–4,9 PSR staining can be used to quantify collagen fibers in the periportal, perisinusoidal, and pericentral areas in patients with liver fibrosis. However, Brotchie et al. 11 observed nonspecific nuclear staining in the connective tissue of the optic nerve using PSR, and this nonspecific staining was prevented by pretreatment with phosphomolybdic acid (PMA). However, no prior study has used PSR staining with PMA pretreatment to evaluate liver fibrosis.
In this study, we examined the utility of PSR staining with PMA pretreatment for assessing faint fibrosis in the hepatic sinusoidal area. In addition, the study also examined the cause of molybdenum blue (MB) production.
Materials and Methods
Samples
The specimens used in this study were collected from Gunma University Hospital between January 1, 2017, and March 31, 2019. In total, samples from 27 patients who underwent surgery for hepatocellular carcinoma (23 males and 4 females; mean age, 71.2 years) were included in this study. This study was approved by the Gunma University Ethical Review Board for Medical Research Involving Human Subjects. The tissues were initially fixed in 10% formaldehyde and embedded in paraffin wax. Sections were cut at a thickness of 4 µm and stained with hematoxylin and eosin (H&E) and PSR.
H&E Staining
After deparaffinizing the tissue sections, the specimens were immersed in Mayer’s hematoxylin (new hematoxylin solution for H&E staining Type M; Muto Pure Chemicals Co., Ltd., Tokyo, Japan) for 10 min. The specimens were then washed under running water to stabilize the color of the nuclei. Furthermore, the specimens were immersed in eosin (new eosin solution Type M; Muto Pure Chemicals Co., Ltd.) for 3 min. After dehydration and permeation, the specimens were sealed using hydrophobic mounting medium (Malinol; Muto Pure Chemicals Co., Ltd.). These slides were used for non-cancerous area determination.
PSR Staining
In this study, we used two protocols for PSR staining, including with (PMA(+)PSR) and without PMA pretreatment (PMA(−)PSR).11,12 These protocols are presented in Table 1. PMA (12 molybdo (VI) phosphoric acid n-hydrate, H3(PMo12O40) • nH2O) and PSR (CI35780) were purchased from FUJIFILM Wako Pure Chemical Corporation (Osaka, Japan). Saturated picric acid solution was purchased from Muto Pure Chemicals Co., Ltd.
The Protocols of PSR Staining.
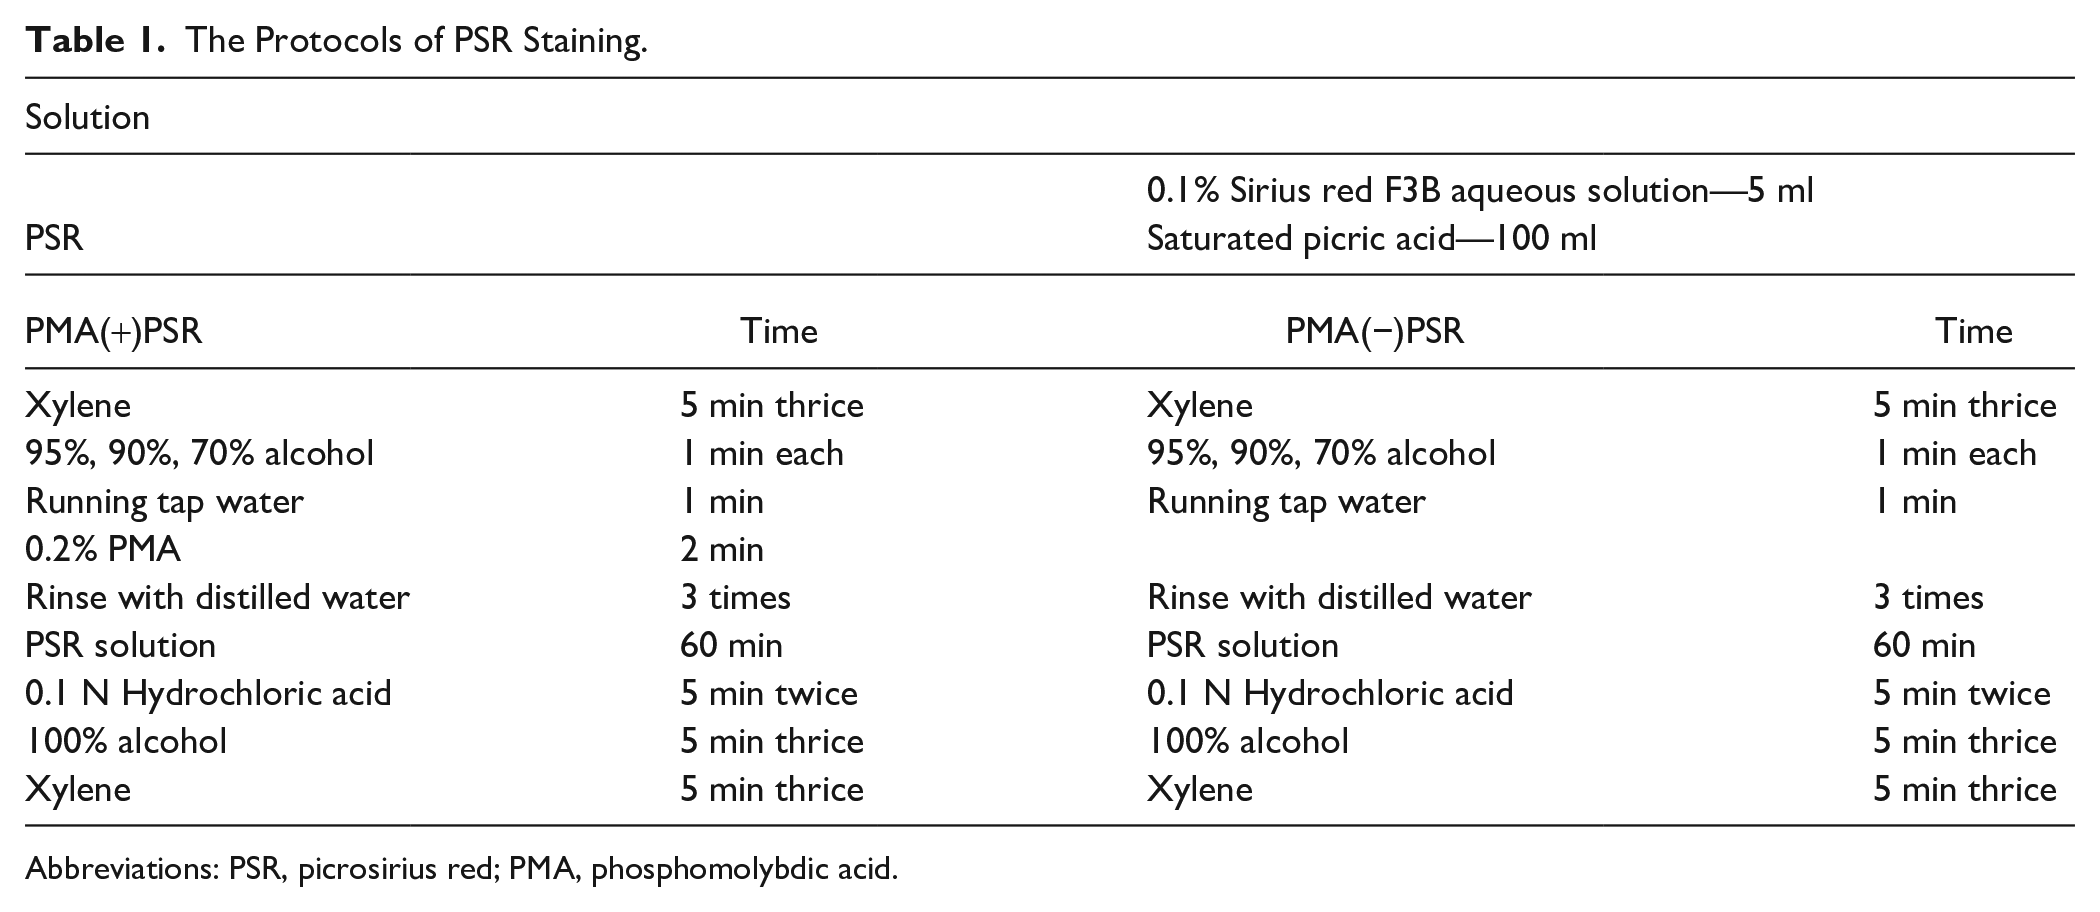
Abbreviations: PSR, picrosirius red; PMA, phosphomolybdic acid.
Sunlight Exposure
The specimens were stored for 24 hr near the windows on the north side of our laboratory. The actual duration of sunlight exposure was approximately 10 hr, as sunrise was 6:30 a.m. and sunset was 4:30 p.m. in December according to publicly available data from the Ministry of Land, Infrastructure, Transport and Tourism/Japan Meteorological Agency.
Ultraviolet Light Exposure
The specimens were placed on the top of an ultraviolet (UV) transilluminator (UV Transilluminator MD-20, 312 nm; Wealtec Corporation, Sparks, NV) in a side up position and covered with a dark box to protect the operator from exposure to UV light. The UV light of the transilluminator was then activated.
Blocking of UV Light Using a UV-cut Film
To examine the effect of UV radiation during exposure to sunlight, UV light from a UV transilluminator, and light from a virtual slide scanner (VSS), a UV-cut film (LINTEC Corporation; Tokyo, Japan) was placed over the slides. According to the manufacturer’s description, this film can block 99.5% of UV radiation (UV-A and UV-B) from sunlight. The film was placed on the surface side of the slides when the specimens were exposed to sunlight. Conversely, when the specimens were placed on the UV transilluminator or VSS, the UV-cut film was placed on the backside of the slides.
Scanning Condition of the VSS
Specimens were scanned using a VSS (Nano-Zoomer-SQ C13140-01; Hamamatsu Photonics K.K., Shizuoka, Japan) under the following conditions: objective lens, 20×; numerical aperture, 0.75; scan mode, 40×; maximum capture size: 26 mm × 76 mm; pixel size, 0.23 µm/pixel; light source, light-emitting diode (LED); image storage format, JPEG; and focus mode, manual focus mode.
Microscopic Images of Specimens
To capture images of the specimens, a light microscope (BX51; Olympus, Tokyo, Japan) equipped with a digital camera (DP-22; Olympus) was used with a 40× objective lens. The images were captured using computer software (cellSens; Olympus) with auto white balance and manual focus. The images were saved as TIFF files (1920 pixels × 1140 pixels). For polarized observation, a differential interference contrast (DIC) prism was inserted into the lens barrel, and a polarizer was placed on the filter holder. The polarizer was rotated clockwise until the sample was polarized.
Loupe Images of Specimens
Loupe images of specimens were taken using a digital camera (Canon EOS Kiss Digital DS6041; Canon, Tokyo, Japan) with a 28-mm lens, auto white balance, and auto focus. During photography, the specimens were placed on white book paper in 20-cm LED Portable Photo Studio (Shenzhen PULUZ Technology Limited; Shenzhen, China). Before evaluating the color of each image of the specimens, we adjusted the background level based on the level of whiteness of the white book paper using the “level adjustment function” of Adobe Photoshop CS6 (Adobe Systems Incorporated; San Jose, CA), followed by the “level adjustment” function.
Evaluation of MB Production in the Specimens
To evaluate MB production, the specimens were incubated with PMA alone. Loupe slide images were taken as described in the “Loupe images of specimens” subsection. During image processing using Adobe Photoshop CS6, the white background was processed as described previously. Meanwhile, in this experiment, the color image was converted to grayscale using Adobe Photoshop CS6, and then the gray intensity was evaluated using the brightness tracking function of Image Pro 10 (Nippon Roper; Tokyo, Japan).
Evaluation of MB Production Following Exposure to LED Light
To evaluate MB production following exposure to LED light, an Eppendorf tube containing 1 ml of 0.18% PMA in 10% ethanol was directly contacted with one tip of a tape-type three-color LED strip (BELITE Music Activated LED Strip; Guangdong Belite Lighting Technology, Guangdong, China). The tape-type LED strip was connected to a controller, and the tube containing the LED strip was shielded from room light in a closed box (Supplemental Fig. 3). Furthermore, exposure to red, green, blue, and white light (i.e., all red, green, and blue LEDs were in the light-up condition) was performed continuously for 24 hr. After LED exposure, loupe images were taken.
Results
PMA Prevented Nonspecific Nuclear Staining Following PSR Exposure
Nonspecific nuclear staining was observed in parts of PMA(−)PSR-stained specimens. However, it was extremely difficult to calculate the exact frequency of nonspecific nuclear staining among all nuclei in a specimen. Thus, we investigated the effect of PMA pretreatment on PSR staining by evaluating the number of nuclei exhibiting nonspecific staining among all nuclei in five representative images for each specimen (Fig. 1A–E). Of lesions from 27 patients, nonspecific nuclear staining was observed in 12 lesions (44.4%) subjected to PMA(−)PSR staining (Fig. 1A). Conversely, no nuclear staining was observed in PMA(+)PSR-stained samples. Indeed, when PMA(−)PSR-stained specimens were analyzed using image analysis software to assess the color range of Sirius red, the dye stained both collagen fibers and the color range of Sirius red was detected in PMA(+)PSR-stained specimens.
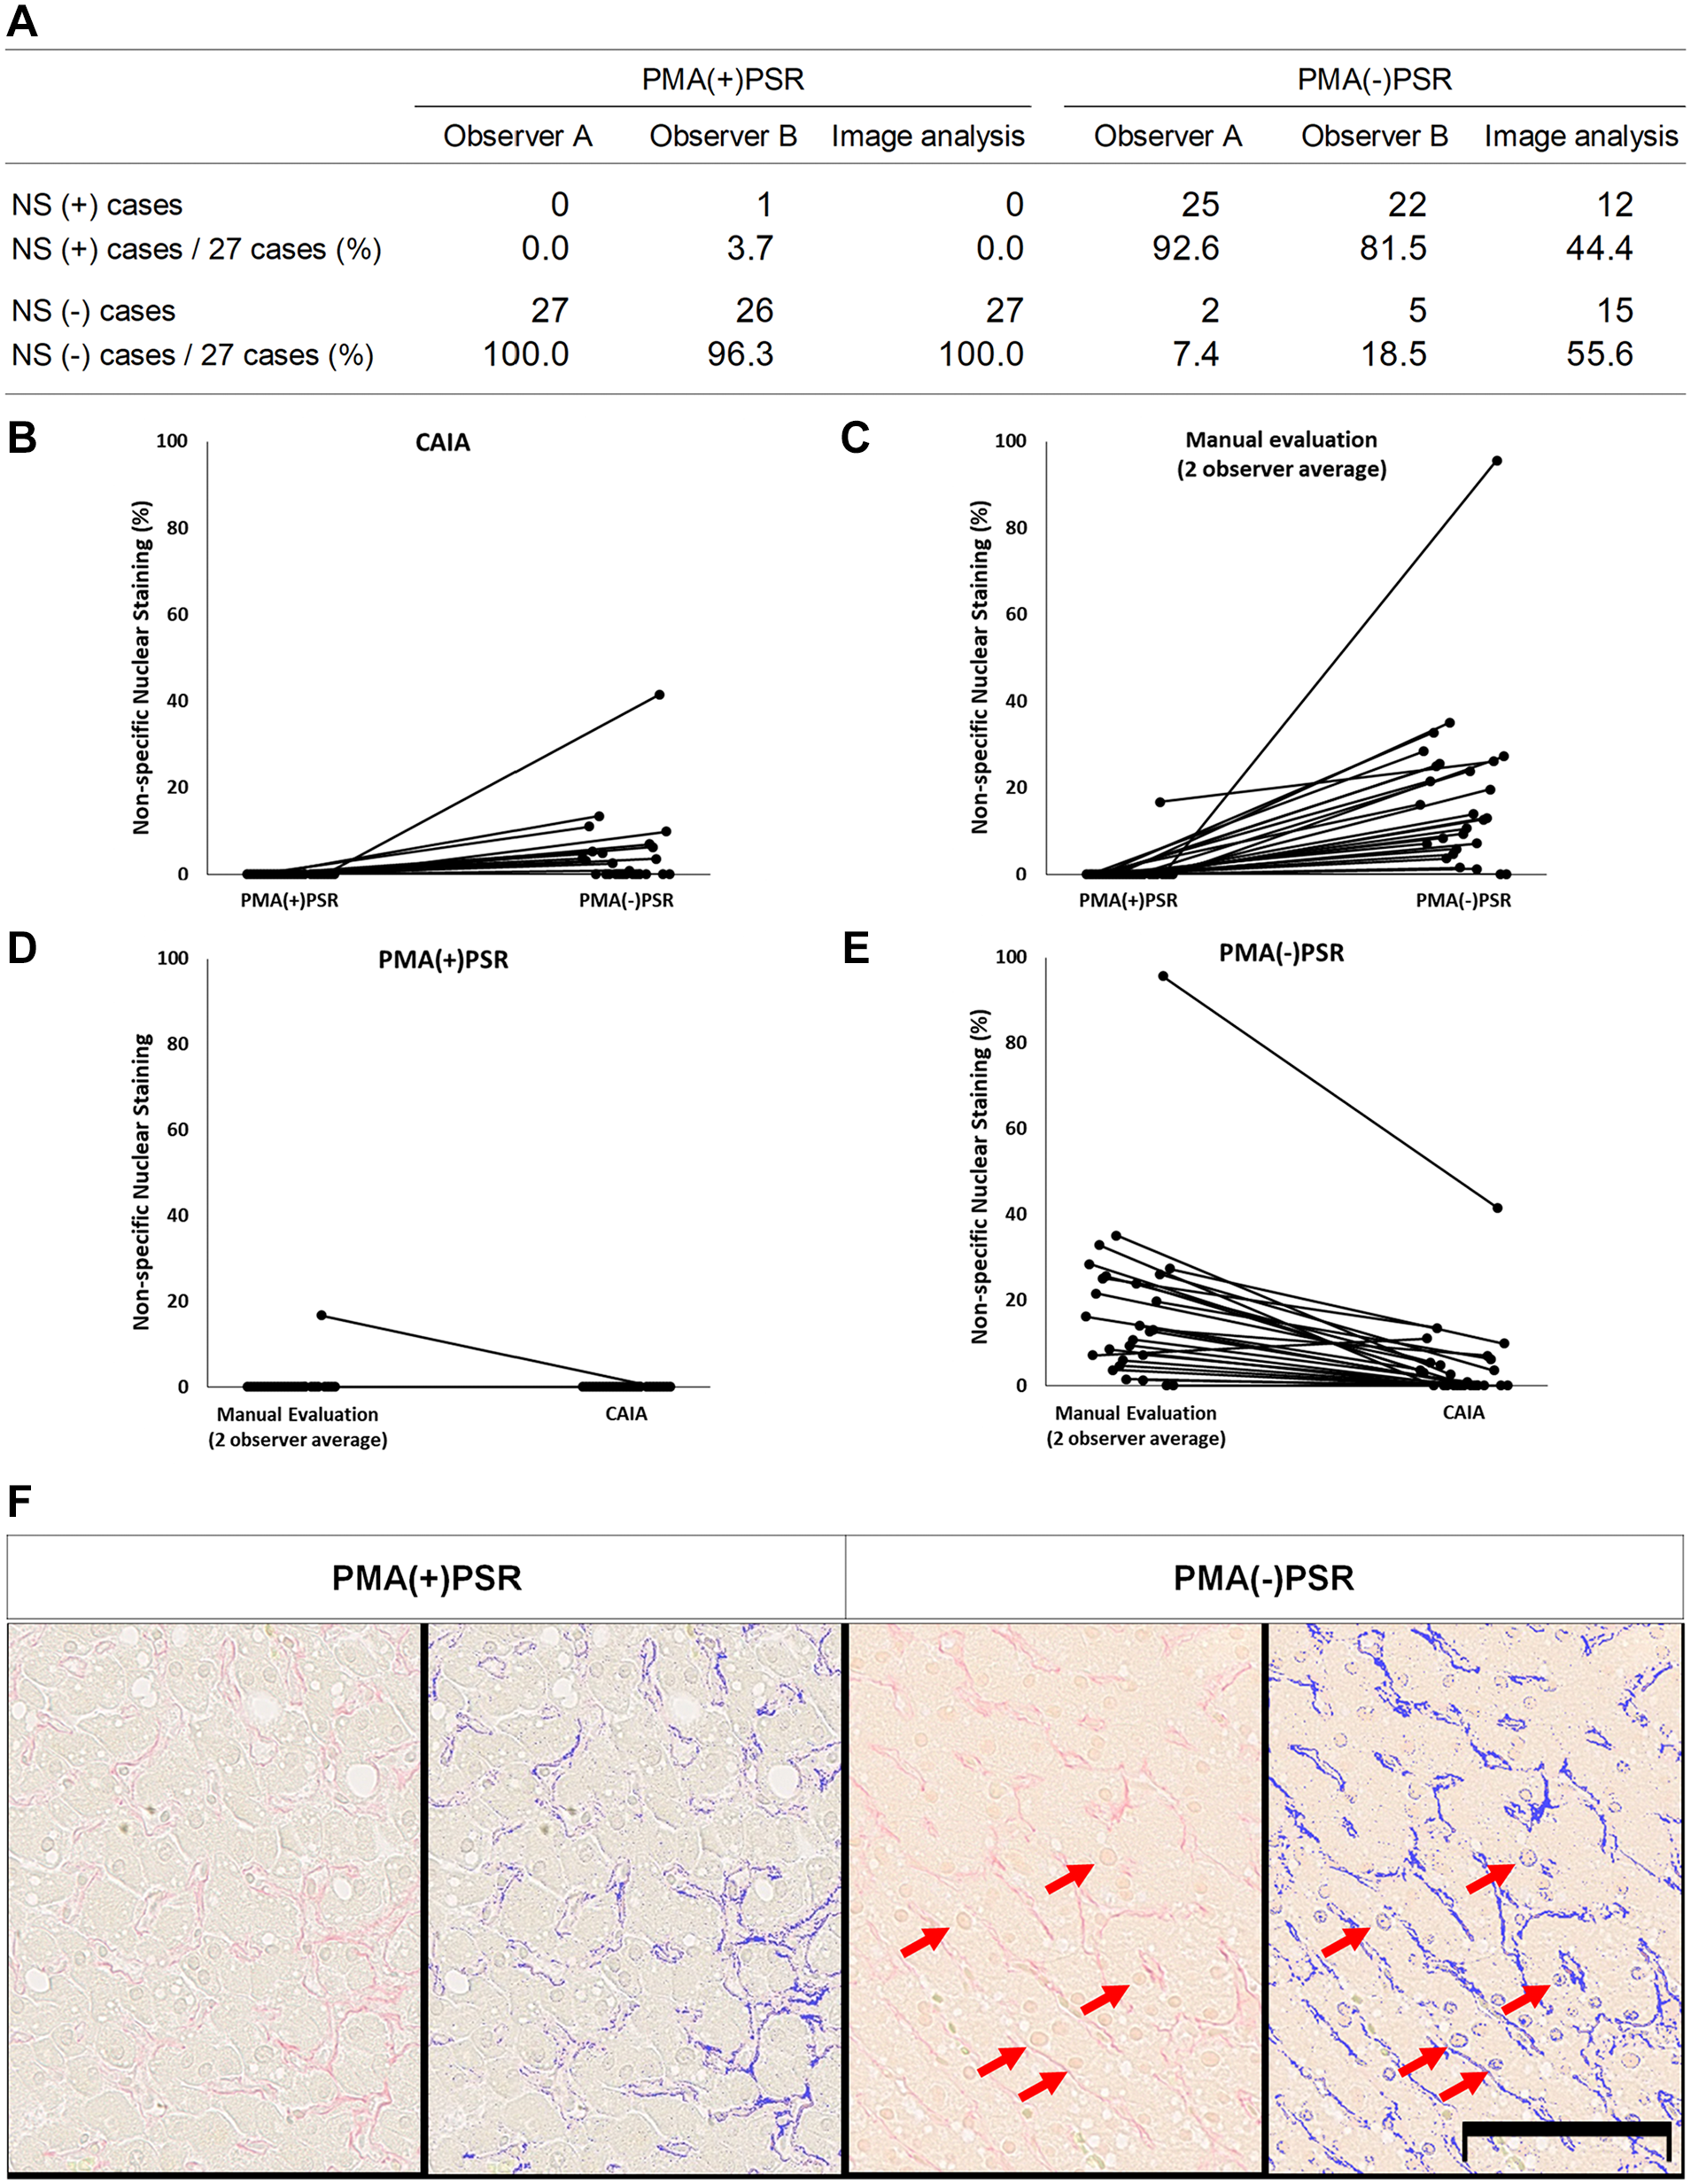
PMA suppresses nonspecific nuclear staining by Sirius red. (A) Case-based summary of nonspecific nuclear staining. (B–E) The percentage of nonspecific nuclear staining among all nuclei in five representative fields. The data were analyzed using (B) CAIA or (C) manual evaluation. (D–E) A comparison of CAIA and manual evaluation for the same data used in (B) and (C). (F) Representative images of PMA(+)PSR- and PMA(−)PSR-stained specimens. The images were scanned using a virtual slide scanner (left) and analyzed via CAIA (right; the analyzed area is blue). Nuclear staining was observed in PMA(−)PSR-stained specimens (arrow). Scale bar = 100 µm. Abbreviations: CAIA, computer-assisted image analysis; PMA, phosphomolybdic acid; PSR, picrosirius red.
PMA Improved the Observation of Collagen Fibers Using Polarizing Microscopy
We observed specimens stained with PMA(+)PSR and PMA(−)PSR under polarized conditions (Fig. 2). In the PMA(+)PSR group, in the absence of polarization, PSR(+) filamentous matrix substances coiled around type III collagen fibers. On the contrary, in the PMA(−)PSR group, both non-polarized PSR(+) filamentous matrix substances and polarized PSR(+) matrix substances bound to type III collagen fibers.
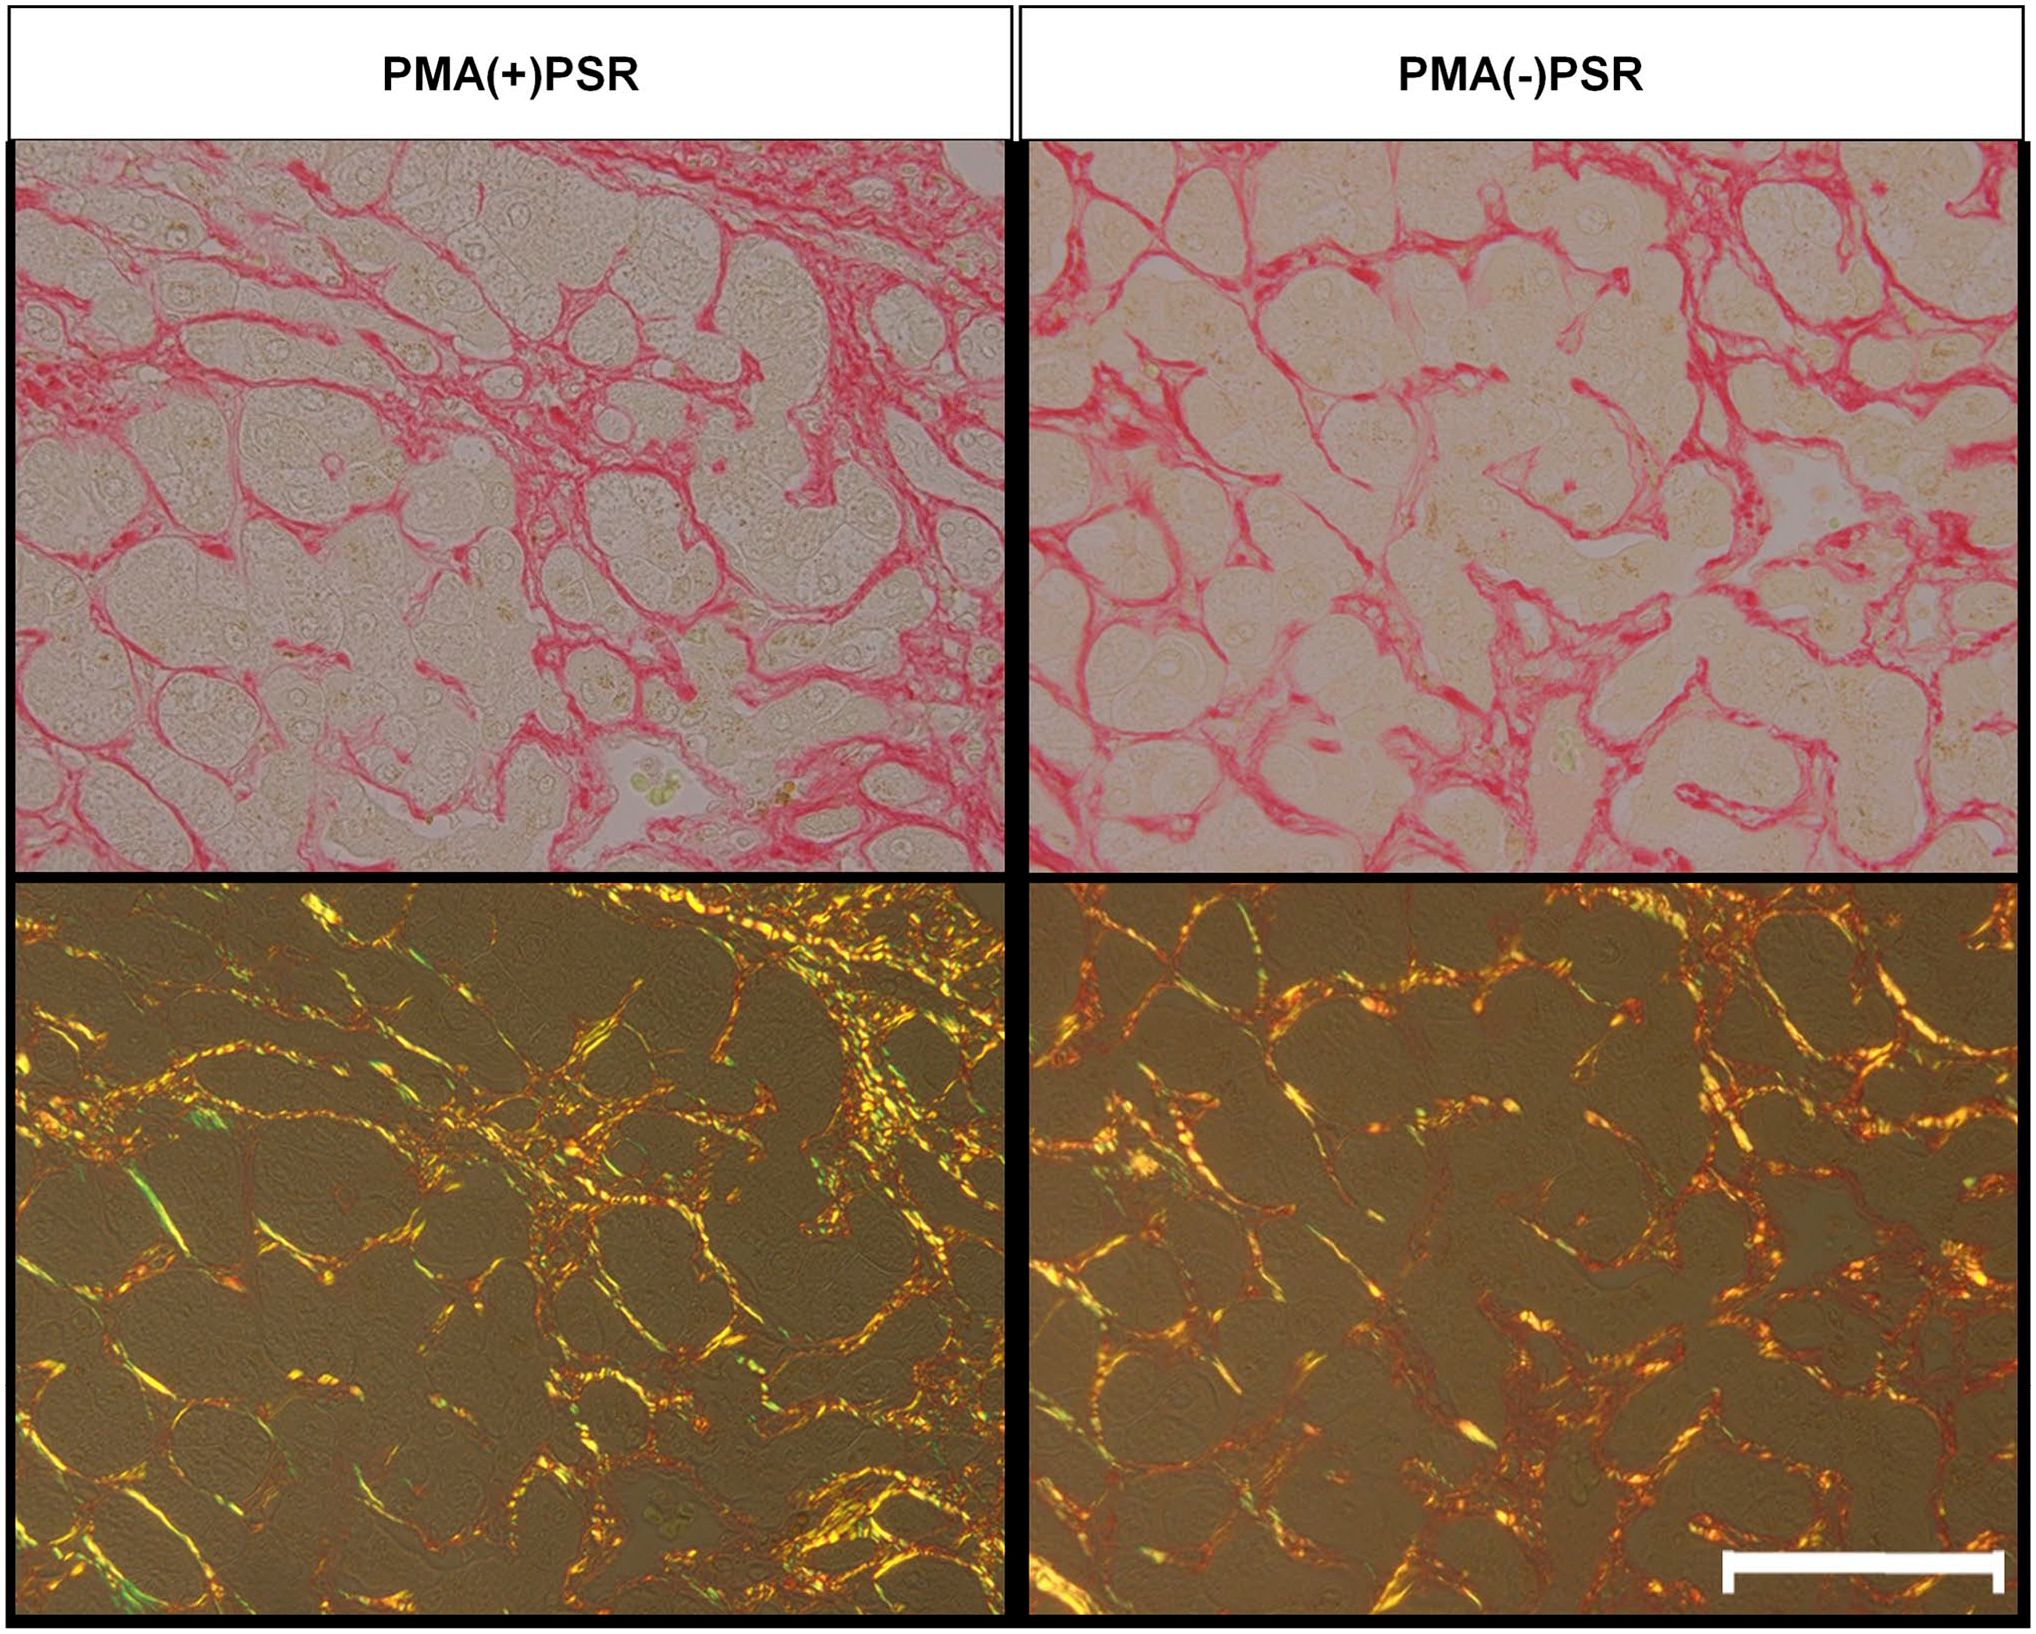
Comparison of Sirius red staining with/without PMA pretreatment. Representative images under the bright field and polarized conditions are shown. Scale bar = 25 µm. Abbreviations: PMA, phosphomolybdic acid; PSR, picrosirius red.
MB Was Produced Following Sunlight Exposure or Virtual Slide Scanning in PMA(+)PSR-stained Specimens
While analyzing PMA(+)PSR-stained specimens, we discovered that some specimens turned blue after sunlight exposure. In the literature, we found that molybdic acid was converted to MB following UV light exposure.13,14 Therefore, we investigated whether sunlight exposure is responsible for the color change of stained specimens. Blue staining was observed in all areas of tissue in the PMA(+)PSR group (Fig. 3A left), including areas stained with picric acid (primarily the cytosol) and Sirius red (mainly stromal fibers). In addition, we tested whether the VSS induced MB production in PMA(+)PSR-stained specimens. Interestingly, the PMA(+)PSR-stained specimens exhibited a slight blue tinge following a single scan (Fig. 3B, left). Furthermore, the blue color became stronger after multiple scans (Fig. 3C, left). Meanwhile, no significant color change was observed in PMA(+)PSR-stained specimens stored under shaded conditions (Fig. 3D, left) or in PMA(−)PSR-stained specimens under any conditions (Fig. 3, right).
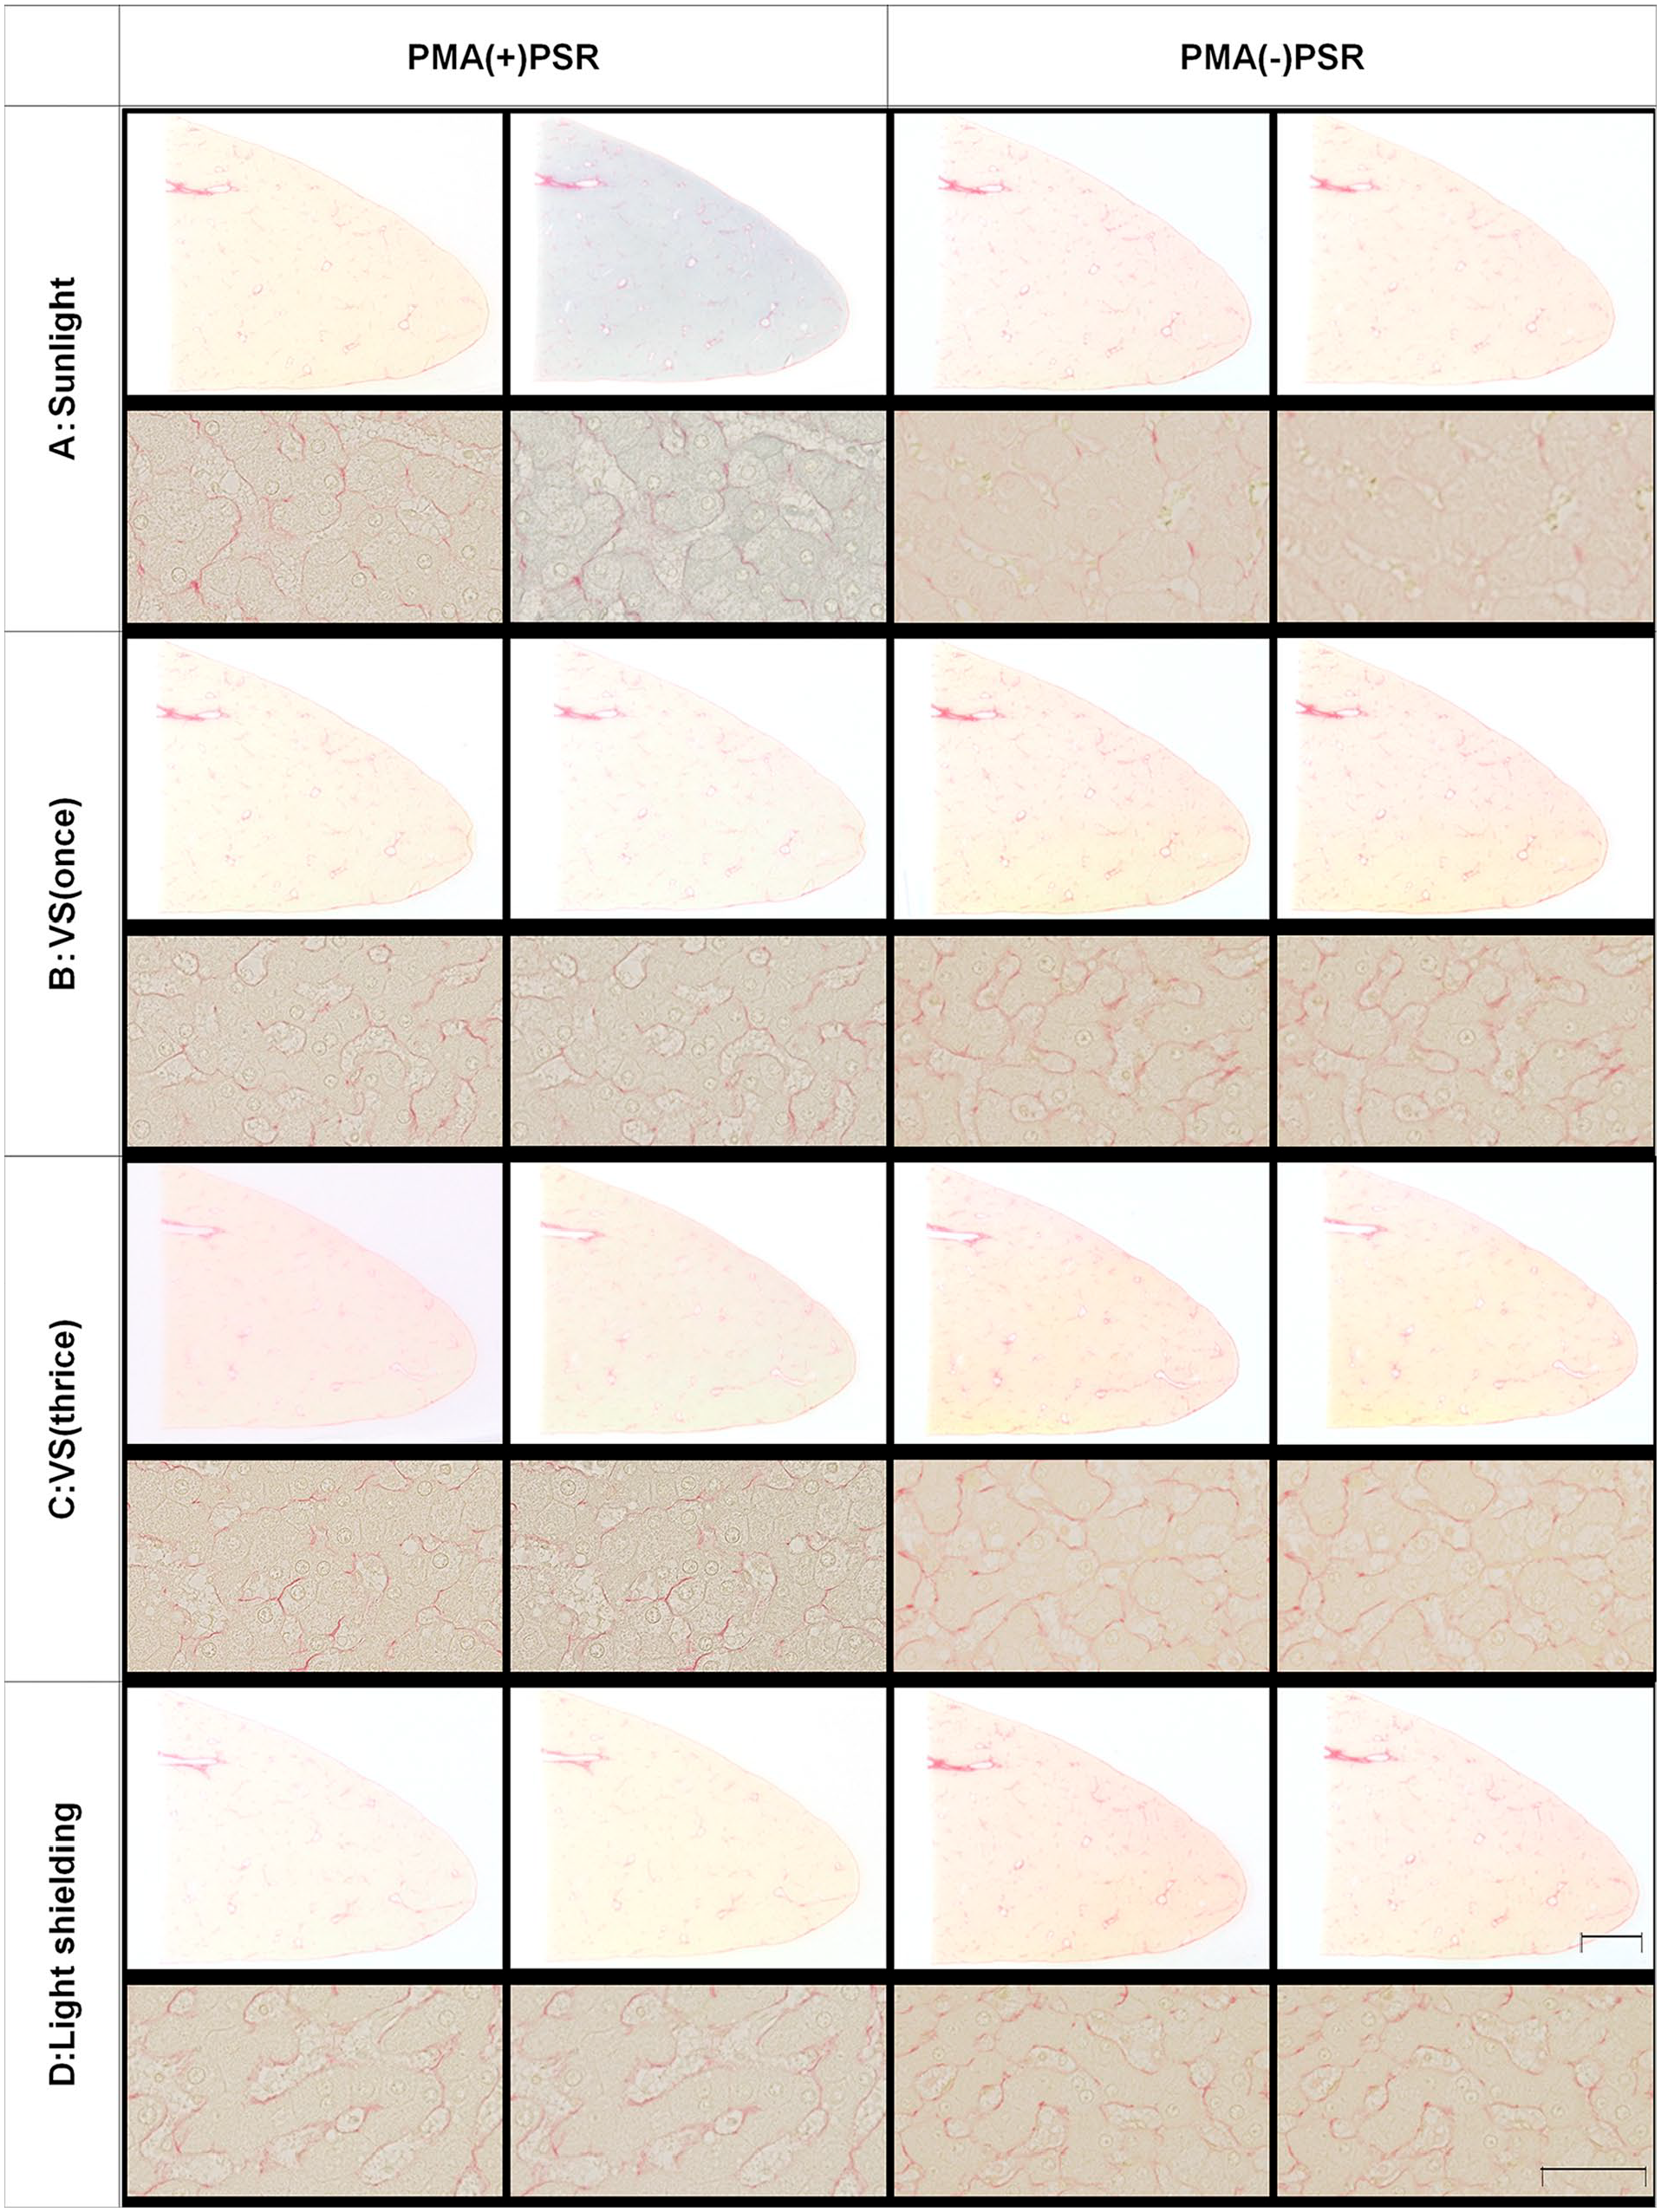
The production of molybdenum blue after sunlight exposure and virtual slide scanning. (A) Sunlight exposure and (B–C) virtual slide scanning resulted in the appearance of a blue tinge in PMA-treated and PSR-stained (PMA(+)PSR) tissue. Conversely, (D) light shielding blocked the color change of PMA(+)PSR-stained tissue. No color change was observed in PMA(−)PSR-stained tissue under any conditions. Scale bar = 5 mm (loupe image). Scale bar = 25 µm (microscopic image). Abbreviations: PMA, phosphomolybdic acid; PSR, picrosirius red.
MB Was Produced in Specimens Exposed to PMA Alone
To identify the reagents responsible for MB production upon sunlight exposure, we examined the effects of picric acid, Sirius red dye, mounting medium, and PMA, both alone and in combination. All PMA(+) specimens exhibited a blue tinge upon sunlight exposure, whereas no blue color was noted in PMA(−) specimens. Furthermore, staining was weaker for Sirius red than for PSR (Fig. 4).
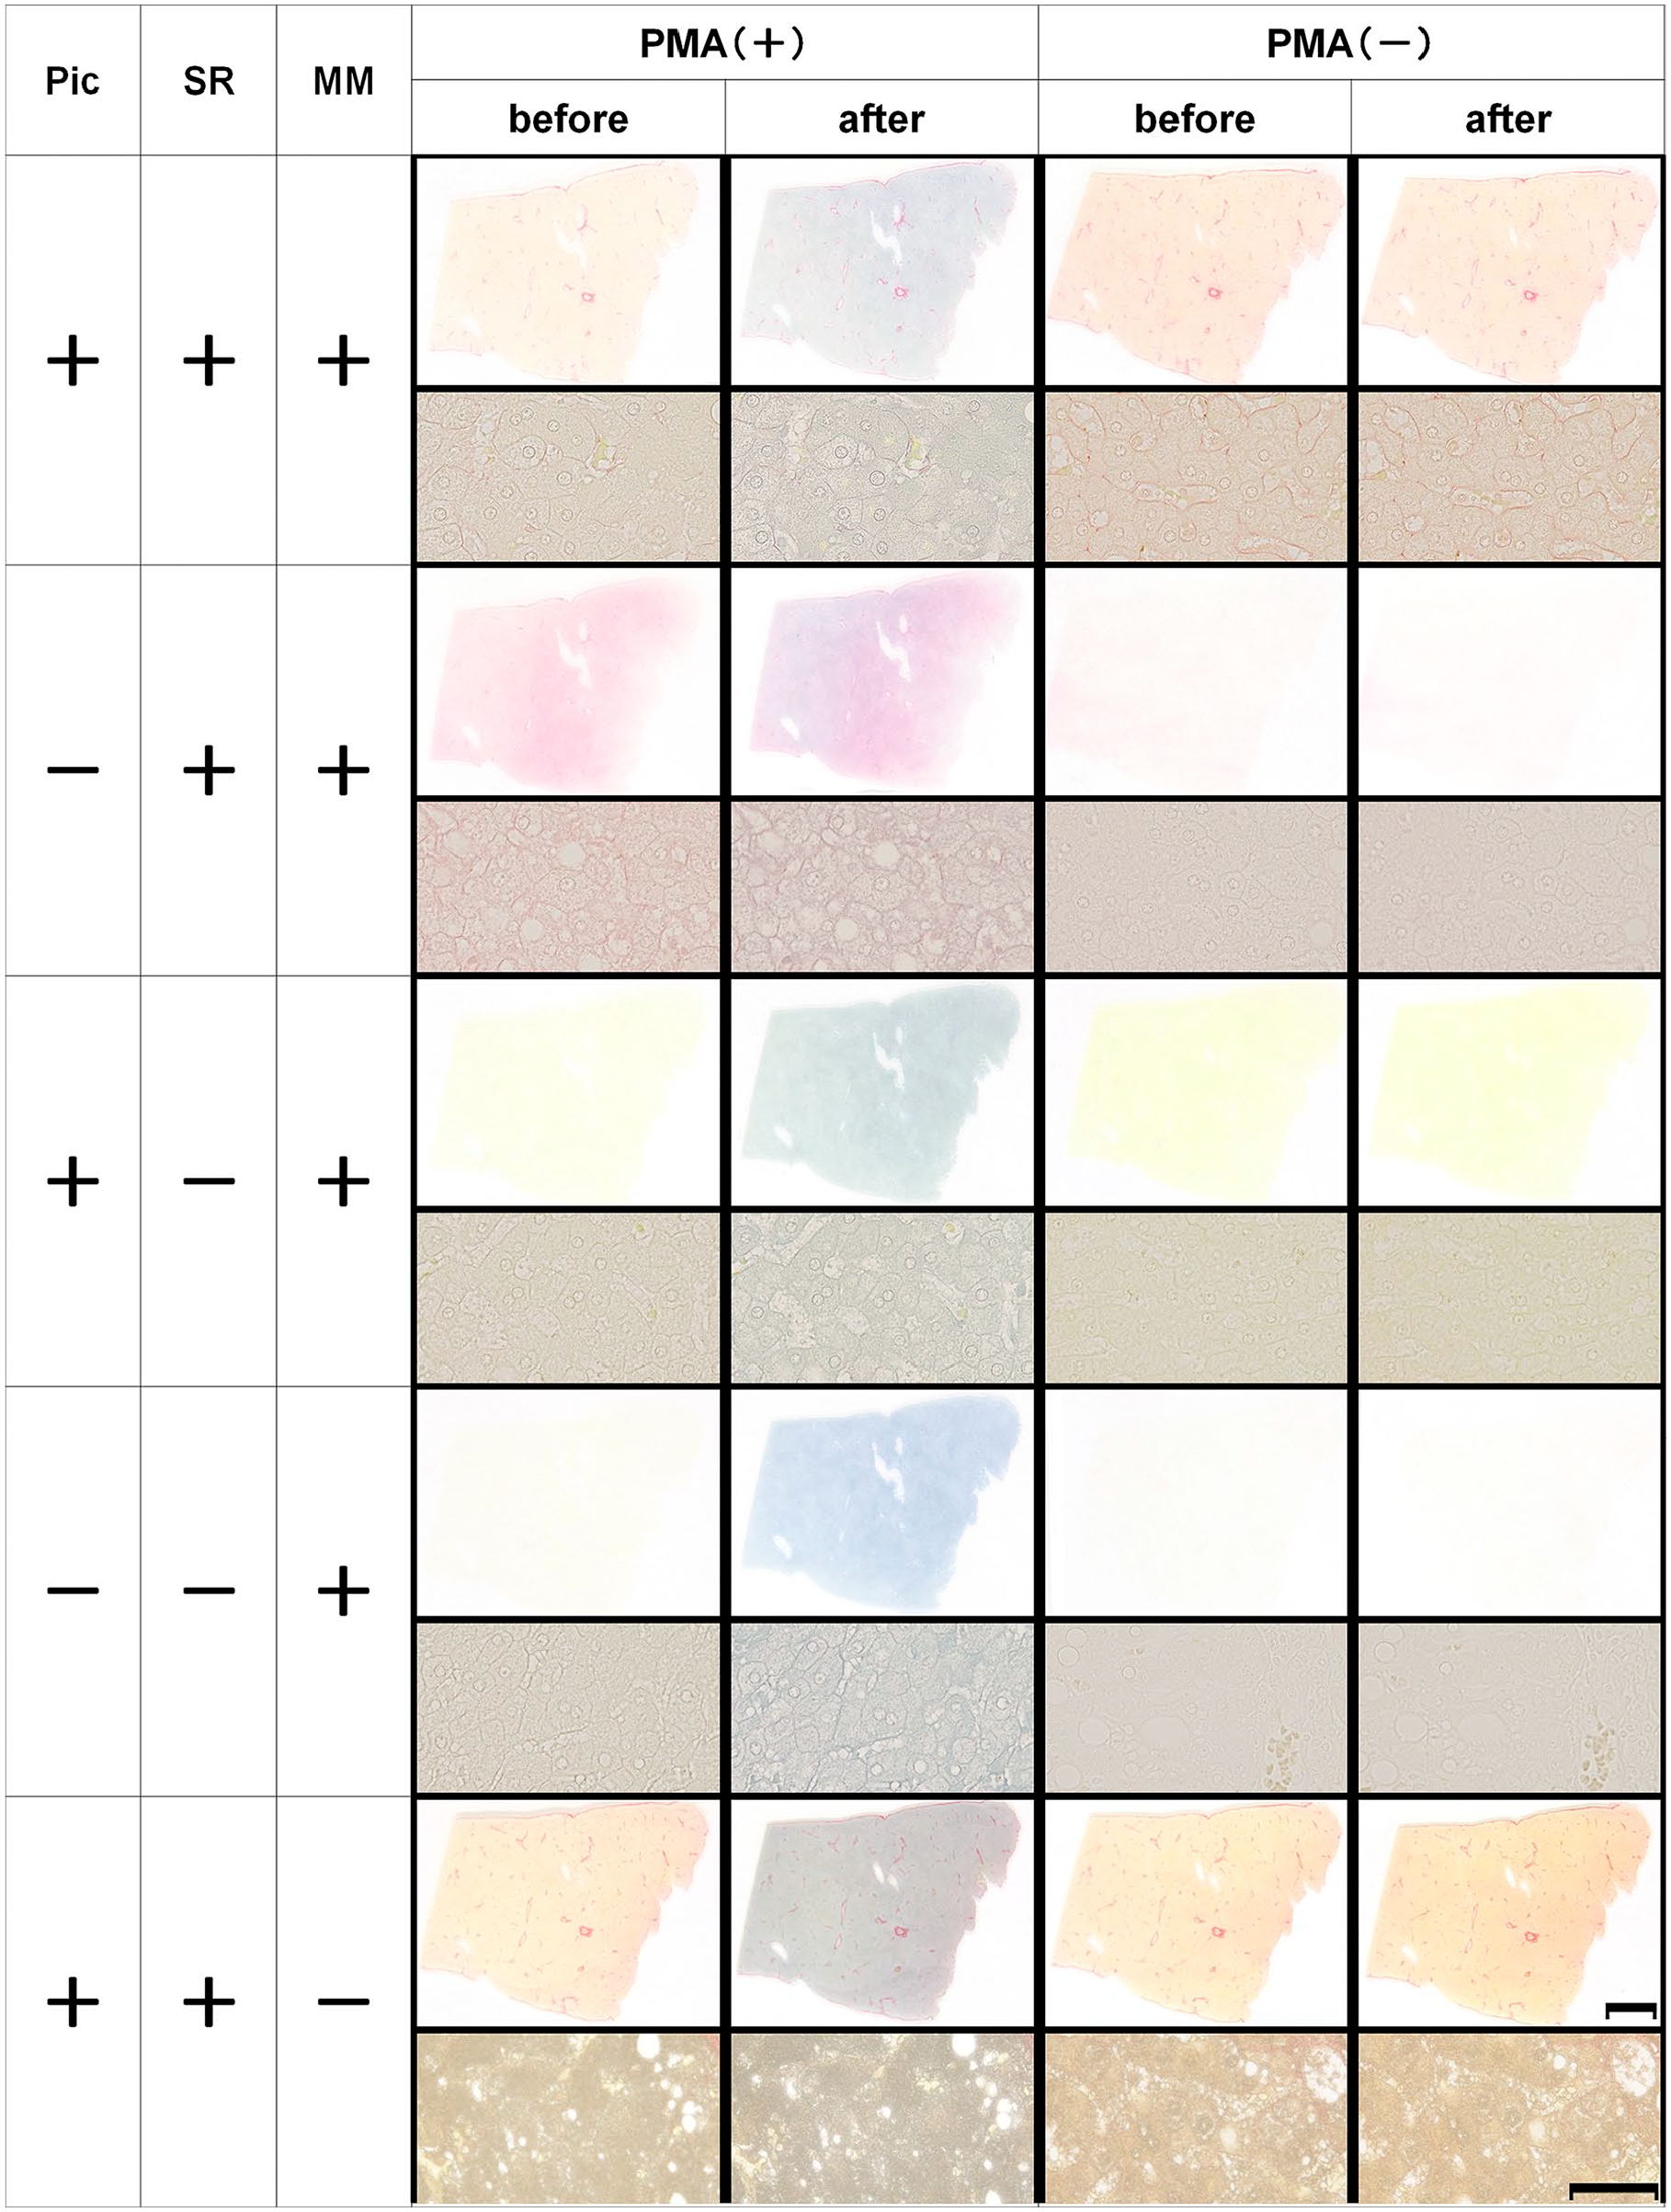
Effect of each step of picrosirius red staining on molybdenum blue production. Scale bar = 5 mm (loupe image). Scale bar = 25 µm (microscopic image). Abbreviations: MM, mounting medium; Pic, saturated picric acid; PMA, phosphomolybdic acid; SR, Sirius red.
MB Production Was Caused by UV Light Exposure
To examine the effects of UV light on MB production, we exposed PMA-stained specimens to a UV transilluminator. The strength of the blue color increased in a time-dependent manner following exposure (Fig. 5).
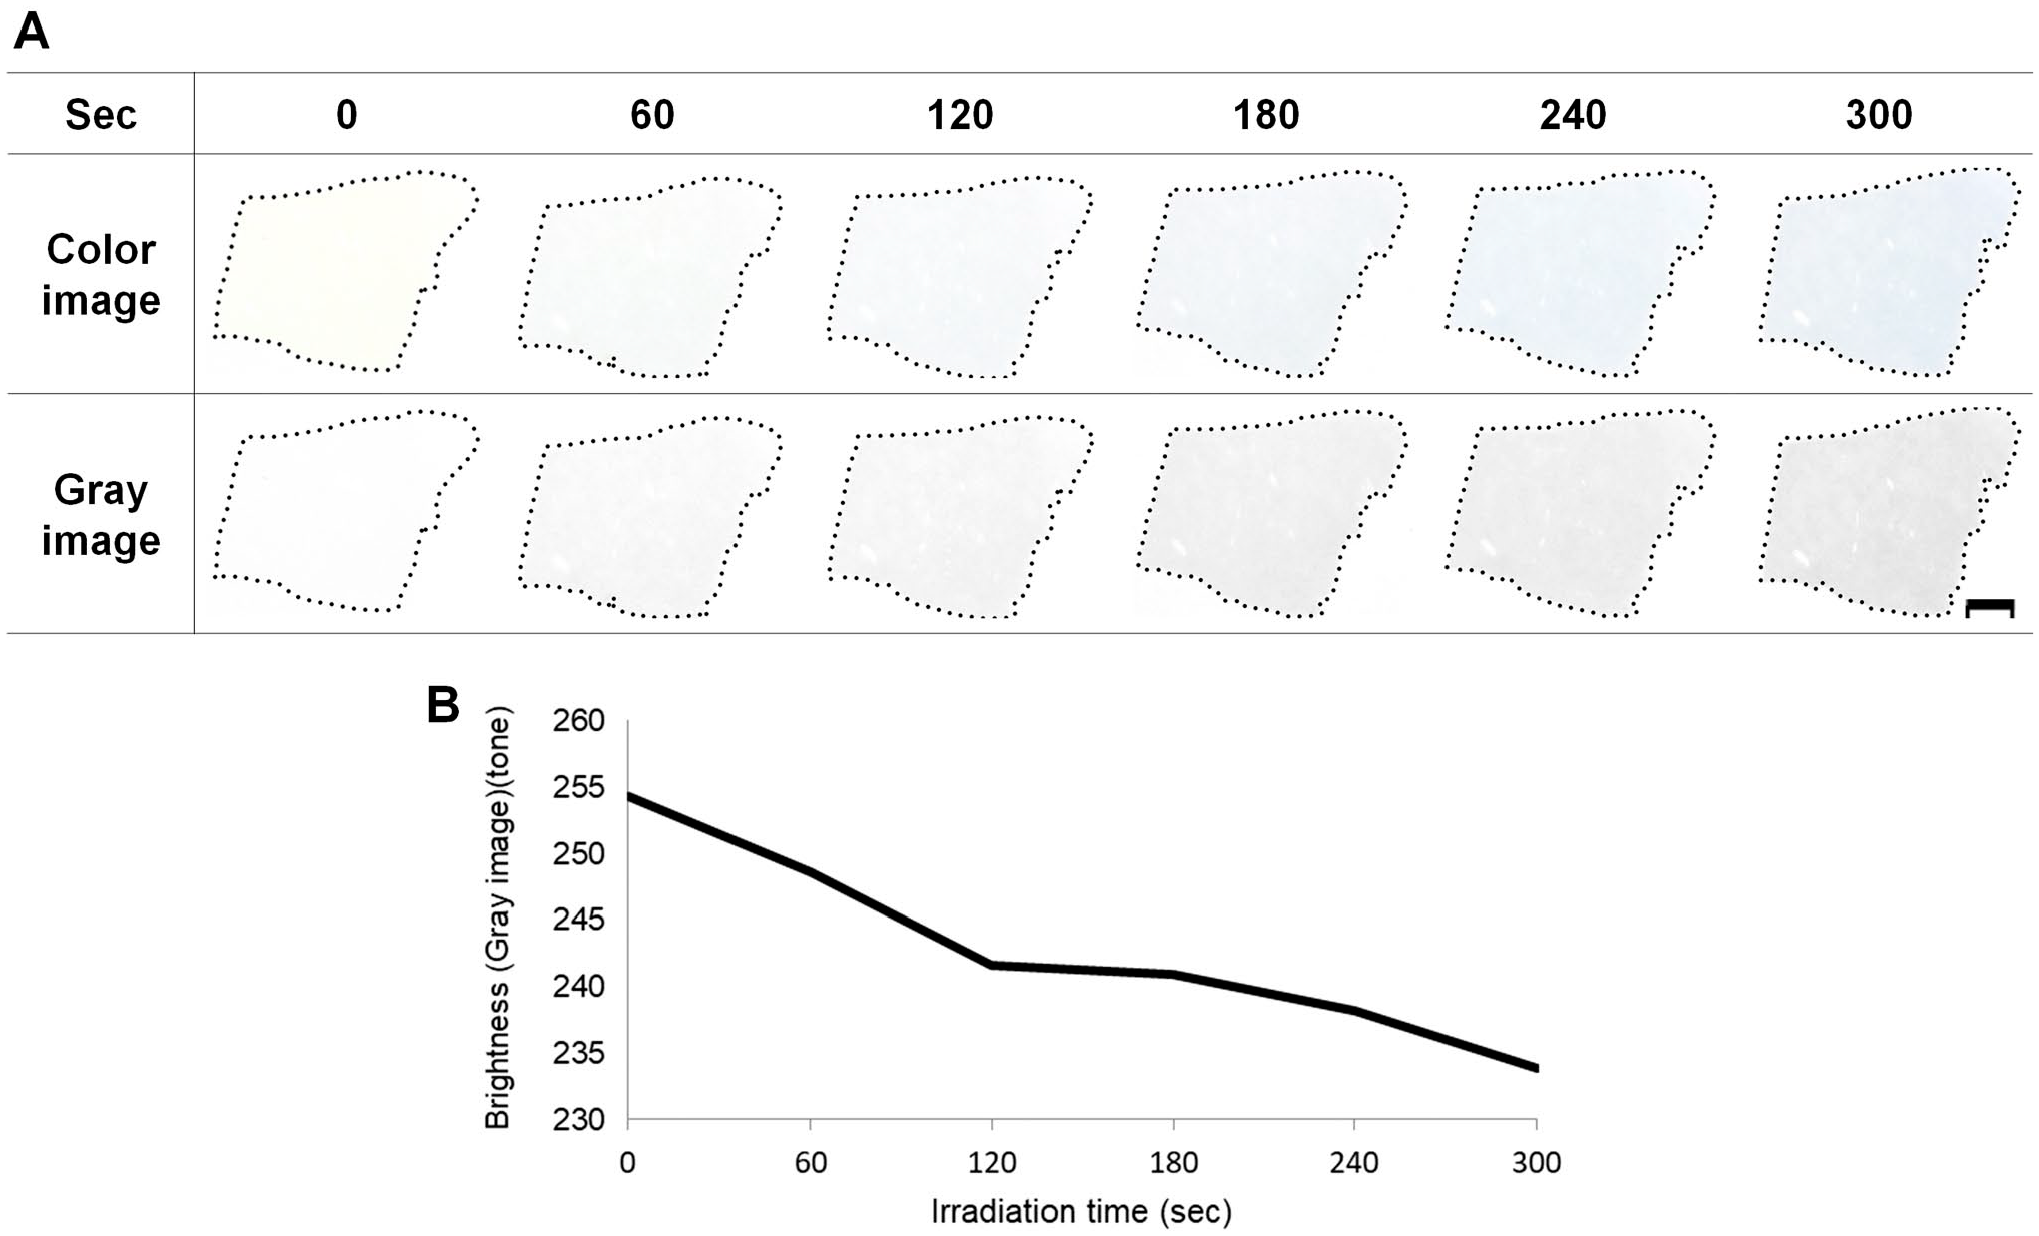
Molybdenum blue production in phosphomolybdic acid–treated specimens following ultraviolet (UV) light exposure. (A) The representative results among three samples irradiated using a UV transilluminator are shown. The upper part is the actual color image of specimens after irradiation. In the lower part, the images were converted to grayscale. (B) Changes of grayscale brightness over time for samples presented in (A). Five fields were evaluated, and the average brightness was plotted. Because of the faint color of stained specimens, we prepared brightness-reduced images using Adobe Photoshop CS6. Scale bar = 5 mm.
Blocking UV Light Did Not Completely Block MB Production
Because UV exposure was identified as a cause of MB production, we examined whether UV-cut film could prevent MB production in response to sunlight exposure. As shown in Fig. 6A, UV-cut film reduced, but did not completely prevent, MB production after sunlight exposure in comparison with the findings in the absence of UV-cut film. Conversely, UV-cut film did not affect MB production caused by exposure to a VSS (Fig. 6A).
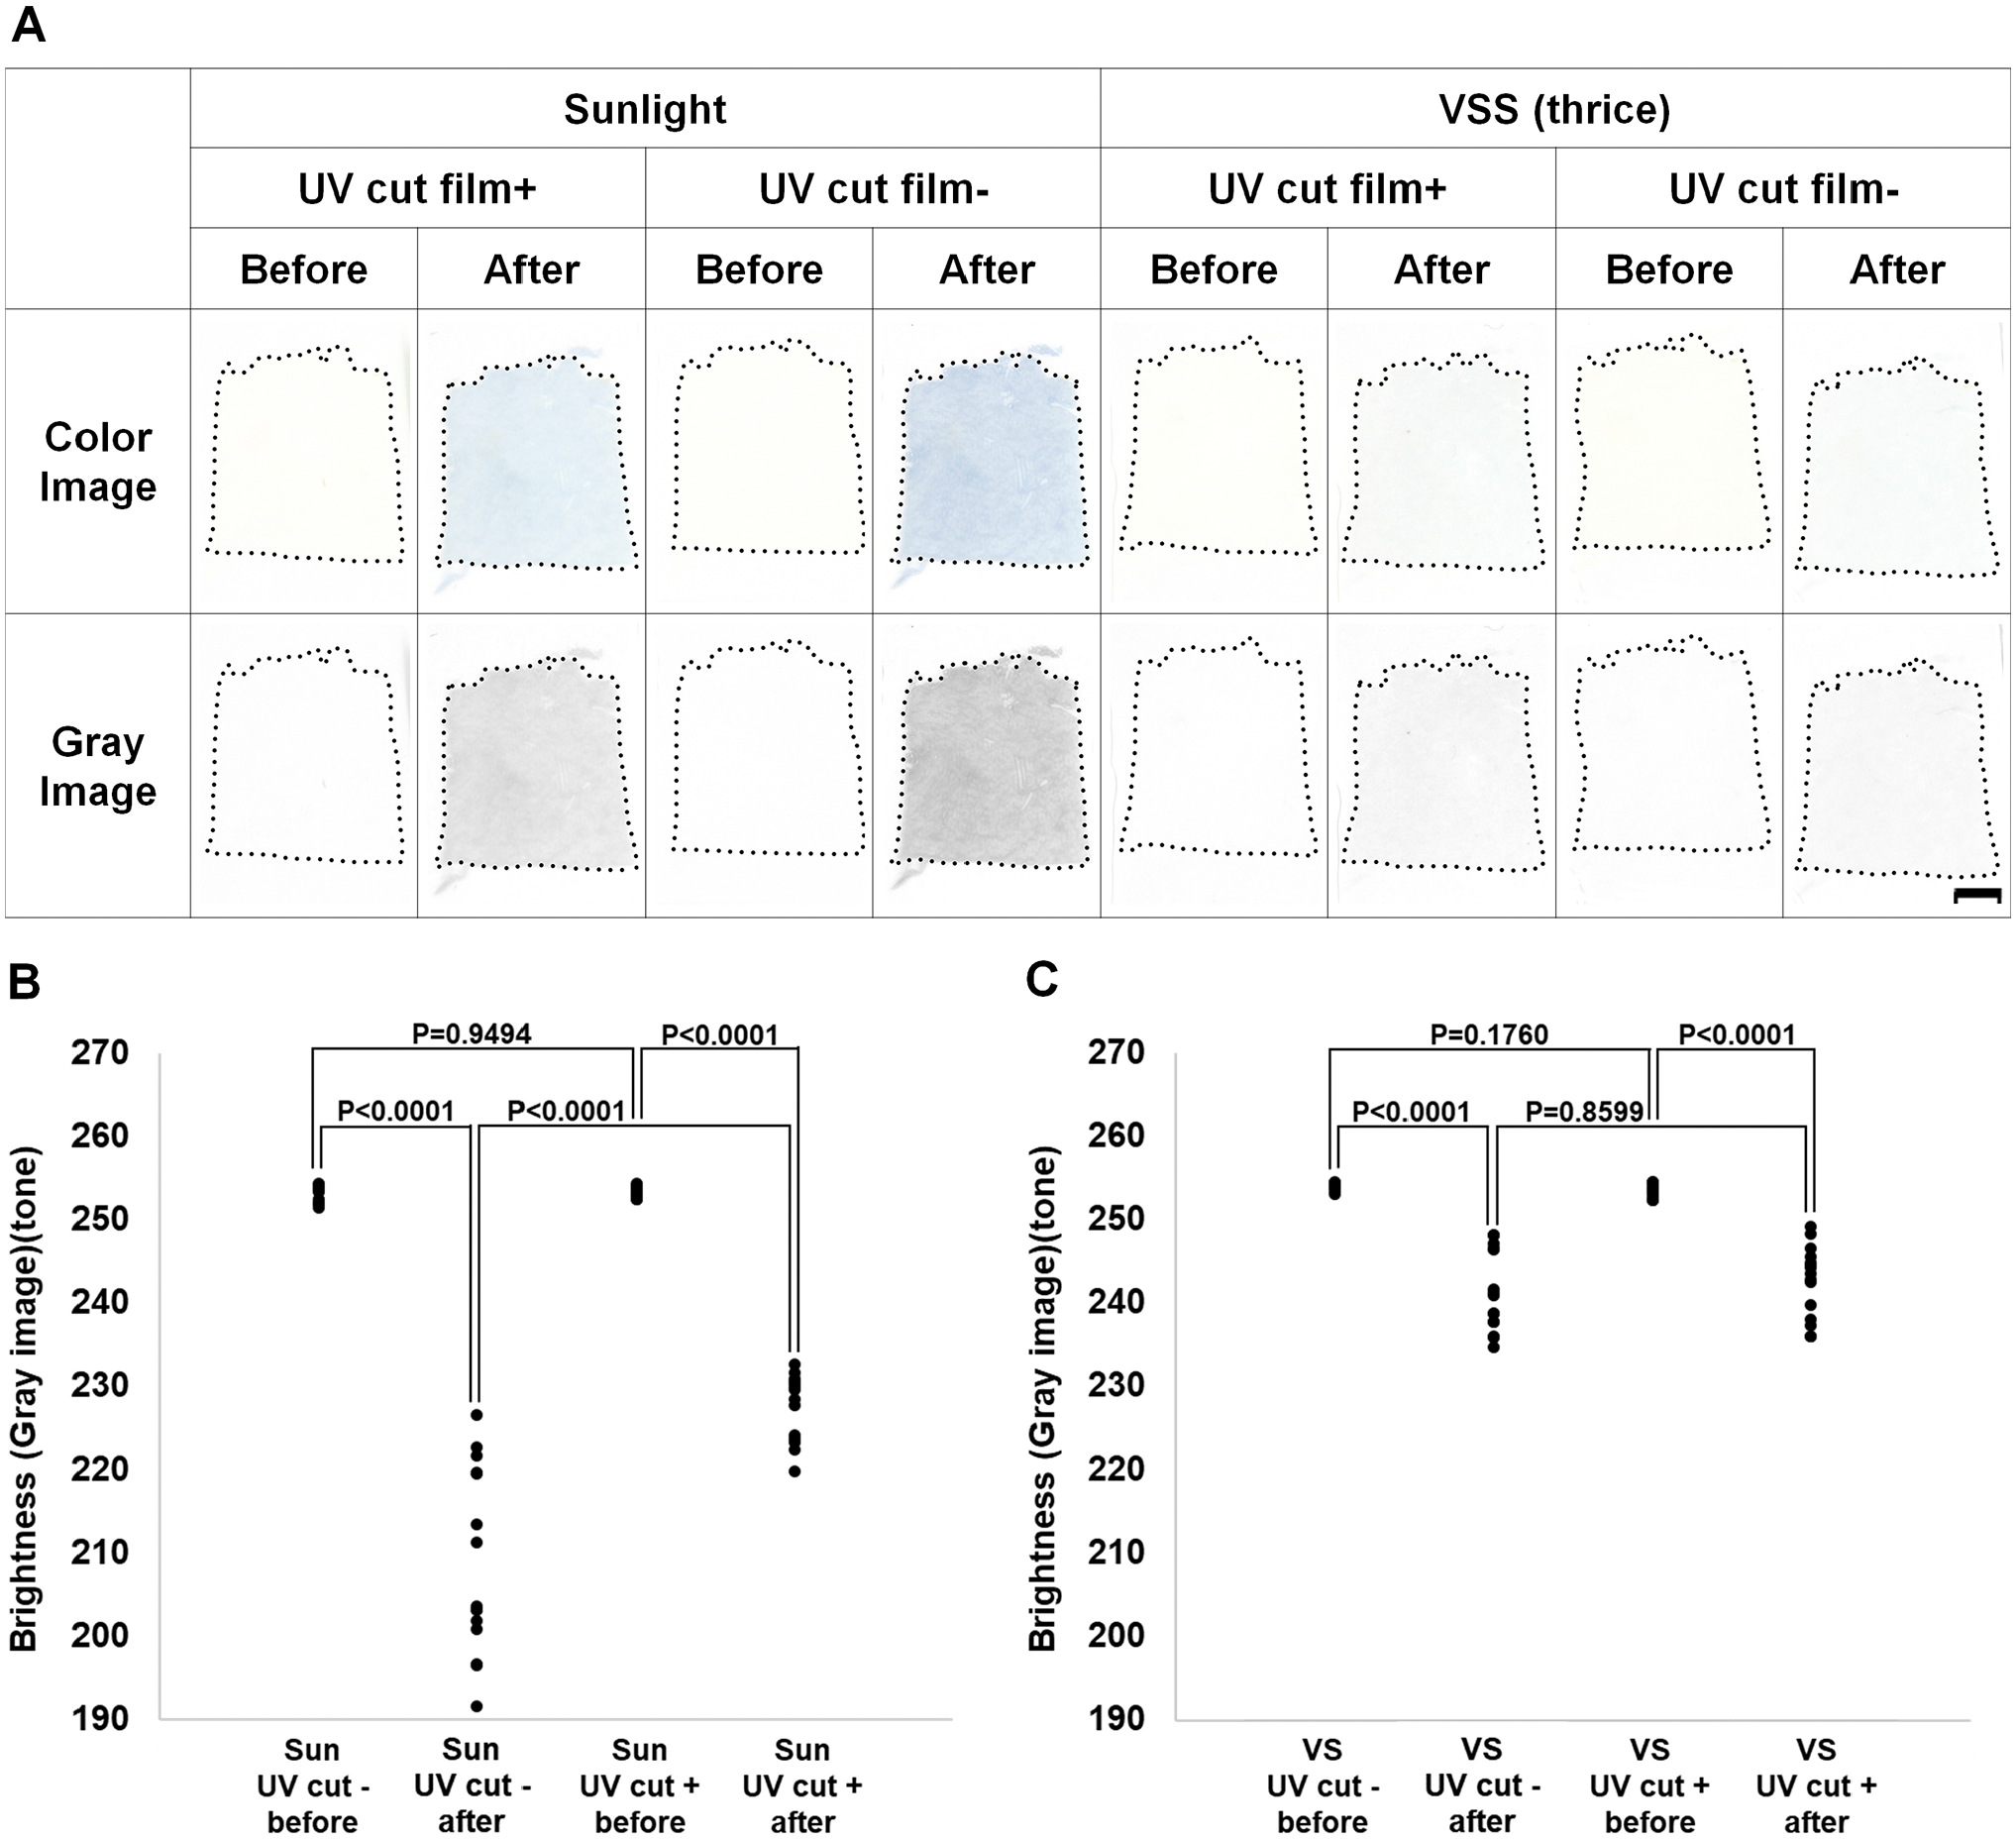
The preventive effects of UV-cut film on molybdenum blue production during sunlight exposure and virtual slide scanning in phosphomolybdic acid–treated specimens. (A) Molybdenum blue production in specimens exposed to sunlight and virtual slide scanning in the presence and absence of UV-cut film. The upper part is the actual color image, and the lower part is the converted grayscale image. Scale bar = 5 mm. (B) Molybdenum blue production in specimens before and after sunlight exposure in the presence and absence of UV-cut film was evaluated according to the brightness of gray images. (C) Molybdenum blue production in specimens before and after virtual slide scanning and with and without the absence of UV-cut film was evaluated according to the brightness of gray images. Because of the faint color of stained specimens, we prepared brightness-reduced images using Adobe Photoshop CS6. Abbreviations: UV, ultraviolet; VSS, virtual slide scanner.
MB Production Was Induced by Blue LED
Finally, to examine the type of LED responsible for MB production, we examined the effect of LEDs with three different colors on MB production using PMA alcohol solution. As presented in Fig. 7, only blue LED exposure induced MB production.
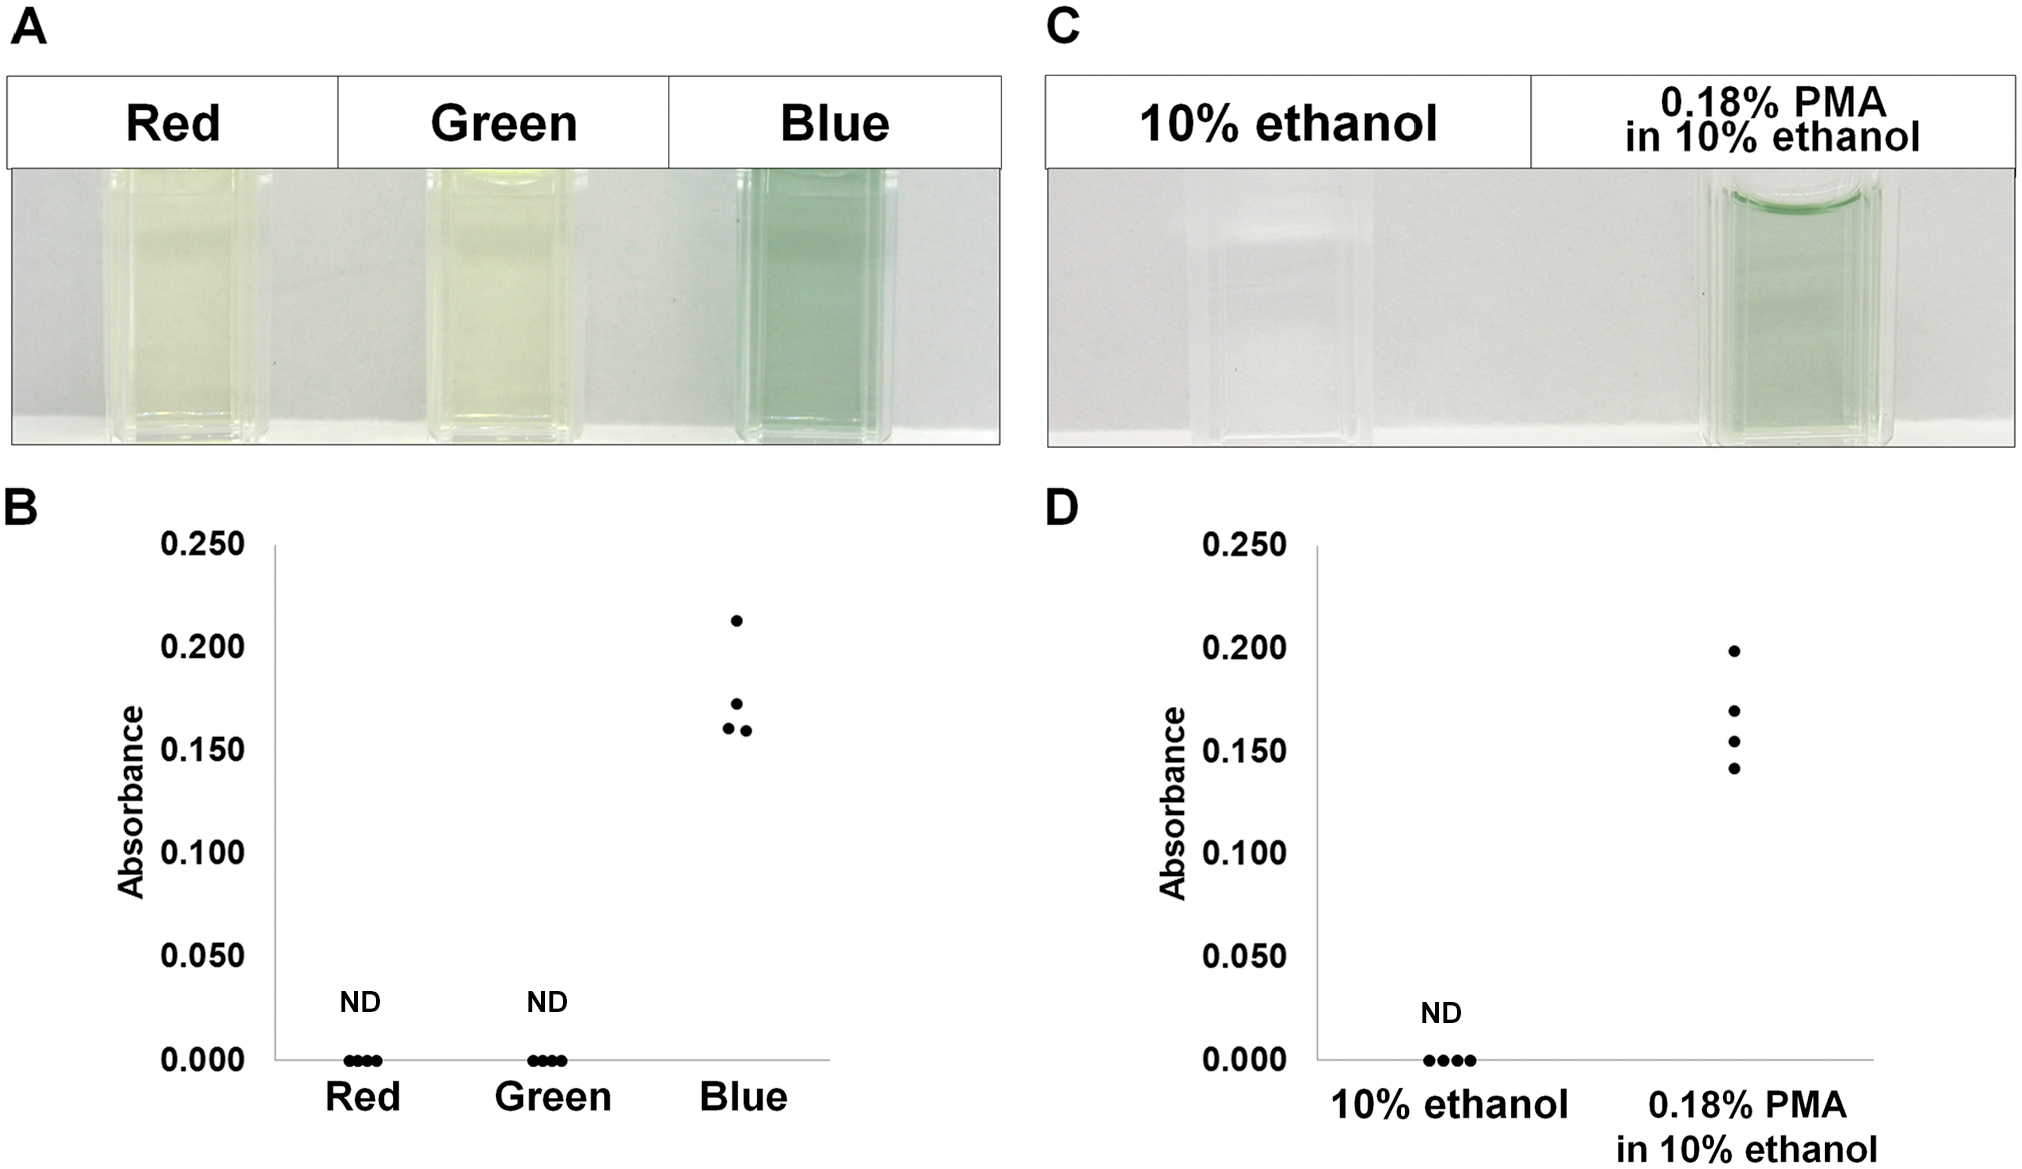
Molybdenum blue production in specimens after irradiation with LEDs in the visible light range. (A) PMA alcohol solution after irradiation using red, green, or blue LEDs alone for 24 hr. (B) The absorbance at 850 nm for solutions used in (A). (C) To demonstrate that the solvent itself (10% ethanol solution) was not changed after blue LED exposure, we repeated the experiment using 10% ethanol alone and 0.8% PMA in 10% ethanol. (D) The absorbance at 850 nm was plotted. Abbreviations: LED, light-emitting diode; ND: not detected; PMA, phosphomolybdic acid.
Discussion
Due to complexity of our experomental protocols, we summarized the flow of our experiments in Fig. 8. Sirius red dye binds to basic amino acids when dissolved in picric acid. 12 Because collagen fibers are rich in basic amino acids, 15 PSR readily binds to microfibrils. This staining mechanism indicates that Sirius red nonspecifically binds to basic proteins such as histones in the nucleus. In line with prior findings, 11 this study revealed that PMA pretreatment suppressed nonspecific nuclear staining by PSR in liver tissue.
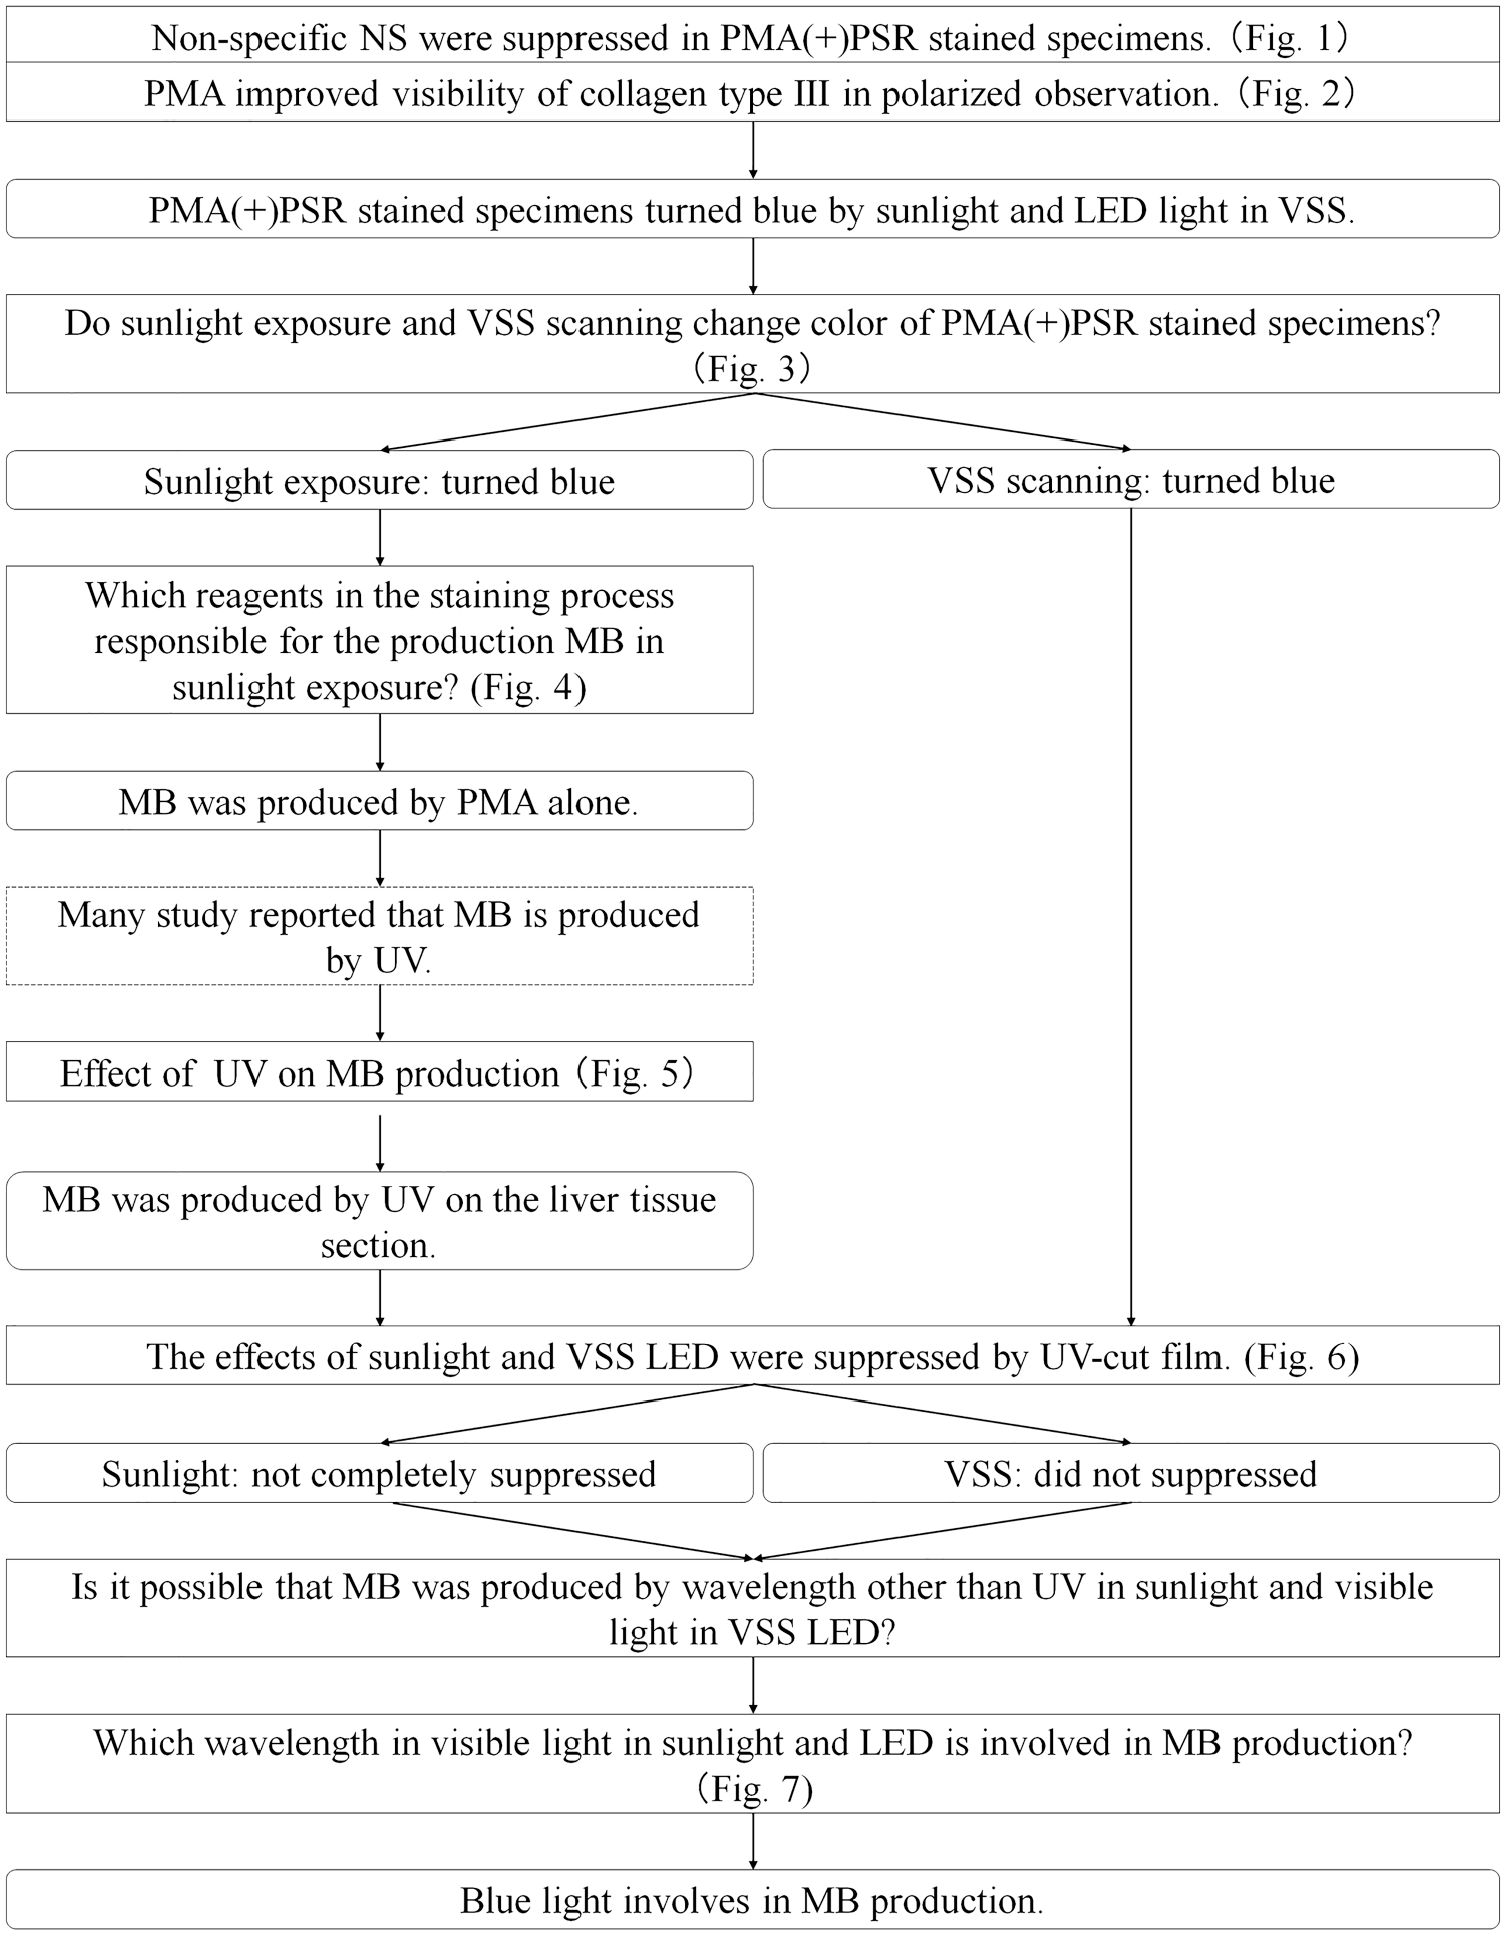
Schematic diagram of the experimental protocol. Abbreviations: LED, light-emitting diode; MB, molybdenum blue; NS, nuclear staining; PMA, phosphomolybdic acid; PSR, picrosirius red; UV, ultraviolet; VSS, virtual slide scanner.
Under polarized conditions, type I collagen in PSR-stained specimens appears yellow, orange, or red, whereas type III collagen appears green. Thus, polarized observation of PSR-stained specimens is useful for distinguishing between type I and III collagen. In our experiments, polarized type III collagen fibers were clearly observed as linear branchless fibers under both conditions. However, because of the amount of non-polarized PSR(+) matrix substances around collagen fibers, polarization of collagen had a stronger interfering effect in the absence of PMA pretreatment than in the presence of PMA pretreatment. Thus, our data indicated that PMA treatment could prevent the nonspecific binding of Sirius red to the matrix substances surrounding collagen fibers without interfering with its binding to collagen.
Polarized microscopic observation is often used to quantify liver fibrosis.16,17 However, PMA(+)PSR staining was not used in previous reports to our knowledge.12,16–21 Furthermore, a prior study using fluorescence microscopy to evaluate myocardial connective tissue revealed that PMA treatment could suppress nonspecific background fluorescence caused by picric acid in comparison with the findings in the absence of PMA treatment. 22 Thus, these reports indicate the utility of PMA treatment for evaluating PSR-stained collagen fibers. Similarly, this study illustrated that PMA(+)PSR staining was more useful for quantifying collagen fibers in liver tissue because PMA pretreatment prevented nonspecific nuclear staining.
The blue color of MB is caused by intervalence charge transfer between molybdenum(V) and molybdenum(VI). 23 The reaction occurs when molybdenum atoms are exposed to UV radiation in the presence of hydrogen bond donors,13,14 such as alcohols, glycols, hydroxyl acids, amines, carboxylic acids, and dicarboxylic acids. These results suggest that the reaction of PMA with hydrogen bond donors in tissue under UV radiation is responsible for the blue-tinged coloration. However, our results illustrated that MB was produced by blue light in the visible light spectrum in addition to UV light. Sunlight includes UV light (280–400 nm), visible light (380–780 nm), and infrared light (780–1,000,000 nm). Thus, these results are extremely important because no prior study reported MB production induced by visible light.
The VSS used in this study exposes an approximately 1-cm2 area (approximately 700 µm × 900 µm) per scanning movement (100 µs). In contrast, the high-spec model exposes the entire area in one scanning movement. For example, in the case of 2-cm-wide specimens, the exposure time per tissue area in our VSS model is 200-fold longer than that for the high-spec model. This suggests that the blue-tinged color change of the PMA-pretreated specimens would be reduced using a high-spec model. Therefore, for low-spec models such as personal VSSs, a high-spec model-type exposure mechanism should be used.
Regarding Sirius red staining, the staining of liver fibrosis report is similar between mice and humans.24,25 Furthermore, regarding the nonspecific staining of basic proteins, Junqueira et al. reported the nonspecific staining of basic proteins found in various organs of many animal species. Therefore, we believe that our findings are applicable to animal models.
In conclusion, this study demonstrated that PMA pretreatment suppressed nonspecific nuclear staining by PSR, which would improve the quantification of collagen fibers in patients with liver fibrosis. However, PMA(+)PSR-stained specimens exhibited a blue tinge following scanning using a VSS, and the image analysis could not be performed using the original color. Therefore, to overcome this problem, it is necessary to improve the VSS protocol.
Supplemental Material
2020-00039R1_Production_Supplemental_Data_online_supp – Supplemental material for Phosphomolybdic Acid Prevents Nonspecific Nuclear Staining by Picrosirius Red but Is Converted to Molybdenum Blue by Blue Light
Supplemental material, 2020-00039R1_Production_Supplemental_Data_online_supp for Phosphomolybdic Acid Prevents Nonspecific Nuclear Staining by Picrosirius Red but Is Converted to Molybdenum Blue by Blue Light by Mizuho Hatori, Shunichi Moriya, Misa Fujimori, Sayaka Kobayashi, Hayato Ikota, Ken Shirabe, Hideaki Yokoo, Kiminori Kimura and Masanao Saio in Journal of Histochemistry & Cytochemistry
Footnotes
Competing Interests
The author(s) declared no potential conflicts of interest with respect to the research, authorship, and/or publication of this article.
Author Contributions
MH carried out Sirius red staining, virtual slide image collection, loupe image collection, nuclear nonspecific staining evaluation, figure and table preparation, and manuscript writing. SM, MF, and SK carried out sample paraffin block collection, specimen preparation, and manuscript review. HI and HY performed histological evaluation, interpretation of the role of phosphomolybdic acid in Sirius red staining as pathologists, and manuscript review. KS performed sample collection and interpretation of histological findings as specialist of hepato-biliary-pancreatic surgery. KK provided advise to MS on experimental design and performed interpretation of histological findings as specialist of hepatology and manuscript review. MS conducted this research as principle investigator and helped in the creation of experimental design, image analysis, nuclear nonspecific staining evaluation, polarized microscopic observation, and manuscript writing. All authors have read and approved the final manuscript.
Funding
The author(s) disclosed receipt of the following financial support for the research, authorship, and/or publication of this article: This research was supported in part by the Japanese Agency for Medical Research and Development for M.S. (Grant No. #JP19ek0109326).
References
Supplementary Material
Please find the following supplemental material available below.
For Open Access articles published under a Creative Commons License, all supplemental material carries the same license as the article it is associated with.
For non-Open Access articles published, all supplemental material carries a non-exclusive license, and permission requests for re-use of supplemental material or any part of supplemental material shall be sent directly to the copyright owner as specified in the copyright notice associated with the article.