
Abstract
Clear cell renal cell carcinoma (ccRCC) and chromophobe renal cell carcinoma (chRCC) are relatively common tumors that can have significant risk for mortality. Treatment and prognostication in renal cell carcinoma (RCC) are dependent upon correct histologic typing. ccRCC and chRCC are generally straightforward to diagnose based on histomorphology alone. However, high-grade ccRCC and chRCC can sometimes resemble each other morphologically, particularly in small biopsies. Multiple immunostains and/or colloidal iron stain are sometimes required to differentiate the two. Imaging mass spectrometry (IMS) allows simultaneous spatial mapping of thousands of biomarkers, using formalin-fixed paraffin-embedded tissue sections. In this study, we evaluate the ability of IMS to differentiate between World Health Organization/International Society for Urological Pathology grade 3 ccRCC and chRCC. IMS spectra from a training set of 14 ccRCC and 13 chRCC were evaluated via support vector machine algorithm with a linear kernel for machine learning, building a classification model. The classification model was applied to a separate validation set of 6 ccRCC and 6 chRCC, with 19 to 20, 150-μm diameter tumor foci in each case sampled by IMS. Most evaluated tumor foci were classified correctly as ccRCC versus chRCC (99% accuracy, kappa=0.98), demonstrating that IMS is an accurate tool in differentiating high-grade ccRCC and chRCC.
Keywords
Introduction
Renal cell carcinoma (RCC) is among the top 10 most commonly diagnosed malignancies, with approximately 64,000 new cases in the United States and 400,000 new cases worldwide in 2018.1,2 Clear cell RCC (ccRCC) is the most common histological subtype, accounting for 75% of cases; approximately 5% of RCCs are chromophobe type (chRCC). 1 Morphologic distinction between low-grade (International Society for Urological Pathology [ISUP] nucleolar grades 1–2) ccRCC and chRCC is usually straightforward. However, higher grade ccRCC (World Health Organization [WHO]/ISUP nucleolar grades 3 and 4) shows more nuclear irregularity and often has areas with eosinophilic cytoplasm, imparting an overall appearance more similar to chRCC. In these cases, a panel of immunohistochemical stains with or without a colloidal iron stain is often applied in routine clinical practice to differentiate these two lesions, as the prognosis and treatment for ccRCC versus non-clear cell RCC is different. In particular, chRCC is much less aggressive than grade 3 or 4 ccRCC. 1 Unfortunately, staining results are sometimes not definitive in classifying a tumor as ccRCC or chRCC, and the resulting diagnosis of RCC of unclassified type is not particularly helpful in facilitating patient management. Additionally, the differential often includes other lesions (e.g., papillary RCC, epithelioid angiomyolipoma) and the applied panel of immunostains may be quite broad and costly.
Matrix-assisted laser desorption ionization imaging mass spectrometry (IMS) is a novel tool for proteomic analysis on formalin-fixed paraffin-embedded (FFPE) tissue sections. It is effective in spatially mapping biological compounds in tissue sections and allows for unbiased mapping of proteins/peptides without the use of antibodies, allowing simultaneous evaluation of hundreds to thousands of biomarkers. 3 Furthermore, IMS can identify differences in post-translational protein modification, which is generally difficult to achieve with traditional immunohistochemical methods. IMS already has been utilized successfully in differentiating between Spitz nevi and Spitzoid malignant melanoma. 4
Given the ability of IMS to simultaneously evaluate thousands of biomarkers in small tissue samples, it is an attractive method for subtyping of RCCs. In this study, we set out to evaluate the efficacy of IMS in differentiating grade 3 ccRCC and chRCC.
Materials and Methods
Case Selection
Institutional Review Board approval was obtained prior to initiation of the study. Patients with recent diagnosis of grade 3 ccRCC and chRCC were identified, and the slides were retrieved and reviewed. Special stains for ccRCC and chRCC were performed to confirm the histologic diagnosis, using the ISUP recommended stains (CAIX, CD10, CK7, CD117, colloidal iron). Twenty ccRCC and 20 chRCC with typical morphology and immunohistochemical profiles were selected. One chRCC was subsequently excluded from analysis due to technical difficulty, so only 19 chRCC were used for analysis (Tables 1 and 2). Cases of each type (14 ccRCC and 13 chRCC) were randomly selected as the training set; the remaining cases (6 each) were utilized in the validation set.
ccRCC Sets: Demographics and Staining Features.
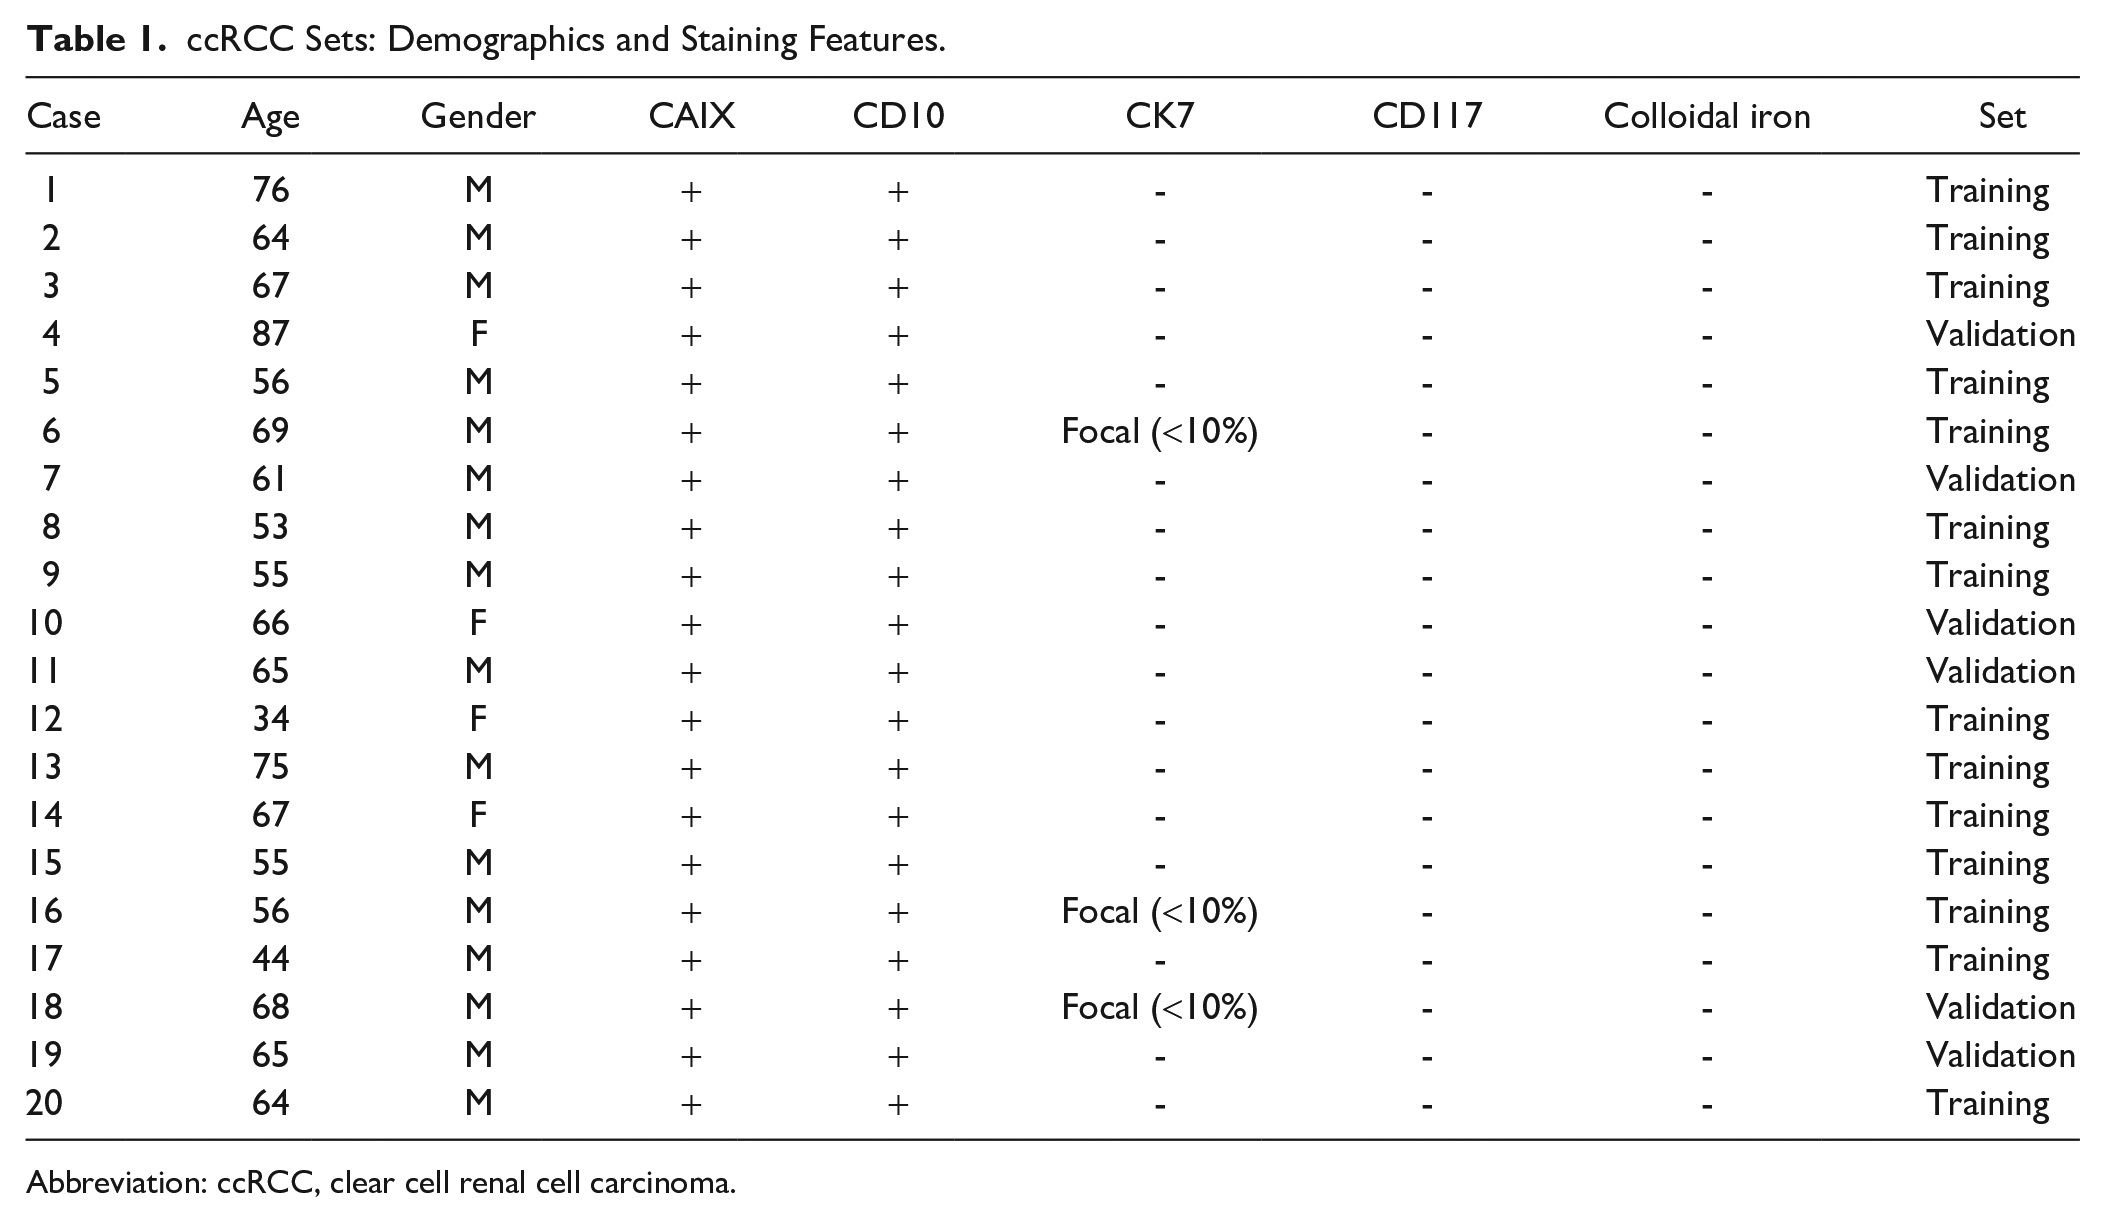
Abbreviation: ccRCC, clear cell renal cell carcinoma.
chRCC Sets: Demographics and Staining Features.
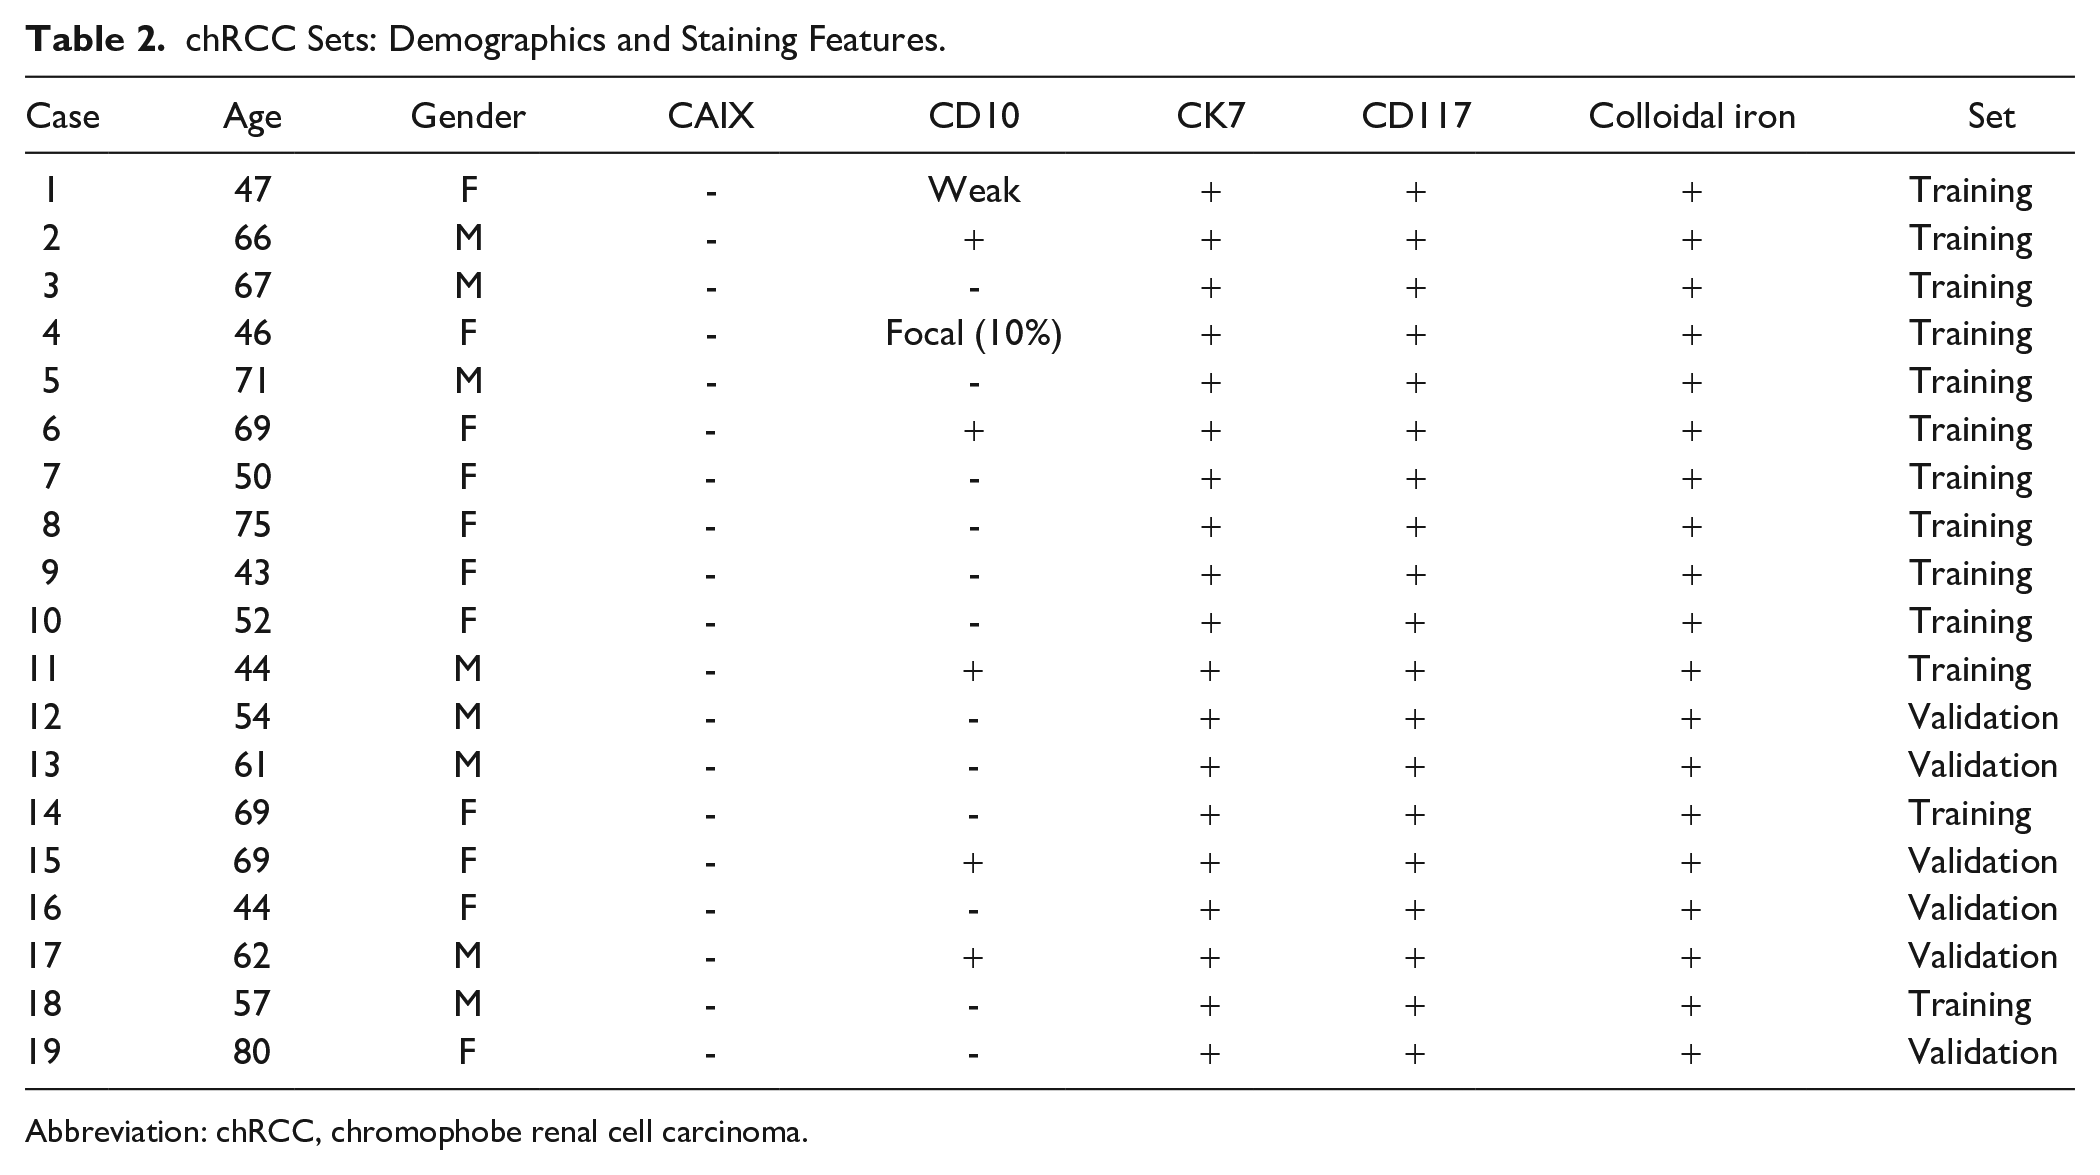
Abbreviation: chRCC, chromophobe renal cell carcinoma.
Immunohistochemistry and Colloidal Iron Stain
The immunostains were performed on Ventana Ultra Stainers using antibodies against CAIX (Cell Marque, Rocklin, CA, #379M-18), CK7 (Ventana, Tucson, AZ, #05986818001), CD10 (Ventana, #05857856001), and CD117 (Cell Marque, #117R-18). Colloidal iron stains were performed using standard methods.
Imaging Mass Spectrometry
Slide preparation
Hematoxylin-and-eosin (H&E) stained slides were prepared, and the areas of interest were marked by a pathologist using the Pathology Interface for Mass Spectrometry. 5 IMS was performed on the consecutive unstained section. Formalin-fixed paraffin-embedded blocks were prepared for mass spectrometry as previously described. 6 Briefly, blocks were sectioned at 6 µm on a microtome (Leica Biosystems., Buffalo, IL). The sections were float mounted in a heated water bath onto glass slides for histological staining or onto indium-tin oxide coated slides (Delta Technologies, Loveland, CO) for matrix-assisted laser desorption/ionization-time of flight mass spectrometry (MALDI-TOF MS) analysis. The slides were dried overnight at 37C and stored out of light until ready for use. The slides for histologic staining were deparaffinized and stained with H&E using standard methods. Once dry, the slides were scanned with an automated slide scanner (Leica SCN 400, Leica Biosystems) and uploaded to the Pathology Interface for Mass Spectrometry, 5 where a pathologist annotated the regions (300-µm diameter) for MALDI analysis.
The samples were processed in a randomized manner. Serial sections for MALDI-TOF MS analysis were deparaffinized and antigen retrieved. Briefly, slides were deparaffinized in a series of xylenes, graded ethanol, and water washes and dried completely at room temperature. Antigen retrieval was performed in a Coplin jar containing 10 mM Tris buffer, pH 9, placed in a decloaking chamber. The samples were brought to 95C in the decloaking chamber for 20 min, cooled to 90C for 10 sec and removed from the chamber. The slides were cooled for 20 min prior to buffer exchange with Milli-Q purified water. The slides were allowed to dry at room temperature, and optical images of the tissue sections were obtained on a flatbed scanner (Epson, Long Beach, CA). Trypsin and matrix were applied in a homogenous coating using a TM sprayer (HTX Imaging, Chapel Hill, NC) modified with a syringe pump. 7 Trypsin (0.64 ng/mm2 final concentration) was deposited in 8 passes in a crisscross pattern, 750 mm/min stage velocity, 8 µL/min flow rate with 2 mm track spacing, no dry time, 40 mm from the nozzle, 9.5 psi nitrogen, 30C nozzle temperature. The samples were left to digest overnight at 37C in sealed plastic Petri dishes containing 100 µL 100 mM ammonium bicarbonate (on a Wypall towel). After digestion was complete, CHCA matrix (5 mg/ml) in 90% acetonitrile, 0.1% trifluoroacetic acid was homogenously applied to the digested tissues using the HTX TM sprayer. The matrix was applied in 8 passes with the same conditions as trypsin except the stage velocity was 700 mm/min, the nozzle was heated to 85C, and 90% acetonitrile was used as the pushing solvent with a 0.1 ml/min flow rate.
Mass spectrometry analysis
The matrix-coated tissue sections were rehydrated prior to analysis at 85C for 3 min in a chamber containing 50 µL 50 mM acetic acid. 8 The samples were analyzed on a Bruker UltrafleXtreme time-of-flight mass spectrometer in reflectron positive mode from m/z 600 to 4500. Spectra were acquired only from the regions of interest notated in the PIMS software. The laser was moved in random walk mode in a 150 µm diameter area centered on each region of interest (ROI). A total of 1000 shots were summed from a series of 50 shot steps as the laser was moved within the ROI. Data were exported as text files for each region, where they were then averaged by patient and subjected to further data analysis.
The spectra were processed with baseline subtraction, peak alignment, and total ion current (TIC) normalization. Briefly, spectra were pre-processed using MALDIquant in the R environment. 9 After data import, the spectra were baseline corrected to remove MALDI chemical noise using the SNIP algorithm with 20 iterations. 10 After baseline correction, the spectral data were normalized by the TIC to account for pixel-to-pixel signal artifacts. 11 The spectral data were then statistically re-aligned to a reference spectrum to remove inherent mass shifts from the TOF instrument. The reference spectrum used for realignment was that closest to the 50th quantile of the TIC distribution of all data. Following mass axis alignment, peaks with signal-to-noise ratio above 3 were selected on the overall mean spectrum from all data combined. The intensity data (peak height) for each selected peak was tabulated for the spectra collected from each tumor focus (ROI), resulting in a data matrix where observations (rows) are individual pixels (sampled tumor foci) labeled by de-identified patient serial number and pathologist annotation (ccRCC vs chRCC) and variables (columns) are the intensities of each peak included in the dataset. Student’s t-test was used to identify significant (p<0.01) differences in peak intensity between the two groups (ccRCC versus chRCC).
Building Classification Model
The data matrix described above was submitted to a support vector machine (SVM) algorithm with a linear kernel. SVM models were developed on the pre-processed MS data in the R package caret. 12 Principles specific for chemometric data for training the data were derived from Luts et al. 13 SVMs with linear, radial, and polynomial kernels were tested and linear produced a 10% improvement in accuracy compared to the other models. Previous IMS classification studies have also found linear SVMs effective for these data.14,15 Training of the SVM was performed with fivefold cross validation, in which the model withheld 1/5 of the training data, optimized the model, then withheld another 1/5 of the data and repeated for a total of 5 iterations. Five-fold cross validation was performed to improve the model by allowing a large enough portion (80%) to go into model development, while also a large enough cross-validation portion (20%) to effectively test and iteratively optimize model parameters. The final model was selected based on accuracy achieved among all the models generated during cross-validation.
Results
Case Cohort
We utilized 39 cases (20 ccRCC and 19 chRCC) showing typical histomorphology. Special stains for ccRCC and chRCC were performed to confirm the histologic diagnosis, using the International Society for Urological Pathology (ISUP) recommended stains (carbonic anhydrase IX, CD10, CK7, cKIT, colloidal iron); all tumors showed the expected staining pattern (Tables 1 and 2; Figs 1 and 2). 16 One of the selected cases (chRCC) was excluded from analysis due to tissue loss during processing for IMS, despite repeated attempts.
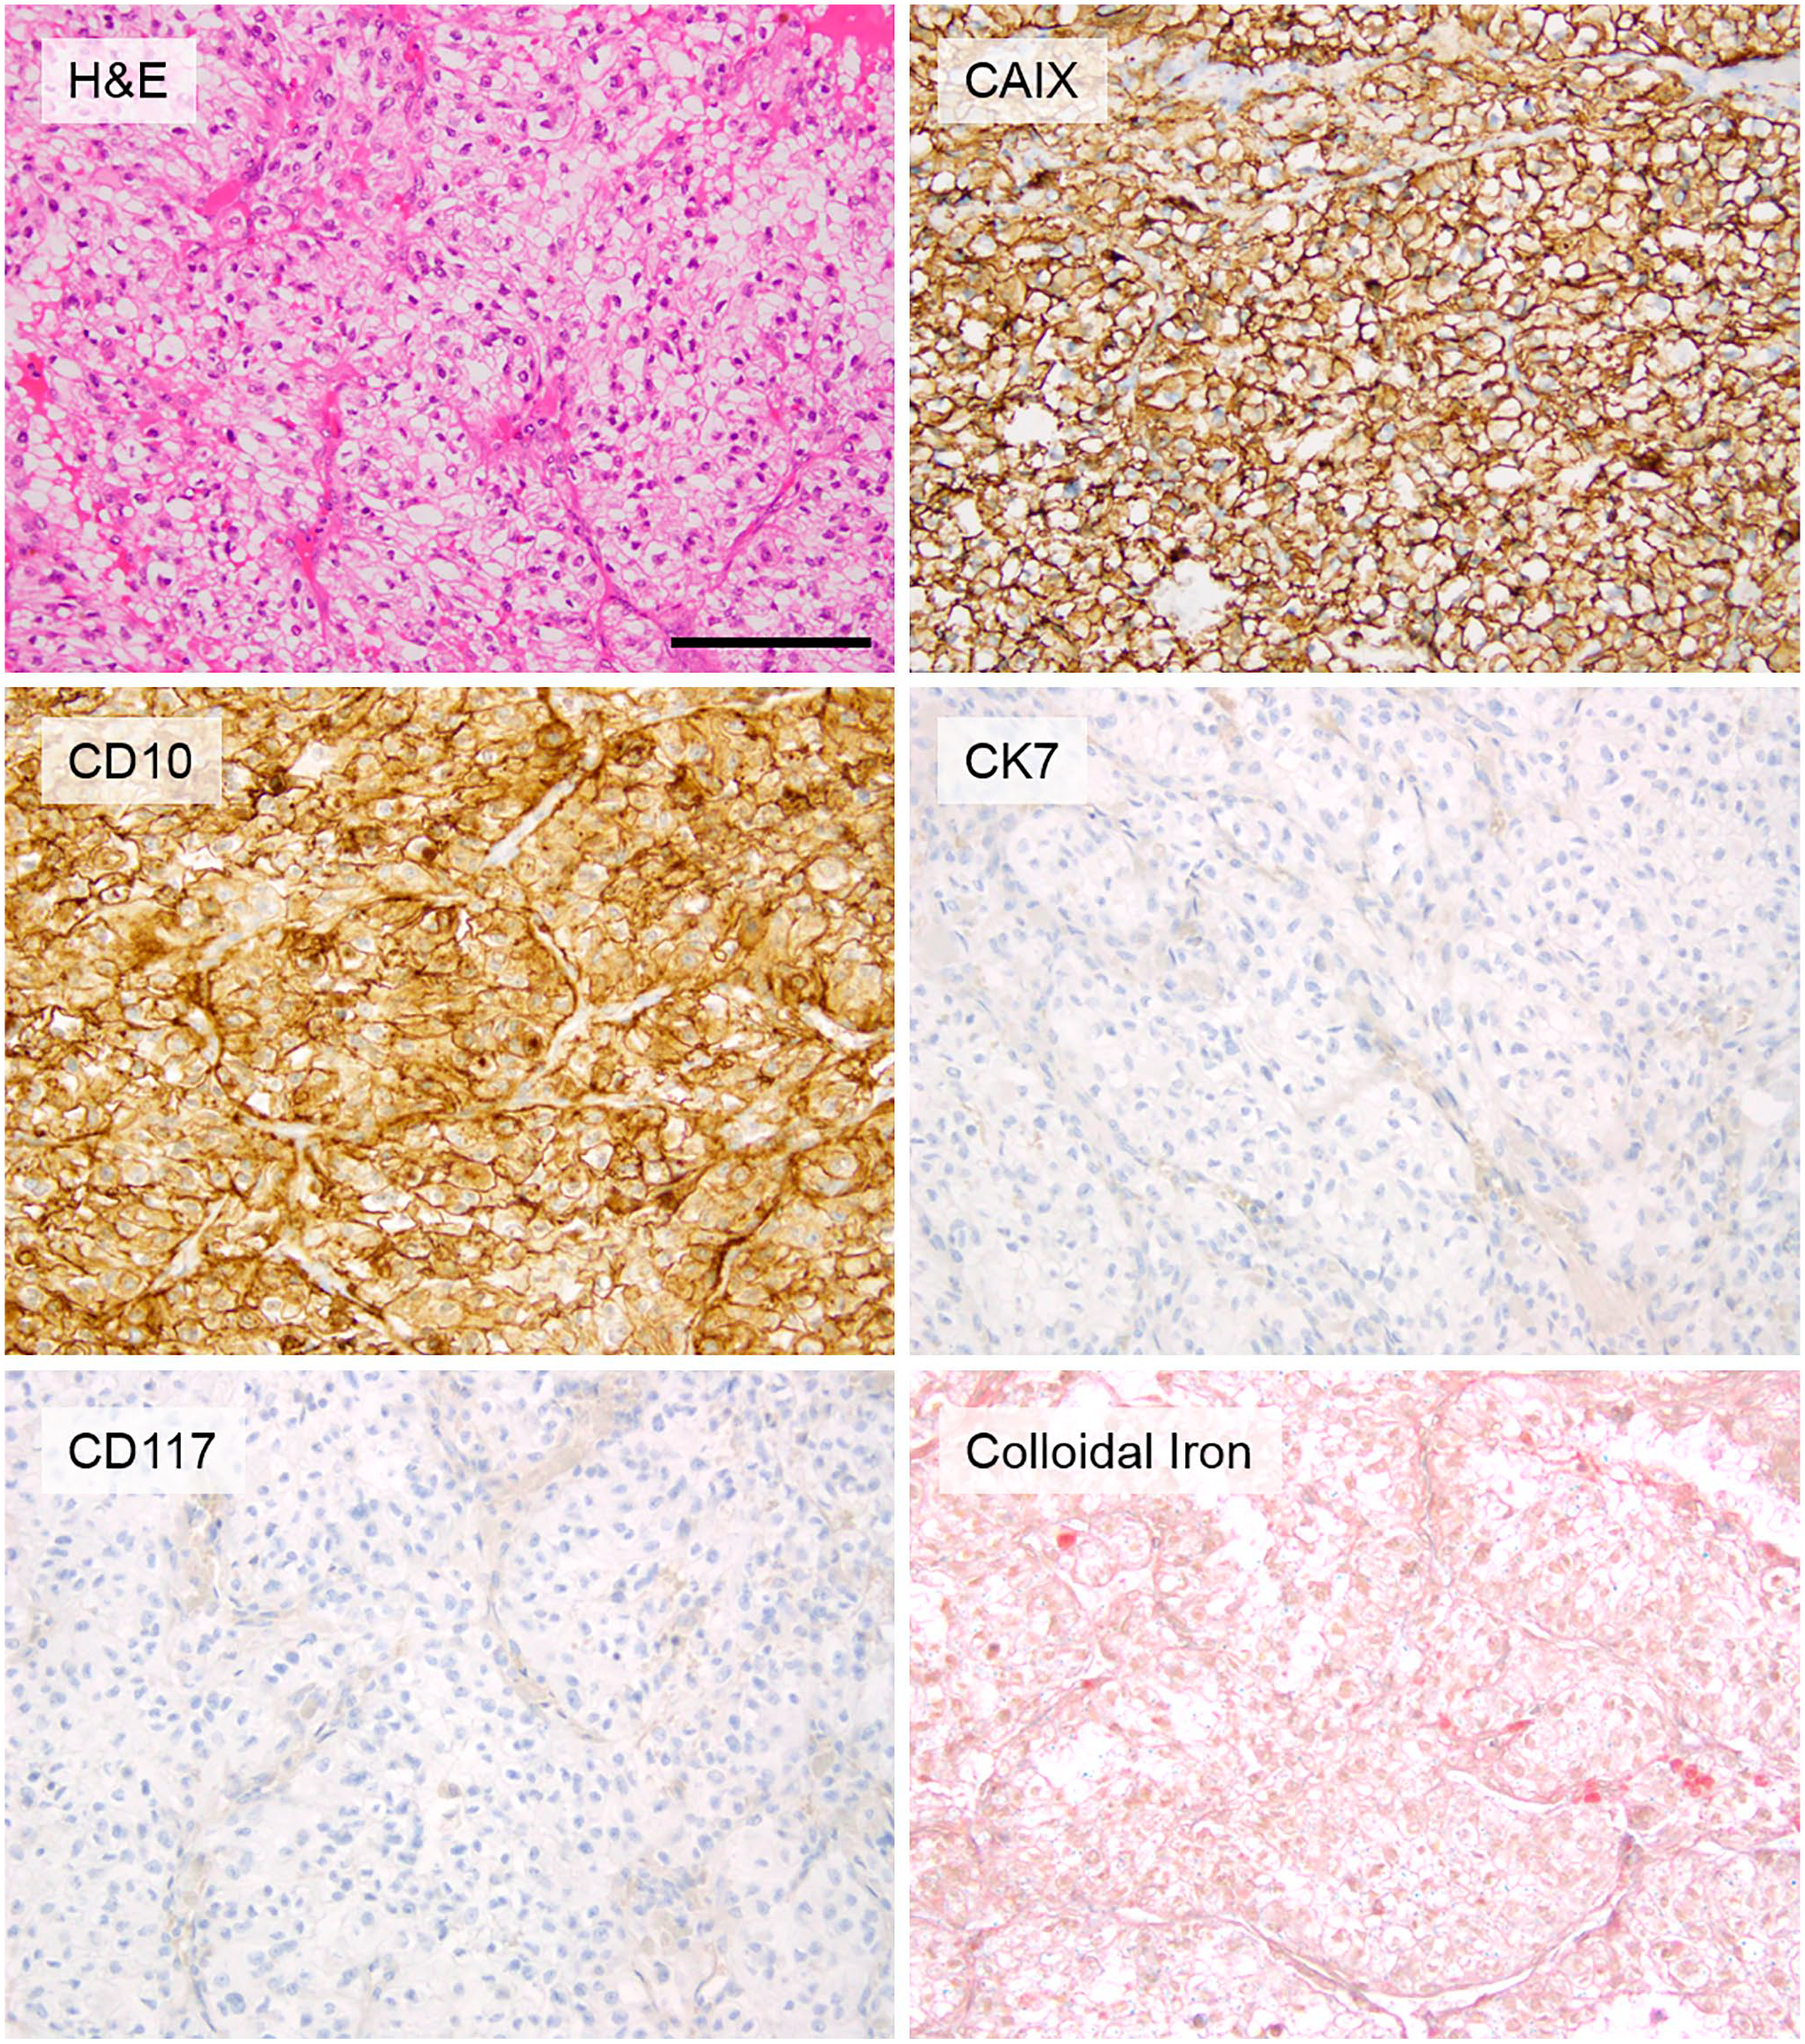
Representative histomorphology and staining pattern for ccRCCs in the cohort. (Scale bar = 100 µm). Abbreviation: ccRCC, clear cell renal cell carcinoma.
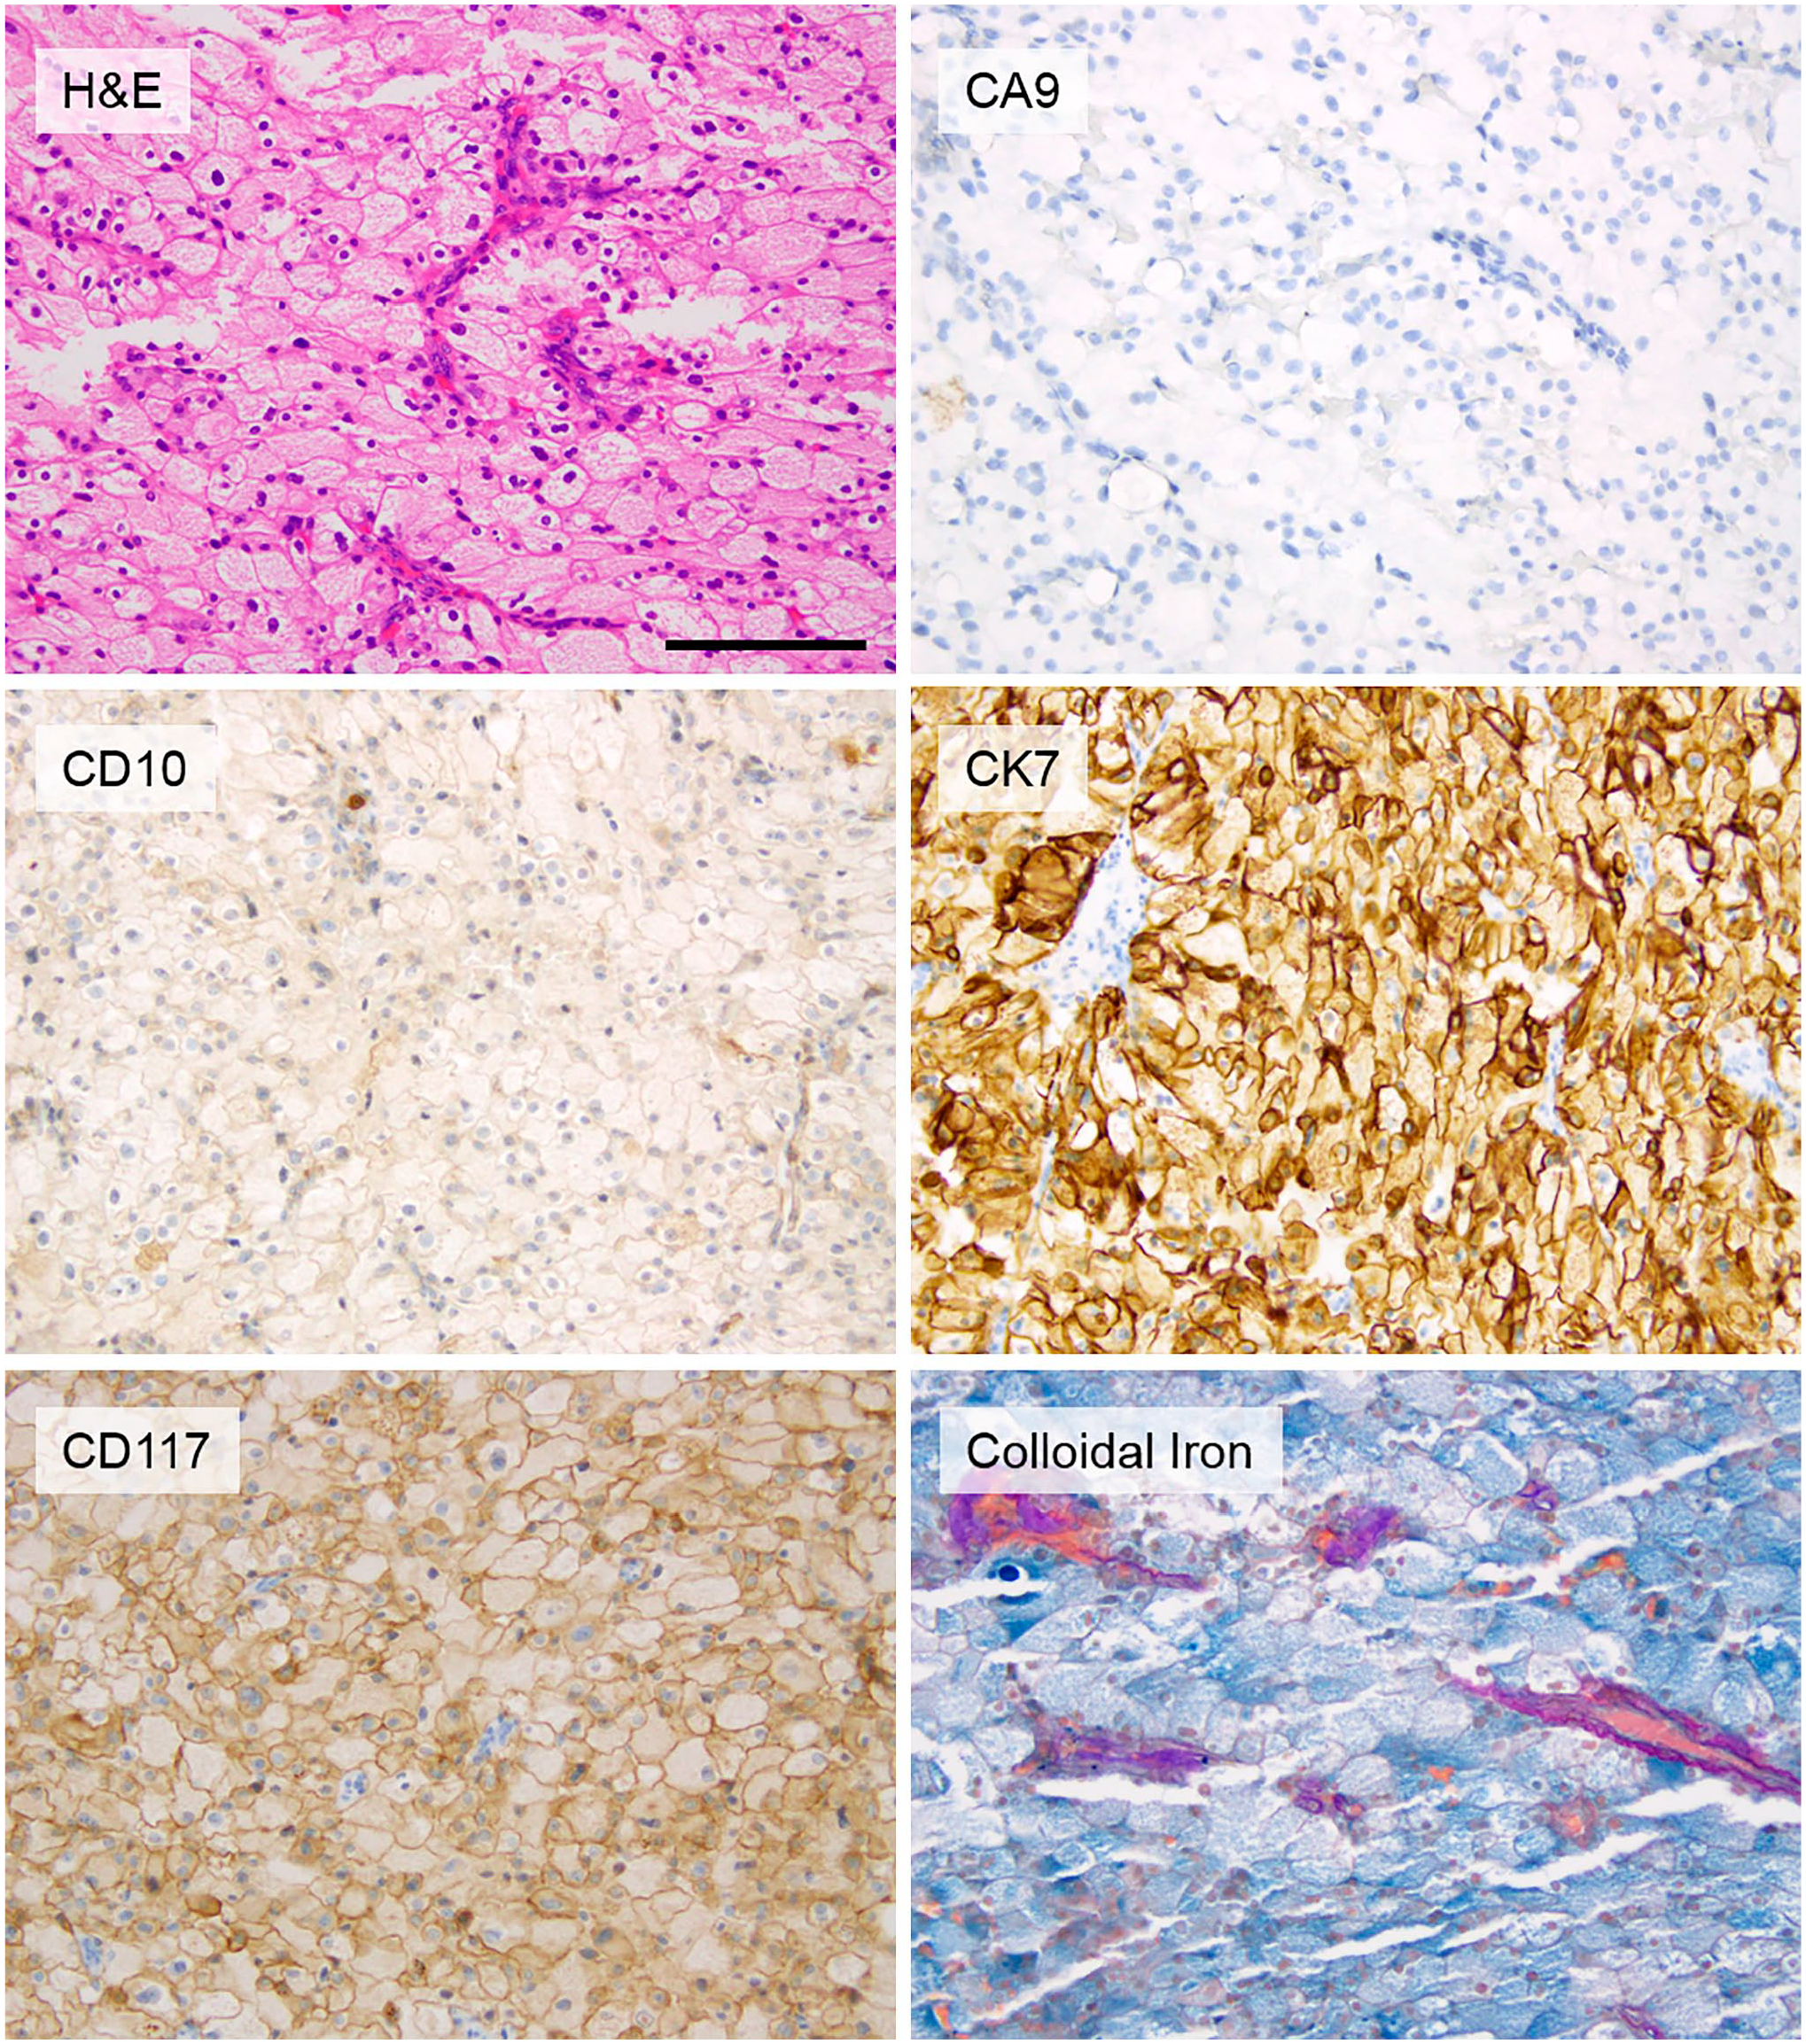
Representative histomorphology and staining pattern for chRCCs in the cohort. (Scale bar = 100 µm). Abbreviation: chRCC, chromophobe renal cell carcinoma.
Imaging Mass Spectrometry
A total of 1121 IMS peaks with a signal-to-noise ratio of >3 were selected (Fig. 3, Table 3) and used for building the classification model. The classification model was tested on 19 to 20 foci from each tumor in the validation set of 6 ccRCC and 6 chRCC; each focus was individually classified as ccRCC or chRCC by the IMS classification model (Table 4). Most foci (236 of 238 total interrogated tumor foci across the 12 validation set cases) were correctly classified as ccRCC or chRCC (99% accuracy, kappa=0.98). Two foci from one ccRCC (case 19) were incorrectly classified as chRCC. The histomorphology of the misclassified spots were reviewed but did not show any apparent difference from the rest of the tumor (Supp. Fig. 1).
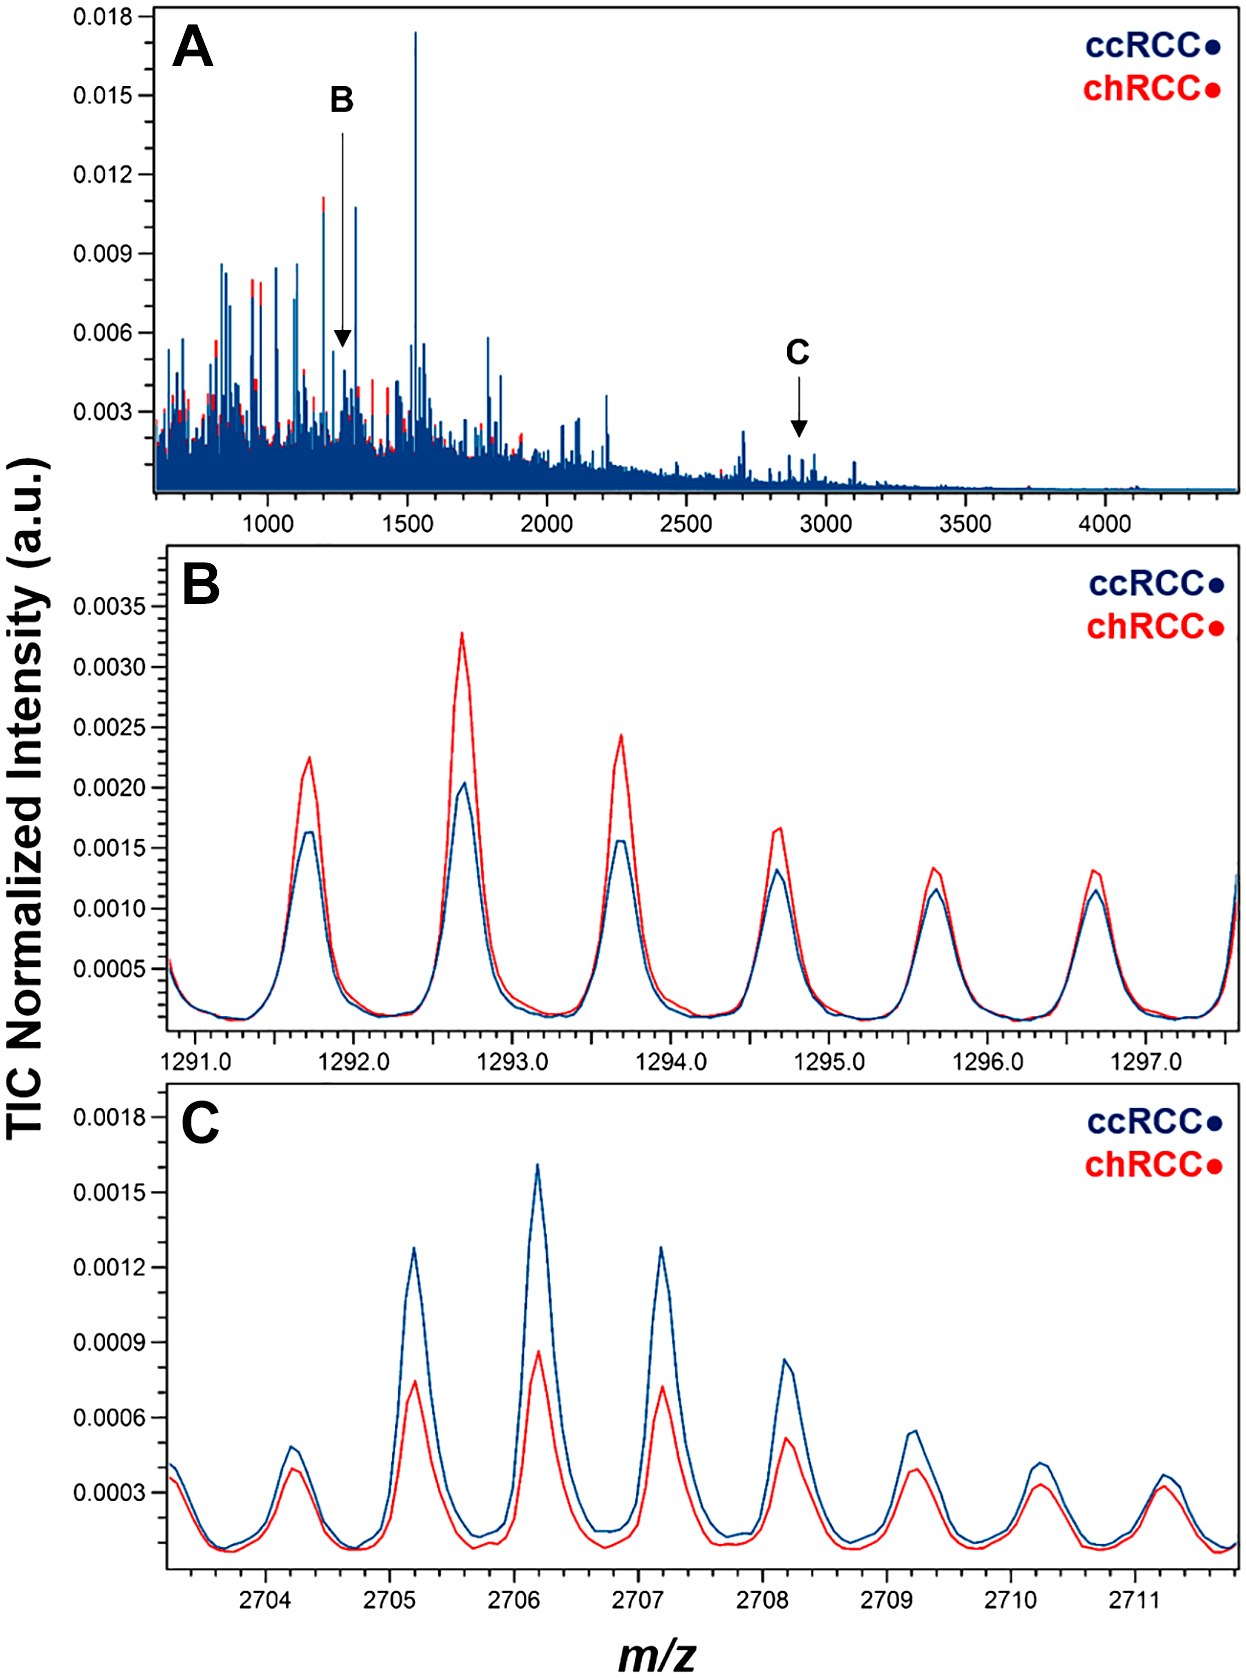
Average mass spectra for ccRCC and chRCC samples. (A) Full average mass spectrum. Arrows indicate m/z position of the panels below. (B) Zoom view of peak at m/z 1292.68, associated with chRCC. (C) Zoom view of peak at m/z 2706.20, associated with ccRCC.
Top Markers Differentiating ccRCC versus chRCC.
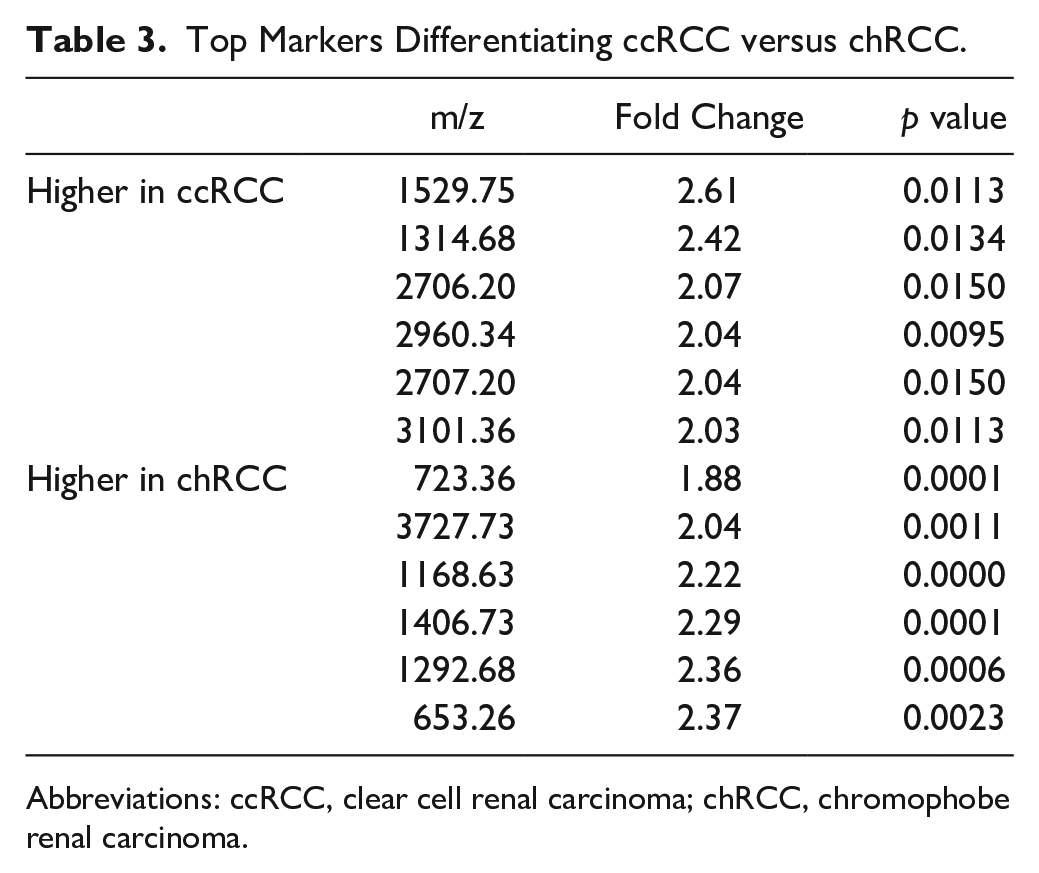
Abbreviations: ccRCC, clear cell renal carcinoma; chRCC, chromophobe renal carcinoma.
Classification Results for Validation Set ccRCC and chRCC.
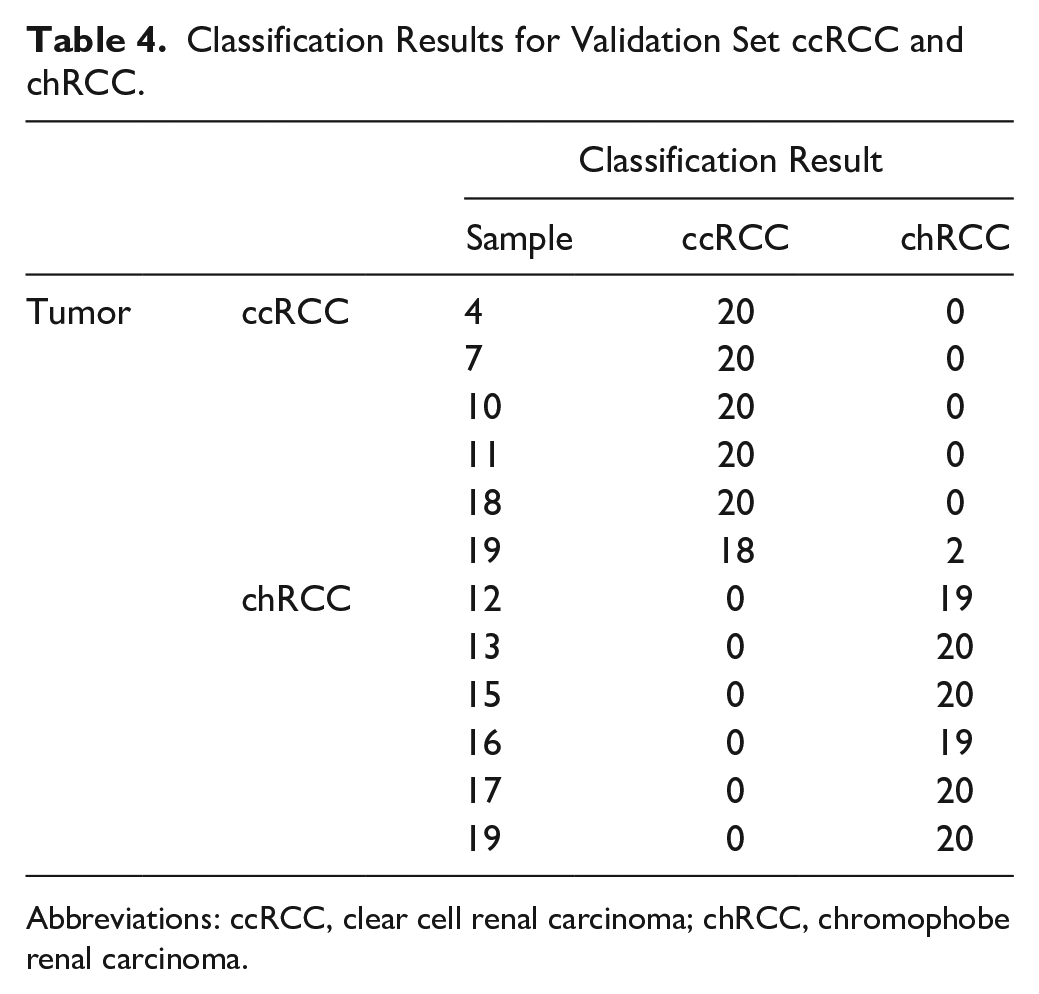
Abbreviations: ccRCC, clear cell renal carcinoma; chRCC, chromophobe renal carcinoma.
Discussion
IMS is an emerging tool that has been used successfully in differentiating Spitz nevi and Spitzoid malignant melanoma. 4 It has recently been used in studying triple negative breast cancer, thyroid tumors, ovarian cancer, and malignant pleural and peritoneal effusion.15,17-20 IMS has the advantage of profiling a large number of biomarkers simultaneously. 21 It also requires only a small amount of tumor tissue (0.018 mm2 per ROI; ~0.35 mm2 in total on a single 6 µm slide, per case, in our study). Therefore, IMS is a promising technology for evaluating small biopsies that may require multiple immunostains or special stains. In addition, IMS can directly detect analytes, thus avoiding the problem of non-specific cross-reactivity that can sometimes complicate interpretation of antibody-based immunostains. IMS also has the advantage of evaluating the quantitative differences between the biomarkers, instead of the generally qualitative assessments performed via routine immunostains or special stains, which could be useful in further analyses. Nonetheless, IMS does have some limitation, including signal suppression effects due to the complexity of the tissue composition, difficulty in downstream identification of the protein based on the MS peaks, and relatively few protein signals compared to spectra obtained from homogenized tissue samples.
The differential diagnosis of renal tumors with eosinophilic features can be broad, including ccRCC, chRCC, oncocytoma, eosinophilic variant of papillary RCC, translocation RCC, succinate dehydrogenase-deficient RCC, hereditary leiomyomatosis and renal cell carcinoma (HLRCC)-associated RCC, epithelioid angiomyolipoma, and others. Multiple immunostains and/or special stains may be required to correctly classify tumors. While correct tumor classification is important for prognostication and treatment, evaluation by stain panels can be complicated by tissue depletion and atypical staining patterns. Additionally, in many centers, immunostains that are helpful in the differential diagnosis of eosinophilic renal tumors (e.g., succinate dehydrogenase B or fumarate hydratase immunostains) are not readily available, leading to suboptimal tumor classification and/or delays in diagnosis.
ccRCC (particularly grade 3 and 4 tumors) and chRCC are common tumor types in the differential of eosinophilic renal tumors. In this proof-of-concept study, we have shown that IMS is a highly accurate tool for distinguishing grade 3 ccRCC from chRCC, using a miniscule amount of tumor for analysis. Future studies can evaluate the diagnostic utility of IMS in differentiating other entities in the differential diagnosis of eosinophilic renal neoplasms, with an eye to optimizing tissue utilization while achieving highly accurate tumor classification. Additionally, IMS may have future utility in classifying tumors that are currently diagnosed as RCC of unclassified type, many of which also have eosinophilic features.
Recently, large-scale studies have shown that epigenetic or gene expression alterations affect prognosis within histologic subtypes. 1 Given the unique features of IMS, it is conceivable the larger future studies also could be used to develop prognostic assays for each of the tumor types, based on evaluation of epigenetic or gene expression alterations, even while using an extremely small amount of tumor tissue.
The current study is a proof-of-concept study with limited scale and scope. To translate the findings of IMS into a clinical setting, additional studies are needed to confirm and identify the proteins we found as differentially expressed between ccRCC and chRCC. Further evaluation of these proteins could lead to development of potential biomarkers for clinical use; application of immunohistochemical analysis of the proteins could provide additional value in a tissue context. Future studies focusing on identifying the differentially expressed proteins will no doubt expand the clinical utility of our findings. As for IMS techniques, there are additional challenges that also need to be overcome before it can be routinely utilized in a clinical setting, 21 including standardization of sample preparation and analysis across platforms. The sensitivity and specificity of different IMS platforms also need to be systemically evaluated. Finally, technical expertise and equipment for performing IMS is limited currently to reference centers.
Overall, we demonstrated that IMS is able to differentiate between two common entities (ccRCC and chRCC) in the differential diagnosis of eosinophilic renal neoplasms, using only a very small amount of tumor tissue. Future studies can further evaluate the diagnostic and prognostic utility of IMS across an expanded array of renal tumor types.
Supplemental Material
2020-00023R1_Production_Supplemental_Data_online_supp – Supplemental material for Imaging Mass Spectrometry is an Accurate Tool in Differentiating Clear Cell Renal Cell Carcinoma and Chromophobe Renal Cell Carcinoma: A Proof-of-concept Study
Supplemental material, 2020-00023R1_Production_Supplemental_Data_online_supp for Imaging Mass Spectrometry is an Accurate Tool in Differentiating Clear Cell Renal Cell Carcinoma and Chromophobe Renal Cell Carcinoma: A Proof-of-concept Study by Hsiang-Chih Lu, Nathan Heath Patterson, Audra M. Judd, Michelle L. Reyzer and Jennifer K. Sehn in Journal of Histochemistry & Cytochemistry
Footnotes
Competing Interests
The author(s) declared no potential conflicts of interest with respect to the research, authorship, and/or publication of this article.
Author Contributions
H-CL and JKS designed the study, reviewed the slides, reviewed immunostains and special stains, and drafted the manuscript. NHP, AMJ, and MLE performed and analyzed imaging mass spectrometry data. All authors participated in correlation of IMS and histopathology findings. All authors have read and approved the final manuscript.
Funding
The author(s) disclosed receipt of the following financial support for the research, authorship, and/or publication of this article: The work is supported by the Department of Pathology and Immunology, Washington University School of Medicine in St. Louis, St. Louis, MO.
References
Supplementary Material
Please find the following supplemental material available below.
For Open Access articles published under a Creative Commons License, all supplemental material carries the same license as the article it is associated with.
For non-Open Access articles published, all supplemental material carries a non-exclusive license, and permission requests for re-use of supplemental material or any part of supplemental material shall be sent directly to the copyright owner as specified in the copyright notice associated with the article.