
Abstract
Summary
Cholestasis is a condition wherein bile flow is interrupted and lithocholic acid is known to play a key role in causing severe liver injury. In this study, we performed in-depth analysis of the morphological changes in bile canaliculi and the biological role of villin in cholestasis using lithocholic acid-stimulated HepG2 human hepatocarcinoma cells. We confirmed disruption of the bile canaliculi in liver sections from a liver allograft patient with cholestasis. Lithocholic acid caused strong cytotoxicity in HepG2 cells, which was associated with abnormal morphology. Lithocholic acid reduced villin expression, which recovered in the presence of nuclear receptor agonists. Furthermore, villin mRNA expression increased following small interfering RNA (siRNA)-mediated knockdown of the nuclear farnesoid X receptor and pregnane X receptor. Villin knockdown using siRNA caused cell growth arrest in HepG2 cells. The effect of villin-knockdown on whole-genome expression in HepG2 cells was analyzed by DNA microarray. Our data suggest that lithocholic acid caused cell growth arrest by suppressing villin expression via farnesoid X receptor and pregnane X receptor in HepG2 cells.
Introduction
Cholestasis is a pathological condition in which bile formation or bile flow is interrupted.1,2 Persistent cholestasis causes severe liver injury, leading to cholestatic cirrhosis. Ursodeoxycholic acid (UDCA) is the only therapeutic choice for these patients in alternative to liver transplantation. 3 Many animal models have been used to investigate cholestasis. Induction of biliary porphyrin secretion by 3,5-diethoxycarbonyl-1,4-dihydrochollidine (DDC) is also known to cause cholestatic diseases, although these are milder than those induced by lithocholic acid (LCA). We previously investigated liver pathology in a DDC-fed mouse model of sclerosing cholangitis and found abnormal bile canalicular morphology in the early stage of cholestasis. 4
Bile canaliculi, formed by adjacent hepatocytes, are the smallest hepatic spaces into which hepatocytes directly secrete bile acids, and they are essential for the efficient outflow of bile. 5 Bile canaliculi are sealed by tight junctions and contain specifically localized proteins, including bile acid exporters. However, the molecular mechanisms underlying their morphogenesis and modification during pathological conditions remain unclear. We previously observed unusual bile canalicular morphology and abnormal localization of serine/threonine kinase 17A in liver allografts at risk of chronic rejection, under conditions of strong cholestasis. 6 This finding is an important marker of early rejection. Disruption of bile duct and canaliculus formation occurs in Alagille syndrome, which is caused by a jagged 1 mutation. 7 Abnormalities in bile canaliculi have also been observed in association with reduced villin expression and with liver-specific beta-catenin knockout in mice.8,9 The relationship between these molecules and bile canalicular structure has not been completely elucidated; further research on bile canalicular abnormalities would help improve our understanding of the pathogenesis and diagnosis of cholestatic diseases.
LCA is a secondary bile acid that is produced as a metabolite of cholesterol by bacterial bile acid biotransformation and is highly hepatotoxic under cholestasis conditions.10,11 LCA-fed mice develop cholestatic liver disease because of destruction of the intra- or extrahepatic bile ducts and serve as a model of primary sclerosing cholangitis.12,13 LCA has been shown to serve as a ligand of the nuclear pregnane X receptor (PXR). 14 However, Yu et al. showed that LCA downregulated the bile salt export pump by acting on the nuclear farnesoid X receptor (FXR) in HepG2 cells. 15 Kawamata et al. reported that LCA was an agonist of G-protein-coupled bile acid receptor 1 (TGR5). 16 Avior et al. proposed that LCA and vitamin K2, which are metabolites produced by intestinal bacteria, stimulated postpartum metabolic maturation of hepatocytes by activating the PXR. 17 These findings indicate that LCA plays a key role in tissue development and nutrient metabolism by modulating downstream gene expression via its effect on nuclear receptors.
Monolayer cultures of human HepG2 hepatocarcinoma cells form bile canaliculi and provide a useful experimental model of cellular polarity, even though only 20% to 40% of the cells are actually polarized.18–20 Here, we employed an in vitro model of chronic cholestasis, whereby HepG2 cells were stimulated with LCA in culture. The system was used to investigate the molecular mechanisms underlying the disruption of bile canaliculi in cholestasis.
Materials and Methods
Cell Culture
HepG2 cells were provided by the RIKEN BioResource Center through the National Bio-Resource project of the Ministry of Education, Culture, Sports, Science, and Technology, Japan. Cells were cultured in poly-
Immunohistochemistry
Formalin-fixed paraffin-embedded (FFPE) liver sections from five patients with biliary atresia (age range, 0–33 years) and a healthy adult donor involved in living-donor liver transplantation were probed with an anti-human carcinoembryonic antigen-related cell adhesion molecule 1 (CEACAM1) antibody (R&D Systems; Minneapolis, MN). In addition, a series of liver sections sequentially biopsied from a patient after living-donor liver homograft was examined. This patient was eventually diagnosed with chronic rejection on postoperative day 318. The primary antibody was visualized using a HistoStar (Ms + Rb) anti-mouse and antirabbit immunostaining reagent (Medical and Biological Laboratories Co. Ltd.; Nagoya, Japan) according to the manufacturer’s protocol. Immunohistochemical images were acquired using an Olympus BX50 microscope (Tokyo, Japan) with a differential interference contrast filter set and a QImaging MicroPublisher 3.3 RTV camera (Surrey, BC, Canada). All human samples were voluntarily provided, following written consent of the patients and/or their families, and were used with permission from the ethical committee at the Graduate School of Medicine, Kyoto University (approval number E1124). The control experiments were performed on normal liver FFPE thin sections purchased from US Biomax (Rockville, MD). The mouse IgG isotype control antibody MG1-45 (BioLegend, San Diego, CA) was used as a negative control (Supplemental Fig. 1).
Transmission Electron Microscopy (TEM)
HepG2 cells treated with 0.15% DMSO or 150 µM LCA for 24 hr were washed with phosphate-buffered saline, incubated in 4% paraformaldehyde containing 2% glutaraldehyde in phosphate buffer at 4C, in Celsius units for 24 hr, treated with 1% OsO4 for 1 hr at 4C, in Celsius units, washed again, and stored overnight at 4C, in Celsius units. The cells were dehydrated using a series of ethanol-water treatments and embedded in eponate. Thin sections were double-stained with uranyl acetate and lead citrate. The sections were observed and photographed using a Hitachi H-7650 transmission electron microscope (Tokyo, Japan) equipped with an Advanced Microscopy Techniques XR-41C camera (Woburn, MA).
Fluorescence Microscopy
HepG2 cells were treated with 0.15% DMSO or 150 µM LCA for 24 hr. F-actin staining was performed using Alexa 594-labeled phalloidin (Thermo Fisher Scientific). The nucleus was visualized using 4′,6-diamidino-2-phenylindole dihydrochloride (DAPI). Fluorescence imaging analysis was performed using a Leica TCS SP8 laser-scanning microscope (Wetzlar, Germany) in photon-counting mode. HepG2 cells treated with 150 µM LCA along with a nuclear receptor agonist (10 µM T0901317 or 25 µM rifampicin) were stained with ActinGreen 488 Ready Probes (Thermo Fisher Scientific), and images were obtained using an Olympus IX71 microscope equipped with a Qimaging Exi Blue camera. DNA synthesis was evaluated by 5-ethynyl-2′-deoxyuridine (EdU) incorporation assay using Click-iT Plus (Thermo Fisher Scientific) according to the manufacturer’s instructions. Images were obtained using an Olympus IX71 microscope with a 10× objective, and positive nuclei were counted using ImageJ software (see https://imagej.nih.gov/ij/).
Estimation of Protein Expression
Cells were washed with phosphate-buffered saline and lysed in 50 mM Tris-HCl buffer (0.15 M NaCl; 1 mM ethylenediaminetetraacetic acid; 1% NP-40; 0.25% sodium deoxycholate; 1 mM phenylmethylsulfonyl fluoride; and 1 µg/mL aprotinin, leupeptin, and pepstatin; pH 7.4) for 15 min on ice before centrifugation at 15,000 × g for 30 min at 4C, in Celsius units. The protein concentration in the supernatant was estimated using a bicinchoninic acid protein assay kit (Thermo Fisher Scientific), after which 20 µg of protein was subjected to sodium dodecyl sulfate–polyacrylamide gel electrophoresis. The separated proteins were blotted onto a polyvinylidene fluoride membrane and blocked at 4C, in Celsius units overnight with 5% skim milk or 1% bovine serum albumin in Tris-buffered saline (pH 7.4) containing 0.1% Tween 20. Proteins were detected using the enhanced chemiluminescence (ECL) prime western blotting detection reagent, according to the manufacturer’s instructions (GE Healthcare; Bucking-hamshire, UK). The antibodies used in this study were anti-villin rabbit monoclonal antibody (ab130751, 1:400) and anti-glyceraldehyde-3-phosphate dehydrogenase (GAPDH) mouse monoclonal antibody (ab9484, 1:1000) from Abcam (Cambridge, UK), and horseradish peroxidase-labeled anti-mouse (NA931V, 1:1000) and antirabbit (NA934V, 1:1000) IgG antibodies from GE Healthcare.
Estimation of mRNA Expression
HepG2 cells were cultured with 150 µM LCA and/or nuclear receptor agonists (10 µM T0901317, 25 µM rifampicin, or 1 µM INT-747) for 24 hr, and the same amount of DMSO or ethanol was used as a negative control. Total RNA was isolated using TRIzol reagent (Thermo Fisher Scientific) according to the manufacturer’s protocol, followed by RQ1 RNase-free DNase treatment (Promega; Madison, WI). Reverse transcription was performed using the Superscript III cDNA Synthesis Kit (Thermo Fisher Scientific) following the manufacturer’s instructions. Quantification was performed by real-time polymerase chain reaction (PCR) on a QIAGEN Rotor-Gene Q system (Venlo, the Netherlands) with GoTaq qPCR Master Mix (Promega) as per Promega’s instructions with the following modifications: 20 μL total volume and 0.25 µM final primer concentration. The mRNA expression of target genes FXR, PXR, liver X receptor α (LXRα), vitamin D receptor (VDR), cytochrome P450, family 3, subfamily A, polypeptide 4 (CYP3A4), villin, eukaryotic translation elongation factor 1 beta 2 (EEF1B2), SP140, F-box protein 31 (FBXO31), and integrin subunit alpha L (ITGAL) was normalized against that of GAPDH, which was used as internal control. Fold expression was calculated by setting the expression in control cells to 1. PCR primer sequences used in this study are listed in Table 1. PCR primers for EEF1B2, SP140, FBXO31, and ITGAL were purchased from Takara (Shiga, Japan).
Real-Time PCR Primers.
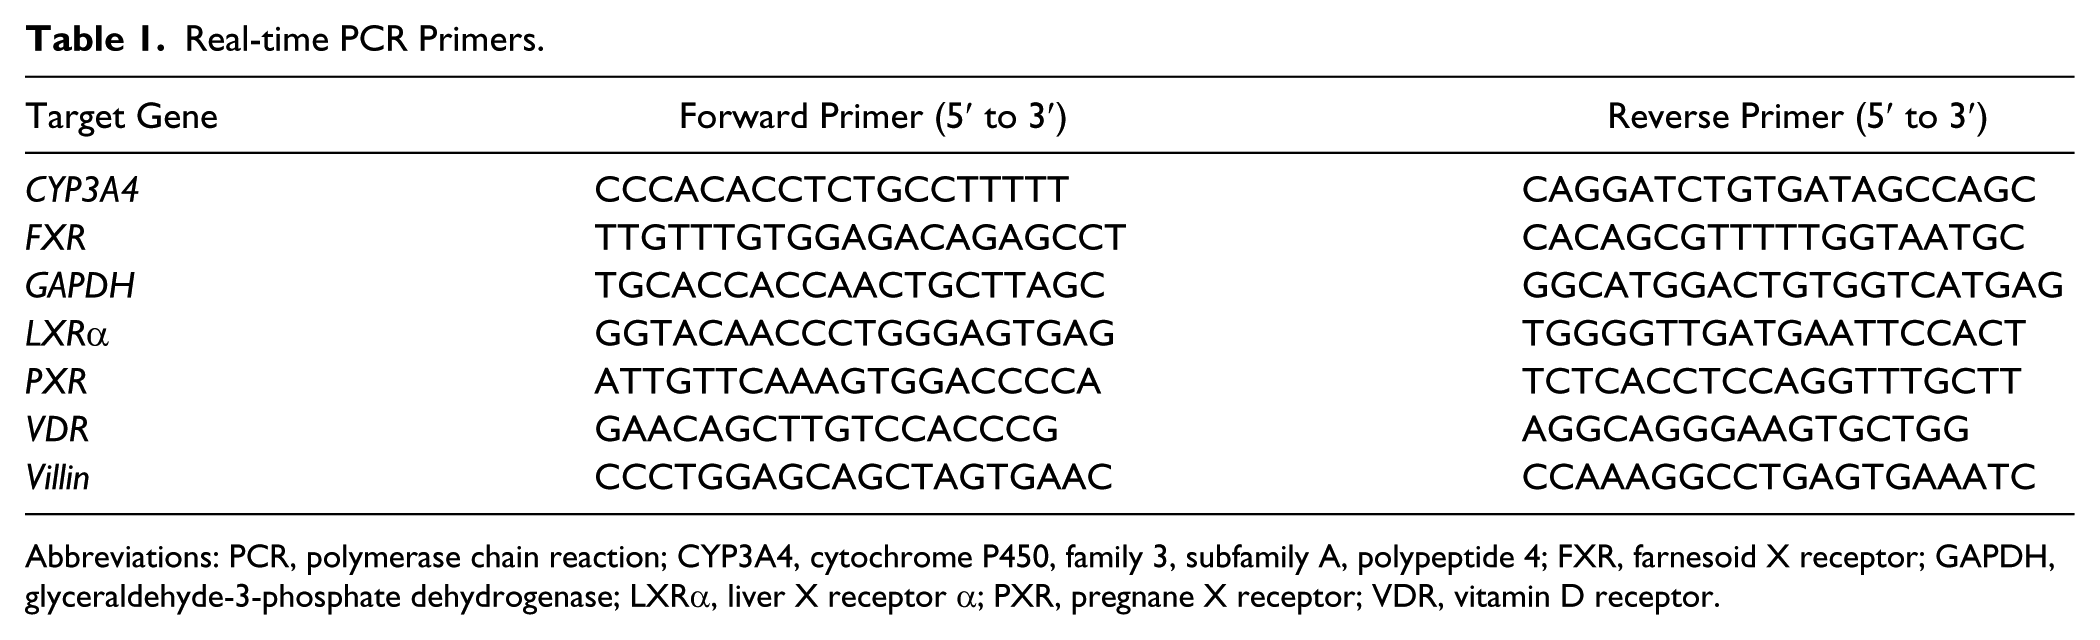
Abbreviations: PCR, polymerase chain reaction; CYP3A4, cytochrome P450, family 3, subfamily A, polypeptide 4; FXR, farnesoid X receptor; GAPDH, glyceraldehyde-3-phosphate dehydrogenase; LXRα, liver X receptor α; PXR, pregnane X receptor; VDR, vitamin D receptor.
Gene Knockdown Using Small Interfering RNA (siRNA)
Silencer Select siRNA oligonucleotides targeting FXR (s225196 and s225197), LXRα (s19568 and s19569), PXR (s16909, s16910, and s16911), and villin (s14792 and s14794), as well as negative control siRNA, were purchased from Thermo Fisher Scientific. HepG2 cells were transfected with siRNAs using RNAiMAX (Thermo Fisher Scientific) according to the manufacturer’s protocol, at a final concentration of 30 nM for FXR and LXRα, 45 nM for PXR (each siRNA oligo was used at 15 nM), and 10 nM for villin (each siRNA oligo was used at 5 nM). After 72 hr, total RNA or protein were prepared for real-time PCR or western blotting, respectively.
DNA Microarray Analysis
Whole-genome expression analysis of villin-knockdown HepG2 cells was performed using Oligo DNA microarray analysis. Briefly, cell samples were collected at 72 hr after siRNA transfection. Cell sample-transfected negative control siRNA was used as control. The 3D-Gene Human Oligo chip 25k (Toray Industries Inc.; Tokyo, Japan) was used for this analysis. For efficient hybridization, this microarray is three-dimensional and is constructed with a well as the space between the probes and cylindrical stems, with 70-mer oligonucleotide probes on top. Total RNA was labeled with Cy5 using the Amino Allyl MessageAMP II aRNA Amplification Kit (Applied Biosystems; Foster City, CA). Hybridization was performed using the supplier’s protocols (see www.3d-gene.com). Hybridization signals were obtained using 3D-Gene Scanner (Toray Industries Inc.) and processed by 3D-Gene Extraction (Toray Industries Inc.). The signals detected for each gene were normalized by the global normalization method, with the median of the detected signal intensity being adjusted to 25.
Statistical Analysis
Student’s t test was used to compare data from treated and untreated HepG2 cells. p<0.05 was considered statistically significant.
Results
Disrupted Bile Canaliculi Under Cholestasis Conditions
Bile canaliculi were stained using an anti-CEACAM1 antibody in sections obtained from a biliary atresia patient and a healthy donor. In the healthy donor, bile canaliculi were visualized as dots or thin lines (Fig. 1A), depending on their direction. In contrast, in sections from the patient, disrupted bile canaliculi were observed as wider and budded structures. Moreover, bile canaliculus disruption was observed even at an early stage of cholestasis (Fig. 1B). This patient was eventually diagnosed with chronic rejection on postoperative day 318, although disruption of bile canaliculi was clearly visible already on day 55.
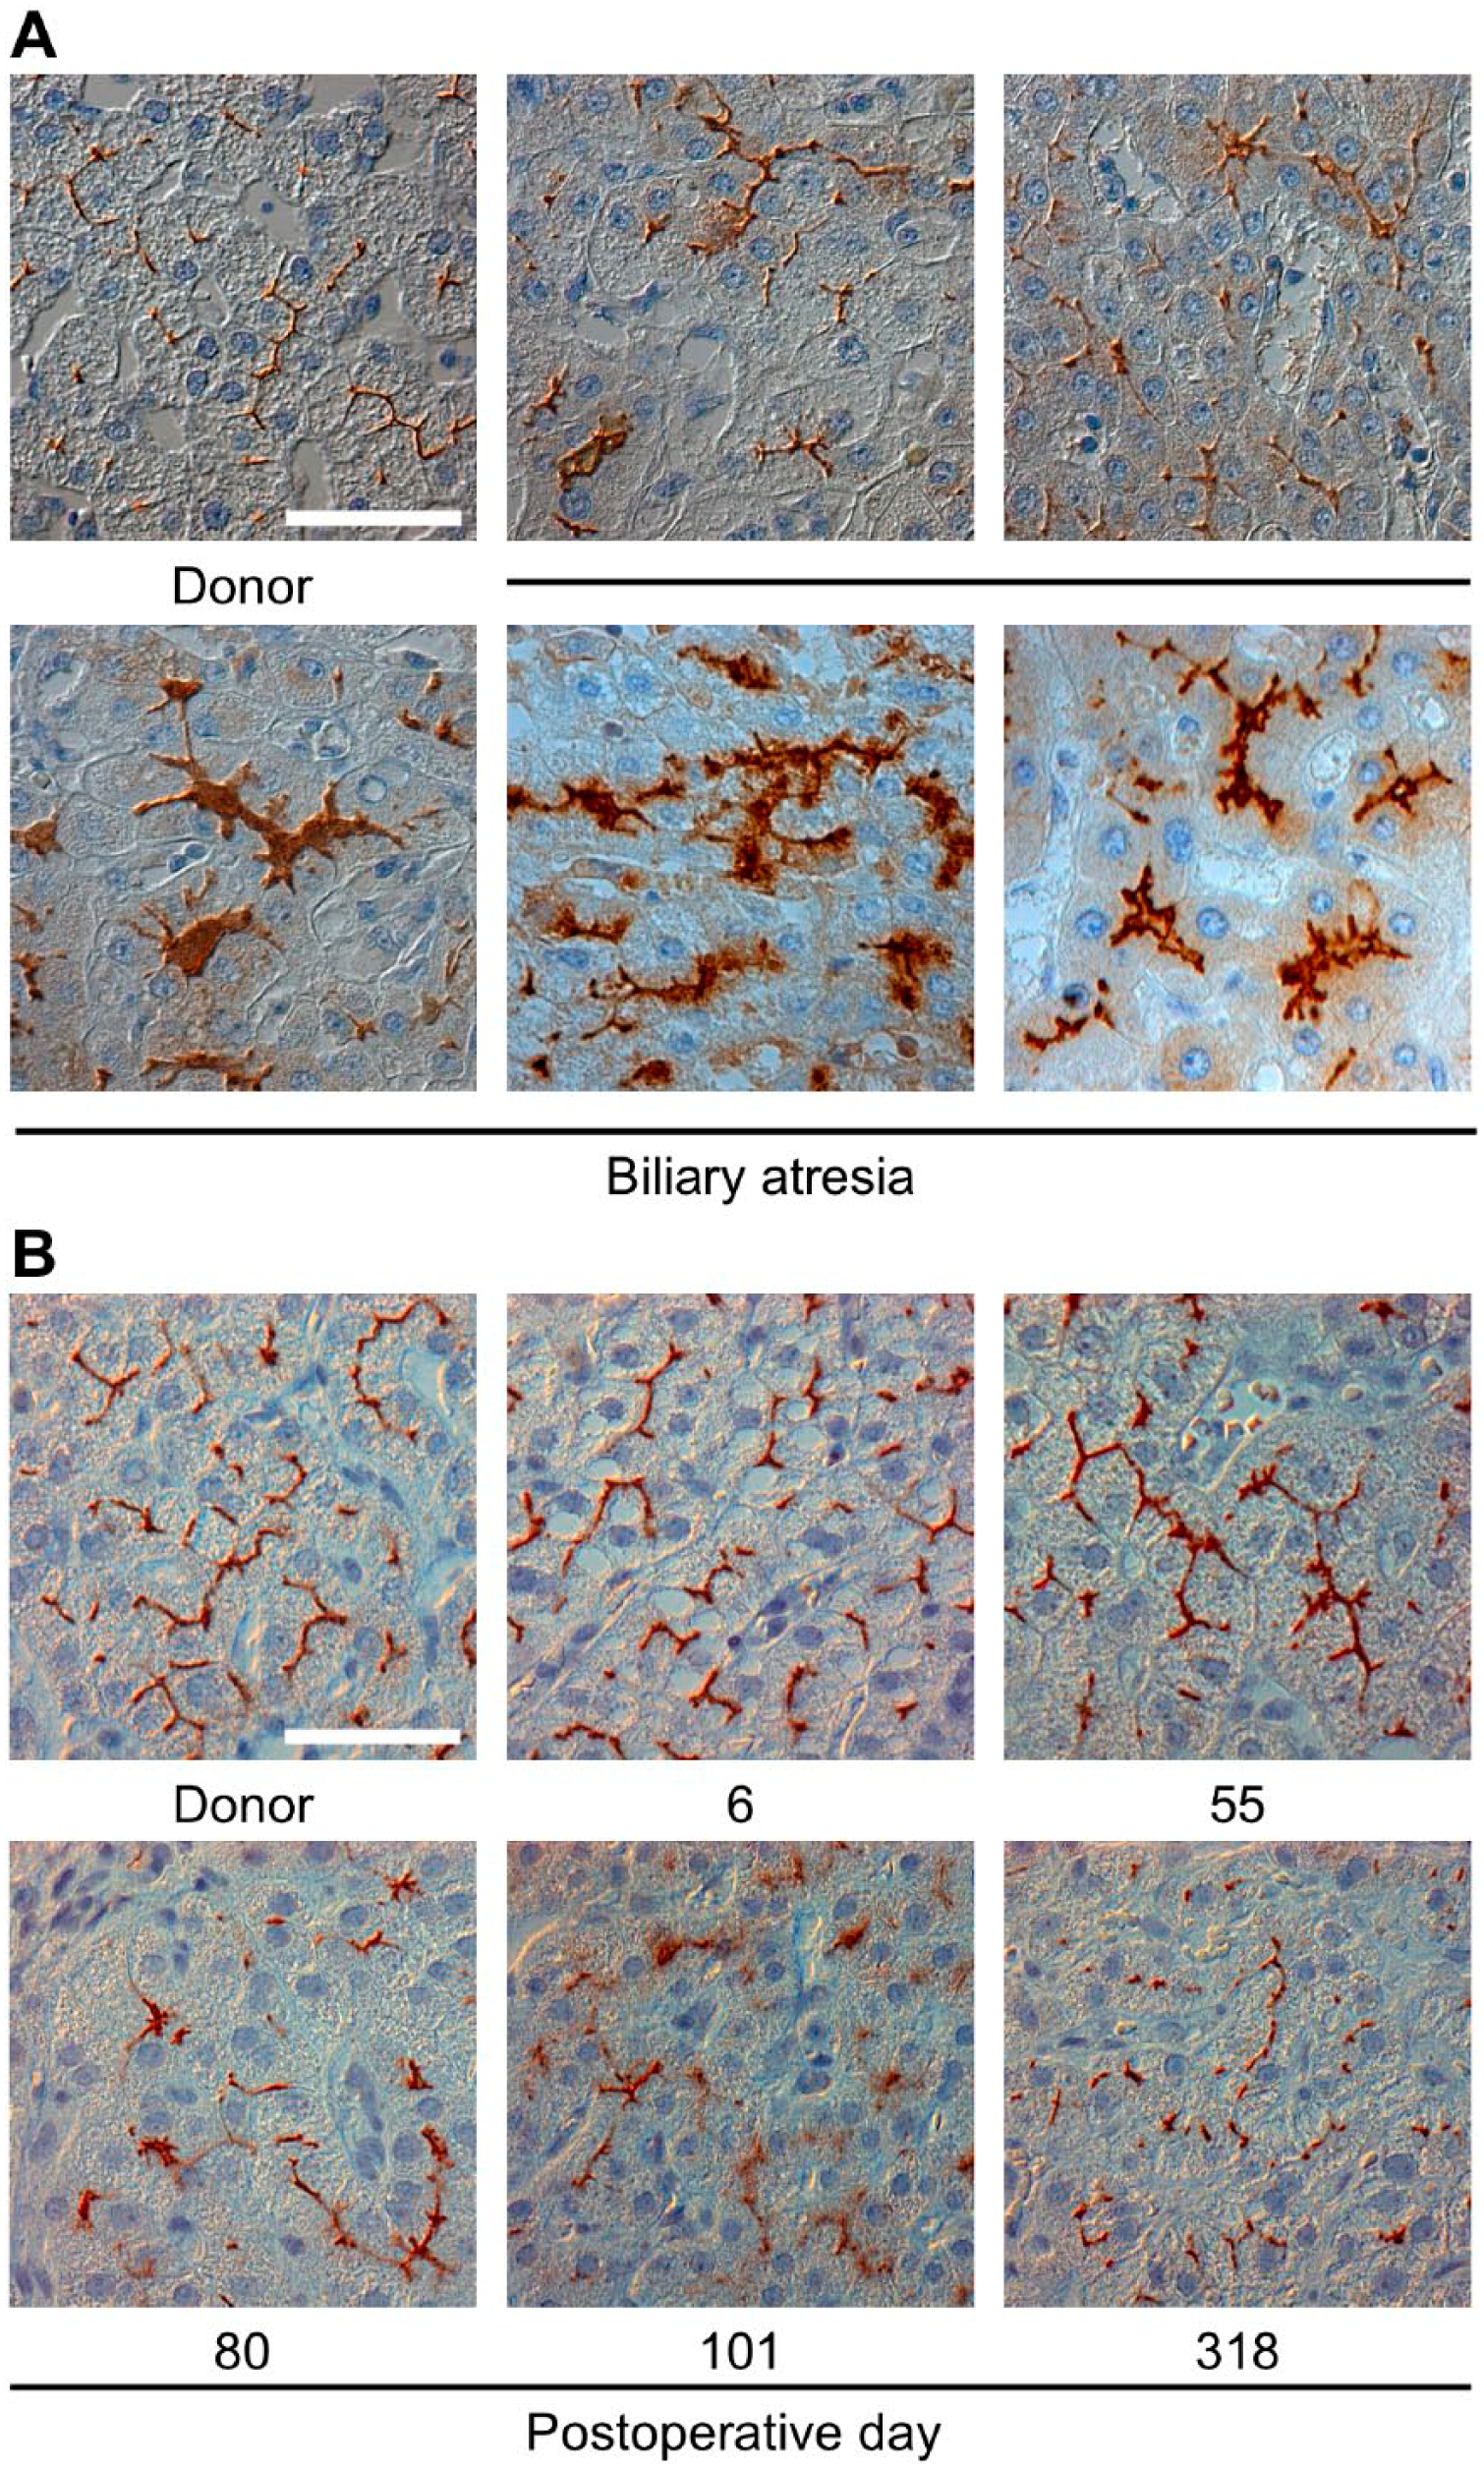
Abnormal bile canaliculi under cholestasis conditions. (A) Formalin-fixed paraffin-embedded liver sections from a healthy donor and five biliary atresia patients were stained using an anti-CEACAM1 antibody. Scale bar: 50 µm. (B) A case of liver graft rejection. A series of formalin-fixed paraffin-embedded liver sections obtained after living-donor liver transplantation were stained using an anti-CEACAM1 antibody. In this case, the patient was diagnosed with chronic rejection on postoperative day 318. Scale bar: 50 µm. Abbreviation: CEACAM1, carcinoembryonic antigen-related cell adhesion molecule 1.
Effect of LCA on HepG2 Cell Growth
HepG2 cells were treated with primary bile acids (CA and CDCA), secondary bile acids (DCA and LCA), and a tertiary bile acid (UDCA), and their effect on cytotoxicity was evaluated using an MTT assay (Fig. 2A). DMSO, the solvent used for these bile acids, did not significantly affect HepG2 cells. All bile acids at 250 µM caused statistically significant cytotoxicity when compared with the solvent control. Among them, LCA showed the strongest toxicity. Therefore, we further investigated the effect of LCA concentration on cytotoxicity. The cytotoxic effect was statistically significant (p<0.05) at LCA concentrations above 140 µM (Fig. 2B). In LCA-treated HepG2 cells, round cells were observed at 75 µM, despite the lack of a significant difference in MTT assay data (Fig. 2C). Furthermore, DNA synthesis was estimated by the EdU incorporation assay. LCA-stimulated HepG2 cells showed fewer EdU-positive nuclei than negative control cells (Fig 2D). The ratio of EdU-positive nuclei to Hoechst 33342-positive nuclei was significantly lower in LCA-stimulated HepG2 cells. These results suggest that LCA-stimulated HepG2 cells were unable to enter S phase of the cell cycle and caused cell growth arrest. On the basis of these results, we cultured the cells with 150 µM LCA in subsequent experiments.
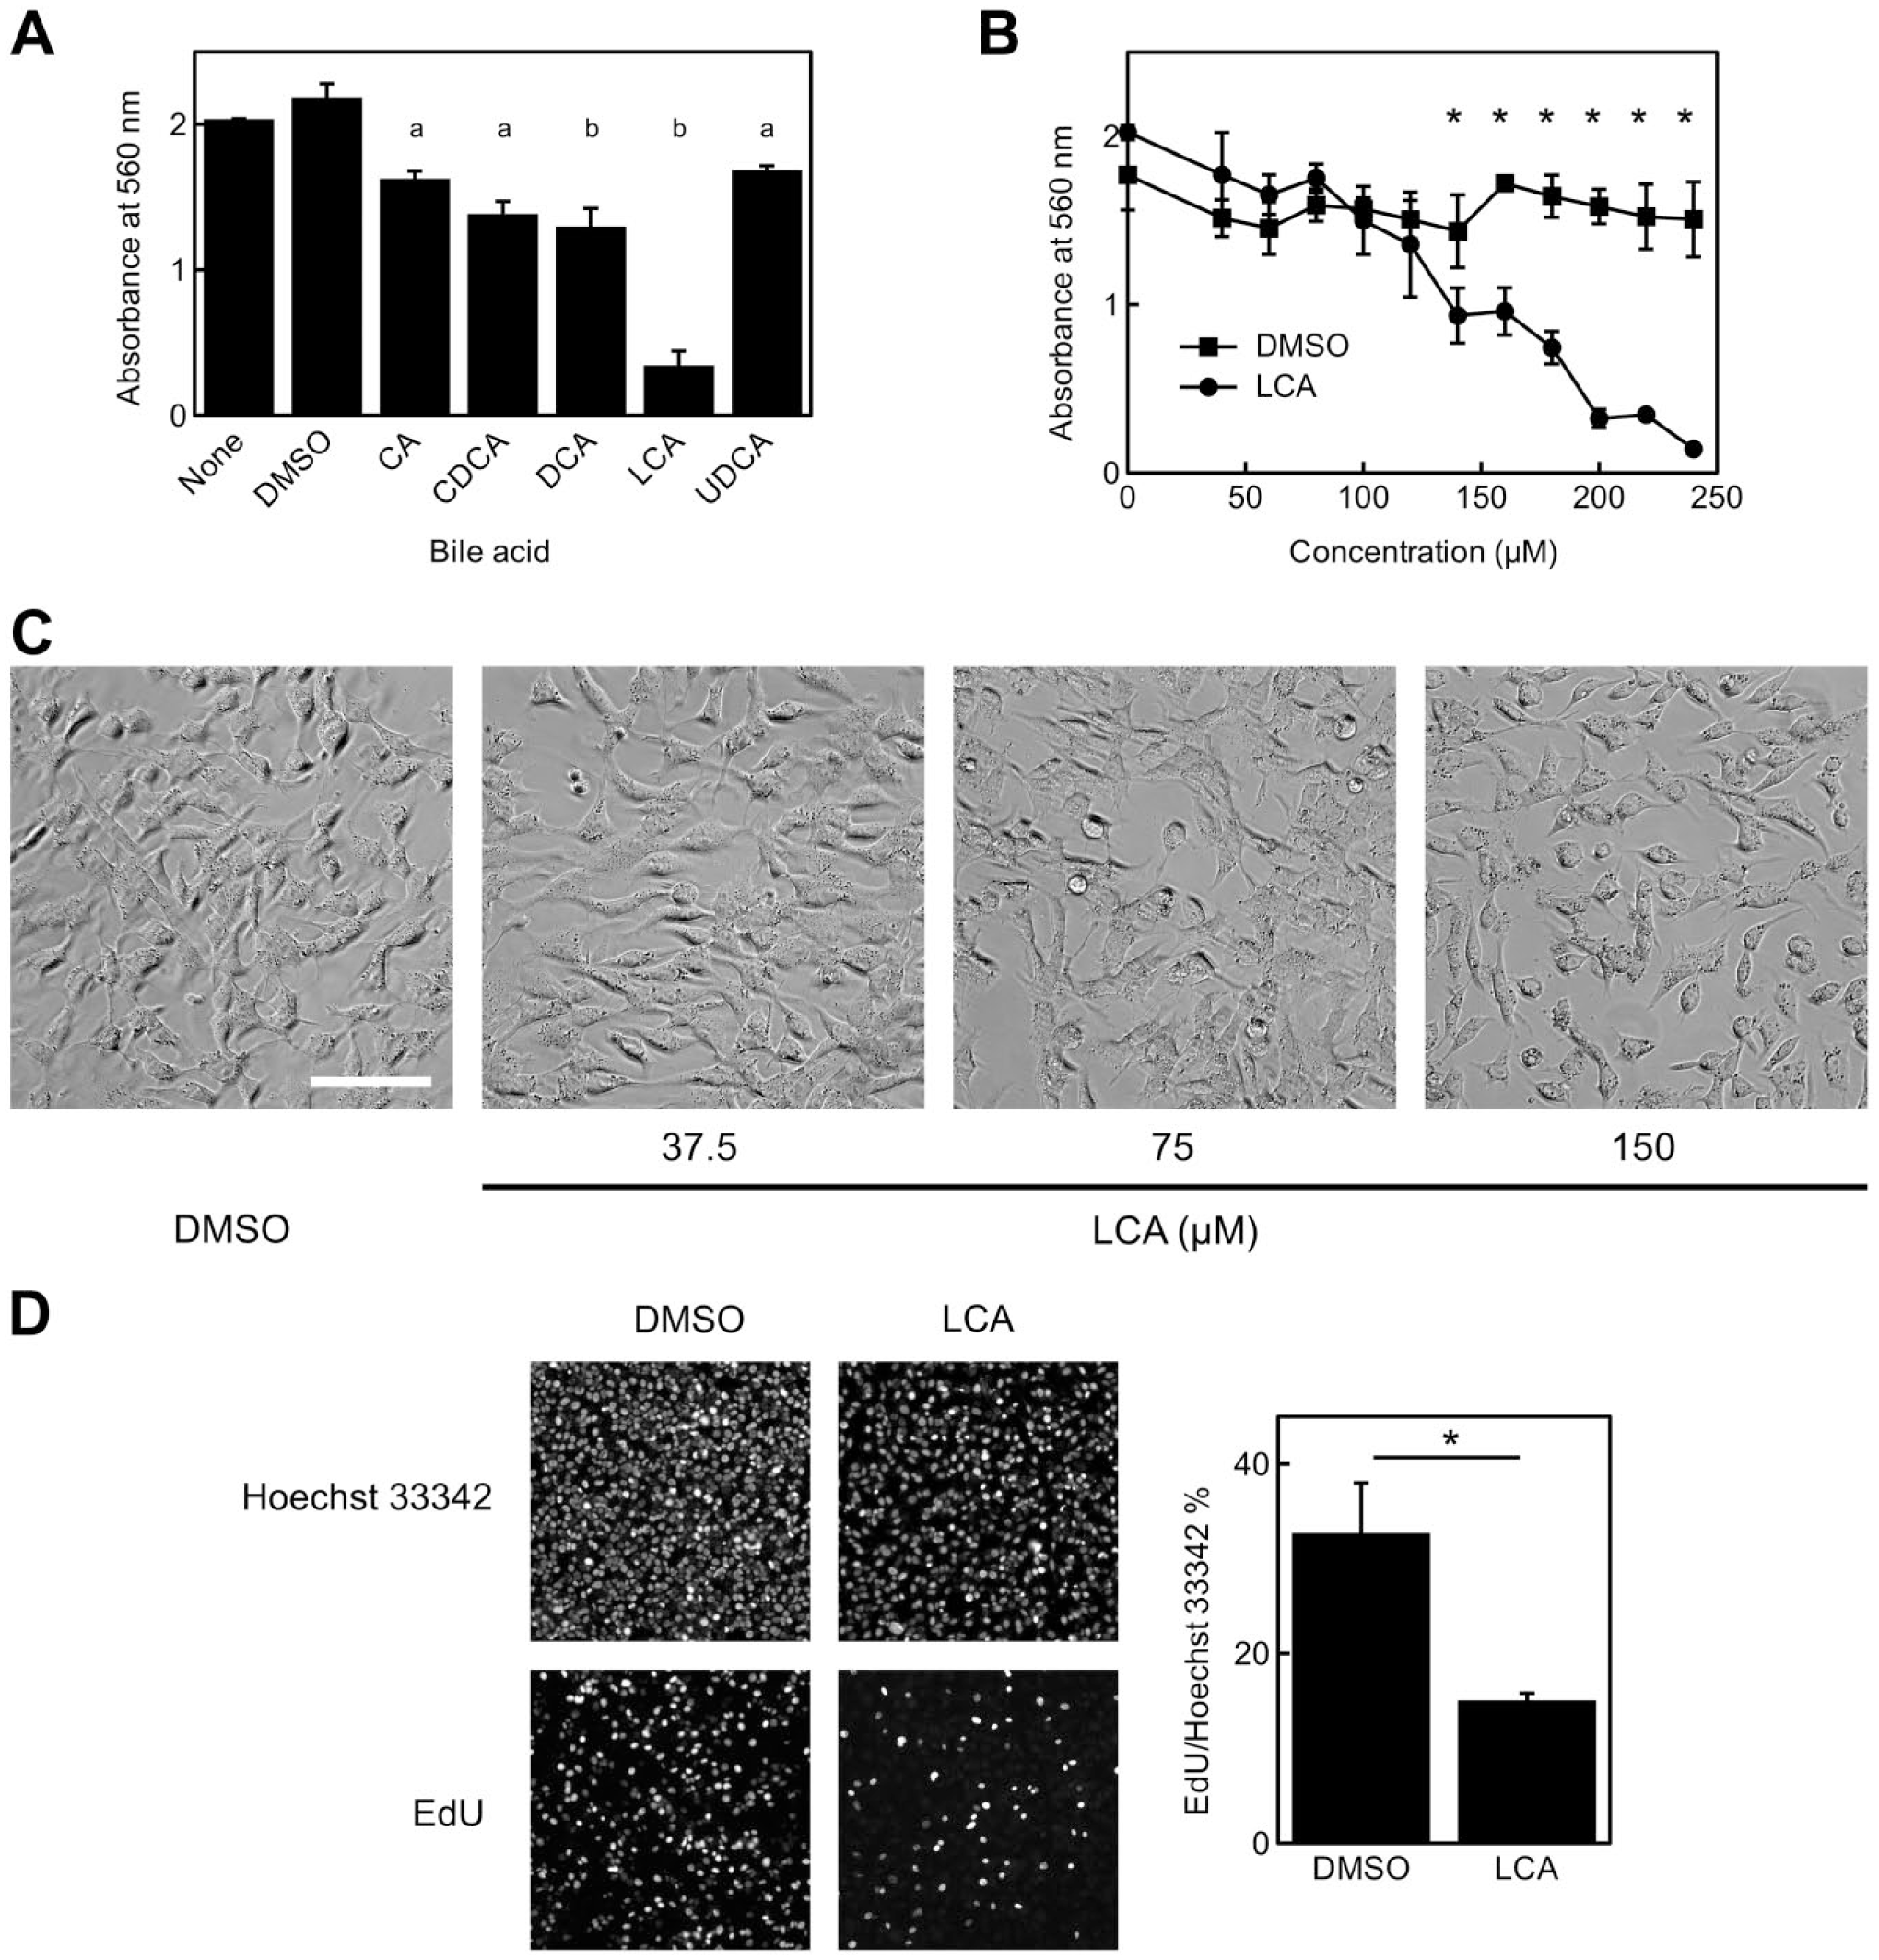
Cytotoxic effect of LCA on HepG2 cells. (A) HepG2 cells were exposed to the indicated bile acids at 250 μM for 24 hr, and cell viability was evaluated by the MTT assay. DMSO was used as a negative control. Data represent the mean ± SD of assays performed in triplicate. abStatistically significant difference between negative control and bile acid-treated cells (a: p<0.01, b: p<0.001). (B) Concentration dependency of the effect of LCA. DMSO was used as a negative control. Data represent the mean ± SD of assays performed in triplicate. *Statistically significant difference between DMSO- and LCA-treated cells (p<0.05). (C) Bright-field images of HepG2 cells treated with 0.15% DMSO or 37.5, 75, and 150 μM LCA for 24 hr. Scale bar: 50 µm. (D) DNA synthesis was evaluated by EdU incorporation. Cells were stimulated with LCA for 24 hr, and then labeled with EdU for 5 hr. Data represent the mean ± SD of assays performed in triplicate. *Statistically significant difference between negative control and bile acid-treated cells (p<0.01). Abbreviation: LCA, lithocholic acid; MTT, 3-(4,5-dimethyl-2-thiazolyl)-2,5-diphenyl-2H-tetrazolium bromide; DMSO, dimethyl sulfoxide; EdU, 5-ethynyl-2′-deoxyuridine.
Effect of LCA on Cell Morphology in HepG2 Cells
We investigated bile canaliculus morphology in LCA-treated HepG2 cells to confirm our previous findings of disruption of bile canaliculi at an early stage of cholestasis in DDC-fed mice. 4 TEM analysis revealed that LCA stimulation caused membrane damage with no surface microvilli on hepatocyte apical sites. Eventually, the bile canaliculi were filled with debris, as shown in Fig. 3A. These observations suggested that the damaged membrane had detached from the hepatocyte and filled the space of the bile canaliculi, and then the apical surface was reconstructed with newly synthesized microvilli. Moreover, F-actin distribution at the adhesion site changed in LCA-exposed cells (Fig. 3B). In control cells, a typical leading edge was observed. Interestingly, round cells were surrounded by F-actin fibers in LCA-treated HepG2 cells.
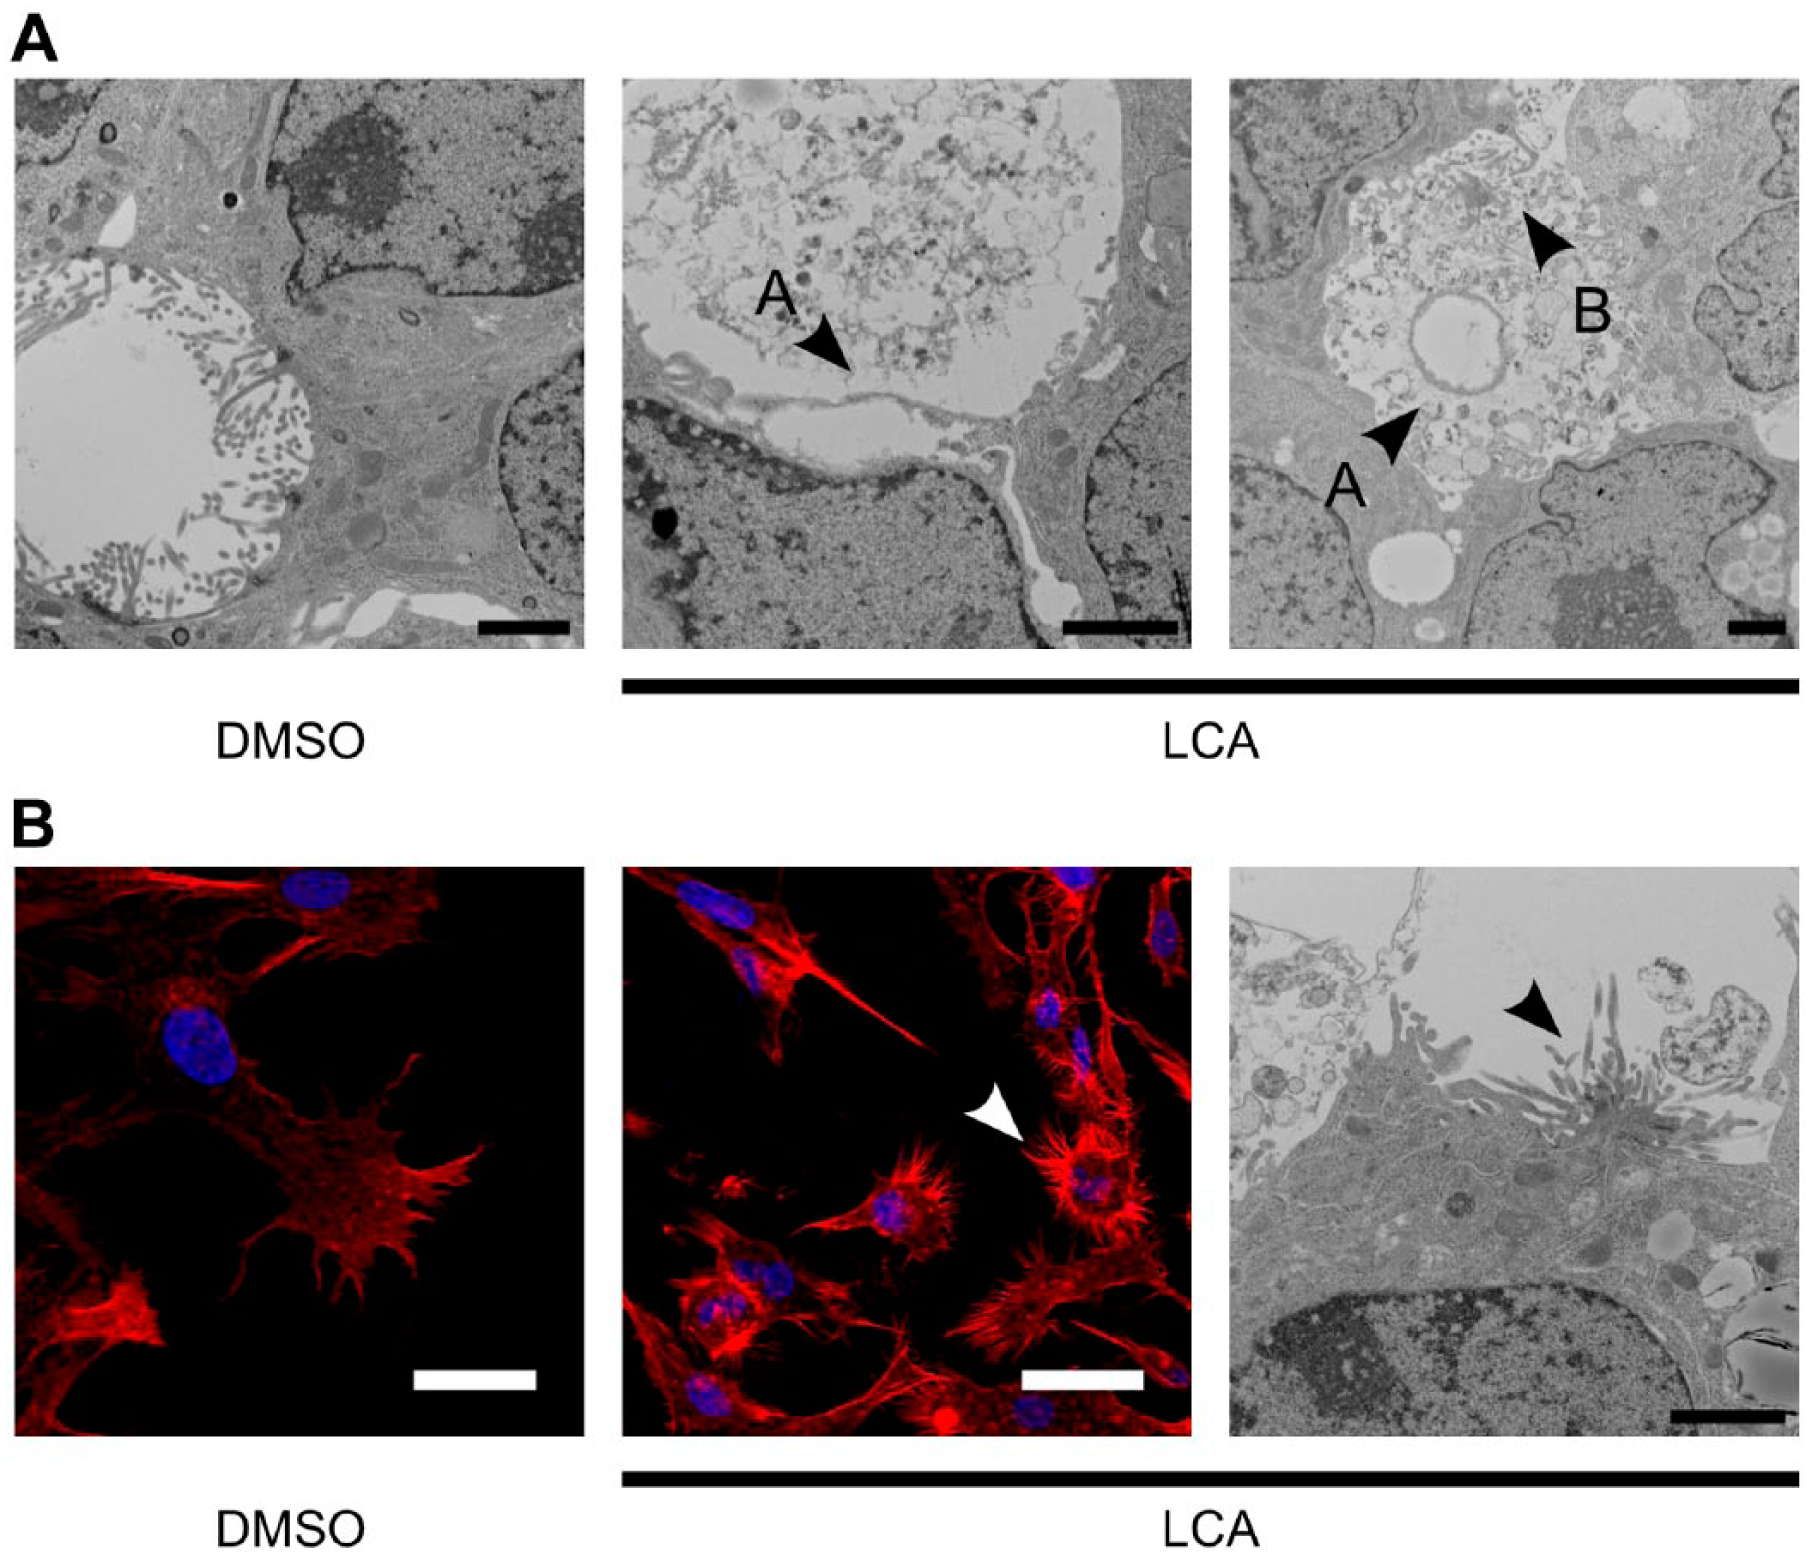
Morphological changes induced by LCA in HepG2 cells. (A) Ultrastructure of bile canaliculi in HepG2 cells treated with 0.15% DMSO or 150 µM LCA for 24 hr. Arrowhead A shows the damaged membrane, and B shows newly synthesized microvilli. Scale bar: 2 µm. (B) Fibrous structures (arrowheads) observed under fluorescence microscopy with phalloidin staining and electron microscopy in HepG2 cells treated with 0.15% DMSO or 150 µM LCA for 24 hr. Scale bar: 25 µm for fluorescence microscopy and 2 µm for electron microscopy. Abbreviation: LCA, lithocholic acid; DMSO, dimethyl sulfoxide.
Suppression of Villin Expression by LCA
Based on findings by Phillips et al. describing a group of patients with cholestatic diseases and abnormal bile canaliculi and villin suppression, 8 we examined villin expression in LCA-stimulated HepG2 cells. Accordingly, villin expression decreased in LCA-exposed HepG2 cells (Fig. 4A) and, in the case of its mRNA, dropped to approximately 29% of the control level (Fig. 4B). The effect of LCA on mRNA expression of nuclear receptors was also evaluated. Specifically, mRNA expression of the VDR increased significantly (p<0.01), whereas expression of LXRα and PXR decreased (p<0.01, p<0.05, respectively) following LCA addition. No significant change was observed in FXR mRNA expression.
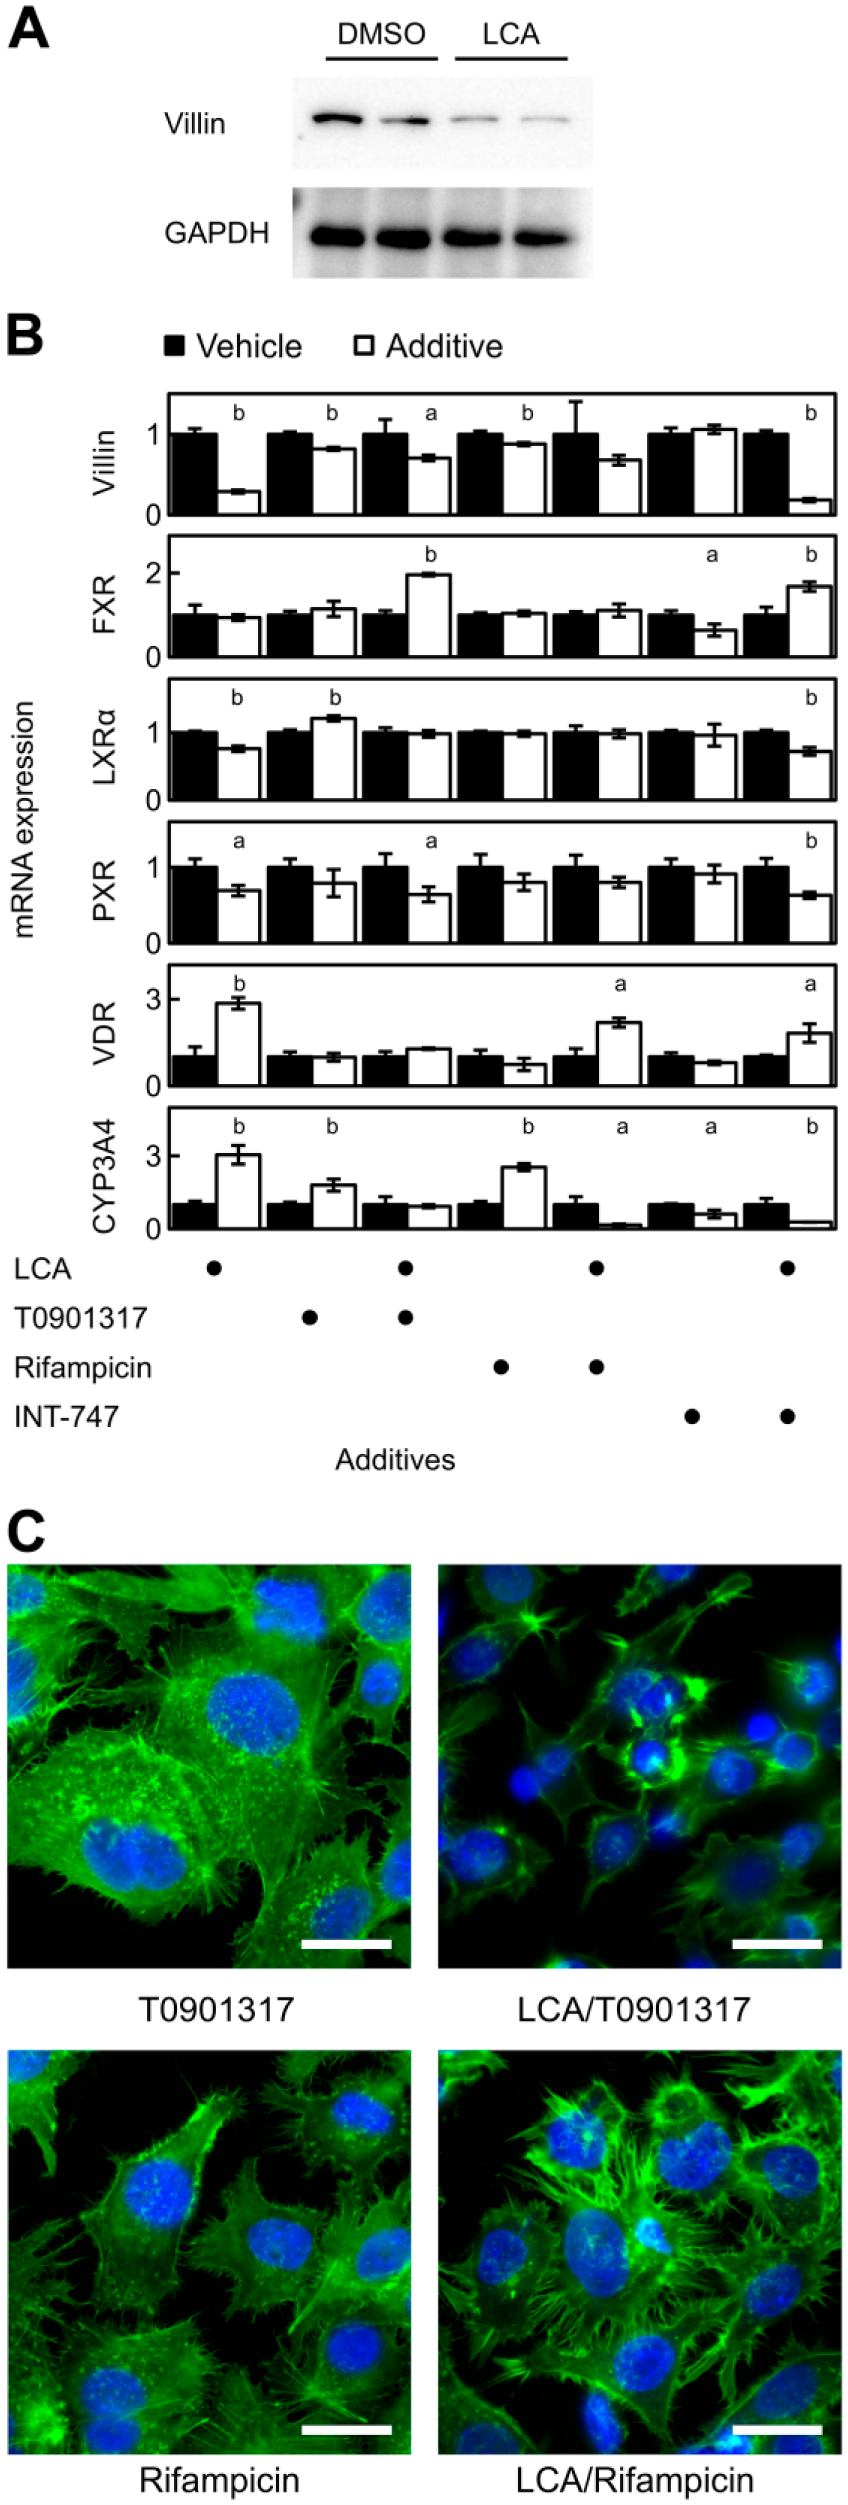
Effect of LCA on villin expression in HepG2 cells. (A) Villin protein expression in HepG2 cells treated with 0.15% DMSO or 150 µM LCA for 24 hr was evaluated in duplicate by western blotting. GAPDH was used as internal control. (B) mRNA levels of villin, FXR, LXRα, PXR, VDR, and CYP3A4 were evaluated by real-time PCR in LCA (150 µM)-treated HepG2 cells in the presence or absence of 10 µM T0901317, 25 µM rifampicin, and 1 µM INT-747 for 24 hr. Ethanol and DMSO were used as negative controls (vehicle). Real-time PCR data were normalized against GAPDH mRNA expression, and the mean ± SD of triplicate assays was plotted. abStatistically significant difference between vehicle-treated control and bile acid/nuclear receptor agonist-treated cells (a: p<0.05, b: p<0.01). (C) The actin cytoskeleton was visualized with phalloidin staining in HepG2 cells treated with 10 µM T0901317 or 25 µM rifampicin in the presence or absence of 150 µM LCA for 24 hr. Scale bar: 25 µm. Abbreviations: LCA, lithocholic acid; DMSO, dimethyl sulfoxide; GAPDH, glyceraldehyde-3-phosphate dehydrogenase; FXR, farnesoid X receptor; LXRα, liver X receptor α; PXR, pregnane X receptor; VDR, vitamin D receptor; CYP3A4, cytochrome P450, family 3, subfamily A, polypeptide 4; PCR, polymerase chain reaction.
To examine whether villin was downstream of these nuclear receptors, we treated HepG2 cells with T0901317, a synthetic LXR agonist also known to stimulate FXR, PXR, and VDR,22–24 rifampicin, a PXR-mediated inducer of CYP3A4, 25 and INT-747, a potent selective FXR agonist. 26 Induction of CYP3A4 mRNA expression was considered positive evidence of the agonist activity of rifampicin. In the absence of LCA, T0901317 and rifampicin suppressed villin mRNA expression to 82% and 88%, respectively (p<0.01). Notably, LCA-treated HepG2 cells showed significant recovery of villin expression in the presence of T0901317 or rifampicin and reached about 70% of the control level (T0901317, rifampicin: p<0.01); whereas INT-747 showed no recovery effect. In contrast, induction of CYP3A4 by nuclear receptor agonists was suppressed in the presence of LCA. Although villin expression was restored by T0901317, the morphology of LCA/T0901317-HepG2 cells was similar to that of LCA-HepG2 cells (Fig. 4C). Instead, LCA/rifampicin-HepG2 cells showed typical adhesion cell morphology with fibrous structures at adhesion sites.
To confirm that villin expression was regulated via nuclear receptors, FXR, LXRα, and PXR were knocked down in HepG2 cells using siRNA. Following knockdown of LXRα, no significant changes were observed in villin mRNA expression; whereas siRNA-mediated FXR and PXR knockdown increased villin mRNA expression (Fig. 5A). No significant morphological changes were observed. Suppression of villin expression by LCA was prevented by knockdown of FXR, LXRα, and PXR (Fig. 5B).
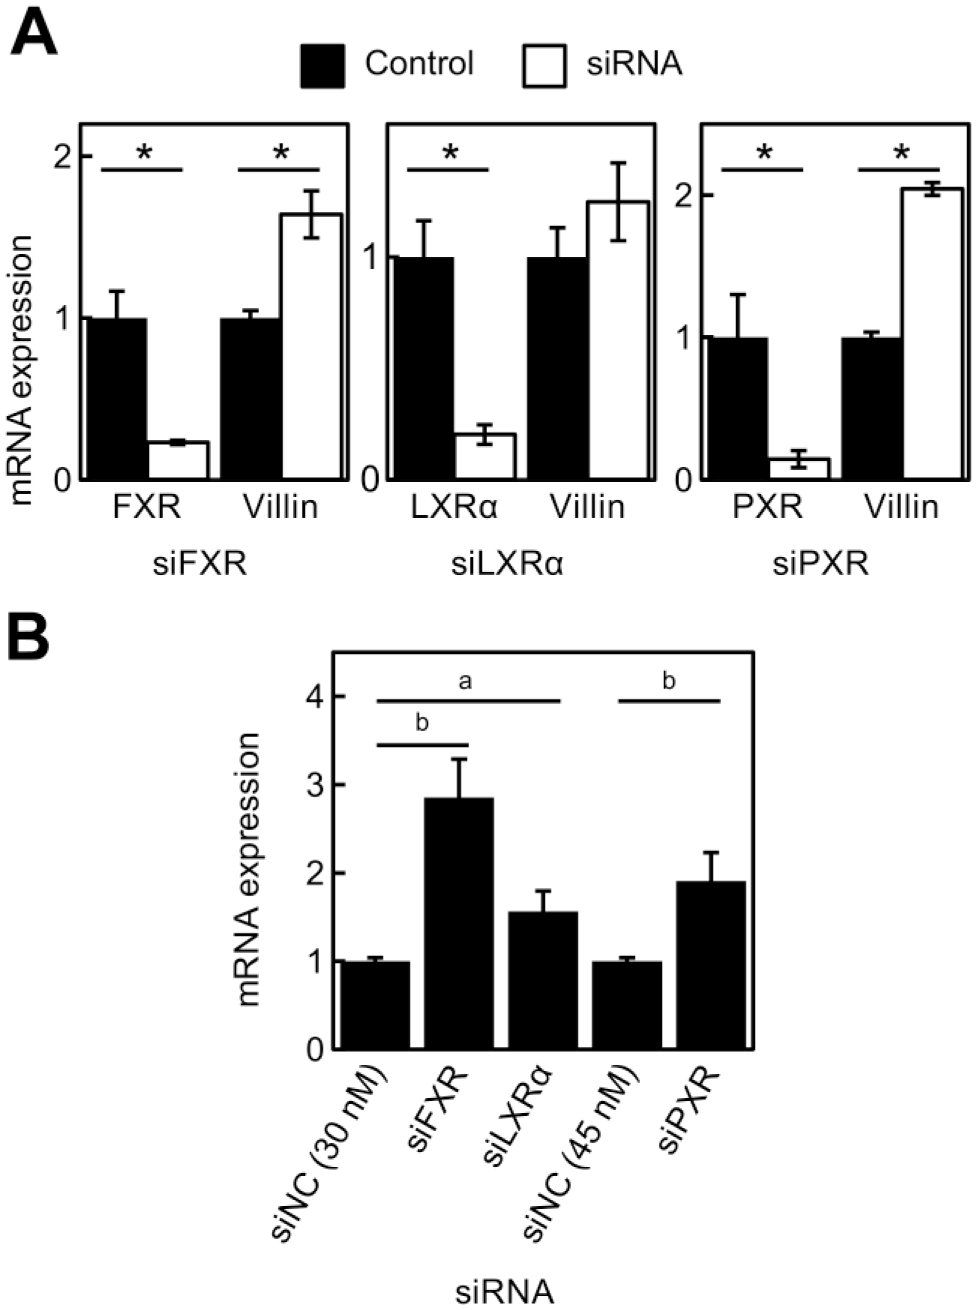
Effect of siRNA-mediated FXR, LXRα, and PXR knockdown on villin expression in HepG2 cells. (A) FXR, LXRα, and PXR mRNA expression was knocked down by siRNA in normal HepG2 cells. Villin mRNA expression was evaluated by real-time PCR. Data were normalized against GAPDH mRNA expression, and the mean ± SD of triplicate assays was plotted. *Statistically significant difference (p<0.01). (B) FXR, LXRα, and PXR mRNA expression was knocked down by siRNA in LCA-HepG2 cells. Villin mRNA expression was evaluated by real-time PCR. Data were normalized against GAPDH mRNA expression, and the mean ± SD of triplicate assays was plotted. abStatistically significant difference (a: p<0.05, b: p<0.01). Abbreviations: siRNA, small interfering RNA; FXR, farnesoid X receptor; LXRα, liver X receptor α; PXR, pregnane X receptor; PCR, polymerase chain reaction; GAPDH, glyceraldehyde-3-phosphate dehydrogenase; LCA, lithocholic acid; NC: negative control.
Effect of Villin Knockdown on Cell Growth and Gene Expression
To study the effect of villin suppression by LCA on the growth of HepG2 cells, villin was knocked down using siRNA (Fig. 6A). On day 3, villin protein level was lower than that of the negative control. When cells were cultured up to day 5, the cytotoxic effect of villin knockdown was confirmed by the MTT assay (Fig. 6B). Moreover, DNA synthesis was significantly decreased by villin knockdown, as it did following LCA stimulation (Fig. 6C). The morphology of HepG2 cells showed dramatic changes following siRNA knockdown of villin (Fig. 6D). Untreated HepG2 cells were in close contact with each other and formed colonies resembling well-organized liver tissue. By contrast, cells lacking villin were unable to form colonies because of irregular cell cycle control, persisted as individual entities, and extended disproportionately across the dish.
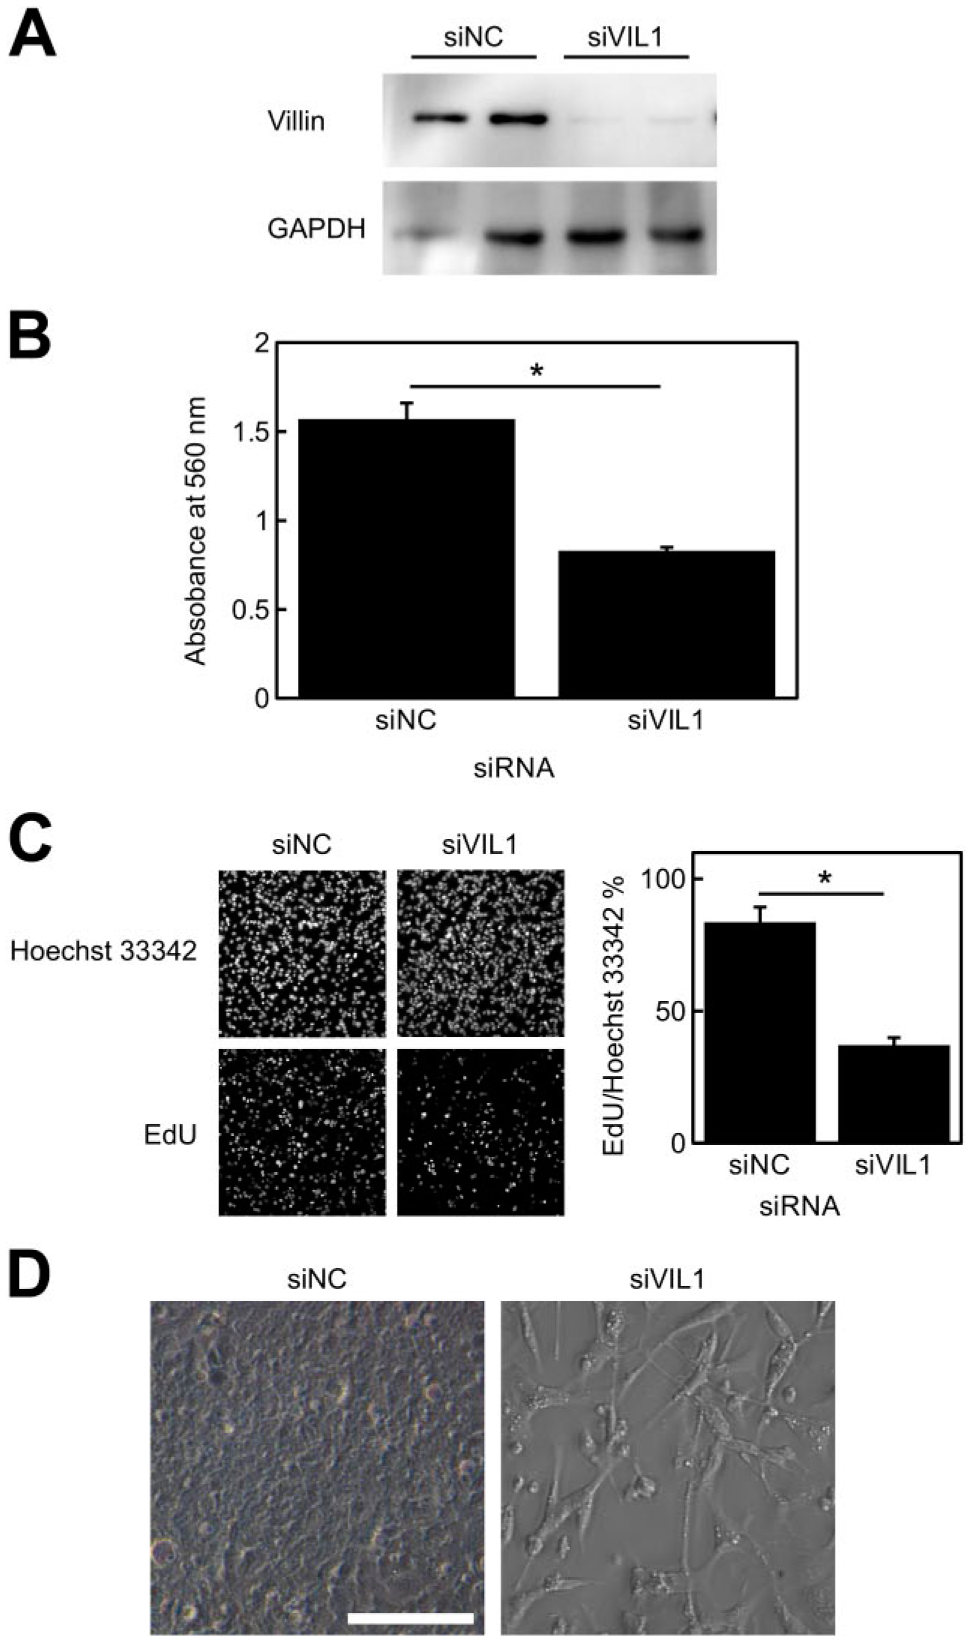
Effect of siRNA-mediated villin knockdown on the morphology of HepG2 cells. (A) Villin expression was knocked down by siRNA in normal HepG2 cells, and protein expression in HepG2 cells was evaluated in duplicate by western blotting on day 3. GAPDH was used as internal control. (B) MTT assay on day 5. Data represent the mean ± SD of assays performed in triplicate. *Statistically significant difference (p<0.01). (C) DNA synthesis was evaluated by EdU staining. EdU was added to cells on day 4 and cells were labeled for 24 hr. Data represent the mean ± SD of assays performed in triplicate. *Statistically significant difference (p<0.01). (D) Bright-field images of HepG2 cells treated with siRNA on day 5. Scale bar: 100 µm. Abbreviation: siRNA, small interfering RNA; GAPDH, glyceraldehyde-3-phosphate dehydrogenase; MTT, 3-(4,5-dimethyl-2-thiazolyl)-2,5-diphenyl-2H-tetrazolium bromide; EdU, 5-ethynyl-2′-deoxyuridine.
To analyze how villin knockdown caused cell growth arrest, DNA microarray analysis was conducted. The top five upregulated and downregulated genes are listed in Table 2. Table 3 presents the result of gene ontology analysis. Changes in EEF1B2, SP140, FBXO31, and ITGAL mRNA expression in LCA-treated HepG2 cells were estimated by real-time PCR (Fig. 7). EEF1B2 was upregulated and FBXO31 and ITGAL were downregulated, whereas no significant change was observed for SP140.
Gene Expression Profile in Villin-Knockdown HepG2 Cells.
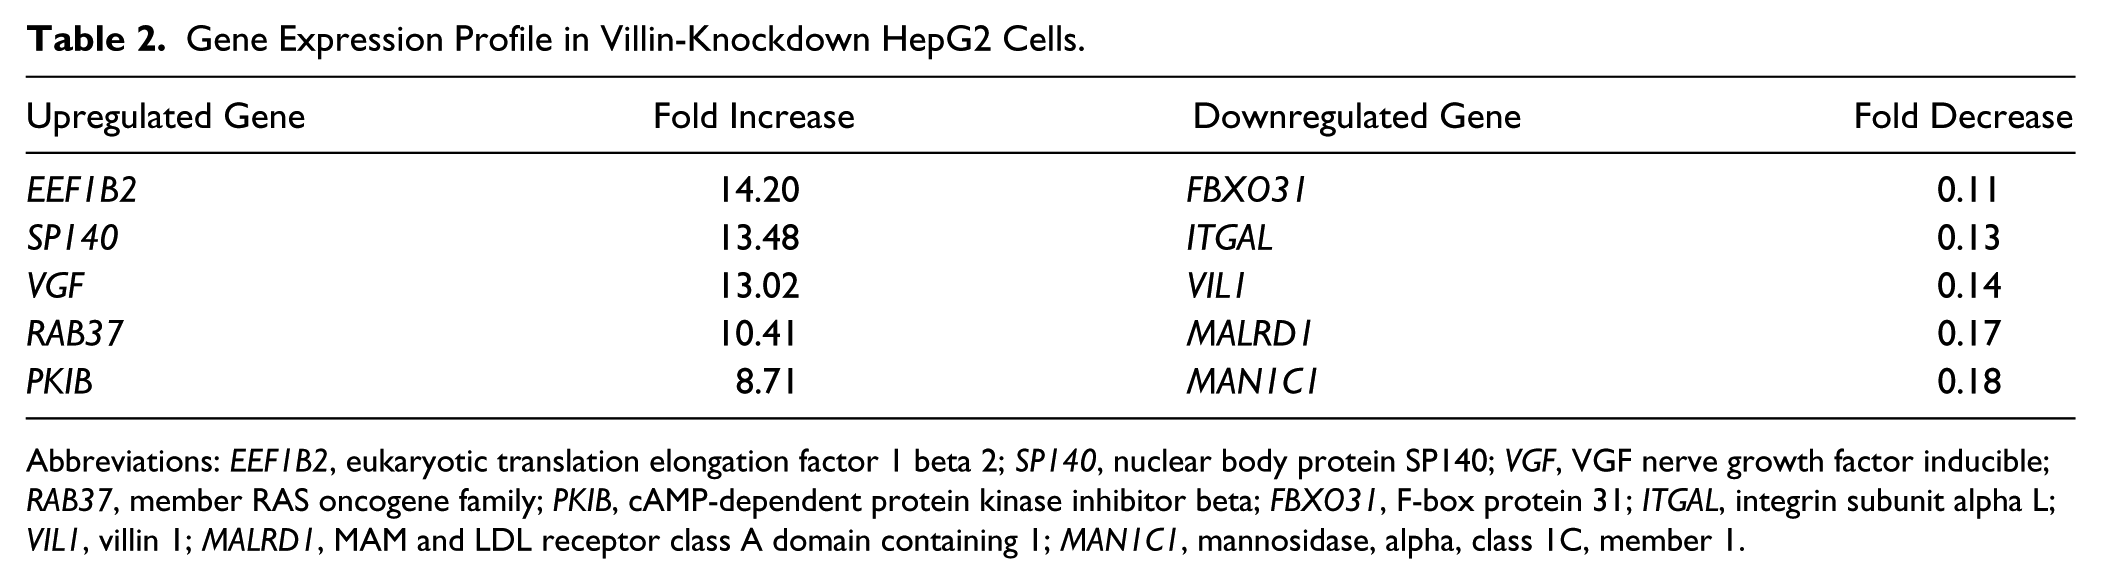
Abbreviations: EEF1B2, eukaryotic translation elongation factor 1 beta 2; SP140, nuclear body protein SP140; VGF, VGF nerve growth factor inducible; RAB37, member RAS oncogene family; PKIB, cAMP-dependent protein kinase inhibitor beta; FBXO31, F-box protein 31; ITGAL, integrin subunit alpha L; VIL1, villin 1; MALRD1, MAM and LDL receptor class A domain containing 1; MAN1C1, mannosidase, alpha, class 1C, member 1.
Gene Ontology Analysis in Villin-Knockdown HepG2 Cells.
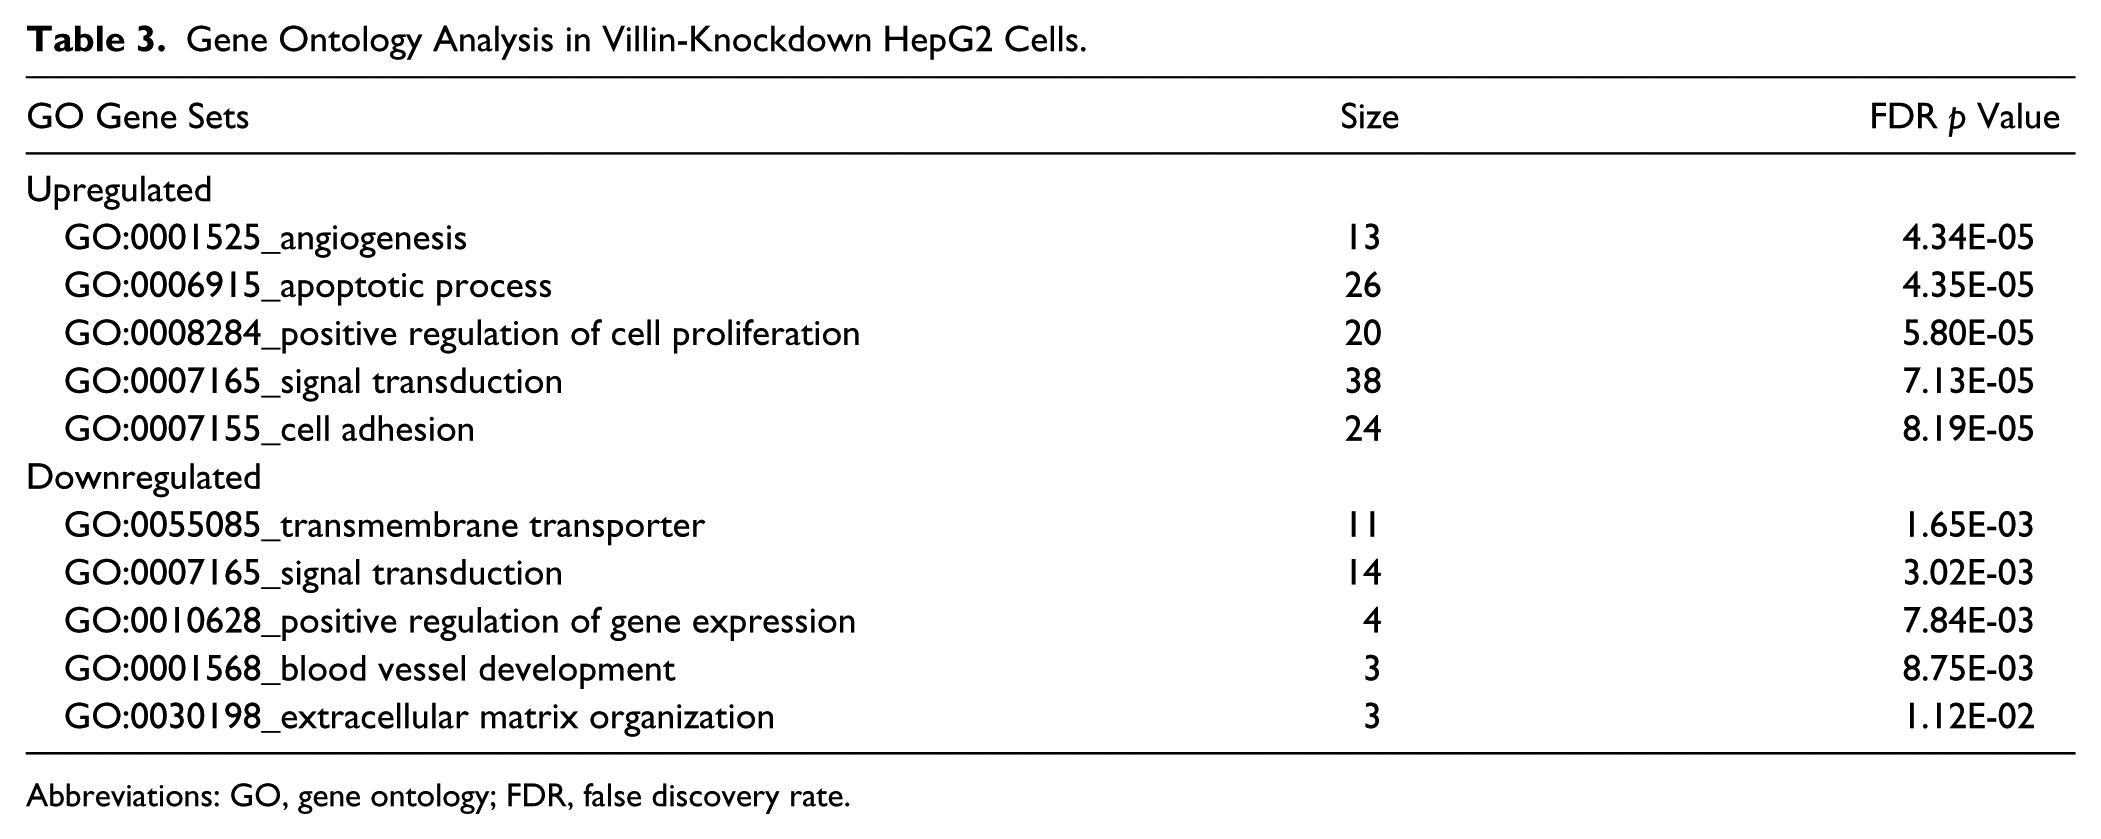
Abbreviations: GO, gene ontology; FDR, false discovery rate.
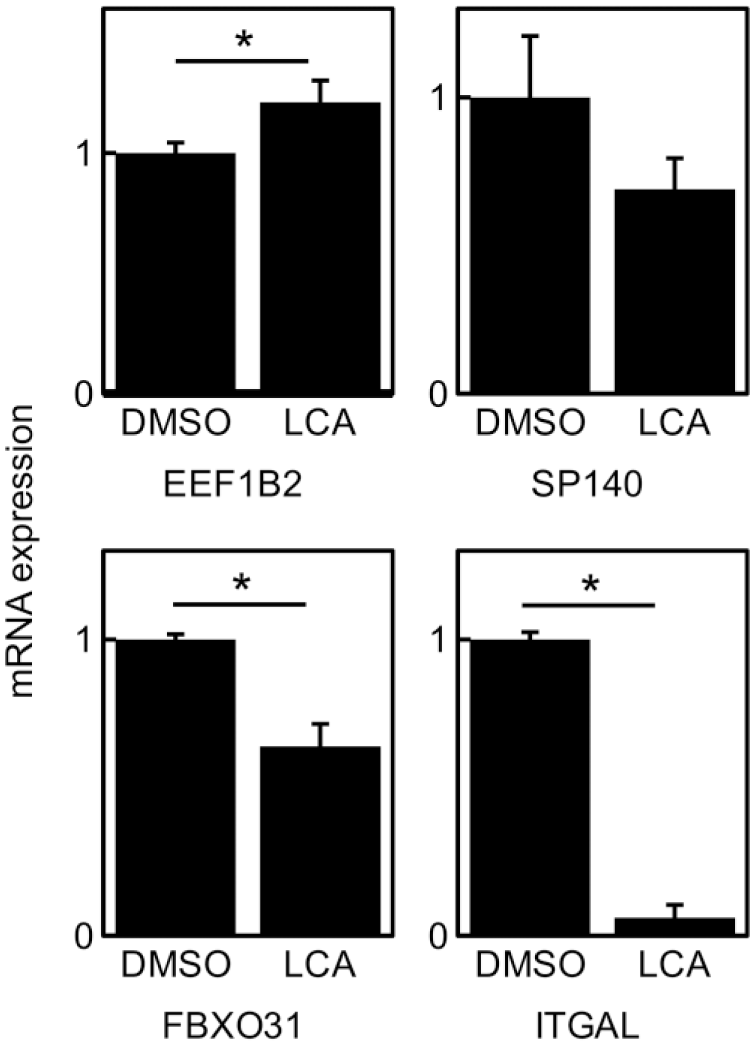
Effect of LCA on gene expression in HepG2 cells. mRNA levels of EEF1B2, SP140, FBXO31, and ITGAL were evaluated by real-time PCR in LCA (150 µM)-treated HepG2 cells for 24 hr. DMSO was used as negative control. Real-time PCR data were normalized against GAPDH mRNA expression, and the mean ± SD of triplicate assays was plotted. *Statistically significant difference between negative control and bile acid-treated cells (p<0.01). Abbreviations: LCA, lithocholic acid; PCR, polymerase chain reaction; EEF1B2, eukaryotic translation elongation factor 1 beta 2; SP140, nuclear body protein SP140; FBXO31, F-box protein 31; ITGAL, integrin subunit alpha L; PCR, polymerase chain reaction; DMSO, dimethyl sulfoxide; GAPDH, glyceraldehyde-3-phosphate dehydrogenase.
Discussion
In our previous work, we studied bile canalicular morphology in cholestatic diseases and observed abnormal bile canalicular morphology in a mouse model of sclerosing cholangitis and human liver allografts at risk of chronic rejection.4,6 Based on these findings, we hypothesized that bile canaliculus disruption was an outstanding sequelae of cholestatic diseases. In the current study, we showed similar bile canaliculus disruption in biliary atresia and a series of liver sections from a case of liver graft rejection after living-donor liver transplantation. Segawa et al. investigated the relationship between bile canalicular membrane-associated filaments (BCMFs) and clinical outcomes, using phalloidin to stain F-actin in patients with biliary atresia. 27 They showed that patients with markedly increased numbers of BCMFs did not exhibit bile flow after surgery. Liu et al. found that poor outcomes in biliary atresia were associated with high aminopeptidase N expression in the bile canaliculi. 28 In the current study, CEACAM1 staining showed effective visualization of abnormal bile canaliculi morphology in biliary atresia patients. In the case of chronic rejection, CEACAM1 expression was apparently decreased along with bile canalicular disruption following liver transplantation. Although more cases should be investigated, present data suggest that CEACAM1 can be a novel molecular marker for liver cholestatic diseases and monitoring after liver transplantation.
LCA is known to be an endogenous PXR ligand and influences also other nuclear factors, including FXR and TGR5, two nuclear receptors putatively involved in LCA-mediated gene regulation. Therefore, we hypothesized that villin suppression in LCA-stimulated HepG2 cells was regulated via nuclear receptors. Villin suppression under LCA stimulation was recovered by T0901317 and rifampicin. These findings suggest that villin expression under LCA stimulation was regulated via nuclear factors. Nuclear receptor knockdown experiments suggested that FXR and PXR negatively regulated villin in HepG2 cells. Interestingly, FXR-knockdown restored villin expression in LCA-stimulated HepG2 cells, whereas INT-747 had no effect irrespective of LCA addition. FXR positively regulates CYP3A4 expression, as indicated by the fact that FXR-knockdown caused a reduction in CYP3A4 mRNA expression in HepG2 cells (Supplemental Fig. 4). Zhang et al. reported that the FXR agonist GW4064 repressed CYP3A4 expression through SHP upregulation and subsequent repression of PXR/CAR transactivation. 29 In this study, INT-474 reduced CYP3A4 mRNA expression. These observations may be explained by the involvement of other molecular pathways as mediators of villin mRNA expression in LCA-treated HepG2 cells.
In the present study, we observed cell growth arrest by siRNA-mediated villin knockdown in HepG2 cells. The molecular mechanism inducing cell growth arrest is unclear; however, it is known that actin-binding proteins and cell cycle regulators are involved via the Rho family and its related proteins, 30 and Van IJzendoorn et al. previously reported a relationship between hepatocyte polarization and cell cycle regulation. 31 Although we have not conducted a detailed cell cycle analysis in LCA-stimulated HepG2 cells, cell morphology, including a round cell shape and fibrous structure, at the adhesion site resembled M-phase F-actin localization in mitotic HeLa cells, as previously reported by Heng et al. 30 Furthermore, microarray analysis showed that villin knockdown regulated several genes involved in translation, cell growth, metabolism, and so on, with some of these being also affected by LCA stimulation in HepG2 cells. Byun et al. reported that EEF1B2 was associated with ionizing radiation-induced cellular senescence in MCF7 human breast cancer cells. 32 FBOX31 is known to be a cell cycle-regulated gene and is considered a tumor suppressor. 33 Although it was not significantly induced by LCA in HepG2 cells, SP140 has been reported to be an autoantigen in primary biliary cholangitis. 34 Gene ontology analysis revealed that villin-knockdown led to alterations in the expression of genes involved the positive regulation of cell proliferation. Based on these findings, we speculate that suppression of villin expression triggered abnormal actin cytoskeleton dynamics and resulted in irregular cell cycle regulation.
In summary, we report here that LCA stimulation causes suppression of villin and cell cycle arrest in HepG2 cells. Evidence points to a novel function of villin in cell cycle regulation and to the involvement of nuclear receptors in controlling its expression. In conclusion, the present findings indicate that in cholestatic diseases, LCA induces cell growth arrest by suppressing villin expression via its effect on hepatocyte nuclear receptors. This is the first evidence of a biological role for villin affecting hepatocyte growth.
Supplemental Material
DS_10.1369_0022155418804507 – Supplemental material for Prevention of Cell Growth by Suppression of Villin Expression in Lithocholic Acid-stimulated HepG2 Cells
Supplemental material, DS_10.1369_0022155418804507 for Prevention of Cell Growth by Suppression of Villin Expression in Lithocholic Acid-stimulated HepG2 Cells by Munetaka Ozeki, Wulamujiang Aini, Aya Miyagawa-Hayashino and Keiji Tamaki in Journal of Histochemistry & Cytochemistry
Footnotes
Acknowledgements
We thank Keiko Okamoto-Furuta and Haruyasu Kohda of the Division of Electron Microscopic Studies, Center for Anatomical Studies, Graduate School of Medicine, Kyoto University, for assisting with the electron microscopic analysis. Fluorescence analysis using laser-scanning confocal microscopy was performed at the Medical Research Support Center, Graduate School of Medicine, Kyoto University, which was supported by the Platform for Drug Discovery, Informatics, and Structural Life Science from the Ministry of Education, Culture, Sports, Science, and Technology, Japan. We thank Dr. Hiroshi Hiai of the Kyoto Disease Model Institute for the constructive discussions.
Competing Interests
The author(s) declared no potential conflicts of interest with respect to the research, authorship, and/or publication of this article.
Author Contributions
MO designed the study, performed all experiments except for immunohistochemistry, and drafted the manuscript. WA and AM-H performed immunohistochemistry. KT revised the work.
Funding
The author(s) disclosed receipt of the following financial support for the research, authorship, and/or publication of this article: This work was financially supported by JSPS KAKENHI (grant number JP16K09207) (to M.O.) and the Fujiwara Memorial Foundation (to M.O.).
References
Supplementary Material
Please find the following supplemental material available below.
For Open Access articles published under a Creative Commons License, all supplemental material carries the same license as the article it is associated with.
For non-Open Access articles published, all supplemental material carries a non-exclusive license, and permission requests for re-use of supplemental material or any part of supplemental material shall be sent directly to the copyright owner as specified in the copyright notice associated with the article.