
Abstract
Striking levels of spatial organization exist among and within interphase cell chromosomes, raising the possibility that other nuclear molecular components may also be organized in ways that facilitate nuclear function. To further examine molecular distributions and organization within cell nuclei, we utilized Raman spectroscopy to map distributions of molecular components, with a focus on cellular lipids. Although the vast majority of cellular lipids are associated with membranes, mapping the 2870/2850 cm−1 lipid peak ratios revealed that the most highly ordered lipids within interphase cells are found within cell nuclei. This finding was seen in cells from multiple tissue types, noncancerous cells, and in cancer cell lines of different metastatic potential. These highly ordered lipids colocalize with nuclear chromatin, are present throughout the nuclear volume, and remain colocalized with chromatin through mitosis, when the nuclear envelope has dissociated. Phosphatidylinositol is a major component of the highly ordered lipids. The presence of phosphatidylinositol and other lipids in the nuclear interior is well established, but their highly ordered packing has not been reported and represents a unique finding. The molecular interactions involved in the formation and maintenance of these highly ordered lipids, and their potential effects on nuclear activities, remain to be discovered.
Introduction
Advances in imaging and structural diagnostic technologies are demonstrating striking degrees of molecular organization within cell nuclei. Chromosomes in interphase cells occupy distinct spatial positions (chromosome territories) that are conserved from one cell division to the next, 1 and the positions of specific DNA loops within those territories play an important role in the regulation of chromatin activity.2–5 Chromatin conformation capture approaches have shown striking degrees of organization and structurally related interactions among genomic sequences within chromosomes, and these interactions appear to be important in the regulation of gene expression.6,7 Although these studies have focused on the structure and organization of interphase chromatin and the relationship between chromatin structure and various nuclear activities, the nucleus contains more than just chromatin, thus it is of considerable interest to elucidate spatial relationships and organizations among these other molecular components as well. Understanding these relationships would advance current understanding of basic cellular function as well as allow investigation into how disruption of those organizations might contribute to disease states.
One methodology which can be used to map the distribution of different molecular species in three dimensions is Raman spectroscopy, a noninvasive, label-free technique that has primarily been a tool of materials scientists but has increasingly been utilized to analyze biological systems due to recent advances in analytical software that has facilitated the analysis of the formidably complex cellular Raman spectral patterns.8–11 Differences in Raman spectra have been identified which can differentiate tissue and cell types, 12 monitor tissue changes during differentiation, 13 proliferating from nonproliferating cells,14,15 cancerous tissues and normal tissues,16,17 different types of cancer cells, 18 and low grade from high grade breast cancer cells. 19 The most common approach in these studies has been to average multiple spectra taken at 10 to 15 separate points within each cell, and then to compare the averaged spectra of one cell type with averaged spectra of other cell types. Two-dimensional mapping of cells and tissues has also been accomplished, in some cases to a striking degree of intracellular detail. 10 Although these studies have served as proof of principle that Raman spectra can reflect cell structure and composition, for the most part these results could have been obtained utilizing more conventional approaches, and the extraordinary capabilities of Raman signals in examining biological systems have yet to be fully tapped. Most cellular investigations utilizing Raman spectroscopy have focused on the quantitation of different molecular species, rather than the spatial distribution of those molecular species within cells. In this study, we report finding uniquely ordered lipids within the interior of cell nuclei, closely associated with cell chromatin. The presence of lipids within cell nuclei has been well documented,20,21 but their existence in a highly ordered state is a unique finding, and represents yet another layer of molecular organization within eukaryotic cells.
Materials and Methods
Cell Culture
Cell lines were obtained from ATCC (Manassas, VA); cell culture media, cell culture reagents, buffers, and salts were obtained from Sigma-Aldrich (St. Louis, MO). MDA-MB 231 and MCF-7 human breast adenocarcinoma cells, and MG-63 human osteosarcoma cells were cultured in DMEM supplemented with 10% fetal bovine serum (FBS, Atlanta Biologicals, Atlanta, GA), 50 U/ml penicillin and 50 µg/ml streptomycin (pen/strep), and L-glutamine. MCF-10A human breast epithelial cells were cultured in F12 supplemented with 5% horse serum, 20 ng/ml EFG, 0.5 mg/ml hydrocortisone, 100 ng/ml Cholera toxin, 10 µg/ml insulin and 1% pen/strep. All cells were grown at 37C at 5% CO2.
Sample Preparation
Cells were passaged and allowed to adhere and grow on CaF2 disks (Crystran Ltd, Poole, UK). Cells were washed with PBS to remove media proteins and fixed with 4% formalin (20 min at 25C). Formalin was removed by three PBS washes, and buffer salt removed by a rapid rinse with distilled deionized water. The disks were allowed to air dry for at least 90 min in tissue culture hoods before scanning; complete drying was necessary to remove the large water Raman peak at 3400 cm−1. To examine normal cells that were not subject to tissue culture, de-identified buccal cells obtained from routine hygienic procedures, that would otherwise have been discarded, were used. The cells were smeared on a glass slide, washed with PBS, and fixed using 4% formalin as detailed above.
Mitotic cells were selected by one of two methods: synchronization by treatment with nocodazole (Sigma-Aldrich) and selection using the mitotic shake-off method. Nocodazole treatment involved incubating cells with 100 nM nocodazole in complete media for 10 hr at 37C, then the cells were mechanically dislodged by squirting media on the floor of the dish. The cells were collected by centrifugation, washed with PBS, and seeded on CaF2 disks for formalin fixation. The mitotic shake-off method involved mechanically shaking flasks containing exponentially growing cells to release the small number of rounded mitotic cells into the media. The media was centrifuged to collect the mitotic cells and seeded on CaF2 disks for formalin fixation.
Confocal Microscopy
MG-63 cells were cultured on coverslips to a confluent monolayer for 24 hr at 37C. Cells were labeled using the nuclear/nucleolar staining kit (ab139474; Abcam, Cambridge, MA) protocol for confocal microscopy. Briefly, cultured cells were washed with PBS to remove culture media and incubated for 30 min separately with Nuclear Red (Sigma-Aldrich) and Nucleolar Green (AbCam) stains at room temperature. After staining, cells were washed with 1× assay buffer (from the kit) and used for confocal microscopy.
MG-63 cells treated with nuclear/nucleolar stains were visualized with confocal microscope (Nikon A1R, NJMS imaging facility). Cells were maintained at 37C and constant humidity during image acquisition. Live cell images of nuclear stain were generated at an emission wavelength of 590 nm and of nucleolar stain at 515 nm.
Raman Data Collection and Processing
All data were collected on an InVia laser Raman microscope (Renishaw plc, Wotton-under-Edge, UK) and processed using WiRE 4.1 software (Renishaw plc). CaF2 disks with fixed cells were positioned within the inVia instrument and examined under low magnification (5×, 20×) to identify candidate cells. Identified cells were centered and a depth series was performed at 50× to determine the upper and lower boundaries of the cell.
Data were collected within a defined volume that contained the nucleus and most, if not all of the cytoplasm. Cells were imaged using StreamlineHR in high confocal mode, with a step-size of 1 μm in x-, y-, and z-axes. Static spectra centered at 1310 and 2400 cm−1 were acquired using the 532 nm laser at 5% laser power, at five acquisitions per second.
Chemometric analyses were applied to the acquired spectra in WiRE 4.2 software (Renishaw plc). The spectra were preprocessed with cosmic ray removal, baseline subtraction, noise filtering, and smoothing followed by multivariate analyses. The resulting data set was used to map the various macromolecular components represented by peak shifts for phenylalanine (1000 cm−1), DNA (1093 cm−1), phosphatidylinositol (779 cm−1), lipid methyl groups in the trans conformation (2870 cm−1), and lipid methyl groups in the gauche conformation (2850 cm−1). The ratio of the values at 2870/2850 cm−1 was used to identify the regions containing the highest concentrations of highly ordered lipids, an approach which has been utilized in studies of lipid samples of various degrees of complexity, from purified lipid bilayers to physiological tissues (Table 1). Although peak amplitudes at single Raman peak shift values have been typically used of these calculations,22–24 in a small number of experiments, we recalculated the data using peak areas instead, but those maps were indistinguishable from the amplitude data (Ramamurthy, unpublished). The derived maps were visualized using the volume viewer feature of WiRe 4.1 software.
Publications in Which the Ratio of Raman Peaks at 2870/2850 cm−1 Was Used as a Measure of Lipid Packing Order.
In these publications the 2870 cm−1 peak represented lipid methyl groups in the trans conformation, while the 2850 cm−1 peak represented lipid methyl groups in the gauche conformation.
Results
The region of highest ordered lipid packing is within the nucleus: A variety of cell types were analyzed, including MG-63 osteosarcoma cells (which have very well-organized cytoplasmic and nuclear structure), noncancerous MCF-10A breast epithelial cells, noninvasive MCF-7 breast adenocarcinoma cells, and highly invasive and metastatic MDA-MB231 breast adenocarcinoma cells. The dominant Raman spectral feature seen when examining any cell type is the large multicomponent peak at 2800 to 3000 cm−1, a peak composed primarily of lipid and protein CH2-stretch peaks. As shown in Fig. 1, this broad peak is the single largest feature of Raman spectra taken at any point within the cell, including the cell membrane, cell cytoplasm, nuclear membrane, and within the nucleus. Within this large peak region, the component peaks at 2850 and 2870 cm−1 are predominantly due to lipid methyl groups in the gauche and trans conformations, respectively.24,33 Although protein methyl groups do produce several sharp peaks within this broad 2800 to 3000 cm−1 spectral feature, the main peak due to protein methyl groups exists at 2940 cm−1, upfield from the lipid methyl peaks utilized in these studies. 35 It should also be mentioned that membrane lipids contain over twice the number of methyl groups as polypeptides of comparable molecular weight due to the presence of two long acyl chains within each phospholipid molecule, thus in membranes or other cellular substructures where lipids and proteins coexist, the lipid methyl groups will significantly outnumber the protein methyl groups, which should be reflected in their relative signal intensities. Lipid methyl groups in the trans conformation are found in linear fatty acid chains, and groups of lipids containing linear fatty acid chains can create regions of tightly packed, highly ordered lipids, while lipid methyl groups in the gauche conformation create bends in the fatty acid chains and prevent tight lipid packing. The ratio of trans/gauche Raman signals is well established as a measure of the degree of ordered lipid packing, with larger ratio values representing higher ordered lipids (Table 1). Surprisingly, the three-dimensional distribution of the highest values of this ratio in the large and highly structured MG-63 cells demonstrates that the cellular region containing the most highly ordered lipids is the nucleus (Fig. 2). Although Fig. 2 clearly shows that the vast majority of cellular lipids exist outside of the nucleus, as shown by the individual distributions of the 2850 and 2870 cm−1 peaks (Fig. 2B and C), the distribution of the ratio indicates that the small fraction of lipids within the nucleus are the most highly ordered (Fig. 2D). Within the MG-63 nuclei, the smaller areas within the cell nuclei that contained the highest concentrations of highly ordered lipids corresponded to the nucleoli (Fig. 3). This pattern was also seen in MCF-10A (Fig. 4A), MCF-7 (Fig. 4B), and MDA-MB231 (Fig. 4C) breast epithelial and breast cancer cells. Mapping of the 1650 cm−1 protein amide peak using data from scans of both the lower region and the upper region of the Raman spectrum showed the expected cellular distribution of proteins and no anomalies within the nuclei which might contribute to the enhanced 2870/2850 cm−1 ratio seen there (Fig. 5). Although our original hypothesis was that the observed localization was a common feature of the neoplastic cells studied, MCF-10A is considered nonneoplastic. Nevertheless, MCF-10A is a cultured cell line, we therefore performed a limited number of laser Raman studies on swabbed normal cells from buccal swabs and found the same pattern of distribution of the highly ordered nuclear lipids (unpublished observations). In all cases, within the nucleus itself, the highest concentration of highly ordered lipids usually coincides with nucleolar regions. Our findings thus appear to represent a common cellular feature not previously recognized, rather than an indication of malignancy.
Highly ordered lipids appear to remain colocalized with chromatin through mitosis: As the most highly ordered lipids exist within the nuclei of interphase cells in close association with chromatin, it was of interest to follow these lipids during mitosis, when the nuclear membrane dissociates and the lipids would be free to dissociate throughout the dividing cell. 36 Cells were synchronized in an early mitotic stage using nocodazole, released, and Raman spectra were collected as the cells moved through mitosis and cytokinesis. The highly ordered lipids did not diffuse away but remained associated with the chromatin region at all stages of cell division (Fig. 6). To insure that the nocodazole synchronization protocol did not affect these results, cells were selected in mitosis in the absence of nocodazole using the mitotic shake-off procedure and highly ordered lipids were visualized in the same manner. The distributions of highly ordered lipids in mitotic cells selected using the mitotic shake-off technique were virtually identical as those seen in the nocodazole-treated cells, indicating that the persistence of ordered lipid association with chromatin through mitosis was independent of cell treatment or selection (Fig. 7).
Phosphatidylinositol is a significant component of the ordered nuclear lipids: Raman peaks identified as specific for phosphatidylinositol were mapped in three dimensions and compared with the distribution of lipids overall and of the highly ordered lipids (Fig. 7). The most striking results are the very strong colocalization of phosphatidylinositol with the highly ordered lipid volume, within the highly ordered lipid volume. Furthermore, the close association between highly ordered lipids and phosphatidylinositol continues through mitosis, and this result is seen in multiple cell lines and cell types (Fig. 8).
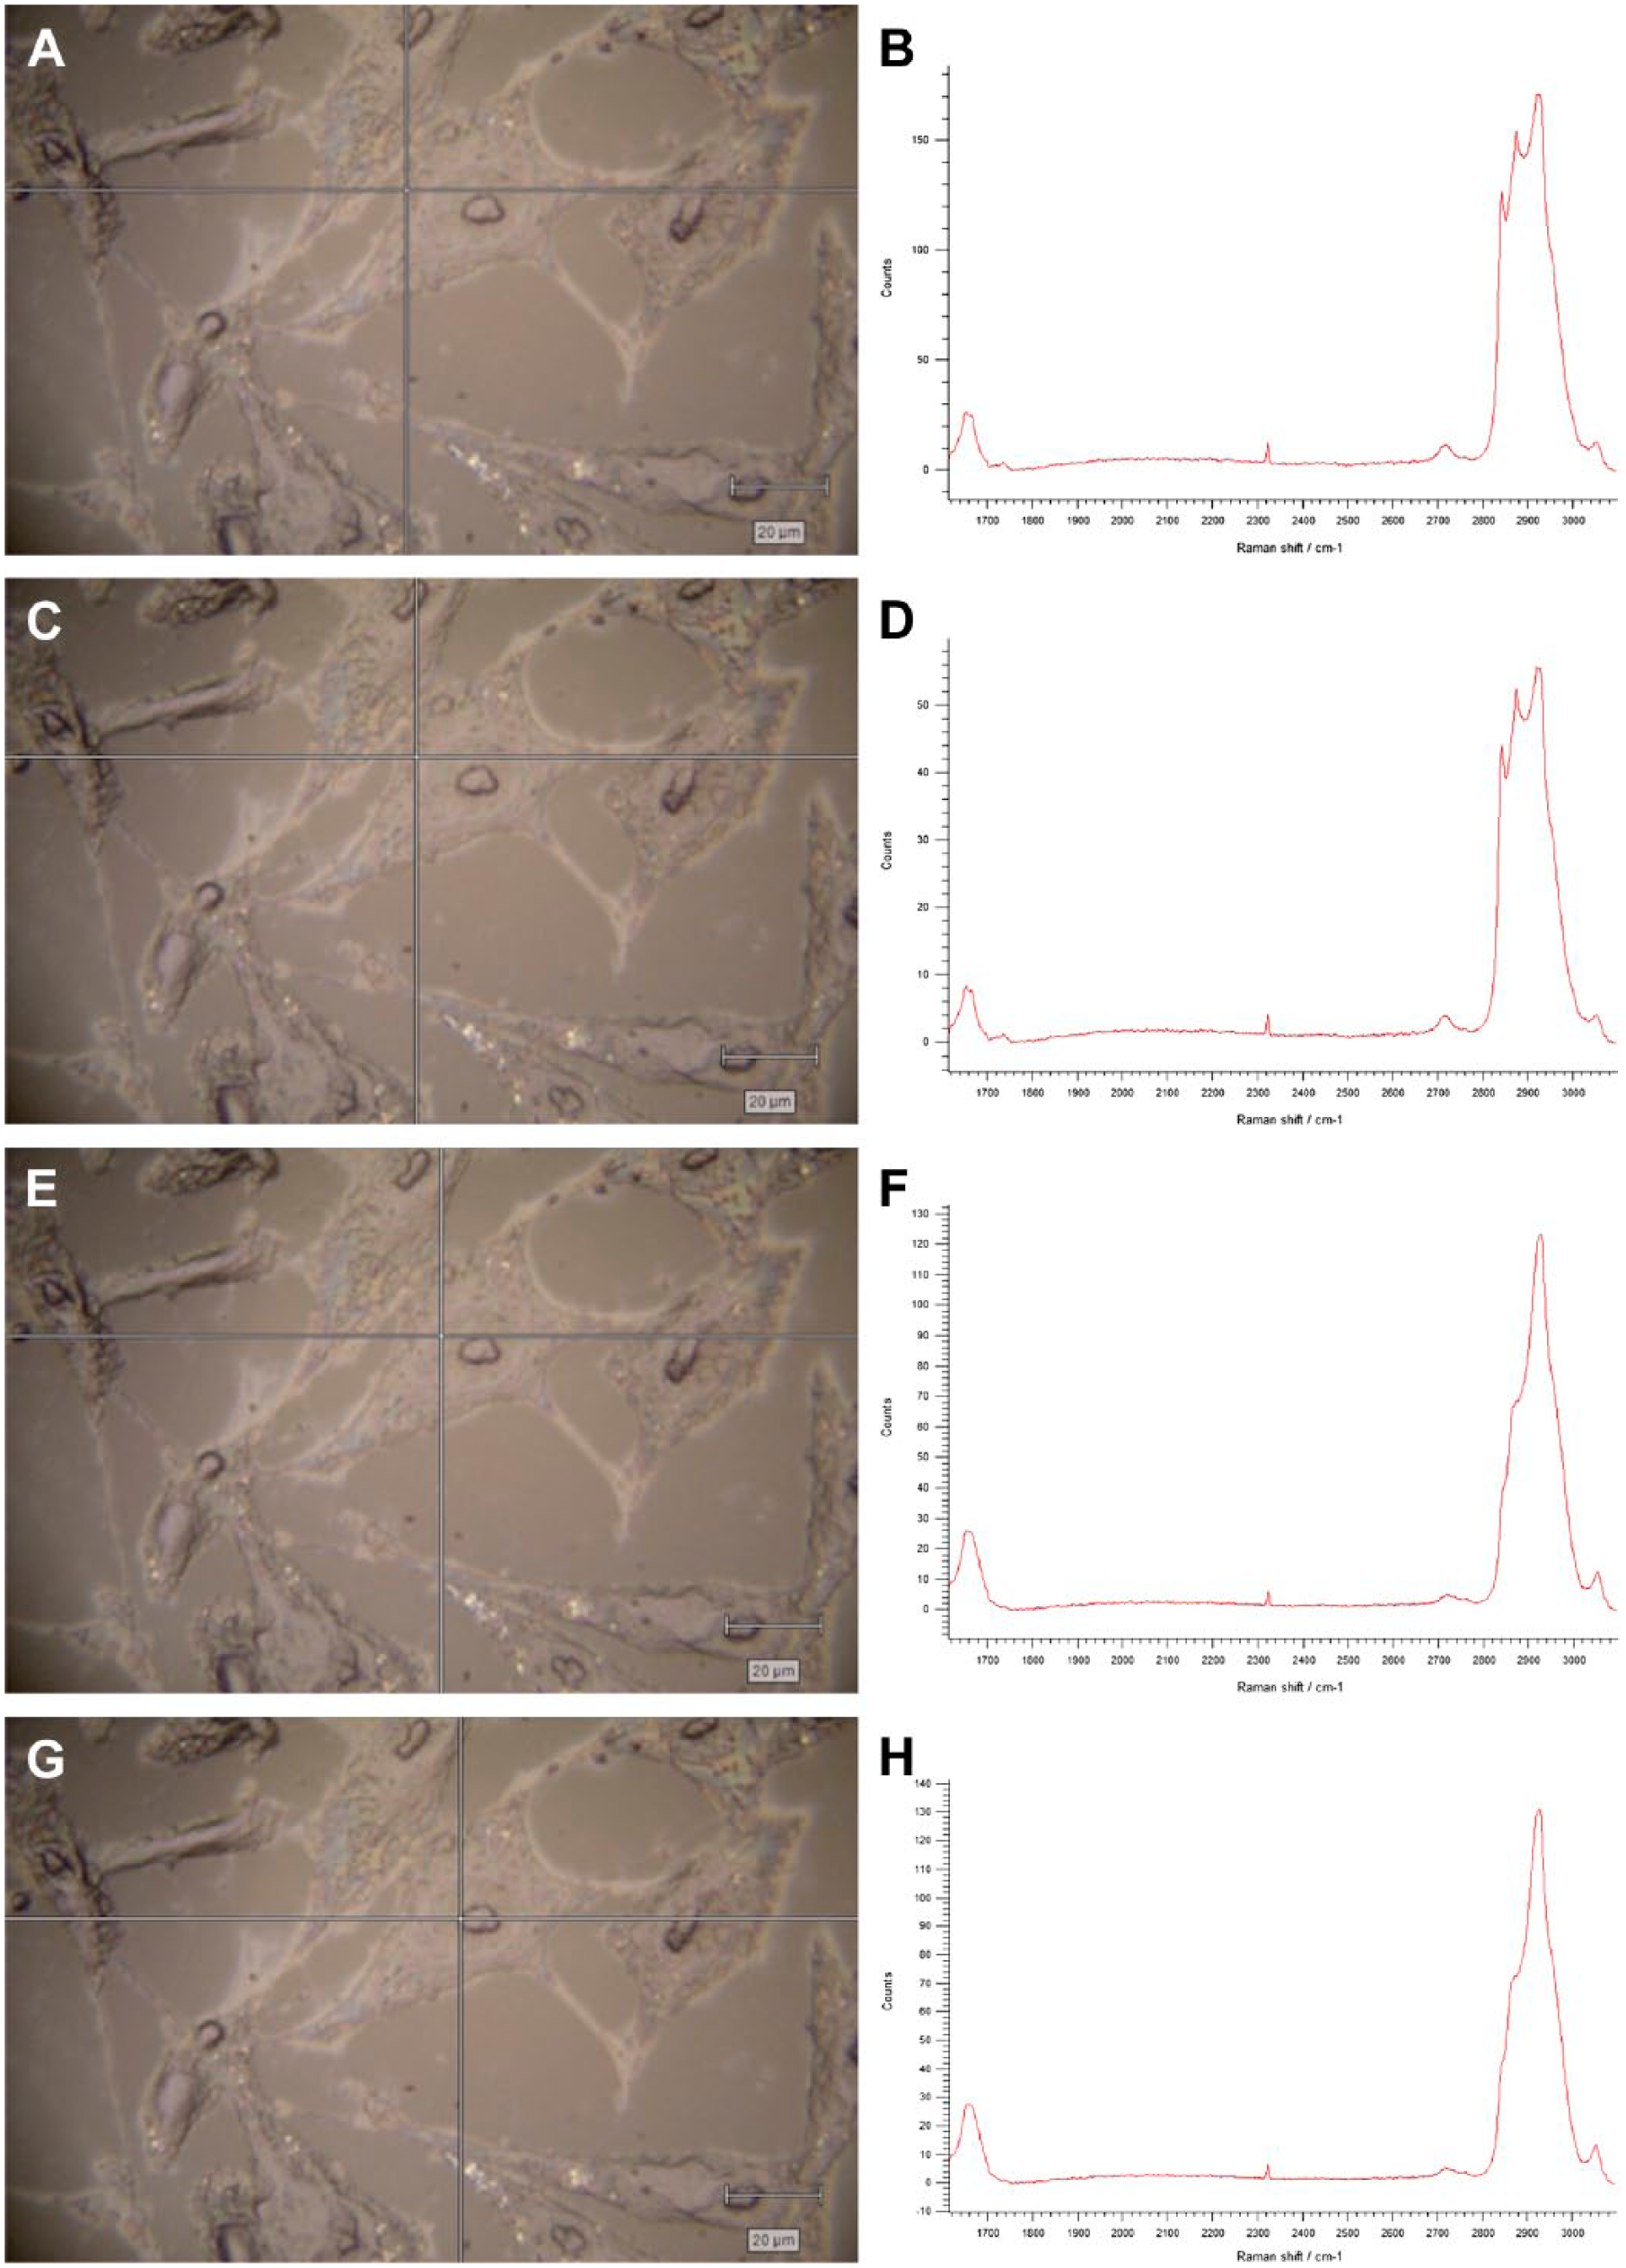
Raman spectra at various points within a human osteosarcoma MG-63 cell. The crosshairs on the cell images (A, C, E, G) represent the points within the cell where the Raman spectra (B, D, F, H) were taken. A and B, plasma membrane. C and D, cell cytoplasm. E and F, nuclear membrane. G and H, within the nucleus at the edge of nucleolus.
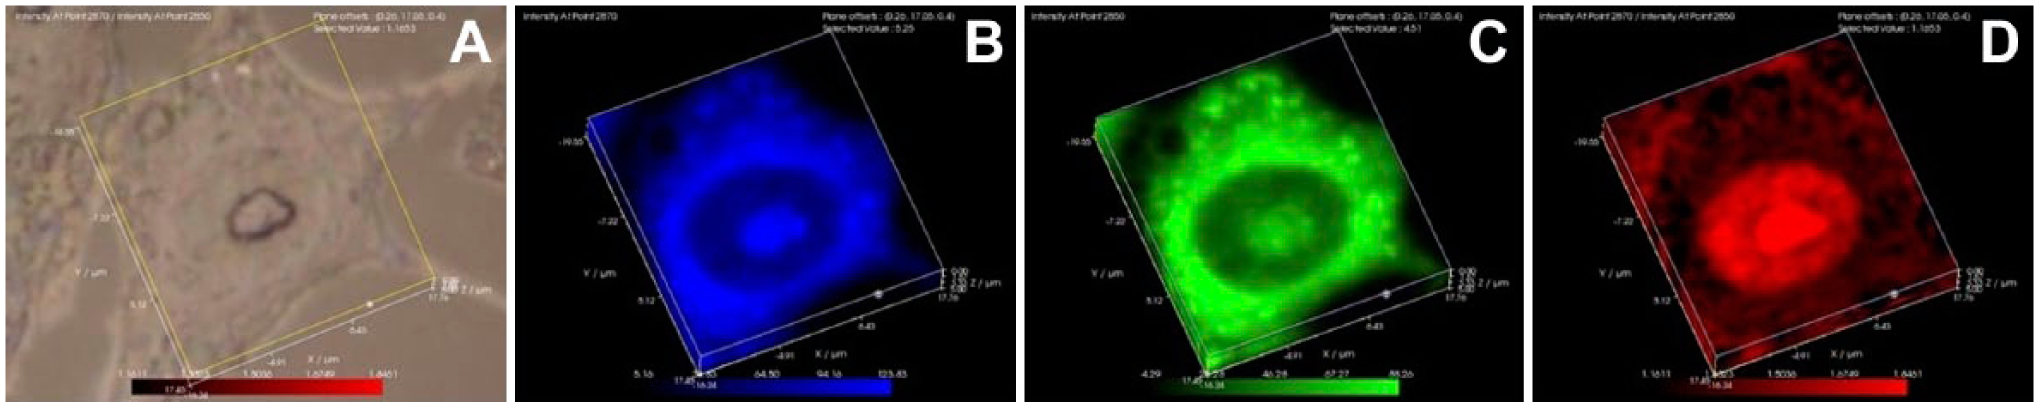
The distribution of highly ordered lipids within interphase osteosarcoma cells. Laser Raman spectra were collected on MG-63 human osteosarcoma cells and the distributions of lipid methyl groups in different conformations was mapped. Panel A represents a white light image. Panel B represents the distribution of 2850 cm−1 Raman peak amplitudes, which represents lipid methyl groups in the gauche conformation that occur in more loosely packed lipids. Panel C represents the distribution of 2870 cm−1 Raman peak amplitudes, which represent lipid methyl groups in the trans conformation, which allows more tightly packed, ordered lipids. Panel D represents the distribution of the 2870/2850 cm−1; the highest values of this ratio represent the regions of highest lipid packing order. The most highly ordered lipids are present throughout the nuclear interior and appear associated with nuclear chromatin.
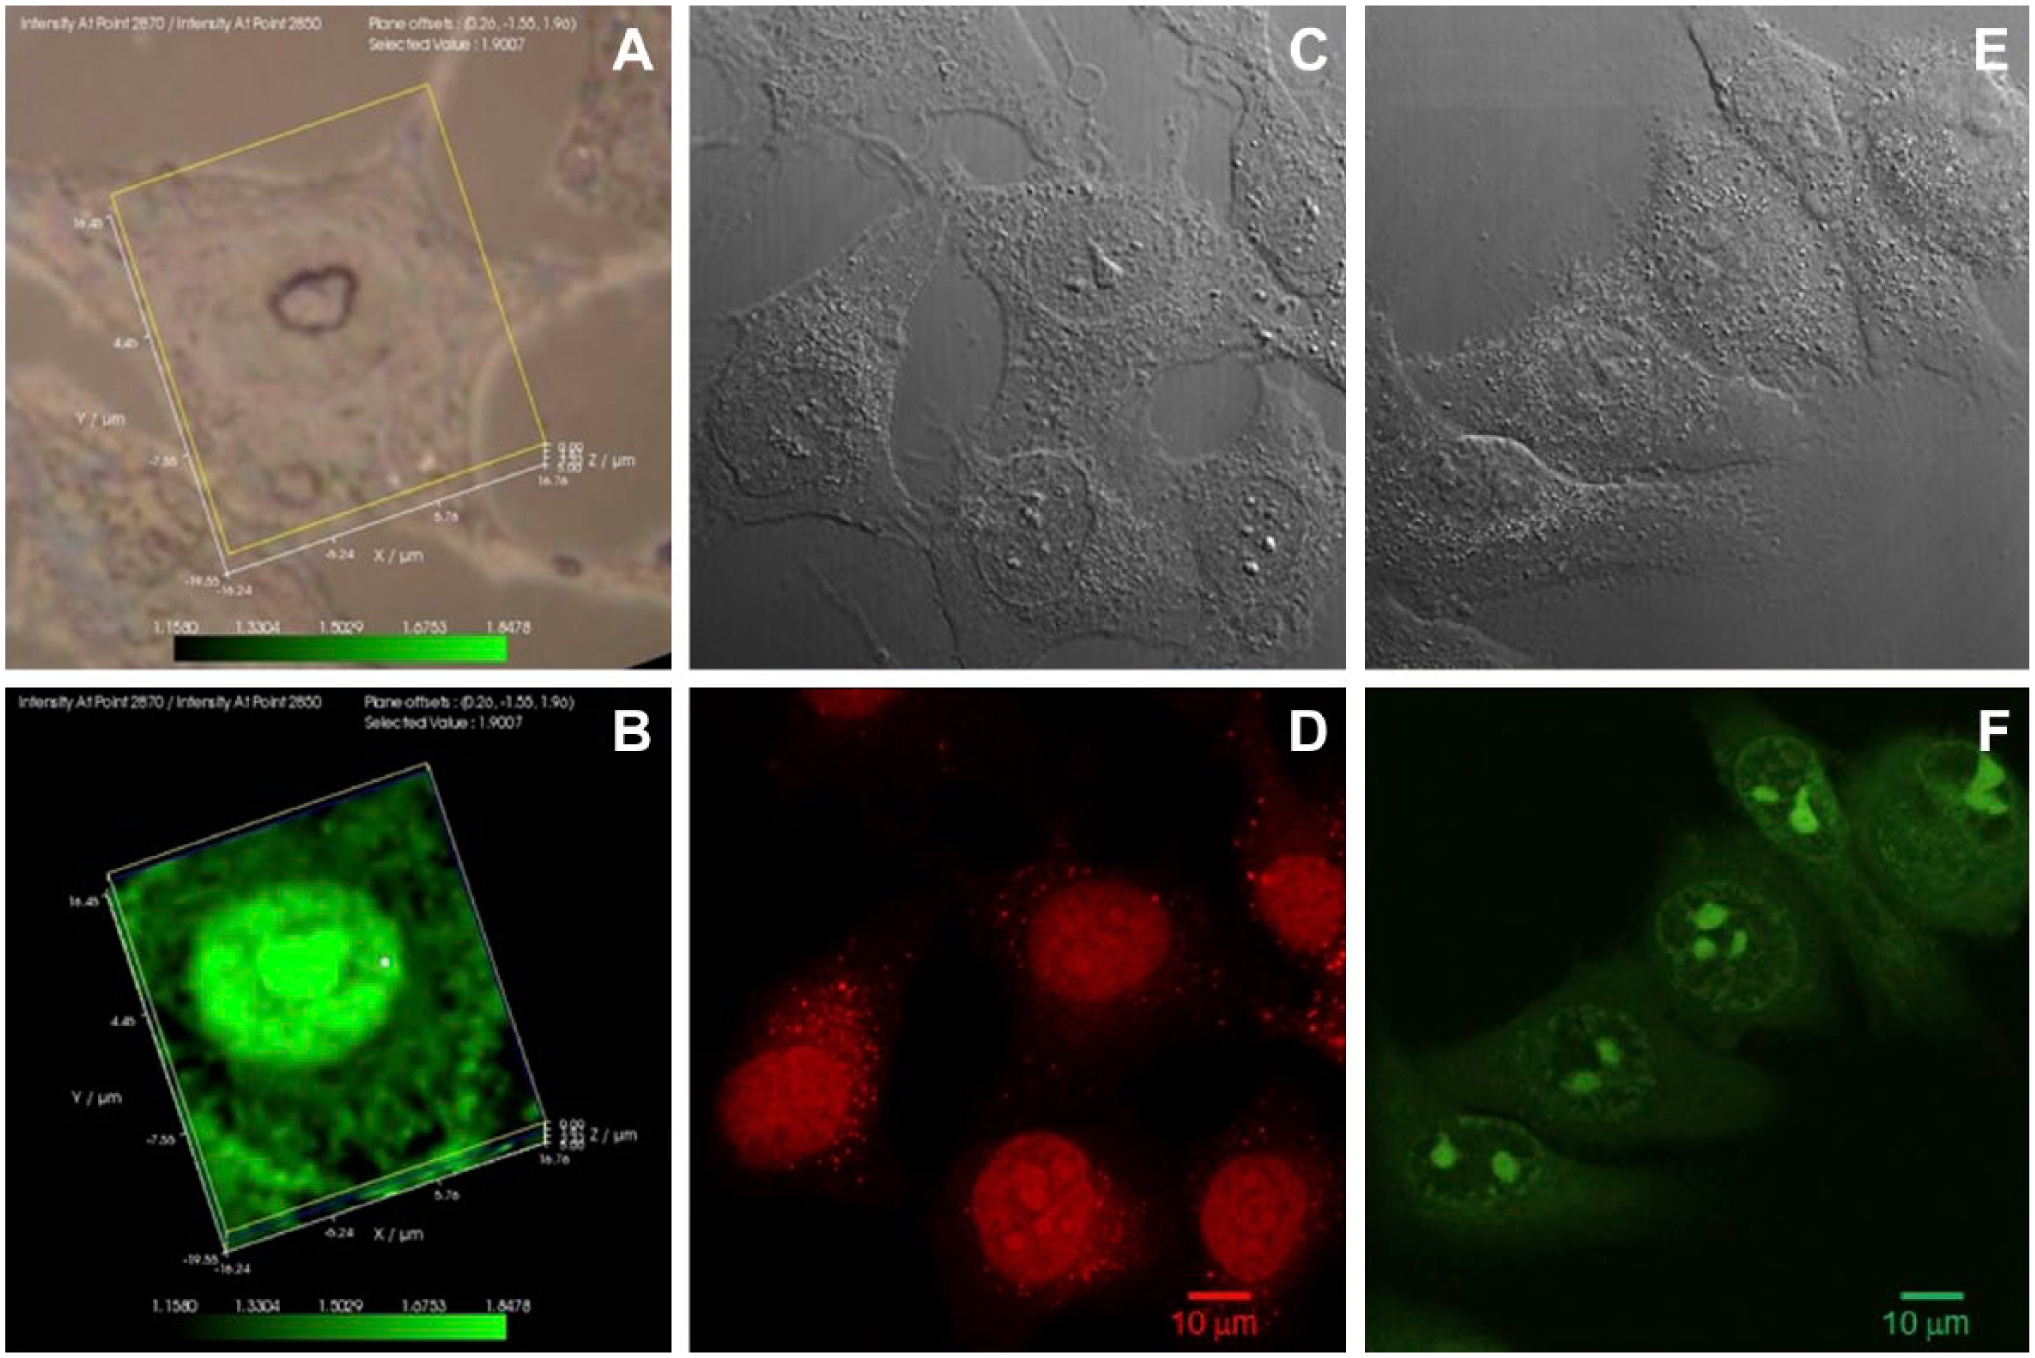
The regions within nuclei containing the highest concentrations of highly ordered lipids are the nucleoli. MG-63 cells were analyzed by laser Raman spectroscopy to identify regions of the most highly ordered lipids, and were also stained with Nuclear Red and Nucleolar Green stains to identify nuclear and nucleolar regions, respectively. Panel A represents a white light image, and panel B represents the distribution of the ordered lipid ratio (2870/2850 cm−1) in the cell shown in panel A. Panel C represents a white light image of MG-63 cells, and panel D represents the cells in panel C stained with nuclear red. Panel E represents a white light image of MG-63 cells, and panel F represents the cells shown in panel E stained with nucleolar green.
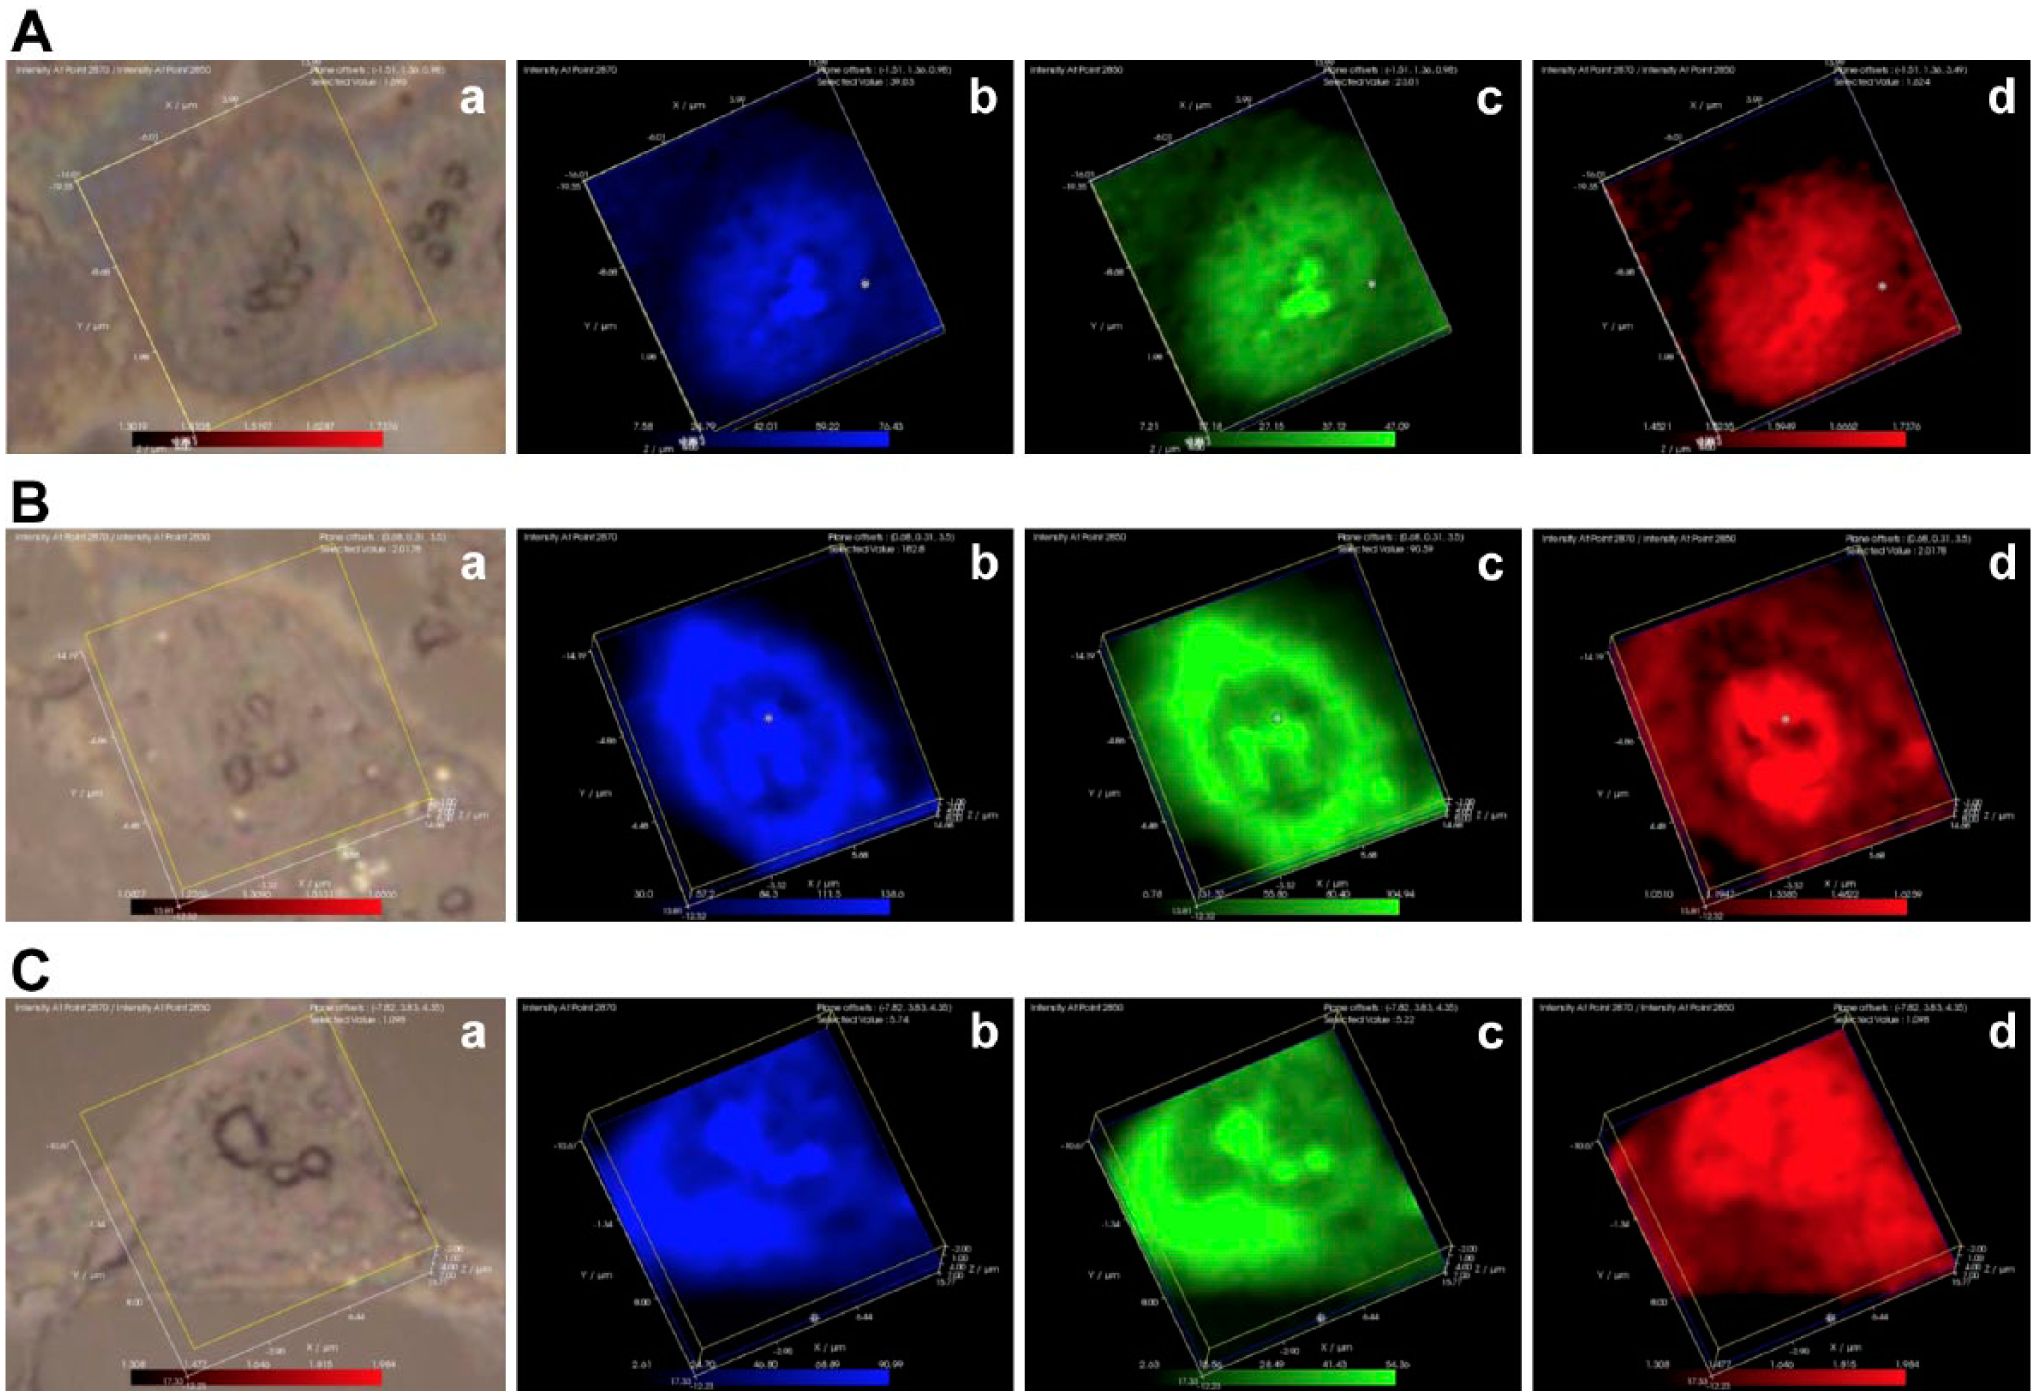
The distribution of highly ordered lipids within breast epithelial and breast cancer cells. Laser Raman analysis was performed on noncancerous MCF-10A (Fig. 3A) human breast epithelial cells, noninvasive MCF-7 (Fig. 3B) human breast adenocarcinoma cells, and highly invasive MDA-MB231 (Fig 3C) human breast adenocarcinoma cells. For each cell line, panel a represents a white light image, panel b represents the distribution of the 2850 cm−1 lipid methyl peak (blue), panel c represents the distribution of the 2870 cm−1 lipid methyl peak (green), and panel d represents the distribution of the 2870/2850 cm−1 (red, highly ordered lipids).
The distribution of cellular protein as mapped by the 1650 cm−1 amide shift. Because the entire Stokes shifted Raman spectra (from 300 to 3100 cm−1) could not be collected using a single diffraction grating setting, data were collected twice within a single defined volume using two settings, one collecting the lower end of the spectrum (300 to 2100 cm−1), the other collecting the high end of the spectrum (1600 to 3100 cm−1). This approach produced two sets of spectra covering a defined volume which overlapped in the 1600 to 1700 cm−1 region. The amide band at 1650 cm−1 appeared in both spectra and was used to compare or normalize the lower and higher region spectra as needed. Panel A represents a white light image of an MG-63 cell, panel B represents the distribution of the 1650 cm−1 peak using data from the lower region spectrum and panel C represents the distribution of the 1650 cm−1 peak using data from the higher region spectrum. Representative Raman spectra covering the lower and upper ends are shown, with the 1650 cm−1 peak in each spectrum circled.
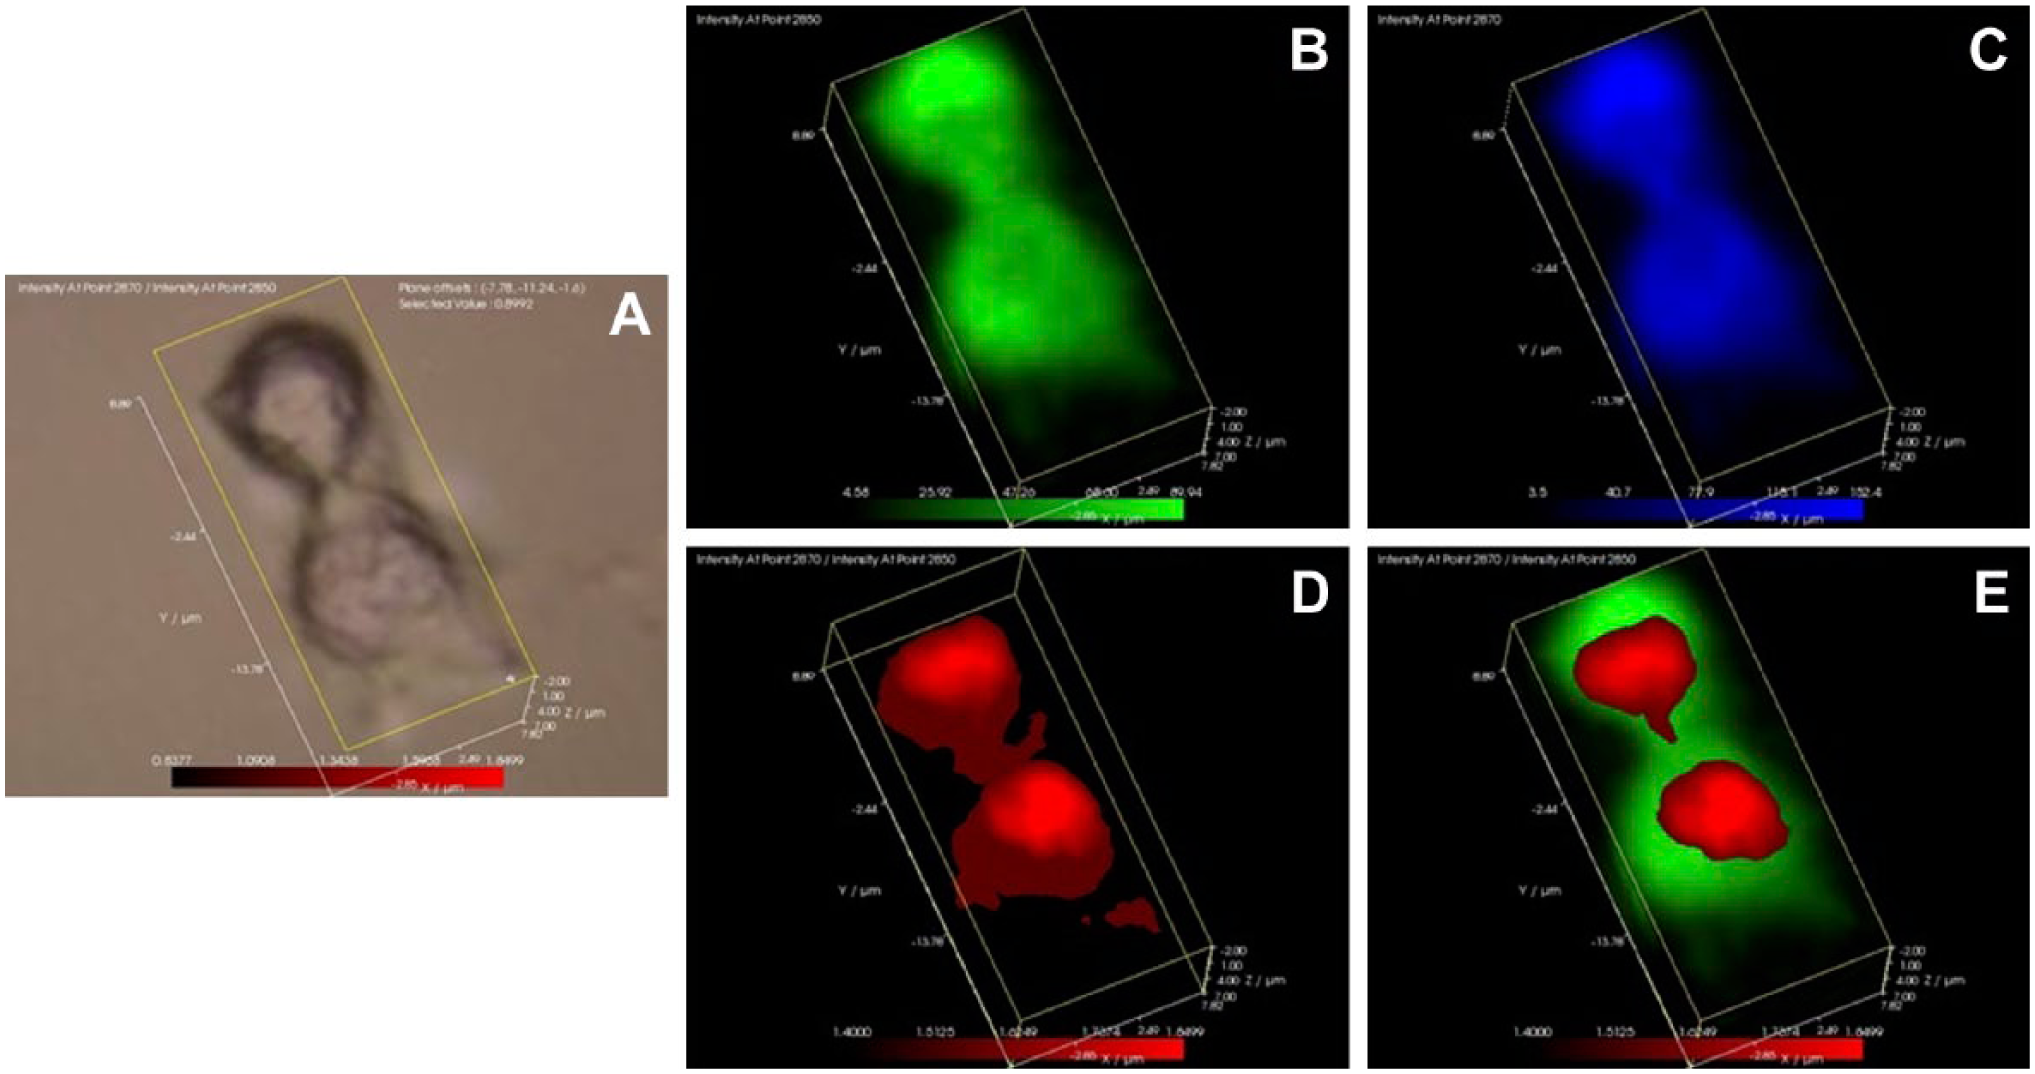
The distribution of highly ordered lipids during mitosis. MCF-7 cells were synchronized in early mitosis by overnight incubation with nocodazole, released to allow mitotic entry, and then fixed for laser Raman spectra collection. In the MCF-7 cell undergoing cytokinesis, panel A represents the white light image, panel B represents the distribution of the 2850 cm−1 lipid methyl peak (green), panel C represents the distribution of the 2870 cm−1 lipid methyl peak (blue), panel D represents the distribution of the 2870/2850 cm−1 (red), and panel E represents the 2870/2850 cm−1 (red) juxtaposed over the 2850 cm−1 lipid methyl peak (green).
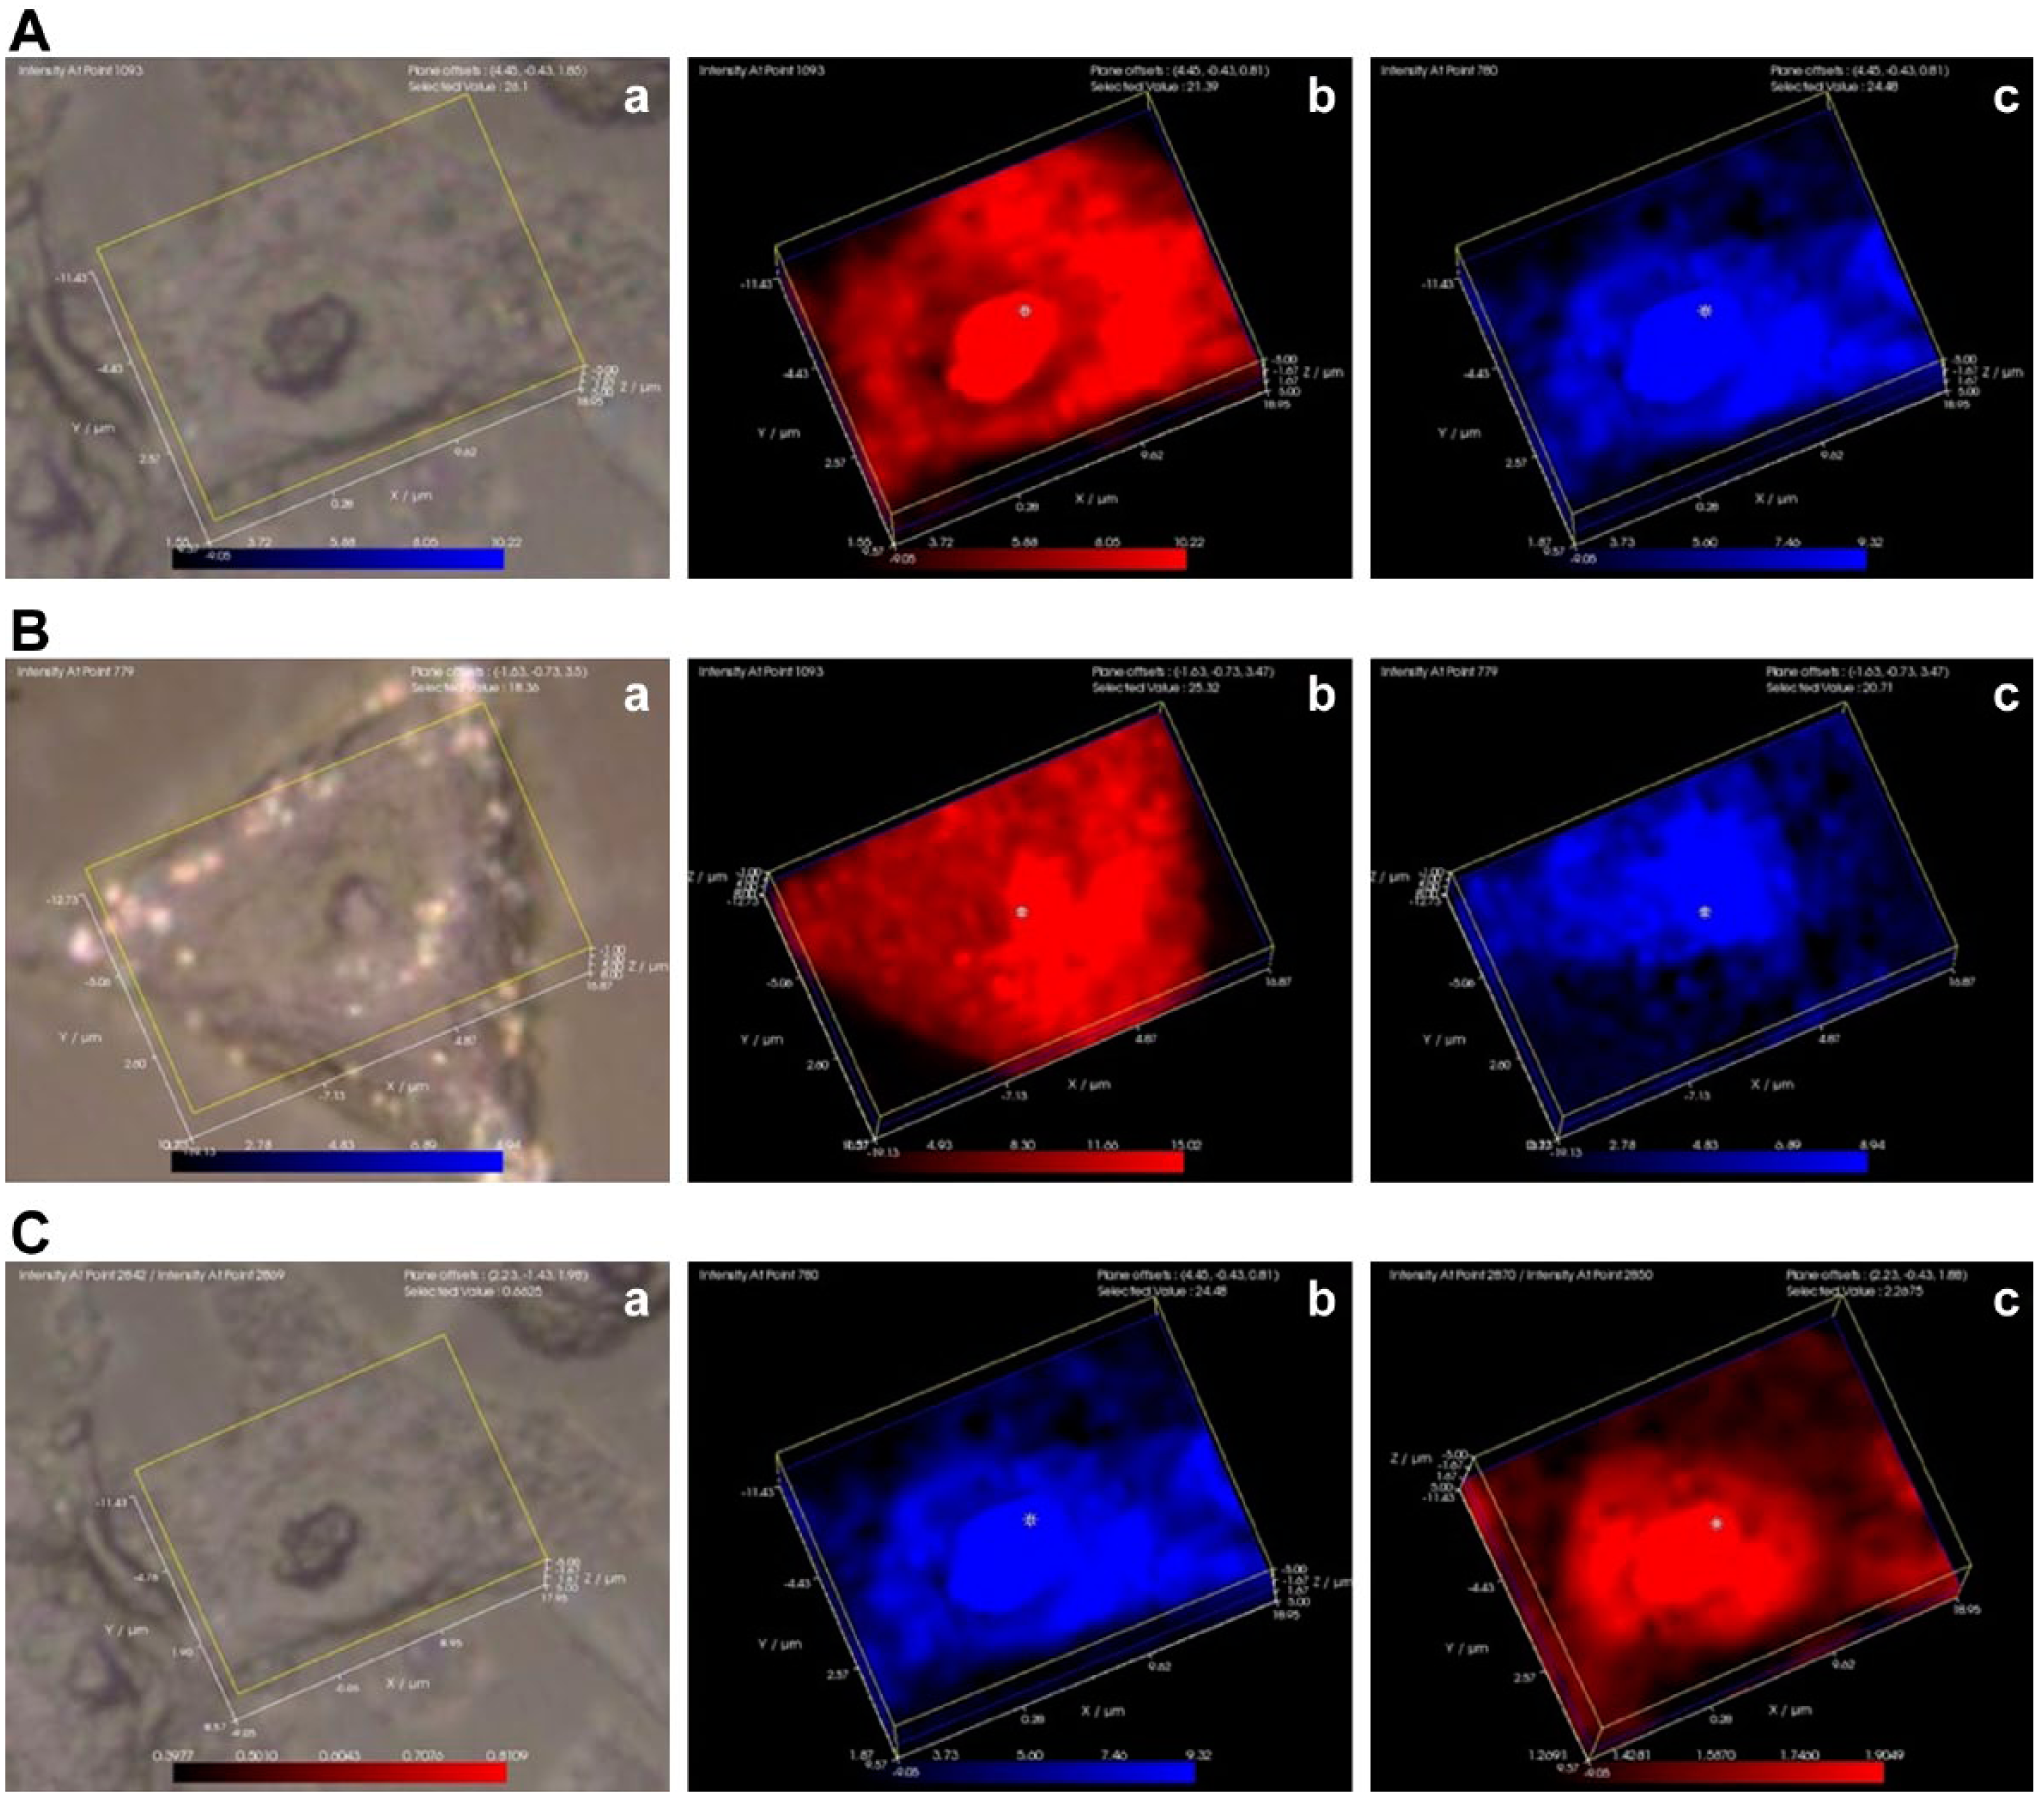
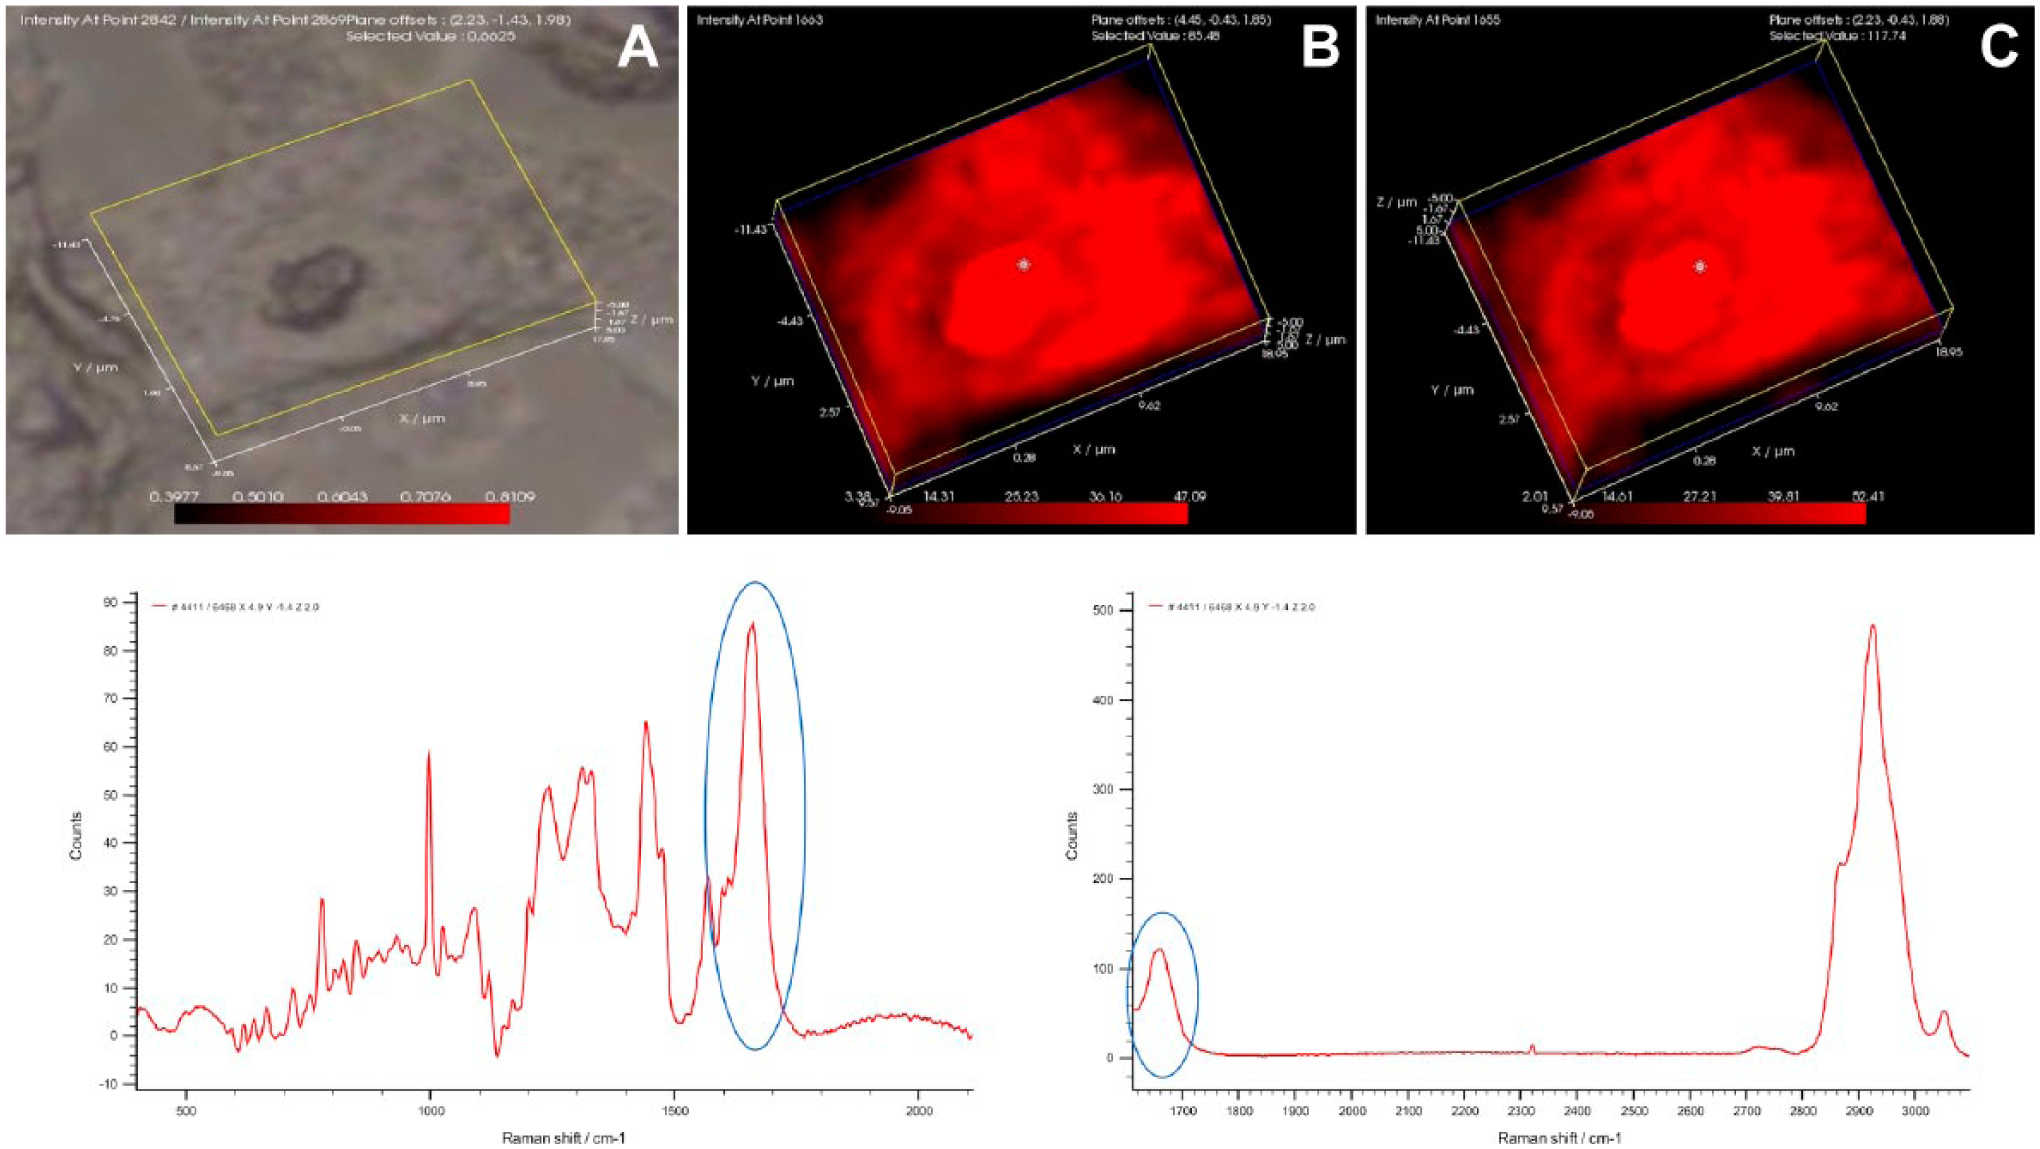
The distribution of phosphatidylinositol and the distribution of the highly ordered lipids in interphase MG-63 and MCF-7 cells. In the first group of images showing an MG-63 cell (7A), panel a represents the white light image, panel b represents the 1093 cm−1 DNA peak (red), and panel c represents the 779 cm−1 phosphatidylinositol peak (blue). In the second group of images showing an MCF-7 cell (7B), panel a represents the white light image, panel b represents the 1093 cm−1 DNA peak (red), and panel c represents the 779 cm−1 phosphatidylinositol peak (blue). In the third group of images showing an MG-63 cell (7C), panel a represents the white light image, panel b represents the 779 cm−1 phosphatidylinositol peak (blue), panel C represents the 2870/2850 cm−1 ratio of trans to gauche lipid methyl peaks (red).
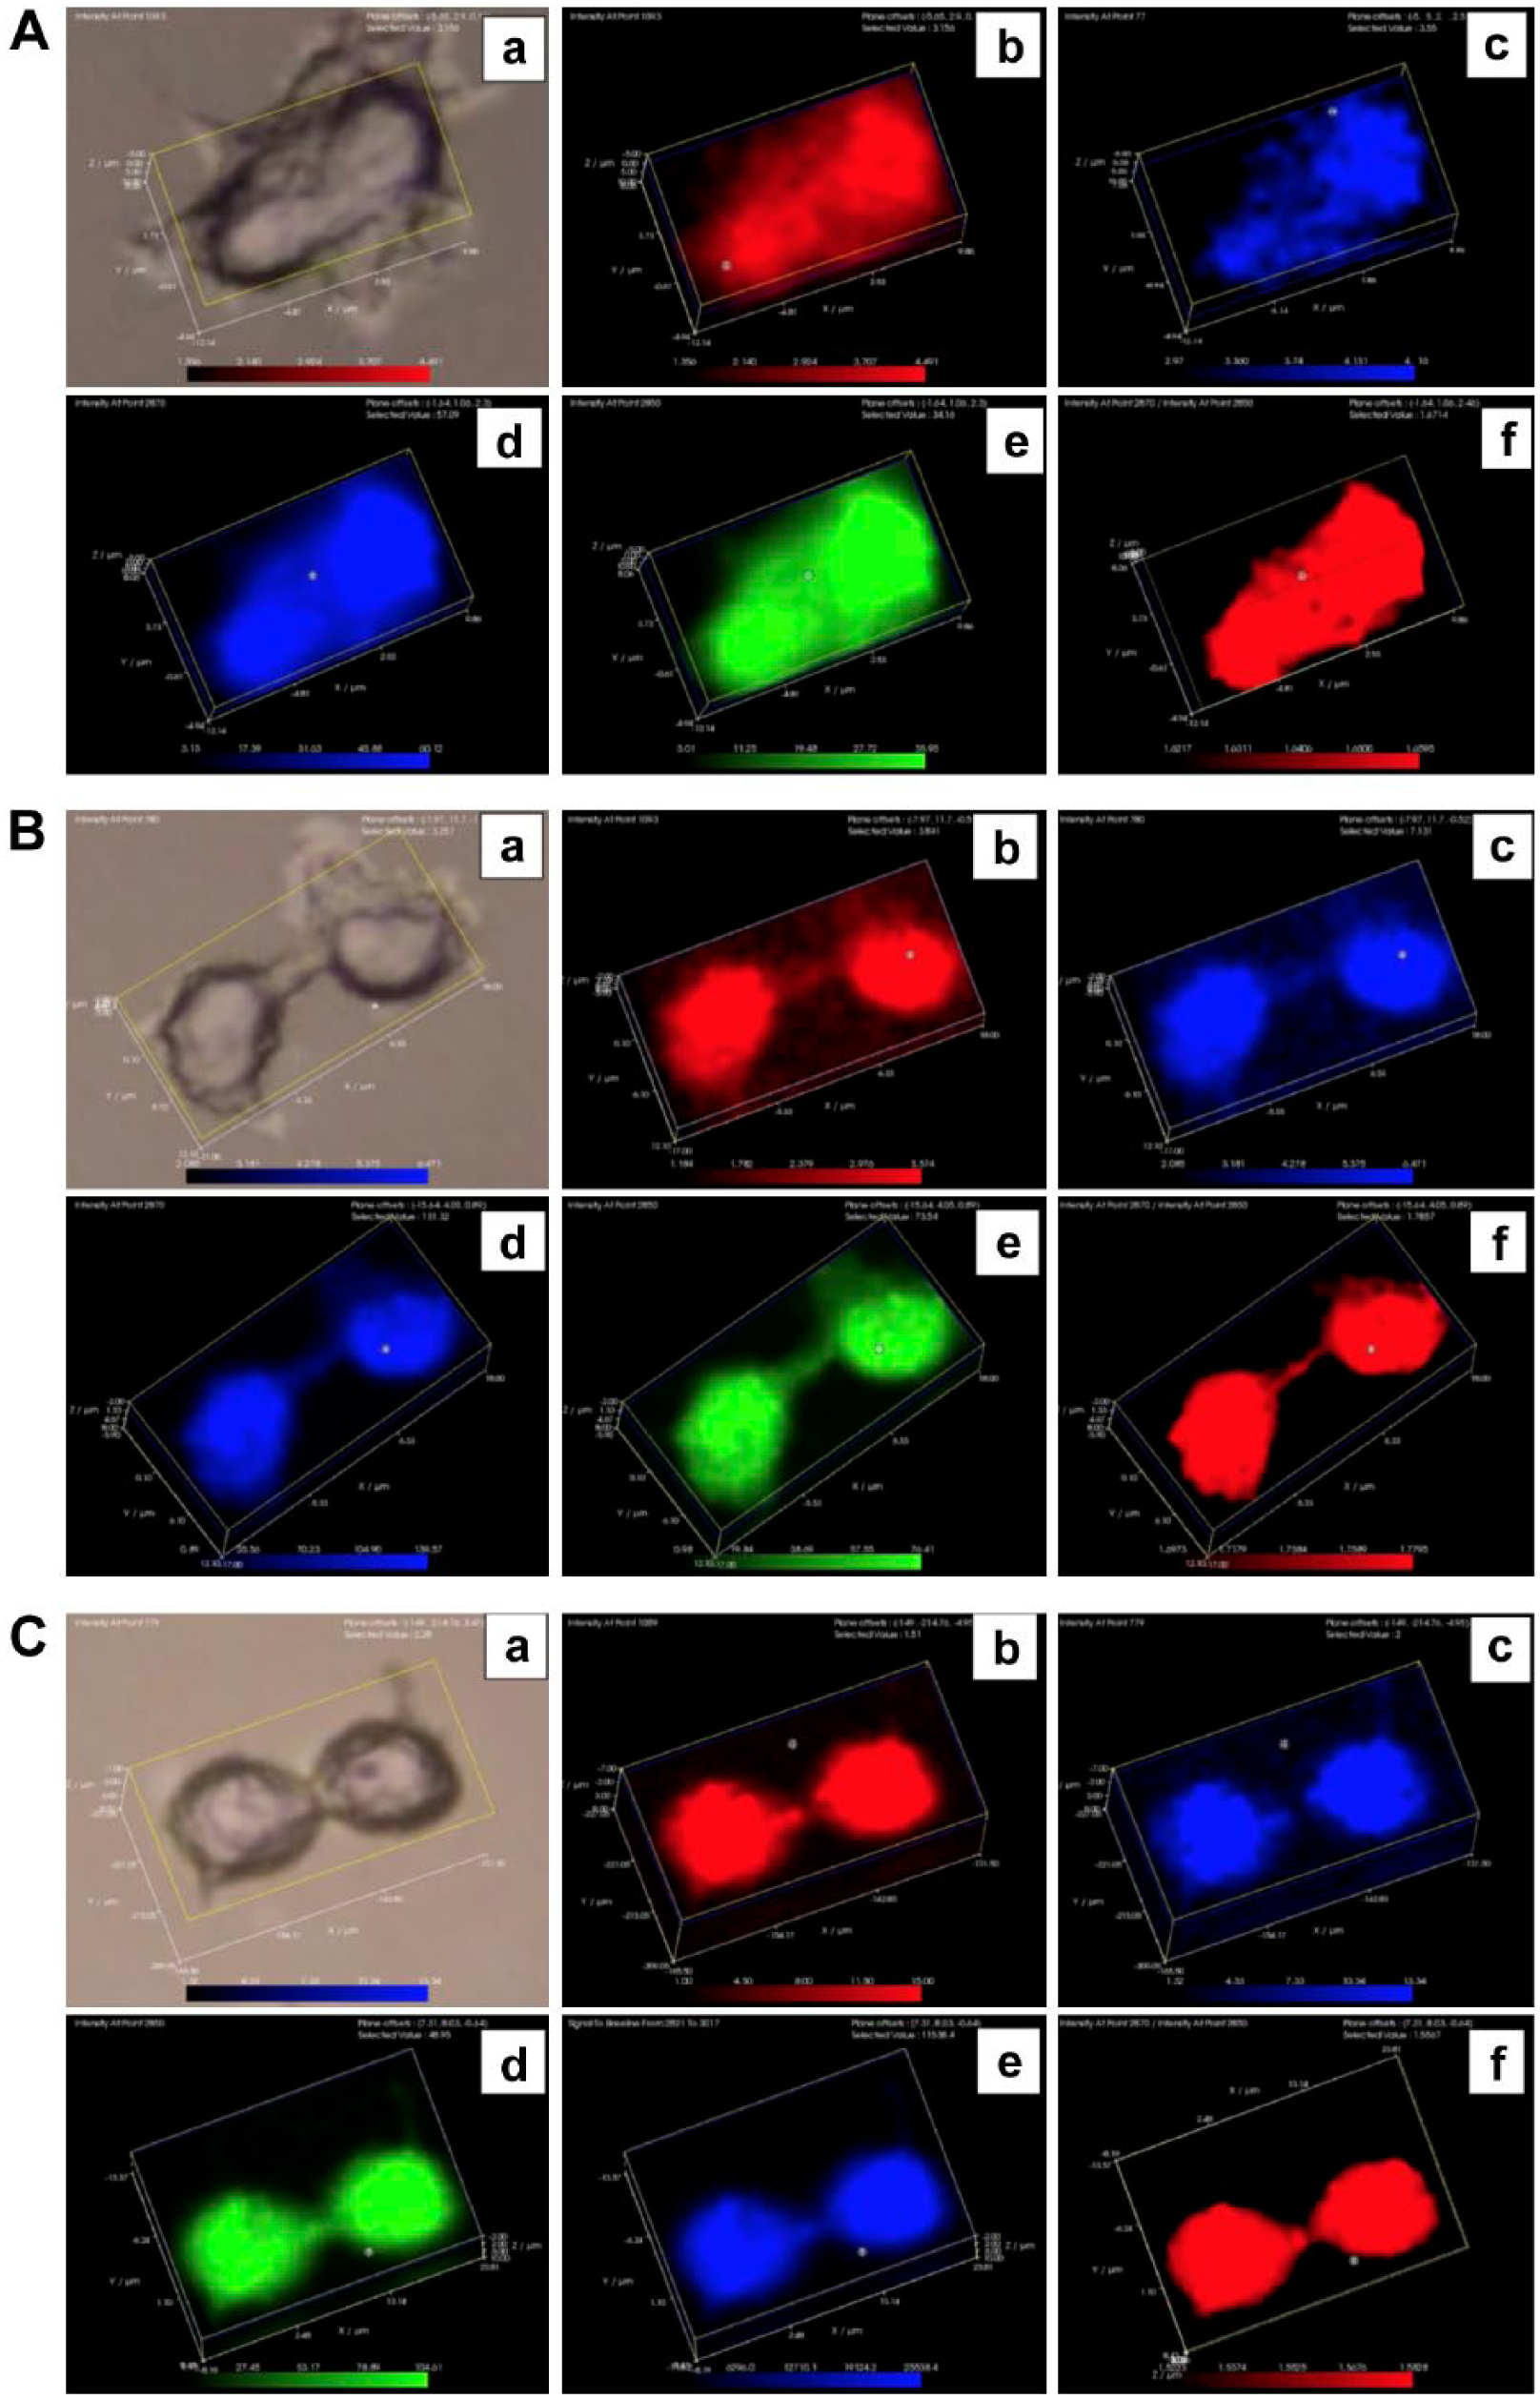
The distribution of phosphatidylinositol and highly ordered lipids in MCF-7 cells during mitosis. In the first group of images representing MCF-7 cells treated with nocodazole (8A), panel a represents a white light image, panel b represents the 1093 cm−1 DNA peak (red), panel c represents the 779 cm−1 phosphatidylinositol peak (blue), panel d represents the 2850 cm−1 lipid methyl gauche conformation peak (blue), panel e represents the 2870 cm−1 lipid methyl trans conformation peak (green), and panel f represents the 2870/2850 cm−1 ratio of trans to gauche lipid methyl peaks (red). In the second group of images representing MCF-7 cells also treated with nocodazole (8B), panel a represents a white light image, panel b represents the 1093 cm−1 DNA peak (red), panel c represents the 779 cm−1 phosphatidylinositol peak (blue), panel d represents the 2850 cm−1 lipid methyl gauche conformation peak (blue), panel e represents the 2870 cm−1 lipid methyl trans conformation peak (green), and panel f represents the 2870/2850 cm−1 ratio of trans to gauche lipid methyl group peaks (red). In the third group of images representing MCF-7 cells selected during mitosis using the mitotic shake-off technique (8C), panel a represents a white light image, panel b represents the 1093 cm−1 DNA peak (red), panel c represents the 779 cm−1 phosphatidylinositol peak (blue), panel d represents the 2850 cm−1 lipid methyl gauche conformation peak (green), panel e represents the 2870 cm−1 lipid methyl trans conformation peak (blue), and panel f represents the 2870/2850 cm−1 ratio of trans to gauche lipid methyl group peaks (red).
Discussion
It is not surprising that this Raman study found lipids closely associated with chromatin, as a number of studies have documented the presence of lipids within cell nuclei, and a few have found evidence of phospholipids associated with chromatin during interphase.20,37–40 What is novel in this study is the finding that the lipids associated with chromatin are highly ordered, and that these highly ordered lipids remain closely associated with cellular chromatin even through mitosis, when the nuclear envelope dissociates. The measure of lipid ordering utilized in this study, the ratio of Raman peak values at 2870 to 2850 cm−1, has been utilized as a measure of lipid packing for more than 40 years in a wide variety of experimental systems, from purified ceramide bilayers to erythrocyte ghosts to lens tissues from human eyes (Table 1). The values of the ratio found in the nucleus was close or equal to the theoretical maximum of 2.2 for pure, tightly packed lipids in the trans conformation, and phospholipid models suggest that lipids in the trans conformation form tightly packed gel phases, as opposed to lipids in the gauche conformation, which exist in liquid crystalline phases that are much more fluid, dynamic, and permeable. 30 The presence of a packed gel phase of lipids surrounding chromatin at all times, even during mitosis, suggests that interactions with chromatin may help stabilize the trans lipid conformations, which could easily change to gauche conformations by a simple rotation around carbon-carbon single bonds. It should also be noted that the Raman peaks used to visualize ordered lipid distributions occur at positions where there is no significant contribution from chromatin,34,41 and that other areas within the cells which contain significant amounts of protein have very low values for this ratio.
The persistence of the lipid pattern throughout mitosis, including stages at which the nuclear membrane is absent, argues that the pattern observed is not merely due to sequestration of lipids adjacent to chromatin by the nuclear membrane. These findings also raise experimentally addressable questions about how transcription factors and other chromatin-interacting proteins diffuse through the nucleus and access their chromatin binding sites in the presence of an ordered lipid gel, and the persistence of the lipid halo throughout mitosis.
The mechanism by which the highly ordered lipids interact with chromatin or chromatin-associated structures is unclear, although several studies document interactions between chromatin and lipid binding proteins. Interestingly, most of those reports involve proteins that bind inositol lipids, which have long been known to mediate signaling within the nucleus as well as within other cellular compartments.37,39 Phosphoinositides have been shown to mediate interactions between chromatin and other nonchromatin proteins. 42 The interactions of the E3 ubiquitin ligase ubiquitin-like with PHD and ring finger domains 1 (UHRF1) with histone H3 are allosterically modulated by phosphoinositol-5-phosphate. 43 The PDZ domain-containing signaling protein syntenin-2 was shown to interact with chromatin, which is significant not only because syntenin-2 binds phosphatidylinositol bisphosphate (PIP2) but because the PDZ domain is a phosphatidylinositol binding domain that is contained in a number of related signaling proteins, 44 thus any PDZ protein that interacts with chromatin could also stabilize interactions between chromatin and phosphoinositide-containing lipids. These results are also in agreement with our observation that the majority of the chromatin-associated highly ordered lipids identified by Raman spectral peaks were phosphatidylinositol, although other lipids may also be present within this population.
Evidence from a number of experimental approaches supports the role of chromatin-associated lipids in the regulation of gene expression. Early reports of chromatin-associated lipids suggested that lipids specifically localized near regions of newly transcribed hnRNA in decondensed chromatin, and that these regions were enriched in sphingomyelin and may help protect the newly synthesized hnRNA polymer. 20 This group later demonstrated the specific association of sphingomyelin with chromatin during liver regeneration, indicating a functional relationship with active chromatin. 21 Several reports have reported that phosphatidylserine is excluded from internal chromatin domains and interacts with chromatin only at the chromatin periphery45,46; in our studies the 733 cm−1 Raman peak defining phosphatidylserine was consistently close to background levels and was unsuitable for analysis (Ramamurthy, unpublished). Nuclear lipid microdomains have also been shown to be involved in vitamin D3-mediated transcriptional regulation. 47 A more mechanistic role was suggested recently when it was demonstrated that lipids can participate in the epigenetic regulation of chromatin function. 48
Of the cells used in these experiments, mitotic MCF-7 cells often displayed irregularly shaped nuclei and ordered lipid regions, more frequently following nocodazole treatment but also following selection using the mitotic shake-off approach. This is not surprising, as MCF-7 cells are reported to have a high degree of mitotic instability, and the irregular shapes of the nuclei and ordered lipid regions likely reflects the irregular distribution of the chromatin with which these lipids are associated. 49
It is important to note that no attempt was made in this report to confirm quantitative differences in lipid in cancer cells as has been previously reported. 19 Instead, this study focused on patterns of localization. At the beginning of these studies, it was thought that the lipid pattern would qualitatively vary with malignant potential, a hypothesis based on our previously reported biophysical studies of cancer cells. 50 In these studies, utilizing the Corning EPIC instrument (similar to surface plasmon resonance), different timing was observed in the molecular rearrangement recoveries near the cell membrane of these cell types, suggesting variations in intracellular viscosity which could be due to different lipid compositions or distributions. In the present study, however, no difference in lipid distributions was observed. Instead, an identical pattern of chromatin-associated highly ordered lipids was observed in all of the cell lines studied, including a putatively normal cell line. Thus, the current results suggest that this nuclear localization of highly ordered lipids may be a common property of human cells. One particular interest going forward is to further explore the mechanisms by which these ordered lipids influence nuclear activities, and the contributions of lipid packing and lipid composition to these effects. No existing studies have examined the potential effects of chromatin-associated lipids on DNA replication or mitosis, yet these data demonstrate that chromatin remains lipid-associated throughout these processes. It would also be of interest to explore whether changes in the ordered lipid regions are associated with any particular disease states. These studies revealed no large scale differences between ordered lipid distributions in the nuclei of normal cells and cancer cells of various metastatic capabilities, but future analysis using advanced computational comparisons may reveal more subtle yet statistically significant differences. Finally, it is possible that the association of lipids with nucleic acids was a fundamental occurrence in prebiotic evolution, 51 and these interactions may represent vestiges of associations that led to the formation of cellular life forms. Although most cellular lipids exist in well-defined membranes and organelles, Raman spectroscopic localization of the most highly ordered cellular lipids, as defined by the highest values of the ratio of Raman spectral peaks at 2870 and 2850 cm−1, demonstrates that the majority of highly ordered lipids exist within cell nuclei. These highly ordered lipids are present within cell nuclei throughout the cell cycle and appear to be associated with chromatin. Furthermore, these lipids remain associated with chromatin throughout mitosis and cytokinesis. These observations suggest additional roles for lipids in mammalian nuclear function.
Footnotes
Acknowledgements
The authors thank Dr. Katherine Lau for her assistance in this project, as well as Renishaw Inc. for technical expertise and support.
Competing Interests
The author(s) declared no potential conflicts of interest with respect to the research, authorship, and/or publication of this article.
Author Contributions
BR performed the majority of the data collection and analysis, performed tissue culture and other lab bench work, wrote the Methods section and edited the manuscript. SC was central in the experimental designs and performed significant editing of the manuscript. MC assisted with data acquisition and computational analysis. FDC performed data acquisition, partnered with SC as the central figures in experimental design, and was the primary author and editor of the manuscript. All authors have read and approved the final manuscript.
Funding
The author(s) received no financial support for the research, authorship, and/or publication of this article.