
Abstract
Summary
Previous studies on purified bovine rod outer segments (OS) disks pointed to Oxidative Phosphorylation (OXPHOS) as being the most likely mechanism involved in ATP production, as yet not fully understood, to support the first phototransduction steps. Bovine and murine rod OS disks, devoid of mitochondria, would house respiratory chain complexes I to IV and ATP synthase, similar to mitochondria. Zebrafish (Danio rerio) is a well-suited animal model to study vertebrate embryogenesis as well as the retina, morphologically and functionally similar to its human counterpart. The present article reports fluorescence and Transmission Electron Microscopy colocalization analyses of respiratory complexes I and IV and ATP synthase with zpr3, the rod OS marker, in adult and larval zebrafish retinas. MitoTracker Deep Red 633 staining and assays of complexes I and III–IV activity suggest that those proteins are active in OS. Results show that an extramitochondrial aerobic metabolism is active in the zebrafish OS at 4 and 10 days of larval development, as well as in adults, suggesting that it is probably maintained during embryogenesis. Data support the hypothesis of an extramitochondrial aerobic metabolism in the OS of zebrafish.
Introduction
In the vertebrate retina, photoreceptors carry out light capture through the visual pigment Rhodopsin (Rh), triggering phototransduction in the Outer Segment (OS). 1 The OS is an elongated stack of membrane disks, housing the proteins involved in phototransduction, 1 surrounded by the plasma membrane and connected to the Inner Segment (IS) by a cilium. Rods, associated with scotopic vision, are among the most metabolically active cells with a high rate of ATP consumption, coupled with a high anabolic demand due to the daily turnover of the OS. 2 Despite these needs, they are devoid of mitochondria, which in the rod are confined to the IS. Notably, phototransduction is known to be a high-energy demand process, in the face of a poor knowledge of its bioenergetics. Glycolysis 3 or diffusion of ATP and phosphocreatine from the IS have been considered,4–6 but these may not provide enough ready-to-use ATP to support phototransduction. 7 In recent years, our new findings on rod metabolism demonstrated the presence of an extramitochondrial aerobic metabolism in the mammalian rod OS, which would better account for its light-stimulated ATP need.8,9 Proteomic and biochemical analysis showed that bovine isolated purified rod disks conduct Oxidative phosphorylation (OXPHOS), housing active electron transfer chain (ETC) complexes I to IV and F0F1-ATP synthase (ATP synthase).8,10 Moreover, the complete glucose oxidation occurs in the mammalian rod OS cytosol, thanks to the expression of glycolytic and tricarboxylic acid (TCA) cycle enzymes, which are, in fact, required for aerobic respiration. 9
Zebrafish (D. rerio) has long been recognized as a useful model for the study of the human retina, as well as ocular development and disease.11–14 Zebrafish and human retinas are quite comparable from the morphological and functional point of view. Like the human retina, zebrafish retinal cell bodies are organized in three laminae, the ganglion cell layer (GCL), inner nuclear layer (INL), and outer nuclear layer (ONL). 15 Zebrafish retina consists of one type of rod photoreceptor and four distinct classes of cones sensitive to ultraviolet, short, medium, and long wavelength of light, respectively. Similar to other vertebrate retinas, rod and cone OSs display distinct morphologies, conical in cones, and rod-like in rods, and contain the components of the phototransduction apparatus, including opsins. Zebrafish is also a well-suited animal model to study vertebrate embryogenesis,16–18 due to the transparency of larval stages and the fast external embryonic development. In zebrafish, the photoreceptor OS develops at 54 hpf (hours postfertilization) with the appearance of opsin expression. 15
The aim of this study was to assess the presence of an extramitochondrial OXPHOS in the zebrafish rod OS by immunostaining of retinal sections and to test the timing of the functional expression of the ETC complexes and ATP synthase, at different developmental stages.
Overall, the results confirm that zebrafish retina, like its mammalian counterpart, expresses functional ETC and ATP synthase, suggesting its suitability as a model where future studies may address the mechanism involved in the transfer of the OXPHOS complexes from the IS mitochondria to the OS.
Materials and Methods
Zebrafish Maintenance
Raising, maintaining, and spawning of adult zebrafish (D. rerio) were performed according to standard methods. In particular, zebrafish were maintained in water conductivity of 500–530 Ω/cm at a water temperature of 28.5C, pH 7.0–7.5 under a constant 14/10 light/dark photoperiod, and fed three times a day with newly hatched brine shrimp. Embryos were obtained via natural mating and raised at 28.5C in E3 Medium. For histochemistry, some embryos were immersed in 0.2 mM N-phenylthiourea (PTU) since 20 hpf to inhibit melanin production in retinal pigmented epithelium.
Electrophoresis, Semiquantitative Western Blot (WB), and Quantification
Eyes and hearts were excised from zebrafish adults. Both retinas and hearts were isolated and homogenized in 0.25 M sucrose, 5 mM HEPES pH 7.2, 0.15 M KCl, 1 mM EDTA, protease inhibitor cocktail, and 0.060 mg/ml ampicillin, for WB analysis. Denaturing electrophoresis (sodium dodecyl sulfate polyacrylamide [SDS-PAGE]) was performed using a Laemmli protocol 19 on gradient of 4.20% acrylamide gels (SDS-PAGE). For each lane, 25 µg of total protein was loaded. After blot, nitrocellulose membrane was labeled with the following primary antibodies: rabbit polyclonal antibody against ND1 subunit of NADH-ubiquinone oxidoreductase (ETC complex I; dilution 1:100; Abcam, Cambridge, UK) or rabbit polyclonal antibody against β subunit of FoF1-ATP synthase (dilution 1:400; Sigma-Aldrich; St. Louis, MO). Bands were visualized by chemiluminescence with Immun-Star Western C kit (Bio-Rad Lab; Hercules, CA), and images were acquired with the molecular imager ChemiDoc XRS+ System (Bio-Rad), which enables direct digital visualization of chemiluminescent WB allowing quantitation of bands. Protein Molecular Weight (MW) markers were from Bio-Rad. Quantitative densitometry was performed using the ChemiDoc XRS þ System software, as the ratio of the Relative Optical Density (R.O.D.) of a chemiluminescent band with R.O.D. to that of the protein pattern in the same lane, as stained with Blue Silver Coomassie.
Immunohystochemical Analysis
Embryos at different developmental stages (4 and 10 days) were collected and fixed overnight (o.n.) in 4% paraformaldehyde (PFA) for immunohistochemical analysis. Before fixation, animals (adults or larvae) were euthanized in 500 mg/L Tricaine (Sigma-Aldrich). Eyes from euthanized zebrafish adults were immediately dissected on ice and fixed for immunohistochemistry. Eye sections were obtained by transversally cutting adult eyes and larvae. All procedures were carried out according to the Italian Ministry of Health authorization (n. Prot. DGSAF0009769-2015). Then, eyes were washed in PBS, sequentially cryoprotected in 30% sucrose in PBS and embedded in Tissue-Tek OCT (Electron Microscopy Sciences; Fort Washington, PA). Sections were preincubated in Blocking Buffer (BB) containing 10% normal goat serum, 0.1% Triton X-100, and PBS, then incubated o.n. at 4C in a mixture of primary antibodies appropriately diluted in BB containing polyclonal rabbit anti-ND1 (dilution 1:100, No. ab181848; Abcam) with mouse anti-zpr3 (dilution 1:200; purchased from ZIRC [Zebrafish International Resource Center]; Eugene, OR); polyclonal rabbit anti-ATP synthase (dilution 1:400, No. HPA001528; Sigma-Aldrich) with mouse anti-zpr3. Anti-zpr3 is a monoclonal antibody against rod opsins that was developed by ZIRC, University of Oregon, and is widely used as a rod photoreceptor marker in zebrafish retinas.20–22
Sections were washed several times in PBS, and incubated in a mixture of two secondary antibodies: Alexa-488-tagged anti-rabbit and/or Alexa-594-tagged anti-mouse IgG antibody (Molecular Probes; Eugene, OR; dilution 1:800 in BB). Incubations were carried out for 3 hr at room temperature. Controls were performed by omitting primary antibodies. Omission of primary antibodies resulted in no immunofluorescence (see Supplementary Material). Images were taken with an Olympus IX71 microscope (Olympus Italia Srl; Milan, Italy) equipped with a Soft Imaging System chilled color digital camera ColorView II (Soft Imaging System GmbH; Münster, Germany), and images were processed using the analySIS software package (Soft Imaging System GmbH).
Transmission Electron Microscopy
Embryos at 4 days of development and eyes immediately dissected from zebrafish adults were collected and fixed o.n. in 4% paraformaldehyde and 0.1% glutaraldehyde in PBS buffer solution. Before fixation, animals (adults or larvae) were euthanized in 500 mg/L Tricaine (Sigma-Aldrich). After fixation (1.5 hr), retinas were removed from the eye capsule, cut into small pieces, washed overnight with 50 mM NH4Cl, dehydrated, and embedded in LR White Resin 23 and polymerized at 58C. Ultrathin sections were placed on Formvar-coated nickel grids and used the next day for immunogold labeling.
For immunostaining of sections, the postembedding immunogold method was applied. Sections were treated with blocking solution (1% BSA, 0.1% Tween 20, PBS 1×), then incubated o.n. at 4C with the previously mentioned antibodies: mouse anti-zpr3 (diluted 1:200) and rabbit polyclonal anti-ND1 subunit of complex I antibody (Ab; diluted 1:50) or polyclonal rabbit anti-β subunit of ATP synthase (dilution 1:400; Sigma-Aldrich) or polyclonal anti-subunit 1 of complex IV (COX1; diluted 1:50, No. PA5-26688; Thermo Fisher Scientific; Rockford, IL). Ab binding was detected using secondary anti-rabbit IgG (British BioCell International; diluted 1:100) coupled to gold particles (25 nm), and goat anti-mouse IgG (British BioCell International, Cardiff, UK; diluted 1:100) coupled to gold particles (5 nm). Sections were analyzed at an FEI Tecnai G12 transmission electron microscope operating at 100 kV. Images were acquired with OSIS Veleta cameras, collected, and typeset in Corel Draw X4. Controls were performed by omitting primary Ab, which resulted in absence of cross-reactivity (see Supplementary Material).
Histochemical Reactions for ETC Activity
For histochemical reactions, 4-day-old larvae developed in the presence or absence of PTU, which inhibits the biosynthesis of melanin in the retinal pigment epithelium, were cryoprotected for 1 hr in 30% sucrose in PBS and then embedded in Tissue-Tek OCT (Electron Microscopy Sciences), and then cut transversally by cryostat Frigocut 2800E (Reichert-Jung; Germany) at 15 µm thickness.
For ETC complex I activity, eye sections were incubated in 0.8 mM NADH, 1.3 mM Nitro Blue Tetrazolium (NBT) in PBS, as previously reported. 24 Activity of ETC complex IV was assayed through ETC III activity incubating eye sections with 0.75 mg/ml cytochrome c (instead of reduced cytochrome c for only ETC IV activity detection), 50 mM phosphate (pH 7.4), 0.75 mg/ml 3,3′diaminobenzidine (DAB). Histochemical reactions were performed at 37C in the dark for 1–2 hr and checked every 30 min. When the presence of ETC inhibitors was required, reactions were preincubated for 10 min at 37C with 10 µM Rotenone or 40 µM Antimycin A for ETC complex I and complex IV, respectively. Inhibitors were also added to the reaction mixture at the same concentrations. Incubation was stopped in 0.1 M phosphate buffer once clear differentiation between highly reactive and nonreactive portions could be discerned. To test the specificity of the reactions, eye sections were incubated with reaction mixtures without substrates (i.e., without NADH for complex I activity or cytochrome c for complex IV assay).
MitoTracker Deep Red 633 Staining of Larvae or Adult Zebrafish Eyes
To detect actively respiring membranes, the fluorescent dye MitoTracker Deep Red 633 (absorption/emission maxima 644/665 nm; Thermo Fisher Scientific; Waltham, MA) was used. Eyes excised from zebrafish adult or 4-day larvae developmental stages were immersed for 24 hr in a staining solution containing 500 nM MitoTracker Deep Red 633, glucose 2 mM and PBS, and then fixed o.n. in 4% paraformaldehyde (PAF). Samples were cryoprotected in 30% sucrose in PBS and embedded in Tissue-Tek OCT (Electron Microscopy Sciences). They were cut by a cryostat Frigocut 2800E (Reichert-Jung; Germany) at 12 µm thickness. Images were taken with an Olympus IX71 microscope (Olympus Italia Srl) equipped with a Soft Imaging System chilled color digital camera ColorView II (Soft Imaging System GmbH), and images were processed using the analySIS software package (Soft Imaging System GmbH).
Results
Considering our previous data on bovine and murine rod OS,8,9,24,25 immunohistochemical analysis on cryosections of adult eye and larval zebrafish were conducted to verify if OXPHOS proteins were expressed in the adult rod OS, and in positive case, to detect at which larval developmental stage these proteins became detectable.
First, the cross-reactivity of the anti-ND1 subunit of complex I and anti-β subunit of ATP synthase antibody was characterized in zebrafish by WB analysis (see Supplementary Fig. 1). Such analysis was conducted on two zebrafish samples, retinal and heart homogenates. Panels A and B of Supplementary Fig. 1 report a chemiluminescent signal at about 36 kDa using anti-ND1 antibody and at about 56 kDa using anti-ATP synthase antibody in both zebrafish retinal (lane 1) and heart (lane 2) homogenate. Data show a good cross-reactivity of the cited antibodies in zebrafish samples, confirming their specificity for mitochondrial proteins, being heart homogenate enriched in mitochondria. The same applies to zebrafish retinal samples.
To avoid the risk of contamination and also for intrinsic procedure difficulties, here intact eye or whole larval sections were utilized. Figure 1 shows a co-localization of zpr3, a marker of rod OS, with the ND1 subunit of the mitochondrial respiratory complex I in adult eye and larvae (4 and 10 days) sections. In all samples, merged images show a good level of colocalization (yellow signal) in rod OS between zp3 (red signal)/ND1 proteins (green signal). Staining is also present in distinct dots in the rod and OS between the nuclei of the ONL, due to the presence of the IS. ND1 staining is also seen in the mitochondria of the outer plexiform layer (OPL; Fig. 1, Panel F). Double immunostaining was also performed in adult and larval (4 and 10 days) eye sections, using antibodies against zpr3 (red signal) and against β subunit of ATP synthase (green signal), as reported in Fig. 2. Data show a colocalization of zpr3/ATP synthase. In controls, experiments were performed omitting primary Ab (see Supplementary Fig. 2).
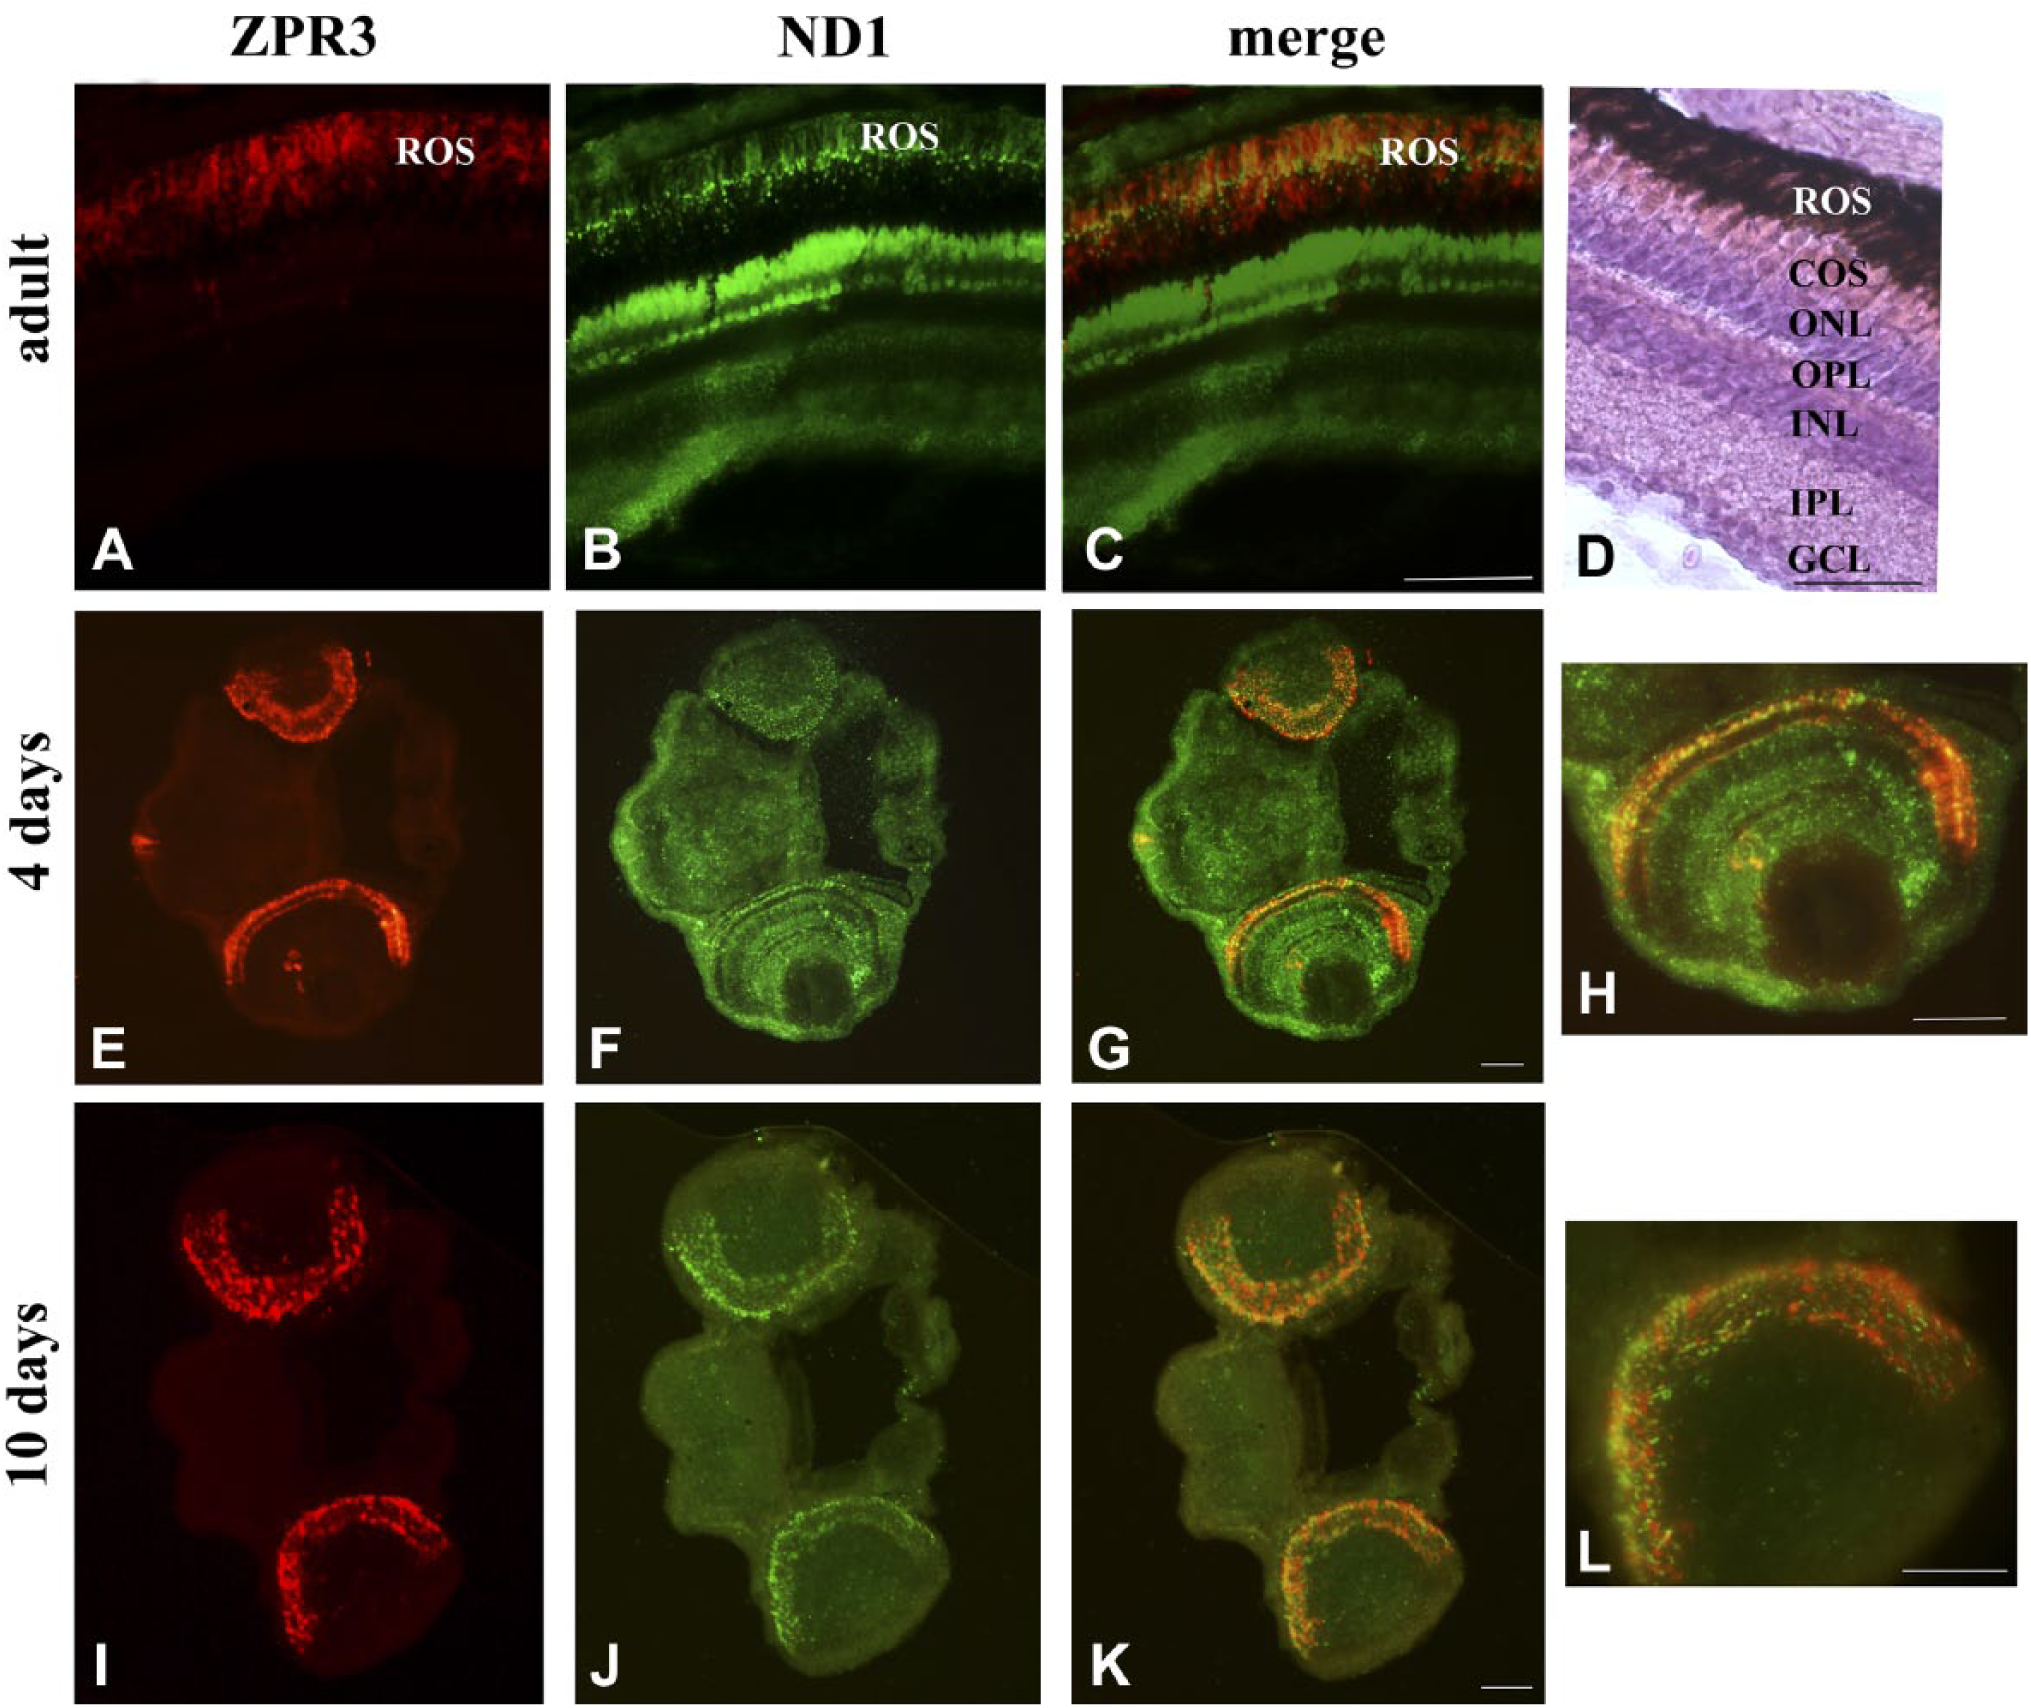
ND1 protein expression in ROS of retinal sections from zebrafish adults and larvae of 4 and 10 days. A, E, I/B, F, J: zpr3/ND1 immunofluorescence signal in adult and larvae longitudinal sections of zebrafish retina. C, G, K: Colocalization of zpr3 (red) and ND1 (green) labeling in adults (merged image of A and B), 4 days larvae (merged image of E and F), and 10 days larvae (merged image of I and J). The colocalization is visible at level of ROS. (D) Adult zebrafish retina stained with H&E. Scale bars = 50 µm. Abbreviations: ROS, rod outer segment; COS, cone outer segment; ONL, outer nuclear layer; OPL, outer plexiform layer; INL, inner nuclear layer; IPL, inner plexiform layer; GCL, ganglion cell layer.

ATP synthase protein expression in ROS of retinal sections from zebrafish adults and larvae of 4 and 10 days. A, D, G/B, E, H: zpr3/ATP synthase immunofluorescence labeling in adult and larvae longitudinal sections of zebrafish retina. C, F, I: Colocalization of zpr3 (red) and ND1 (green) labeling in adults (merged image of A and B), 4 days larvae (merged image of D and E), and 10 days larvae (merged image of G and H) in ROS. Scale bars = 50 µm. Abbreviations: ATP synthase, FoF1-ATP synthase; ROS, rod outer segment.
To improve the resolution of colocalization experiments, immunogold Transmission Electron Microscopy (TEM) analysis was performed on retinal sections from 4 dpf (days postfertilization) and adult zebrafish, using anti-zpr3 antibody (rod OS opsin marker) and anti-ND1 subunit of complex I or anti-subunit I of complex IV (COX1) or anti-beta-subunit of ATP synthase. Data (Figs. 3 and 4) confirmed the presence of complexes I, IV, and V (ATP synthase) in the rod OS as well as in the IS mitochondria, considered as a positive control. In controls, experiments were performed omitting primary Ab (see Supplementary Fig. 3).
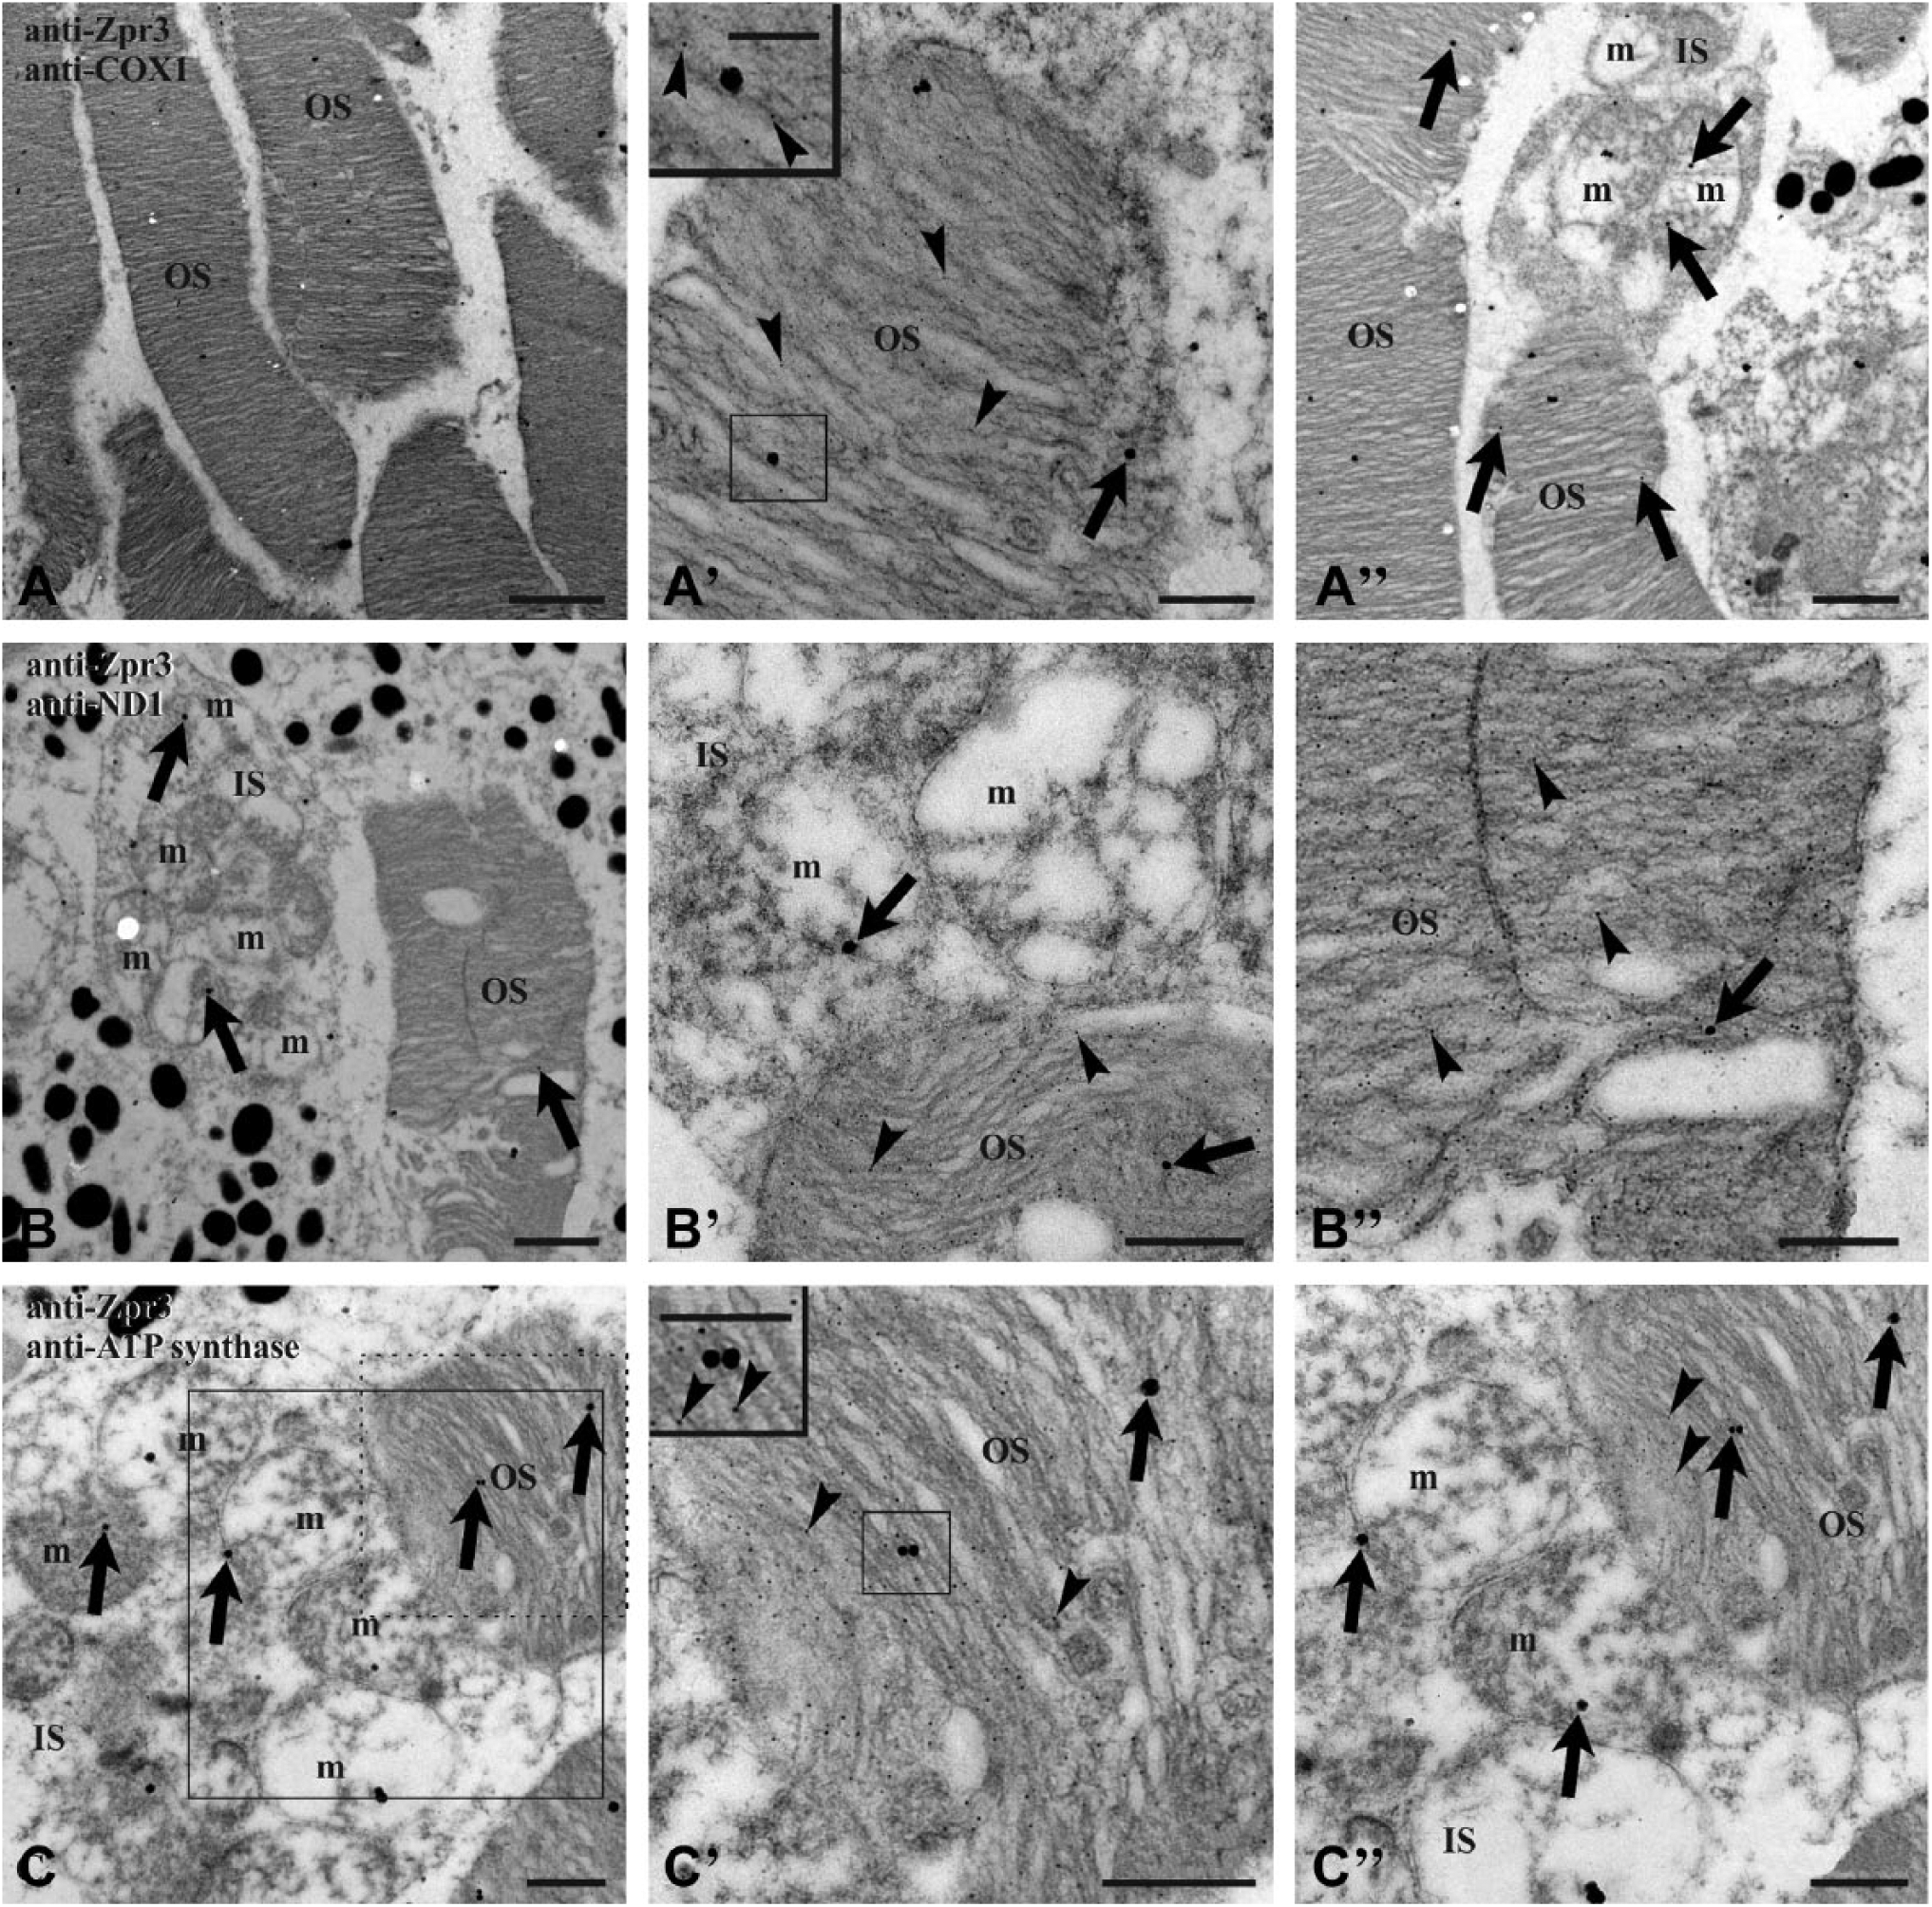
TEM on zebrafish adult retinal section. Zebrafish retina double labeled with antibodies anti-zpr3 (small, 5 nm-width gold particles; arrowheads) and anti COX1 (A–A″), anti ND1 (B–B″), and anti-subunit of ATP synthase (C–C″), respectively (large, 25 nm-width gold particles; arrows). Squared area in C is enlarged in C″, to show a detail of mitochondria expressing the subunit of ATP synthase; dotted d area in C is enlarged in C′, characterized by colocalization of zpr3 signal and ATP synthase signal in OS. Controls were performed by omitting primary Ab, which resulted in absence of cross-reactivity (see Supplementary Fig. 3). Scale bar = 2 µm in Panel A, 1 µm in Panels A″ and B, and 500 nm in Panels A′, B′, B″, C, C′, and C″. In the inset of Panels A′ and C″, scale bar = 250 nm. Abbreviations: TEM, Transmission Electron Microscopy; ATP synthase, FoF1-ATP synthase; IS, rod inner segment; m, mitochondrion; OS, rod outer segment; Ab, antibodies.
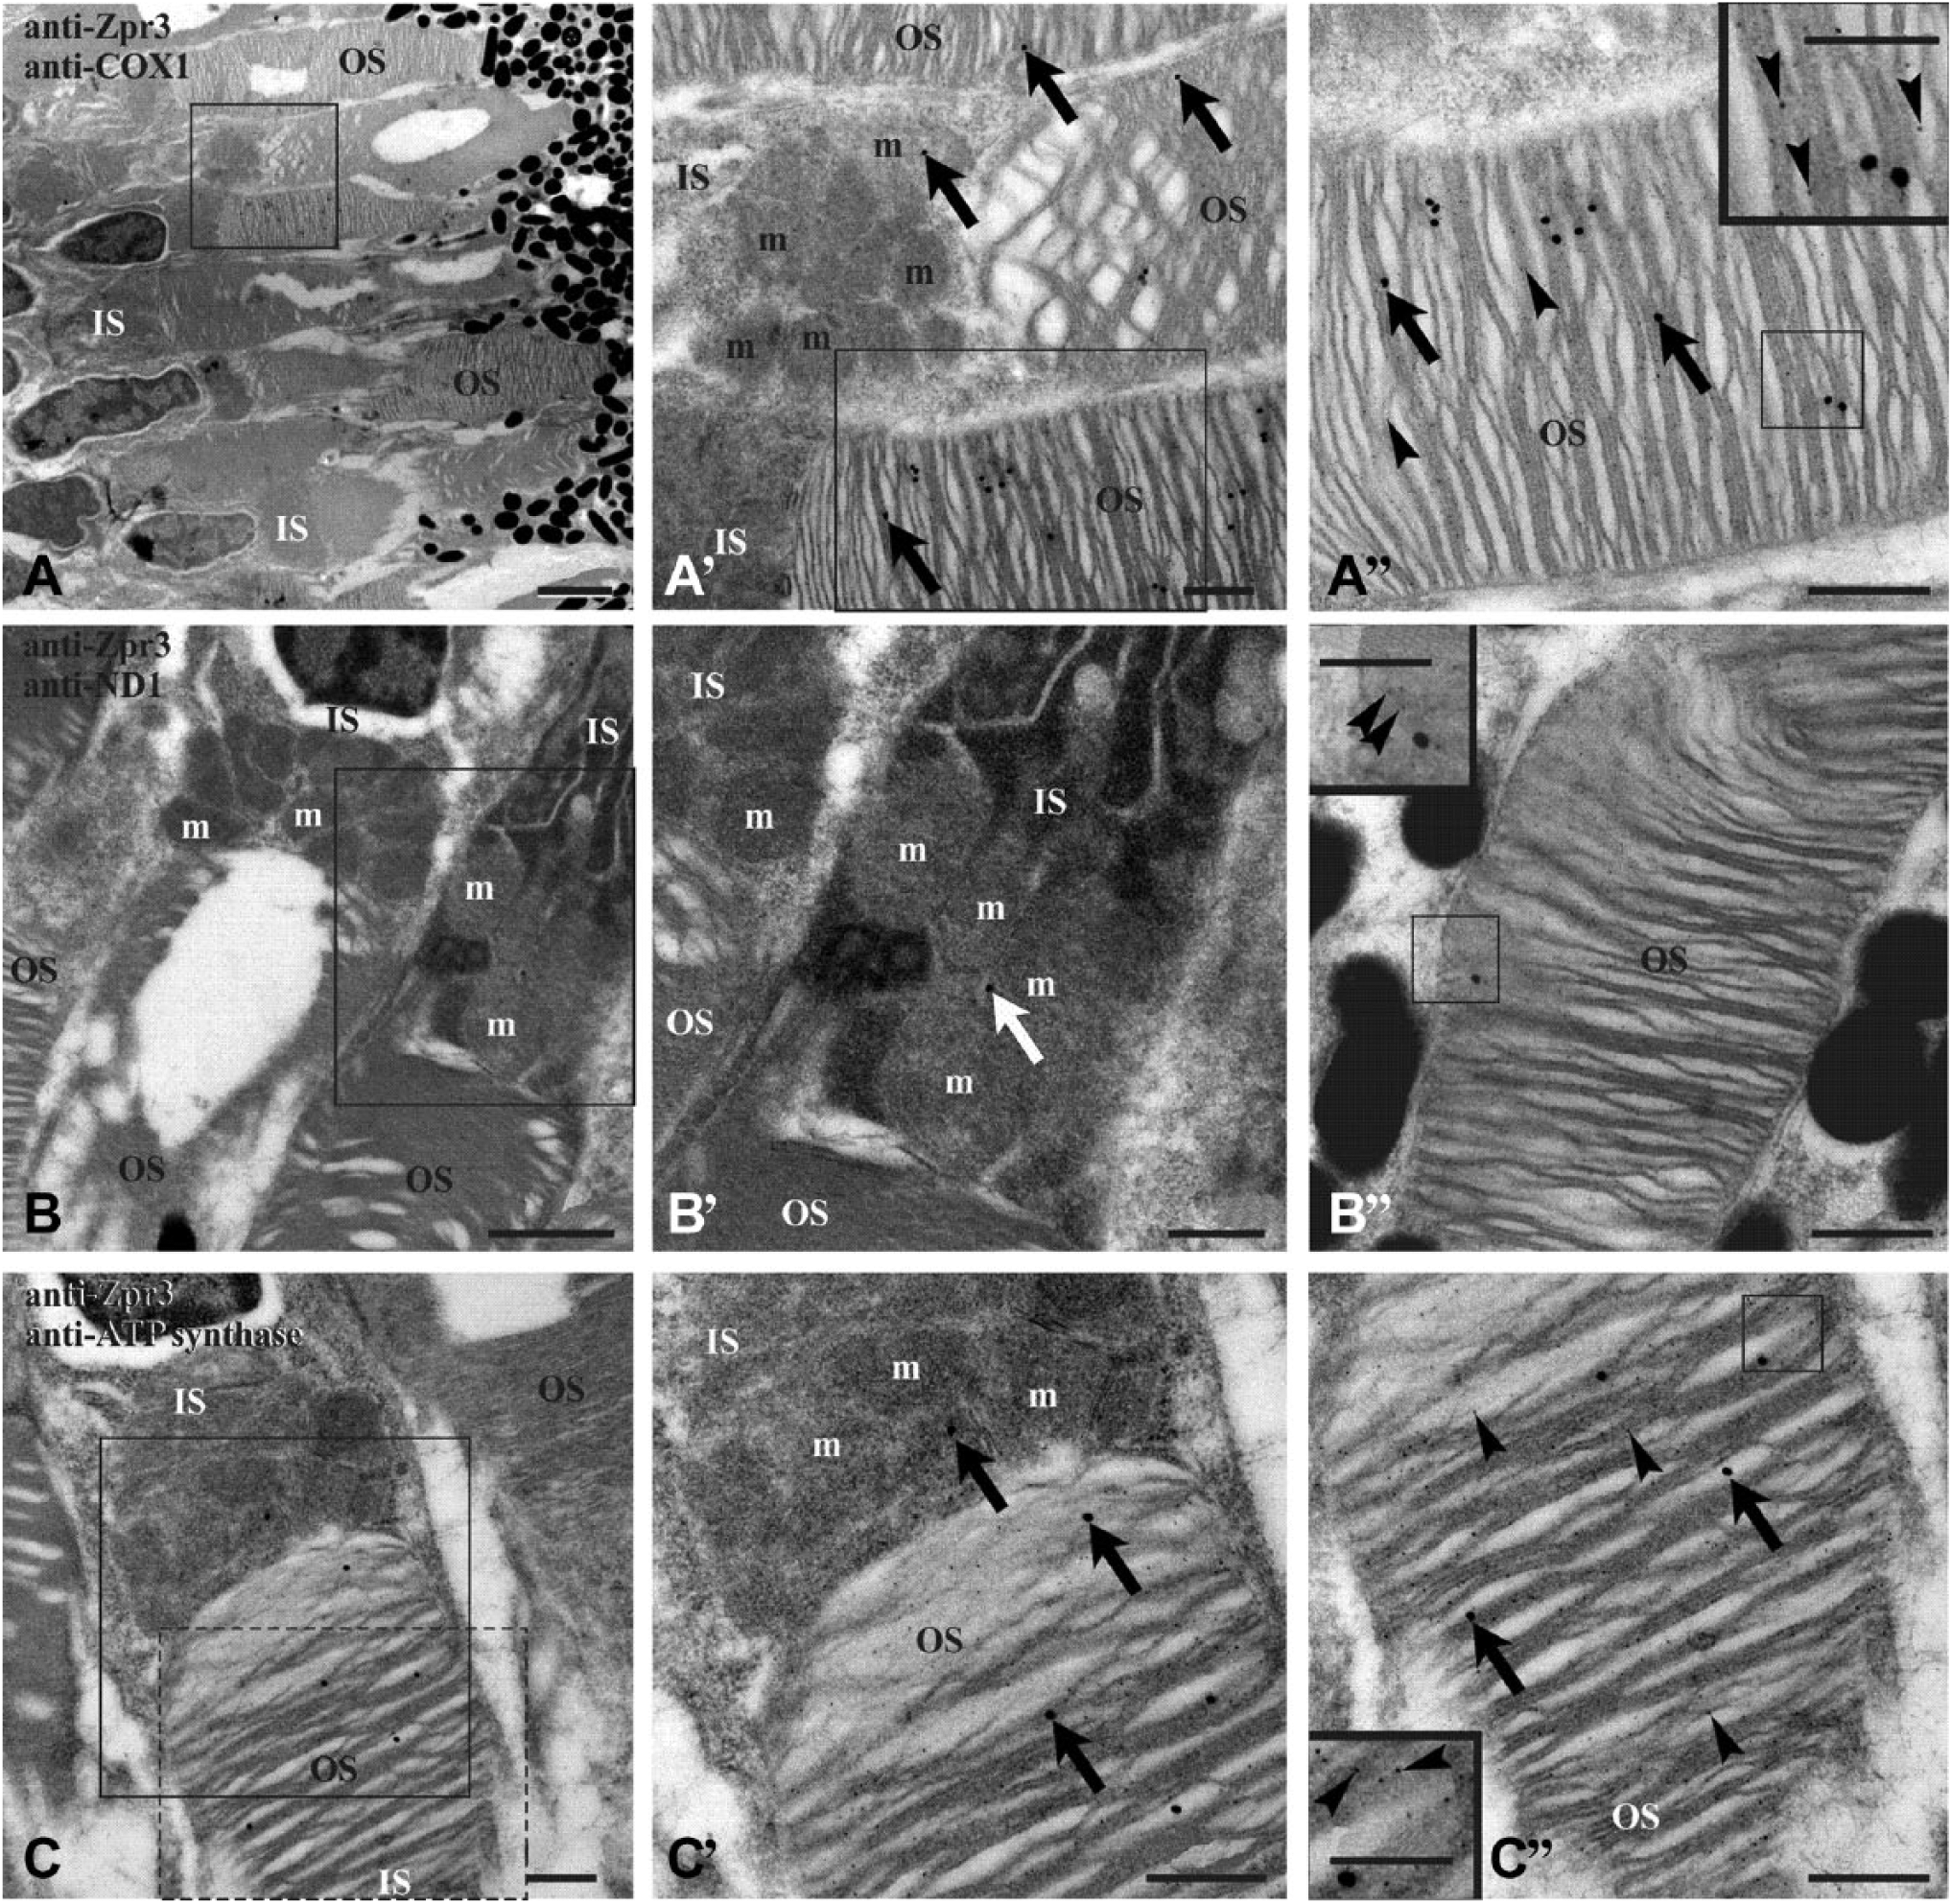
TEM on retina of embryo (4 dpf) zebrafish. Zebrafish retina double labeled with antibodies anti-zpr3 (small, 5 nm-width gold particles; arrowheads) and anti-COX1 (A–A″), anti-ND1 (B–B″), and anti-subunit of ATP synthase (C–C″), respectively (large, 25 nm-width gold particles; arrows). Squared area in A is enlarged in A′, whereas squared area in A′ is enlarged in A″. Squared area in B is represented in B′. Squared area in C is enlarged in C′; dotted d area in C is represented in C″. Controls were performed by omitting primary Ab, which resulted in absence of cross-reactivity (see Supplementary Fig. 3). Scale bar = 2 µm in Panel A, 1 µm in Panel B, and 500 nm in Panels A′, A″, B′, B″, C, C′, and C″. In the inset of Panels A″, B″, and C″, scale bar = 250 nm. Abbreviations: TEM, Transmission Electron Microscopy; dpf, days postfertilization; ATP synthase, FoF1-ATP synthase; IS, rod inner segment; m, mitochondrion; OS, rod outer segment.
The mere presence of the OXPHOS proteins in the OS may not mean that these are functional, therefore, we conducted histochemical assays to detect the activity of complex I and complex III–IV on eye transversal sections obtained from 4-day-old larvae.
Activities of complexes I and III–IV could be clearly detected in mitochondria of ganglion cells in the inner plexiform layer (IPL), as well as in rod OS layer (Fig. 5, Panels A and C). To test the specificity of the reactions, activity of ETC complex I and complex III–IV was assayed in the presence of their specific inhibitors, that is, Rotenone and Antimycin A, respectively (Fig. 5, Panels B and D). Violet color in Fig. 5 Panels A and B represents the product of the reaction of NBT reduction to NBT-formazan, with parallel oxidation of NADH by complex I. Brown precipitate in Fig. 5 (Panels C and D) represents the complex IV activity coupled with the activity of complex III. In the presence of cytochrome c, complex III reduces it that is oxidized by complex IV in parallel with DAB, producing a brown precipitate. By densitometric analysis (Fig. 5, Panel E), Rotenone-inhibited ETC complex I activity of about 56% in OS and of about 51% in IPL (as positive control being enriched in mitochondria). ETC complex IV activity decreased by about 30% in the OS and 50% in the IPL after Antimycin A treatment. No activity was detected in negative control samples (i.e., retinal sections incubated with reaction mixtures deprived of substrates, that is, NADH for ETC complex I activity or cytochrome c for ETC complex III–IV activity; see Supplementary Fig. 4).
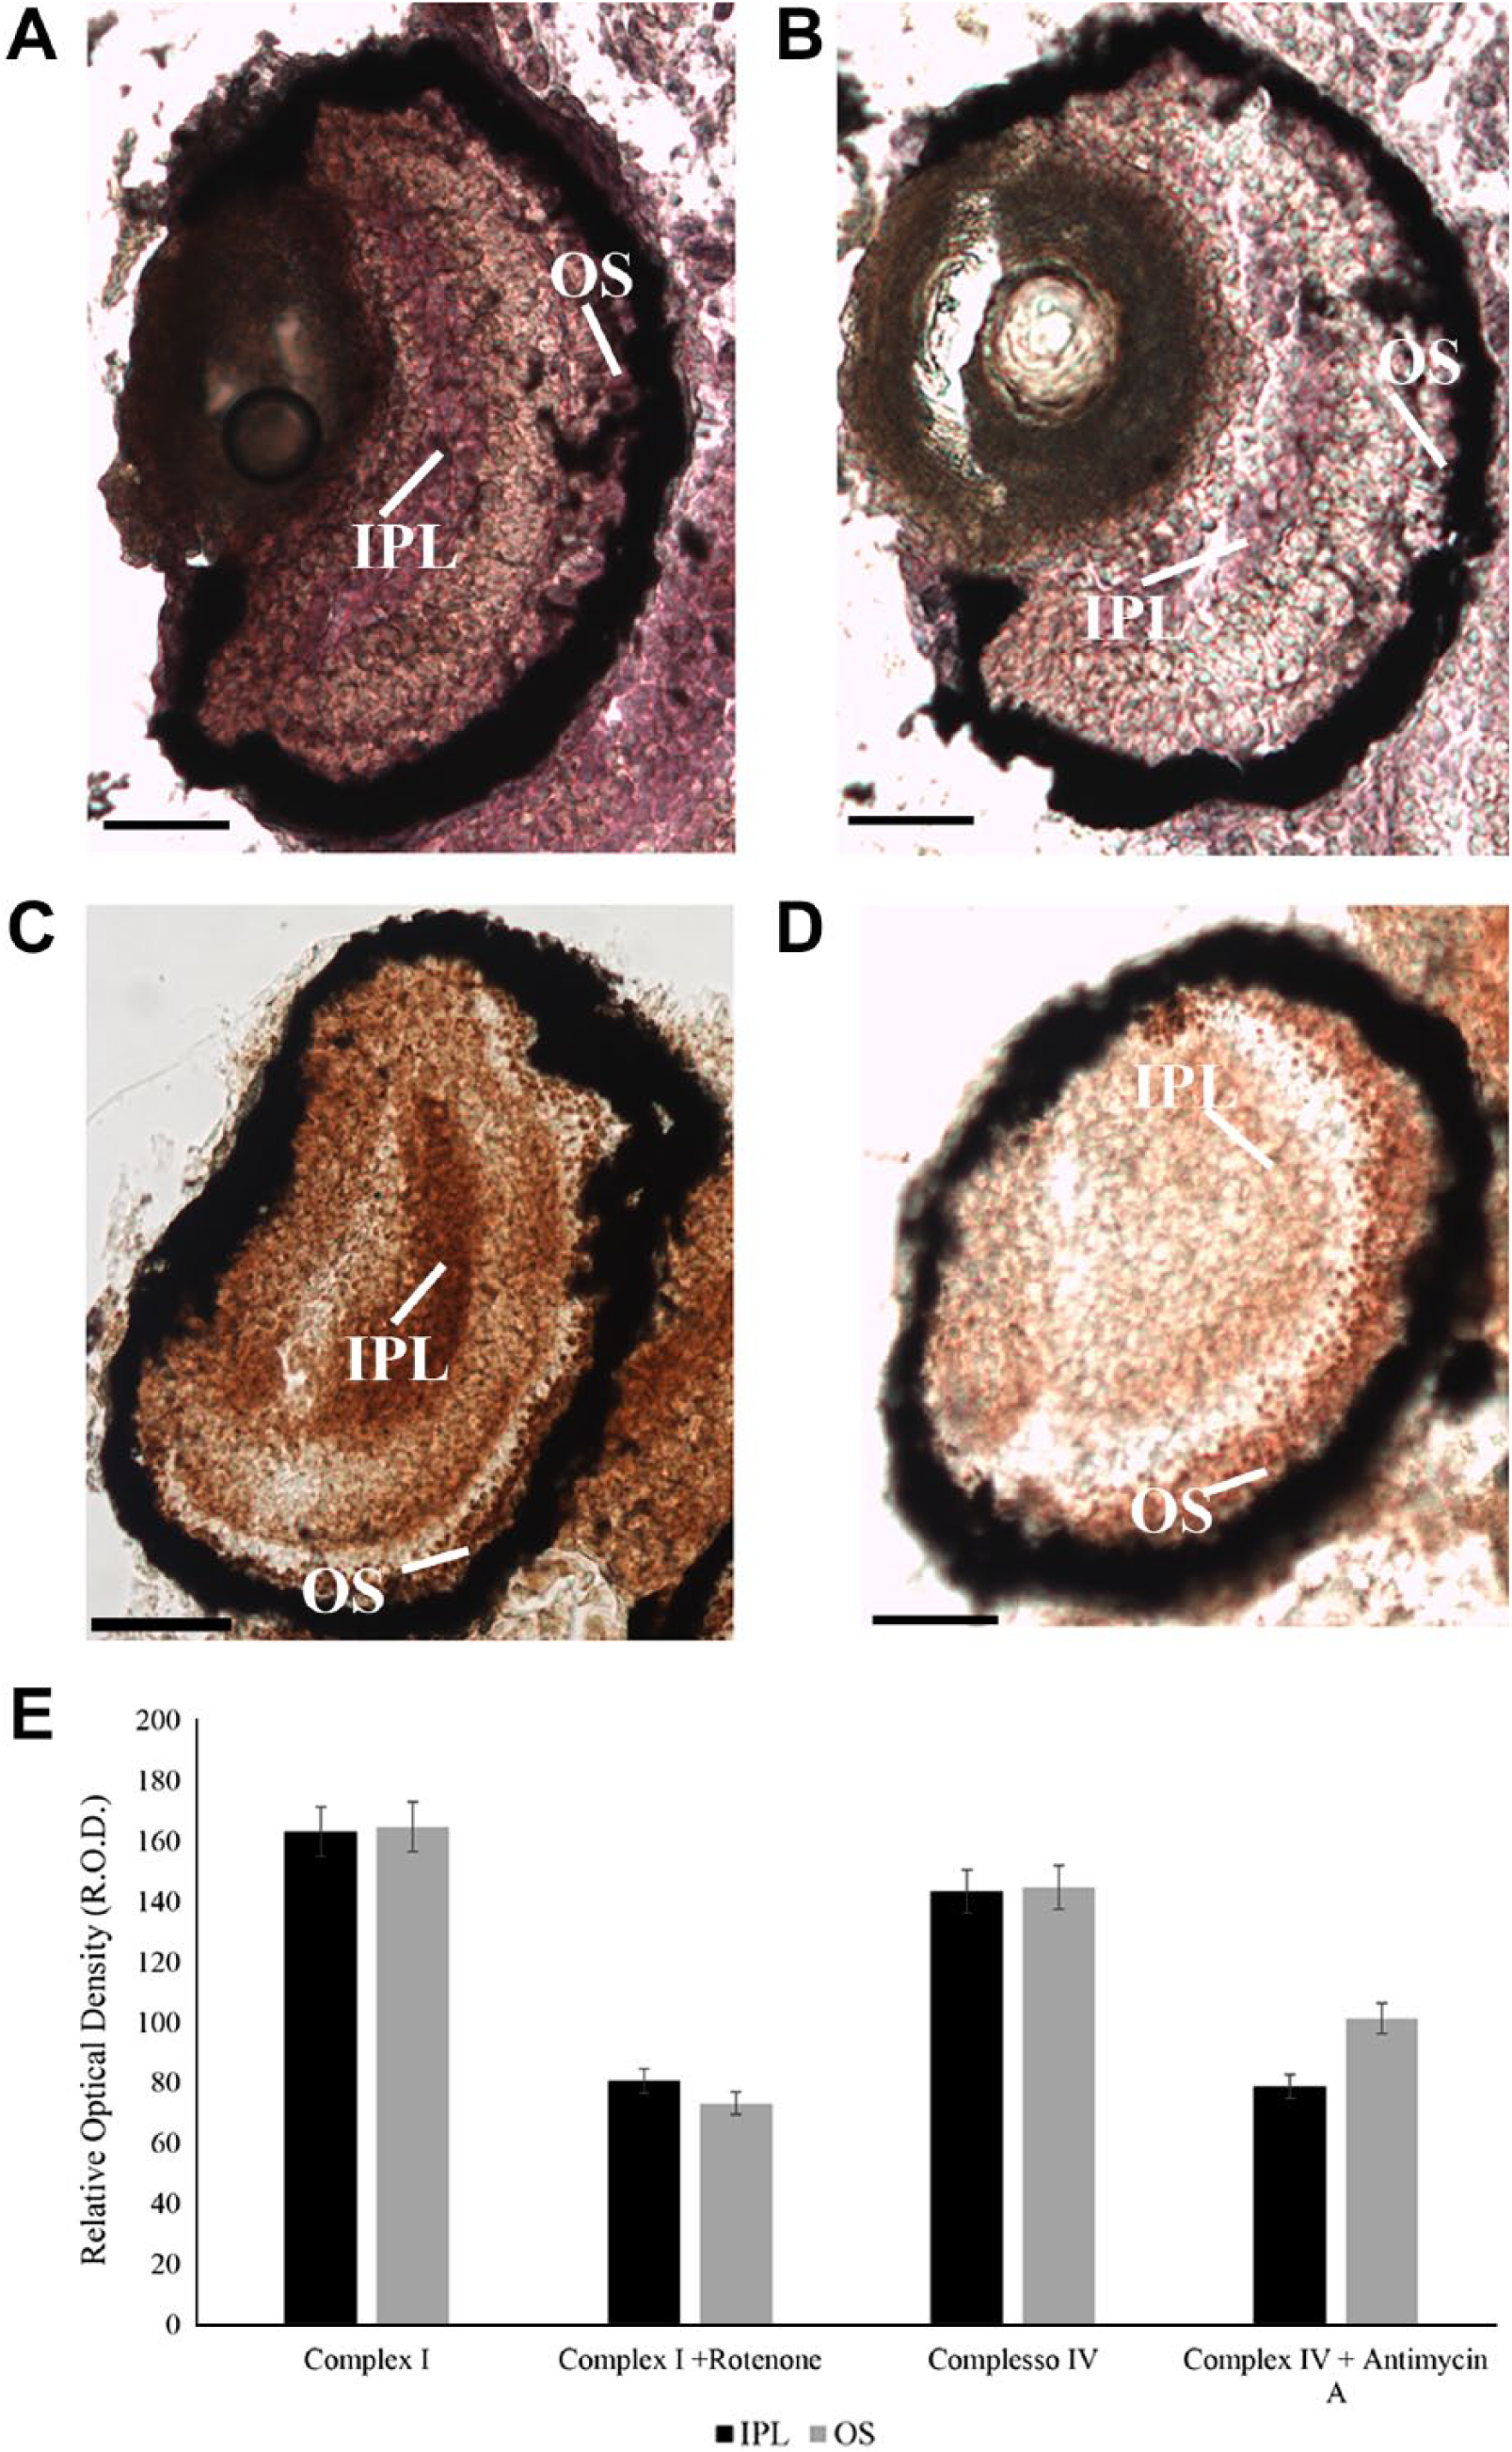
Activity of OXPHOS complexes I and II–IV on unfixed 4 days zebrafish larval eye sections in the presence or absence of ETC inhibitors. (A, B) Violet signal represents complex I activity due to the reduction of NBT in NBT-formazan in presence of NADH in zebrafish larvae in the presence (B) and absence (A) of Rotenone, ETC complex I inhibitor. (C, D) Brown precipitate represents complex III–IV activity due to the DAB oxidation in the presence of cytochrome c; in zebrafish larvae grown in absence (C) and in the presence (D) of Antimycin A, ETC complex III inhibitor. (D) Histogram reported densitometric analysis of ETC complexes I and II–IV activity staining in OS and OPL. Data are expressed as R.O.D. measures using Image J software. Scale bars = 50 µm. Abbreviations: OXPHOS, oxidative phosphorylation; DAB, 3,3′diaminobenzidine; ETC, electron transfer chain; NBT, Nitro Blue Tetrazolium; OS, outer segments; OPL, outer plexiform layer; R.O.D., Relative Optical Density; ROS, rod outer segment; ONL, outer nuclear layer; IPL, inner plexiform layer.
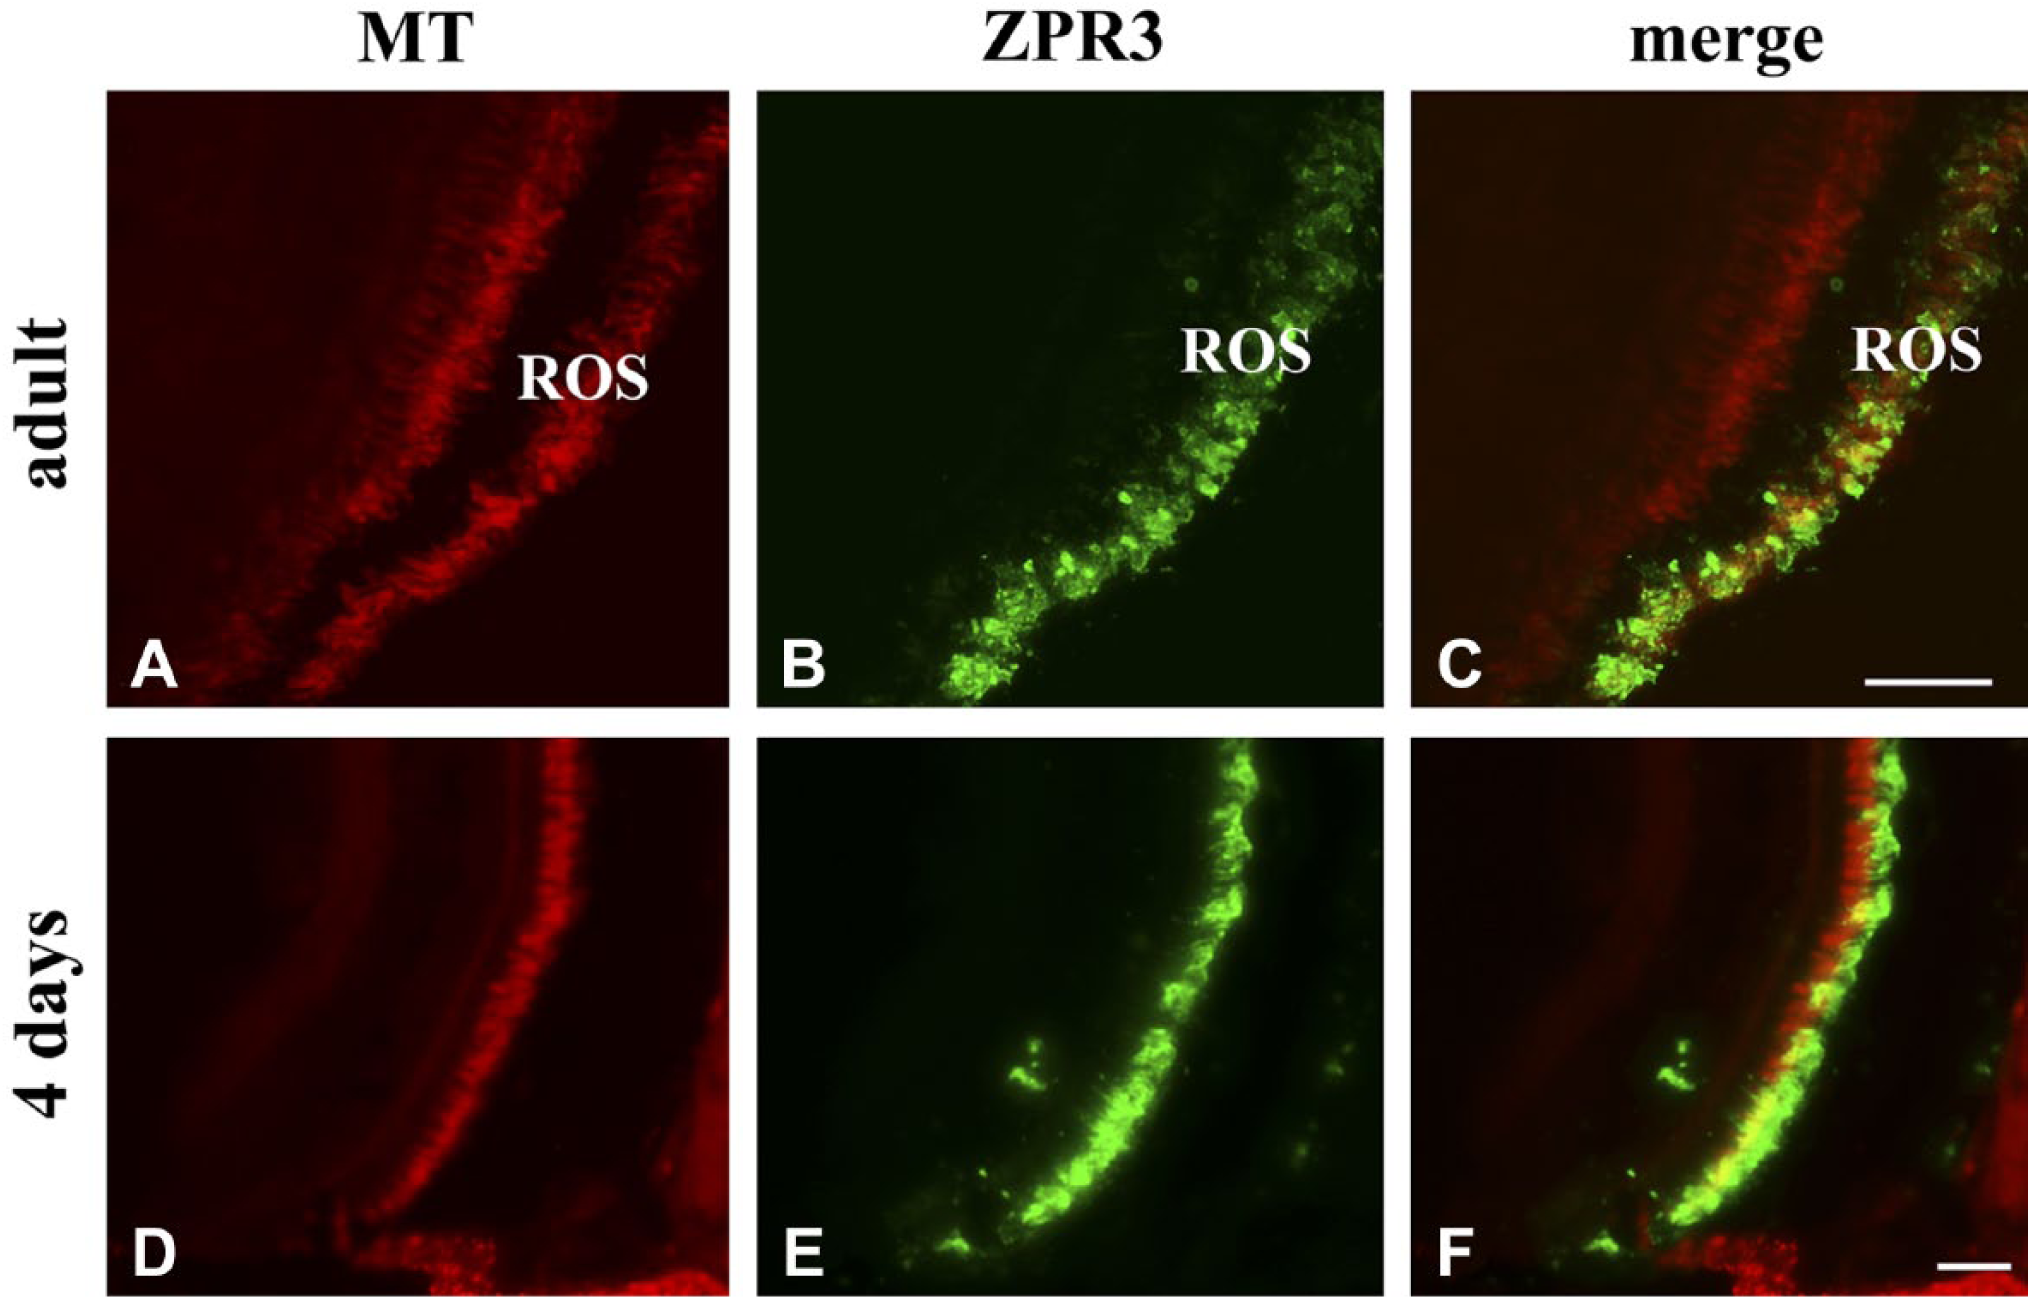
MT and zpr3 staining in adult and 4 days larvae (A, B, D, E). Overlay in C and F shows a clear colocalization of MT with zpr3 in ROS. Note the presence of MT also in the ONL. Scale bars = 50 µm. Abbreviations: MT, MitoTracker Deep Red 633; ROS, rod outer segment; ONL, outer nuclear layer.
To verify whether the whole OXPHOS pathway is active, zebrafish adult eye and 4-day-old larvae were incubated for 24 hr with MitoTracker Deep Red 633 (MT), and then sections were processed by immunostaining with Ab against zpr3 (Fig. 6). MT is a permeant fluorescent vital dye that passively diffuses across membranes, accumulating in actively respiring membranes due to its reduction dependent on the presence of an electron transport. 26 Figure 6 shows that in adult and 4-day-old larval eye sections, MT red fluorescence appears distributed on the rod, and colocalized with the zpr3 signal. Data minimally mean that the milieu in the OS is oxidative.
Discussion
In recent years, new findings about mammalian rod OS metabolism suggest that, although devoid of mitochondria, these aerobically produce ATP, expressing functional mitochondrial OXPHOS proteins,8,10,27 a phenomenon we have called extramitochondrial aerobic metabolism. This would be accomplished through the functioning of ETC and ATP synthase.8,9,24,25,27,28 The present results suggest the occurrence of an active OXPHOS also in zebrafish (D. rerio) rod OS. Animal models are needed to explore the mechanism involved in the transfer of OXPHOS proteins from the IS mitochondria to the OS. Here, the use of the zebrafish retina as a model allowed us to follow the expression of the OXPHOS proteins during embryogenesis, thanks to the larval transparency. This study examined the larval expression of OXPHOS proteins starting at 4 dpf, because only at this time point, zpr3, the rod OS marker, is expressed. Results pointed out that the OXPHOS was present and functional at 4- and 10-day-old larval stages as well as in adult zebrafish. This suggests that the OXPHOS pathway, that likely supplies the chemical energy, is a feature necessary for the functioning of the rod OS since the beginning of its buildup.
In vertebrates, there is a plan of organization common to all retinas represented by five major neuronal cell classes arranged in stereotypic patterns.29,30 However, differences are found in the gross morphological characters and cell connectivity between several vertebrate species. As mammals, zebrafish retina is formed by three nuclear layers separated by two plexiform layers: Photoreceptors occupy the outer layer, while the ganglion cells reside in the innermost neuronal layer, and the amacrine, bipolar, horizontal cells, and Muller glia are located between the photoreceptor and ganglion cell layers.
Vertebrate photoreceptors have a characteristic polarized morphology and are subdivided into ISs and OSs connected by a connecting cilium. The OS contains several components of visual cascades and visual pigments. Zebrafish retina contains five types of photoreceptor cells: rods, short single cones, long single cones, and short and long members of double cone pairs. Rod OS contain the visual pigment rhodopsin within membrane-bound discs, and cones contain several visual pigments, known as opsins. In adult zebrafish, cones are organized in regularly alternating rows of single and double cones, and between these rows rods occur. The cones organization is not so regular at the larval stage, 31 because during development, new cells are produced and arranged to give the mature definitive structure of adult retina. As other vertebrates, the two photoreceptor types are adapted to different illumination levels with rods being functional at low light conditions and the cones mediating vision at bright-light levels.
However, photoreceptors of zebrafish are characterized by different visual pigments and their absorption spectra: Rods express rod opsin, short and long single cones express ultraviolet (UV)-sensitive and blue light-sensitive opsin, respectively, whereas double cones express red-sensitive and green-sensitive opsins.32,33 In contrast, mouse retina comprises two types of cone: Very few cones express a short wavelength sensitive opsin (S opsin, “blue”), and the majority of cones coexpress a middle wavelength-sensitive opsin (M opsin, “red”) together with S opsin. 34 Finally, human retina has three types of cones that are mid- and long-wavelength sensitive (“red” and “green”) and short-wavelength sensitive (“blue”). Several differences were also found in other cell types of retina: For example, zebrafish contains four horizontal cell types, against two in the mouse 35 and three in macaque. 36
It is well known that, during its development, the zebrafish retina arises at around 11 hpf from an evagination of the anterior neural keel (a solid rod of cells analogous to the mammalian neural tube) as a two-layer optic cup. 37 At 24 hpf, the presumptive retina consists of a single, pseudostratified epithelial layer that undergoes rapid cell proliferation over the next 12 hr. 15 The first retinal cells to differentiate are the ganglion cells around 28 hpf, 38 then, the inner nuclear layer cells (amacrine cells, bipolar cells, Muller glia, and horizontal cells), and, finally, rod and cone photoreceptors. 39 The latter become differentiated by 43 hpf and, by 48 hpf, develop their characteristic elongated morphology.20,38,40 Rod opsin (here identified by the zpr3 antibody) is expressed at 50 hpf at the ventral patch, a small area of the eye cup, 41 then, it progressively appears in more dorsal regions. By 60 hpf, the retina has become fully laminated, with three distinct nuclear layers separated by two plexiform layers 37 and by 72–96 hpf, it is composed of one type of rod photoreceptor and four distinct classes of cones sensitive to UV, blue, red, and green light.
By immunohistochemistry (Figs. 1 and 2) and TEM (Figs. 3 and 4), we show that the ETC complexes I and IV and ATP synthase are expressed in the zebrafish rod OS. In fact, the specific antibodies colocalize with anti-zpr3 antibody, marker of rod opsin OSs. 42 Fluorescence images reporting ND1 subunit of ETC complex I and ATP synthase staining also the plexiform layer, and the presence of complex IV signal in the mitochondria of rod IS by TEM experiments, were considered as positive control due to the presence of mitochondria therein.
Although we have utilized fluorescence microscopy for colocalization analysis, this technique is more appropriately utilized to determine the actual interaction of two proteins on the same subcellular structure. 43 Notably, neither complex I nor ATP synthase functionally interact with Rh, being involved in unrelated pathways. Our aim here was to document the contiguity of these proteins on the OS. Specificity is shown by the absence of signal when primary Ab are omitted (see Supplementary Figs. 2 and 3). Other limits to the colocalization technique are that labeling conditions require that the fluorescence of the two probes occurs in similar proportion 44 : Here, Rh is a high abundance protein, accounting for about 85% of the OS protein complement, while ATP synthase and complex I are low abundance ones. The relatively poor colocalization signal (i.e., low yellow signal in Figs. 1 and 2) may essentially be due to the largely different relative abundance of the two proteins. To overcome this problem, TEM analysis was performed. Data prove the colocalization of ETC complexes I and IV and ATP synthase in the rod OS on larval and adult retinal sections (Figs. 3 and 4).
Colocalization of MT staining, a photostable permeant fluorescent vital dye that accumulates in actively respiring membranes, 26 with zpr3 signal in 4-day larval and adult zebrafish eye sections, suggests that OXPHOS proteins are active in zebrafish rod OS (Fig. 4). In fact, our previous results on bovine OS 45 reported that the rod photoreceptor OS, even though devoid of mitochondria, selectively stains with mitochondrial vital dyes. These cationic lipophilic dyes localize to mitochondria due to the steep membrane potential of these organelles. In fact, a pharmacological disruption of the rod membrane potential affected OS staining as well. 45 This intriguing finding not only provided a marker for rod OS, but also suggested that the phototransduction process in the membrane discs that harbor the photopigment might involve the buildup of a proton potential by an ETC in its membranes.
The functionality of the whole ETC in the zebrafish rod OS is also confirmed by histochemical activity assays performed in situ on unfixed 4-day-old larval eye sections. Complex I and complex III–IV were active in the rod OS, and activity was specific, as shown by its decrease in the presence of specific inhibitors, such as Rotenone for ETC complex I and Antimycin A for ETC complex III–IV (Fig. 5). Data suggest that the OXPHOS machinery is a bona fide part of the protein complement of the rod OS, where ATP supply is more necessary. Likely the transparent larvae need an early visual function, and this is inextricably intertwined with its ability to supply chemical energy, suggesting that as soon as the rod zpr3 starts its expression, the ATP need for the newly forming rod OS is high.
Data are consistent with a previous hypothesis about the poor sensitivity of current assays for the measuring of the first rod signaling. In fact, it was reported that rods are not functional until 14 dpf by behavioral assays 46 and that rod signaling, measured by electroretinogram (ERG), cannot be detected until about 15 dpf, and it is not particularly robust until about 21 dpf. 11 Then, it appears necessary to develop a more sensitive system to detect the timing of zebrafish OS photoreceptor signaling.
Supplemental Material
JHC762389_Supplemental_Material – Supplemental material for Evidence of Oxidative Phosphorylation in Zebrafish Photoreceptor Outer Segments at Different Larval Stages
Supplemental material, JHC762389_Supplemental_Material for Evidence of Oxidative Phosphorylation in Zebrafish Photoreceptor Outer Segments at Different Larval Stages by Daniela Calzia, Greta Garbarino, Federico Caicci, Mario Pestarino, Lucia Manni, Carlo Enrico Traverso, Isabella Panfoli and Simona Candiani in Journal of Histochemistry & Cytochemistry
Footnotes
Acknowledgements
The authors would like to thank Dr. Matteo Bozzo and Valentina Obino for zebrafish embryos care and maintenance.
Competing Interests
The author(s) declared no potential conflicts of interest with respect to the research, authorship, and/or publication of this article.
Author Contributions
All authors have contributed to the manuscript as follows: DC performed immunohistochemical and histochemical assay and western blotting analyses, analyzed and interpreted the results, and contributed to writing the paper; GG performed samples preparation for immunohistochemical and histochemical analysis, zebrafish maintenance, and acquired immunohistochemical images; MP provided expertise of immunohistochemical and histochemical analysis, contributed to the analysis of these data, and discussed prepublication results; FC performed Transmission Electron Microscopy (TEM) immunogold experiments on larval and adult zebrafish eye sections, analysis and interpretation, and graphic illustration; LM provided expertise of TEM immunogold analysis on zebrafish eye sections, and performed analysis and interpretation of results; CET provided clinical expertise, contributed to the analysis of these data, and discussed prepublication results; IP contributed to the design of the research study, overall interpretation of these data, and wrote the paper; SC designed the research study, contributed to perform histochemical assay experiments and analysis and overall interpretation of the data, and wrote the paper; and all authors have read and approved the final manuscript.
Funding
The author(s) disclosed receipt of the following financial support for the research, authorship, and/or publication of this article: This work was supported by University of Genoa (grant 100022-2015-FRA 2015).
References
Supplementary Material
Please find the following supplemental material available below.
For Open Access articles published under a Creative Commons License, all supplemental material carries the same license as the article it is associated with.
For non-Open Access articles published, all supplemental material carries a non-exclusive license, and permission requests for re-use of supplemental material or any part of supplemental material shall be sent directly to the copyright owner as specified in the copyright notice associated with the article.