
Abstract
The glandular stomach has two major zones: the acid secreting corpus and the gastrin cell–containing antrum. Nevertheless, a single gland lies at the transition between the forestomach and corpus in the mouse stomach. We have sought to define the lineages that make up this gland unit at the squamocolumnar junction. The first gland in mice showed a notable absence of characteristic corpus lineages, including parietal cells and chief cells. In contrast, the gland showed strong staining of Griffonia simplicifolia-II (GSII)-lectin-positive mucous cells at the bases of glands, which were also positive for CD44 variant 9 and Clusterin. Prominent numbers of doublecortin-like kinase 1 (DCLK1) positive tuft cells were present in the first gland. The first gland contained Lgr5-expressing putative progenitor cells, and a large proportion of the cells were positive for Sox2. The cells of the first gland stained strongly for MUC4 and EpCAM, but both were absent in the normal corpus mucosa. The present studies indicate that the first gland in the corpus represents a unique anatomic entity. The presence of a concentration of progenitor cells and sensory tuft cells in this gland suggests that it may represent a source of reserve reparative cells for adapting to severe mucosal damage.
Introduction
All mammals have a transition from a squamous to a glandular mucosa in the upper gastrointestinal tract. In humans, this transition occurs between the squamous-lined esophagus and the glandular stomach and can be identified endoscopically as the “Z-line.” In rodents, this change occurs at the junction of the squamous forestomach with the glandular stomach. In rodents, this transition has been defined anatomically as the “limiting ridge” or the “gastric groove.”1,2 The formation of these different epithelial zones is determined during development. Previous investigations have implicated a loss of Sox2 in patterning the transition between squamous and glandular mucosa between the forestomach and the glandular stomach. 3 Similarly, Pdx1 defines the boundary of the distal foregut, with expression beginning in the gastric antrum and continuing into the duodenum and pancreas. 4 Spdef is required for maturation of antral gland lineages. 5 Regulation of the patterning of these anatomic zones is dependent on interactions with underlying mesenchymal cells. Barx1 expression in mesenchyme regulates the differentiation and patterning of mucosal lineages in the stomach.6,7
Much controversy has recently arisen about the existence of cardiac glands, defined as mucous cell–containing glands without parietal cells, adjacent to the gastroesophageal junction in humans.8,9 Previous investigations have noted the presence of glands lacking parietal cells at the squamocolumnar junction in the mouse stomach. 10 Although other studies have noted the presence of large concentrations of tuft cells in the first gland of the rodent stomach distal to the limiting ridge, 2 few investigations have defined the characteristics of the other lineages that reside at this important transition point. We have now sought to investigate in greater detail the lineages that reside in the first gland of the mouse gastric corpus and to compare those lineages with those observed in the rest of the corpus as well as in the antrum. Our investigations demonstrate that the first gland represents a distinct anatomic structure with specific lineages, which more closely resemble the cells of the antrum or metaplastic glands than the glands of the gastric corpus.
Materials and Methods
Animals
Male 8- to 12-week-old C57Bl/6 non-littermate mice and Lgr5-green fluorescent protein (GFP) reporter mice were obtained from Jackson Laboratories (Bar Harbor, ME). All mice were maintained under specific pathogen-free (SPF) conditions (biological level 5). All studies were carried out under an approved vertebrate animal protocol approved by the Vanderbilt Institutional Animal Care and Use Committee (IACUC).
Immunofluorescence
Mouse stomachs were excised from C57Bl/6 and Lgr5-GFP reporter mice, fixed in 4% paraformaldehyde and embedded in paraffin. Serial 5-micron sections were heated to 60C for 30 min and cooled at room temperature for 30 min. Sections were deparaffinized in Histo-Clear and rehydrated in a series of ethanol dilutions. Antigen retrieval was performed using Target Retrieval Solution pH 6 (DAKO; Carpinteria, CA) at high pressure for 15 min. Slides were removed and placed on ice for 30 min. Mouse sections were blocked with Mouse on Mouse (M.O.M.) Blocking Kit (MKB-2213; Vector, Burlingame, CA) per the manufacturer’s instructions when mouse derived antibodies were used (H/K ATPase and Trefoil Factor 2 [TFF2]). Antigen blocking was performed using Protein Block Serum Free Ready-to-use (DAKO) at room temperature for 90 min or overnight in a moisture chamber. Primary antibodies were diluted in Antibody Diluent with Background Reducing Component (DAKO). Sections were incubated with primary antibodies overnight at 4C in a moisture chamber as indicated in Table 1. Sections were washed with PBS. Fluorescent secondary antibodies (donkey anti-rat IgG-Cy2 or Cy3; donkey anti-goat IgG-Cy2, Cy3, or Cy5; donkey anti-rabbit IgG-Cy2 or Cy3; donkey anti-mouse IgG-Alexa 488 or Cy3; donkey anti-mouse IgM-Alexa 488; and donkey anti-guinea pig-Cy3 obtained from Jackson Immunochemical, West Grove, PA; or Invitrogen, Carlsbad, CA) were used at 1:500 dilution in Antibody Diluent with Background Reducing Component (DAKO), whereas GSII-lectin (Griffonia simplicifolia) and UEA1 (Ulex europaeus agglutinin-1) (Molecular Probes; Eugene, OR) were used at 1:1000 and 1:2000, respectively. Secondary antibody staining and lectin incubation were performed at room temperature for 1 hr. Nuclear staining was performed using 4′,6-diamidino-2-phenylindole (DAPI, 0.2 µg/ml final concentration) incubated with sections at room temperature for 5 min followed by three washes in PBS for 5 min. Sections were mounted in Prolong Gold antifade reagent. Tissue images were captured using a Zeiss Axio Imager M2 microscope equipped with a ZeissCam using a 20× NA 0.8 Plan-Apochromat objective (Zeiss; Thornwood, CA).
List of Antibodies Used in Immunofluorescence.
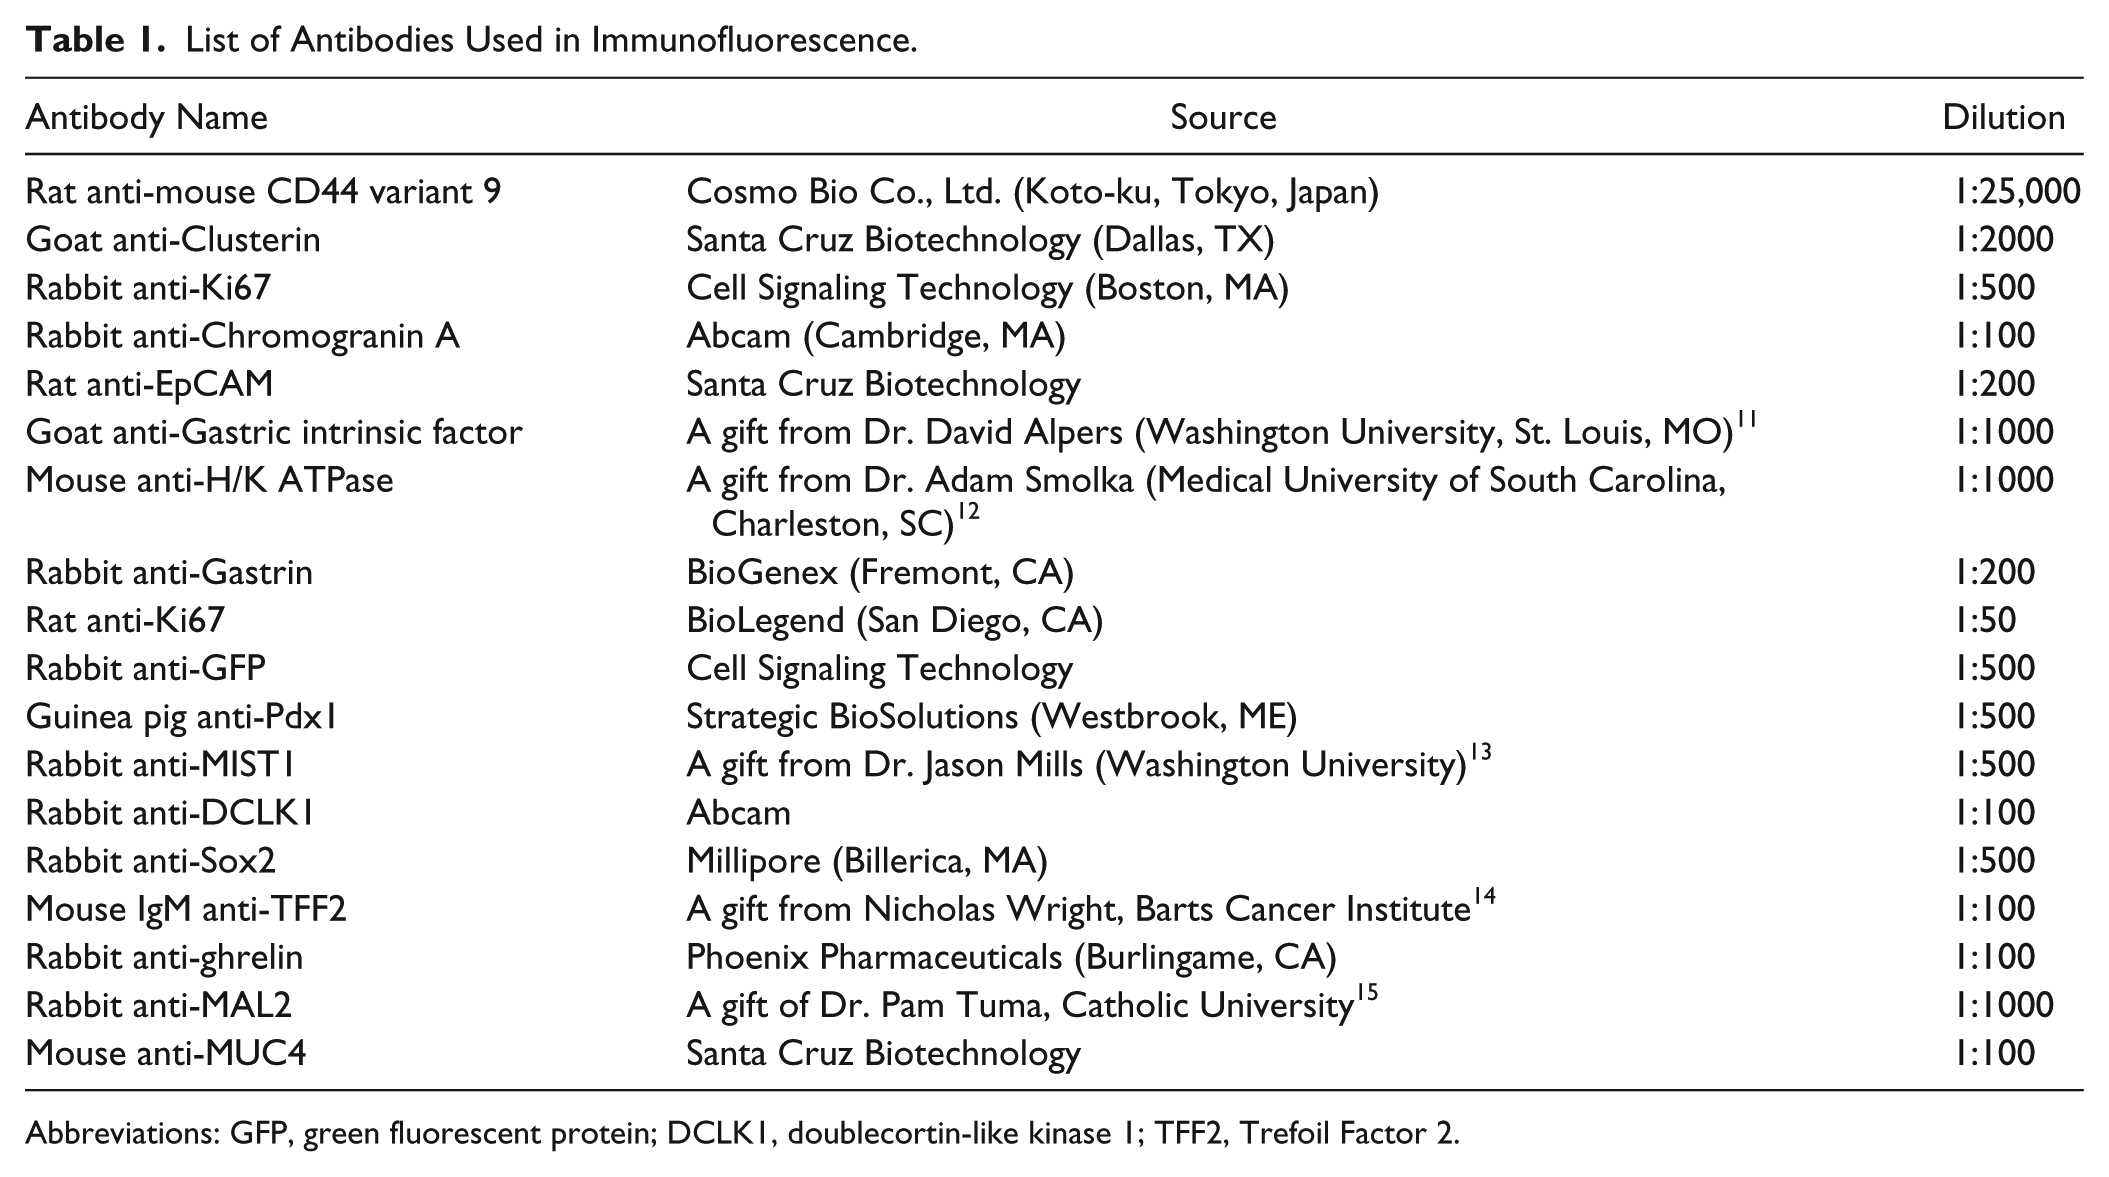
Abbreviations: GFP, green fluorescent protein; DCLK1, doublecortin-like kinase 1; TFF2, Trefoil Factor 2.
Cell counting statistics were compiled from five representative sections images from four different wild-type mice or two Lgr5-GFP reporter mice. Positive staining cells were quantitated as a percentage of DAPI-nuclei positive cells in the first gland and expressed as a mean ± the standard deviation (Table 2).
Quantitation of Cell Lineages in the First Gland.
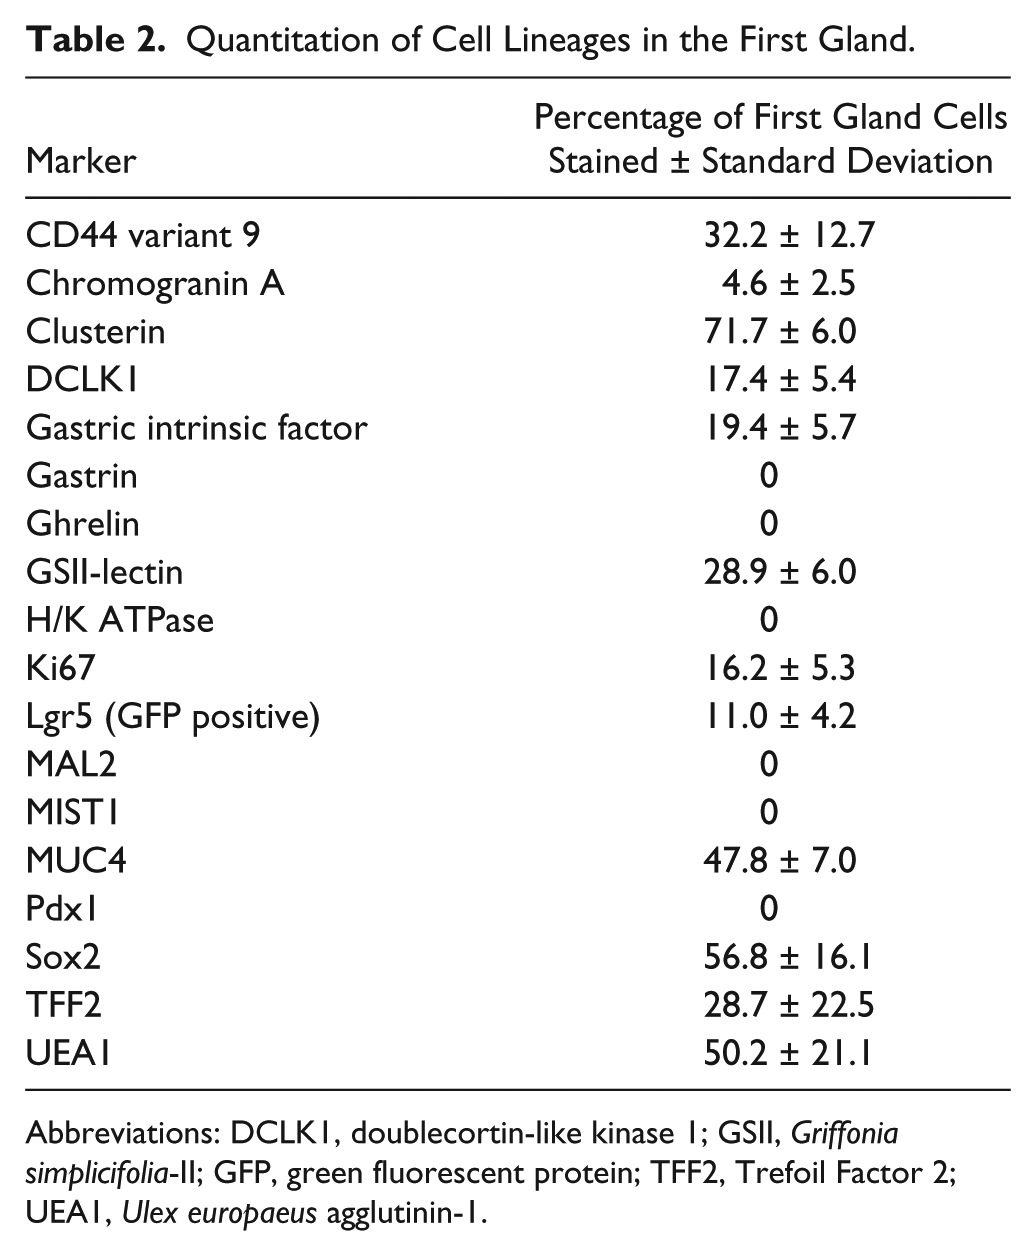
Abbreviations: DCLK1, doublecortin-like kinase 1; GSII, Griffonia simplicifolia-II; GFP, green fluorescent protein; TFF2, Trefoil Factor 2; UEA1, Ulex europaeus agglutinin-1.
Results
We sought to define the cell lineages present in the first gland of the stomach corpus in the mouse, which lies in apposition with the distal portion of the squamous forestomach. In hematoxylin and eosin stains of the region around the squamocolumnar junction, the first gland of the corpus can be seen as clearly lacking eosinophilic parietal cells (Fig. 1A). Because of the first gland’s proximity to the corpus, multiple corpus markers were examined. No H/K ATPase immunostaining parietal cells were found in the first gland (Fig. 1B). Similarly, MIST1, a transcription factor important for granulogenesis in chief cells,16,17 was expressed in the nuclei of chief cells in the corpus of the stomach, but MIST1 expression was not present in the first gland cells or in antral gland cells (Fig. 1). We also examined the expression of Gastric Intrinsic Factor (GIF), considered a marker of mature rodent chief cells. 18 GIF was expressed in chief cells at the bases of oxyntic glands, but GIF staining was also observed in a subset of deep antral mucus cells (Fig. 1). GIF staining was also observed in 29% of first gland cells predominantly in cells at the base of the first gland (Table 2). Thus, the presence of GIF positive cells without MIST1 expression at the base of the first gland was similar to deep antral gland cells.
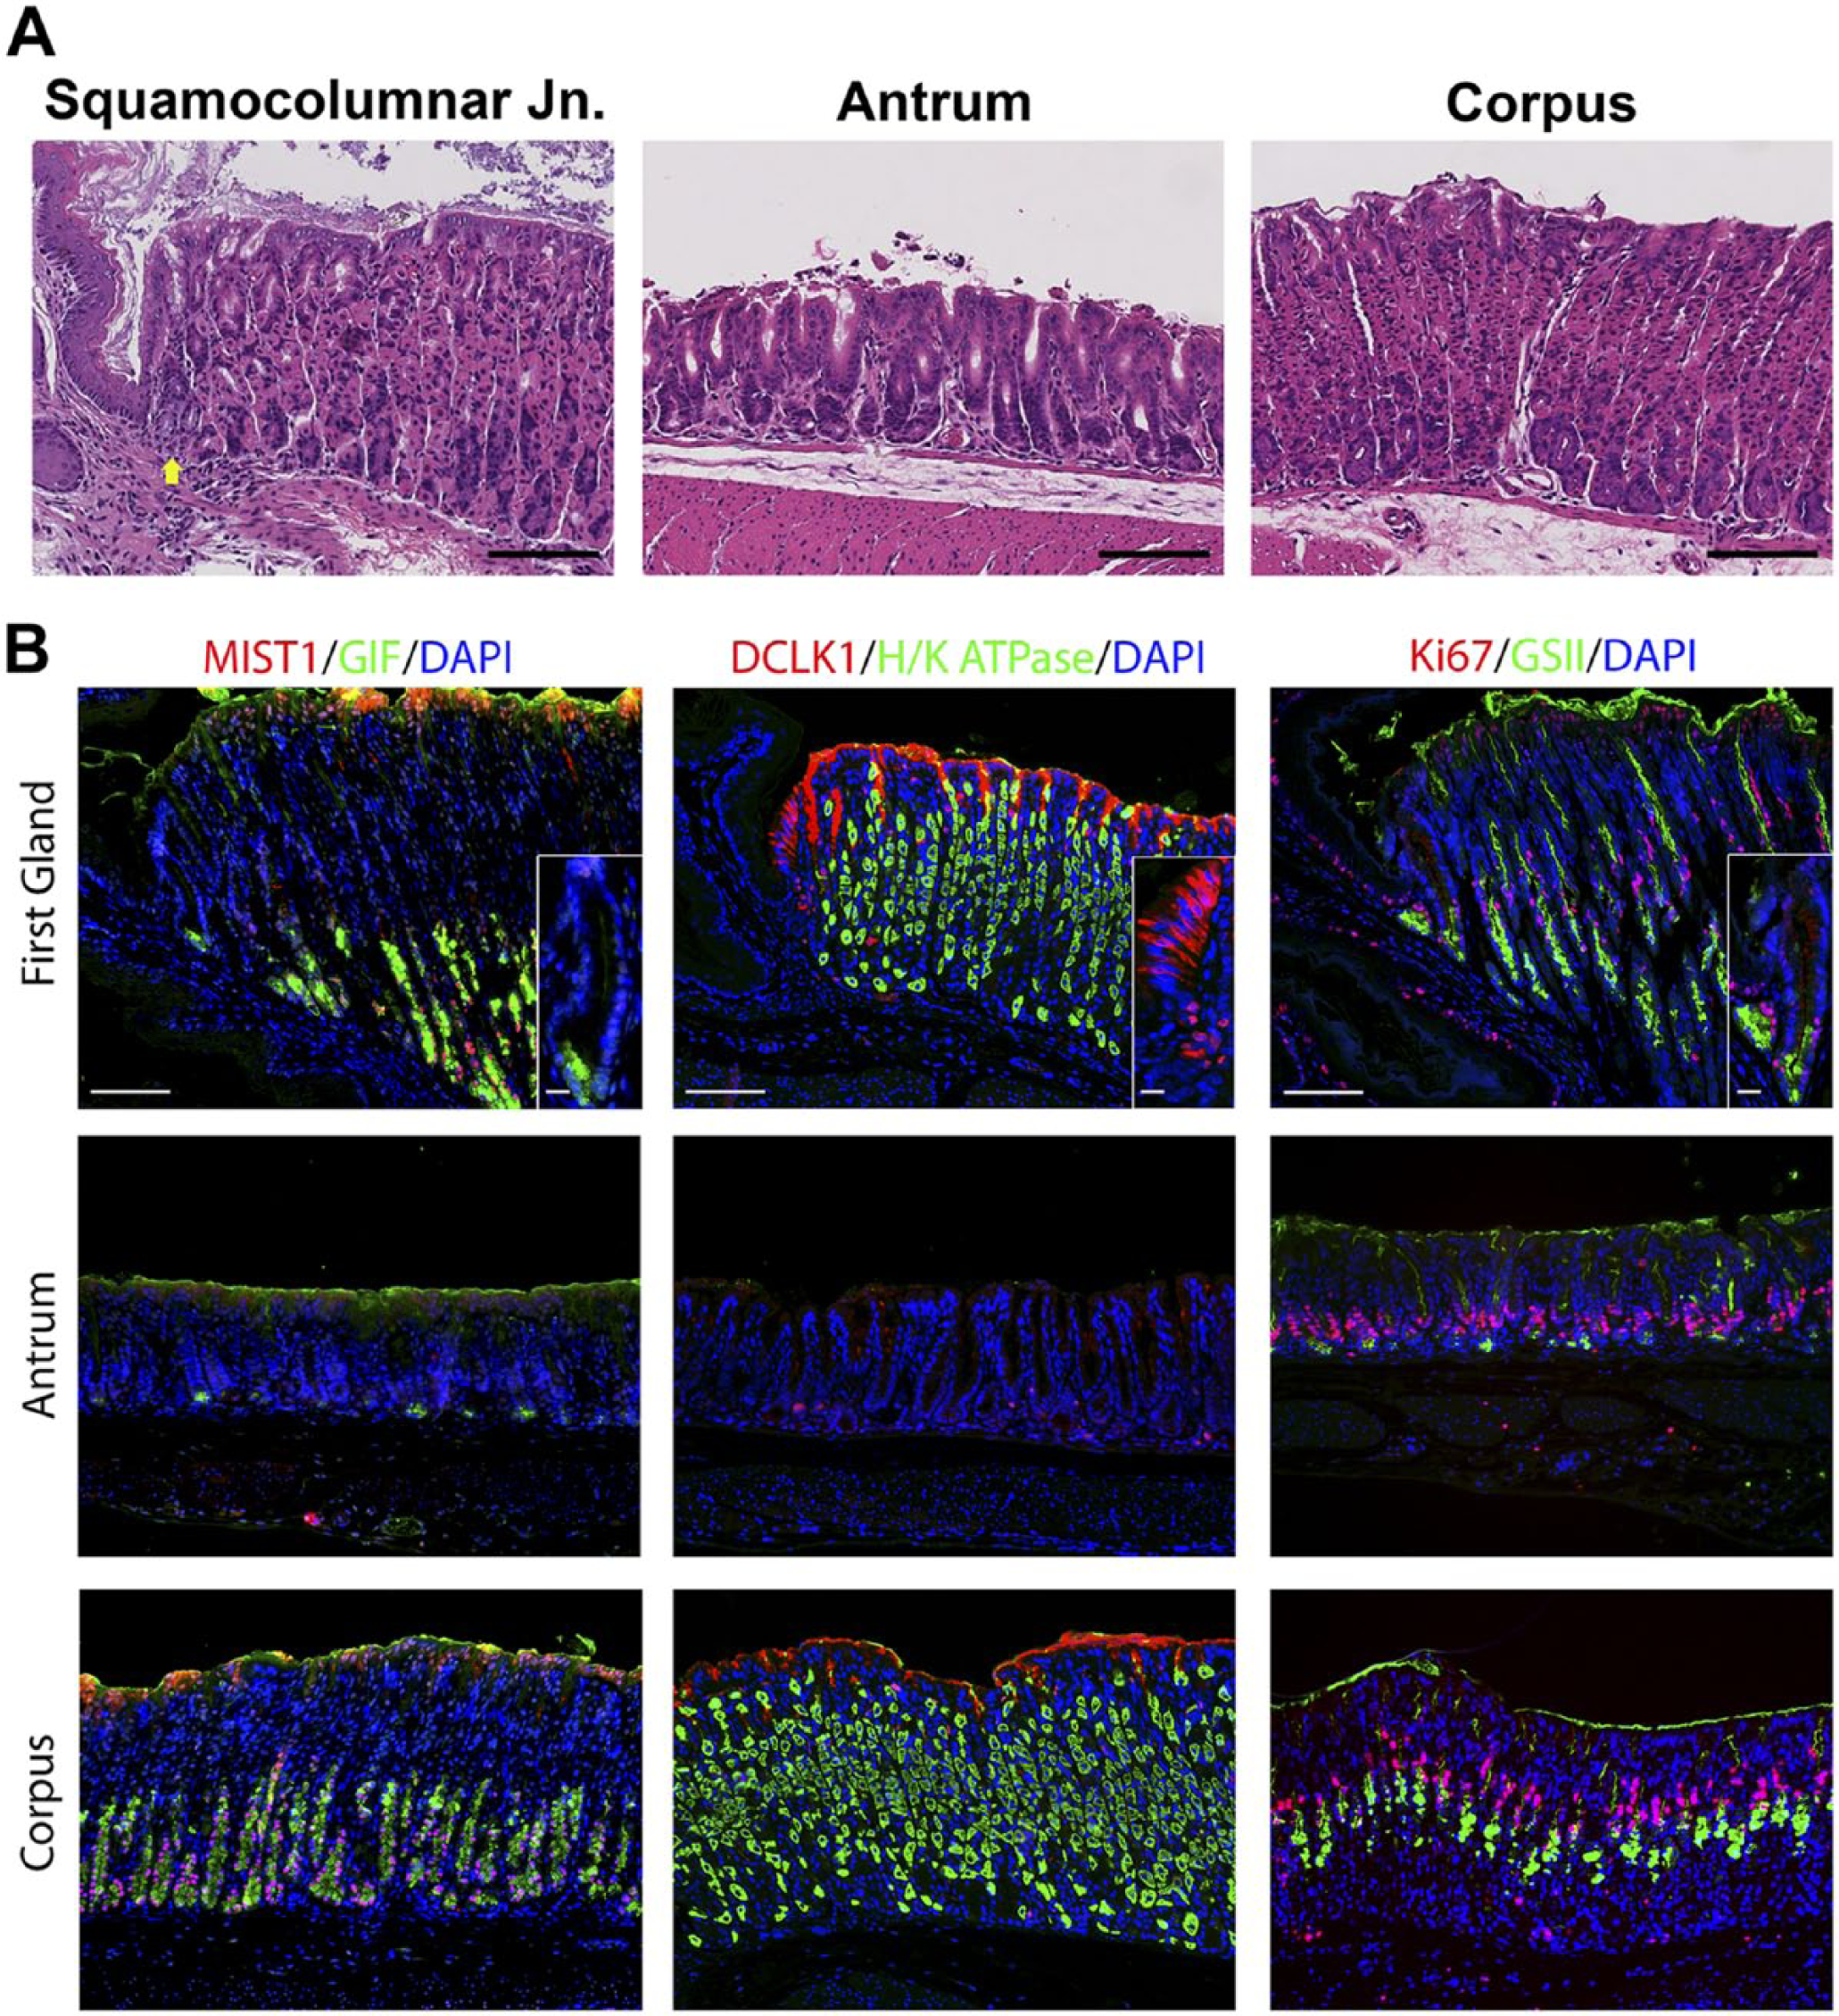
Comparison of gastric corpus markers in the first gland, antrum, and corpus of the stomach. A. Hematoxylin and eosin staining of the squamocolumnar junction region, the antrum, and the corpus. The position of the first gland is indicated with a yellow arrow. Bar = 100 µm. B. Immunolabeling was compared in sections from the first gland region, antrum, and corpus. Left panels: Immunofluorescence antibody labeling for chief cells using antibodies against the transcription factor MIST1 in (red) co-labeled with GIF (green) and 4′, DAPI (blue). Middle panels: Immunofluorescence antibody labeling for tuft cells using anti-DCLK1 (red) and parietal cells using anti-H/K ATPase (green) and DAPI (blue). Note that surface mucus staining observed with the DCLK1 is a consistent artifact in the corpus mucosa. Right panels: Immunofluorescence staining for Ki67 (red) to assess proliferation and GSII-lectin to label mucus cells (green) and DAPI (blue). All insets show enlarged view of the first gland. Scale bars for full image = 10 µm. Scale bars for insets = 3 µm. Abbreviations: GIF, gastric intrinsic factor; DAPI, 4′,6-diamidino-2-phenylindole; DCLK1, doublecortin-like kinase 1; GSII, Griffonia simplicifolia-II.
Previous studies have emphasized the high concentration of tuft or brush cells in the first gland. 2 Doublecortin-like kinase 1 (DCLK1) has recently been demonstrated in populations of tuft cells.19–21 Many DCLK1 positive cells were prominently visible in the first gland and stained as characteristic thin cells along the curvature distal to the squamous tissue of the forestomach (Fig. 1). DCLK1 positive cells were a common component of the first gland, accounting for 17% of cell in the first gland (Table 2). The morphology of the DCLK1 positive cells in the first gland was similar to the scattered tuft cells identified in the corpus and antrum.
We next examined the presence of mucous cell lineages. GSII-lectin marks mucous cells that are also positive for MUC6. GSII staining was observed in mucus neck cells and deep antral gland cells, but 28.9% of cells at the base of the first gland also stained for GSII (Fig. 1, Table 2). These same cells at the base of the first gland also stained for TFF2, a secretory protein co-expressed with MUC6 in mucus neck cells and deep antral gland cells (Fig. 2, Table 2). We also examined staining for UEA1-lectin, which marks surface mucous cells throughout the mouse stomach. UEA1 was also positive in more than 50% of the cells at the tops of the first gland (Table 2, see Fig. 5). No staining for the intestinal mucin MUC2 was observed in the first gland (data not shown).
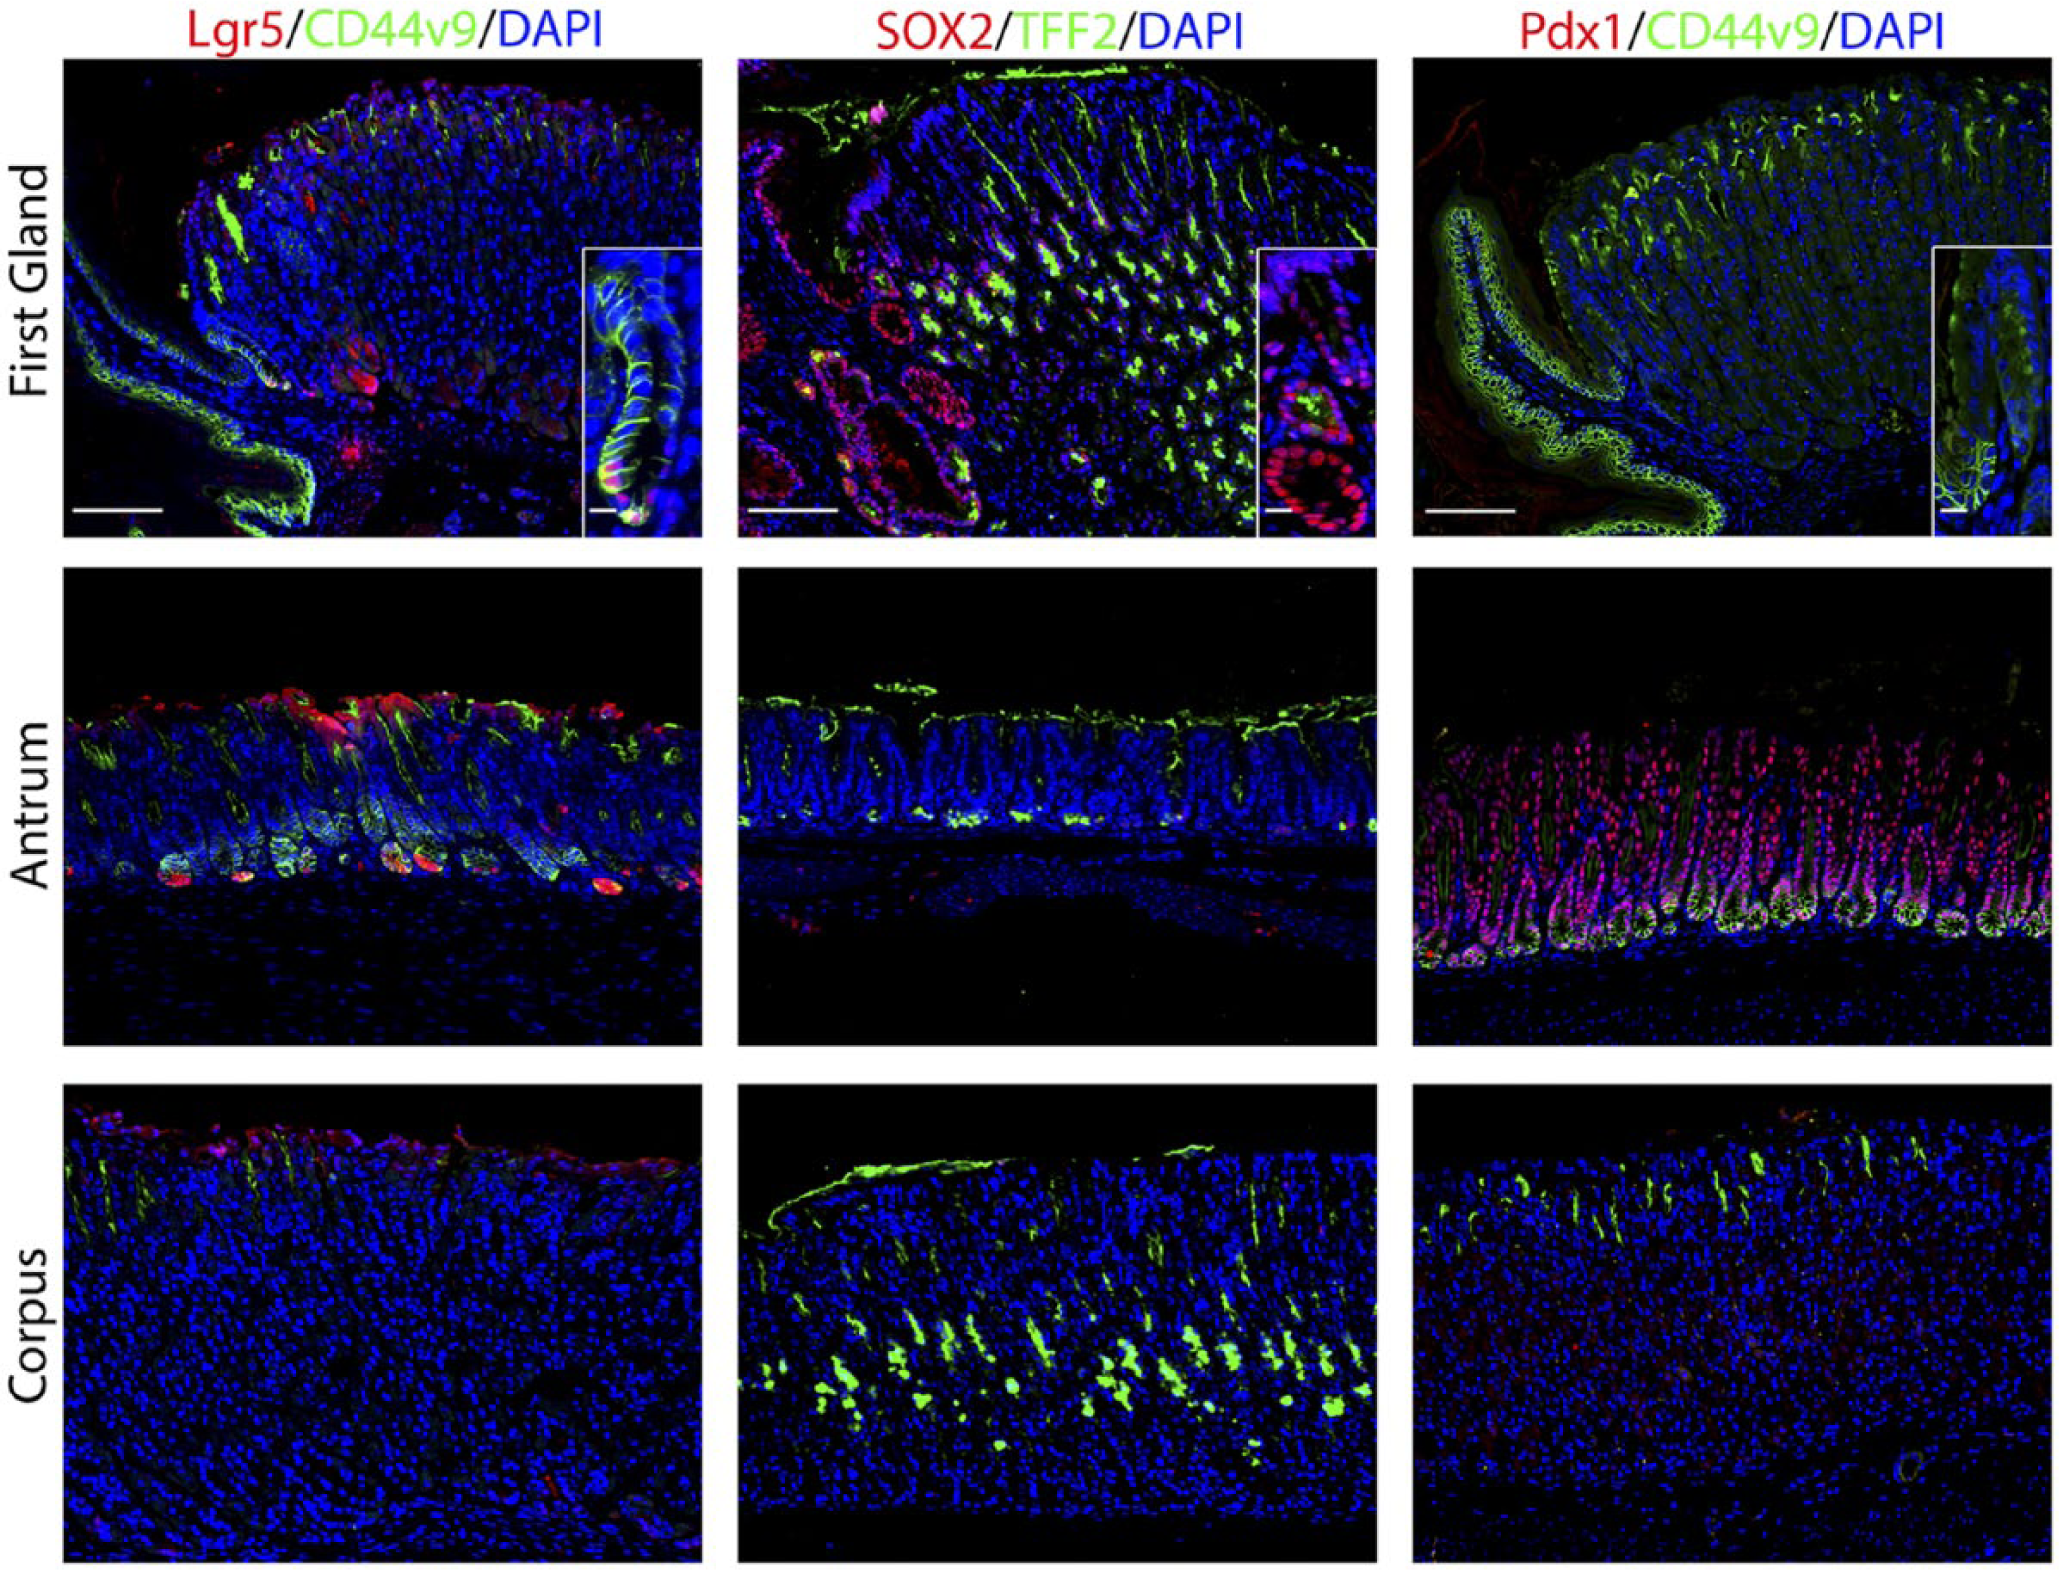
The first gland possesses features similar to the deep antral glands. Each antibody labeling was imaged in first gland, antrum, and corpus sections. Left panels: In sections from Lgr5-GFP mice, immunofluorescence antibody labeling for Lgr5-positive progenitor cells using anti-GFP antibody (red) and anti-CD44v9 (green) and DAPI (blue). Middle panels: Immunofluorescence antibody labeling for transcription factor Sox2 (red) and TFF2 to label mucus neck cells (green) and DAPI (blue). Right panels: Immunofluorescence labeling of transcription factor Pdx1 (red) and CD44v9 (green) and DAPI (blue). All insets show enlarged view of the first gland. Scale bars for full image = 10 µm. Scale bars for insets = 3 µm. Abbreviations: GFP, green fluorescent protein; CD44v9, CD44 variant 9; DAPI, 4′,6-diamidino-2-phenylindole; TFF2, Trefoil Factor 2.
To evaluate the presence of progenitor cells, we stained for the proliferative marker Ki67. Ki67 antibody labeling was positive in 16% of the cells in the first gland (Table 2). The proliferative cells were located at the base of the first gland, as compared with the position of the proliferative zone in the neck region of the oxyntic glands within the corpus (Fig. 1).
Given the prominent position of proliferative cells at the base of the first gland, we examined the expression of stem cell markers. We used an Lgr5-GFP reporter mouse to identify cells with Lgr5 transcriptional activity. 22 As noted in previous studies,22,23 Lgr5 transcriptional unit activity was identified at the bases of antral glands as well as in cells at the base of the first gland (Fig. 2). We also examined the expression of the transcription factor Sox2, which is important for epithelial cell self-renewal.3,24 Sox2 plays multiple roles in development and cell differentiation of the glandular stomach. 3 Sox2 was expressed in almost 57% of cells in the first gland (Fig. 2, Table 2). Only rare Sox2 positive cells were identified in the antrum and the corpus, but Sox2 positive cells were present in the forestomach. Furthermore, we also examined expression of Pdx1, a transcription factor important for positional boundaries in the upper gastrointestinal tract. 25 Although Pdx1 was expressed throughout the cells in the antrum, no cells with Pdx1 positive nuclei were observed in the first gland or the corpus (Fig. 2)
We next examined markers for the enteroendocrine cells (Fig. 3). Chromogranin A, a general marker for gut endocrine cells, 26 was positive in 4.6% of cells in the first gland and was located toward the base of the first gland (Table 2). Cells that were positive for ghrelin, a hormone that regulates satiety and is specifically expressed only in the stomach corpus, 27 were absent in the first gland (Fig. 3). Gastrin expressing G cells were present in the antrum, but no gastrin cells were observed in the first gland or in any glands within the corpus (Fig. 3).
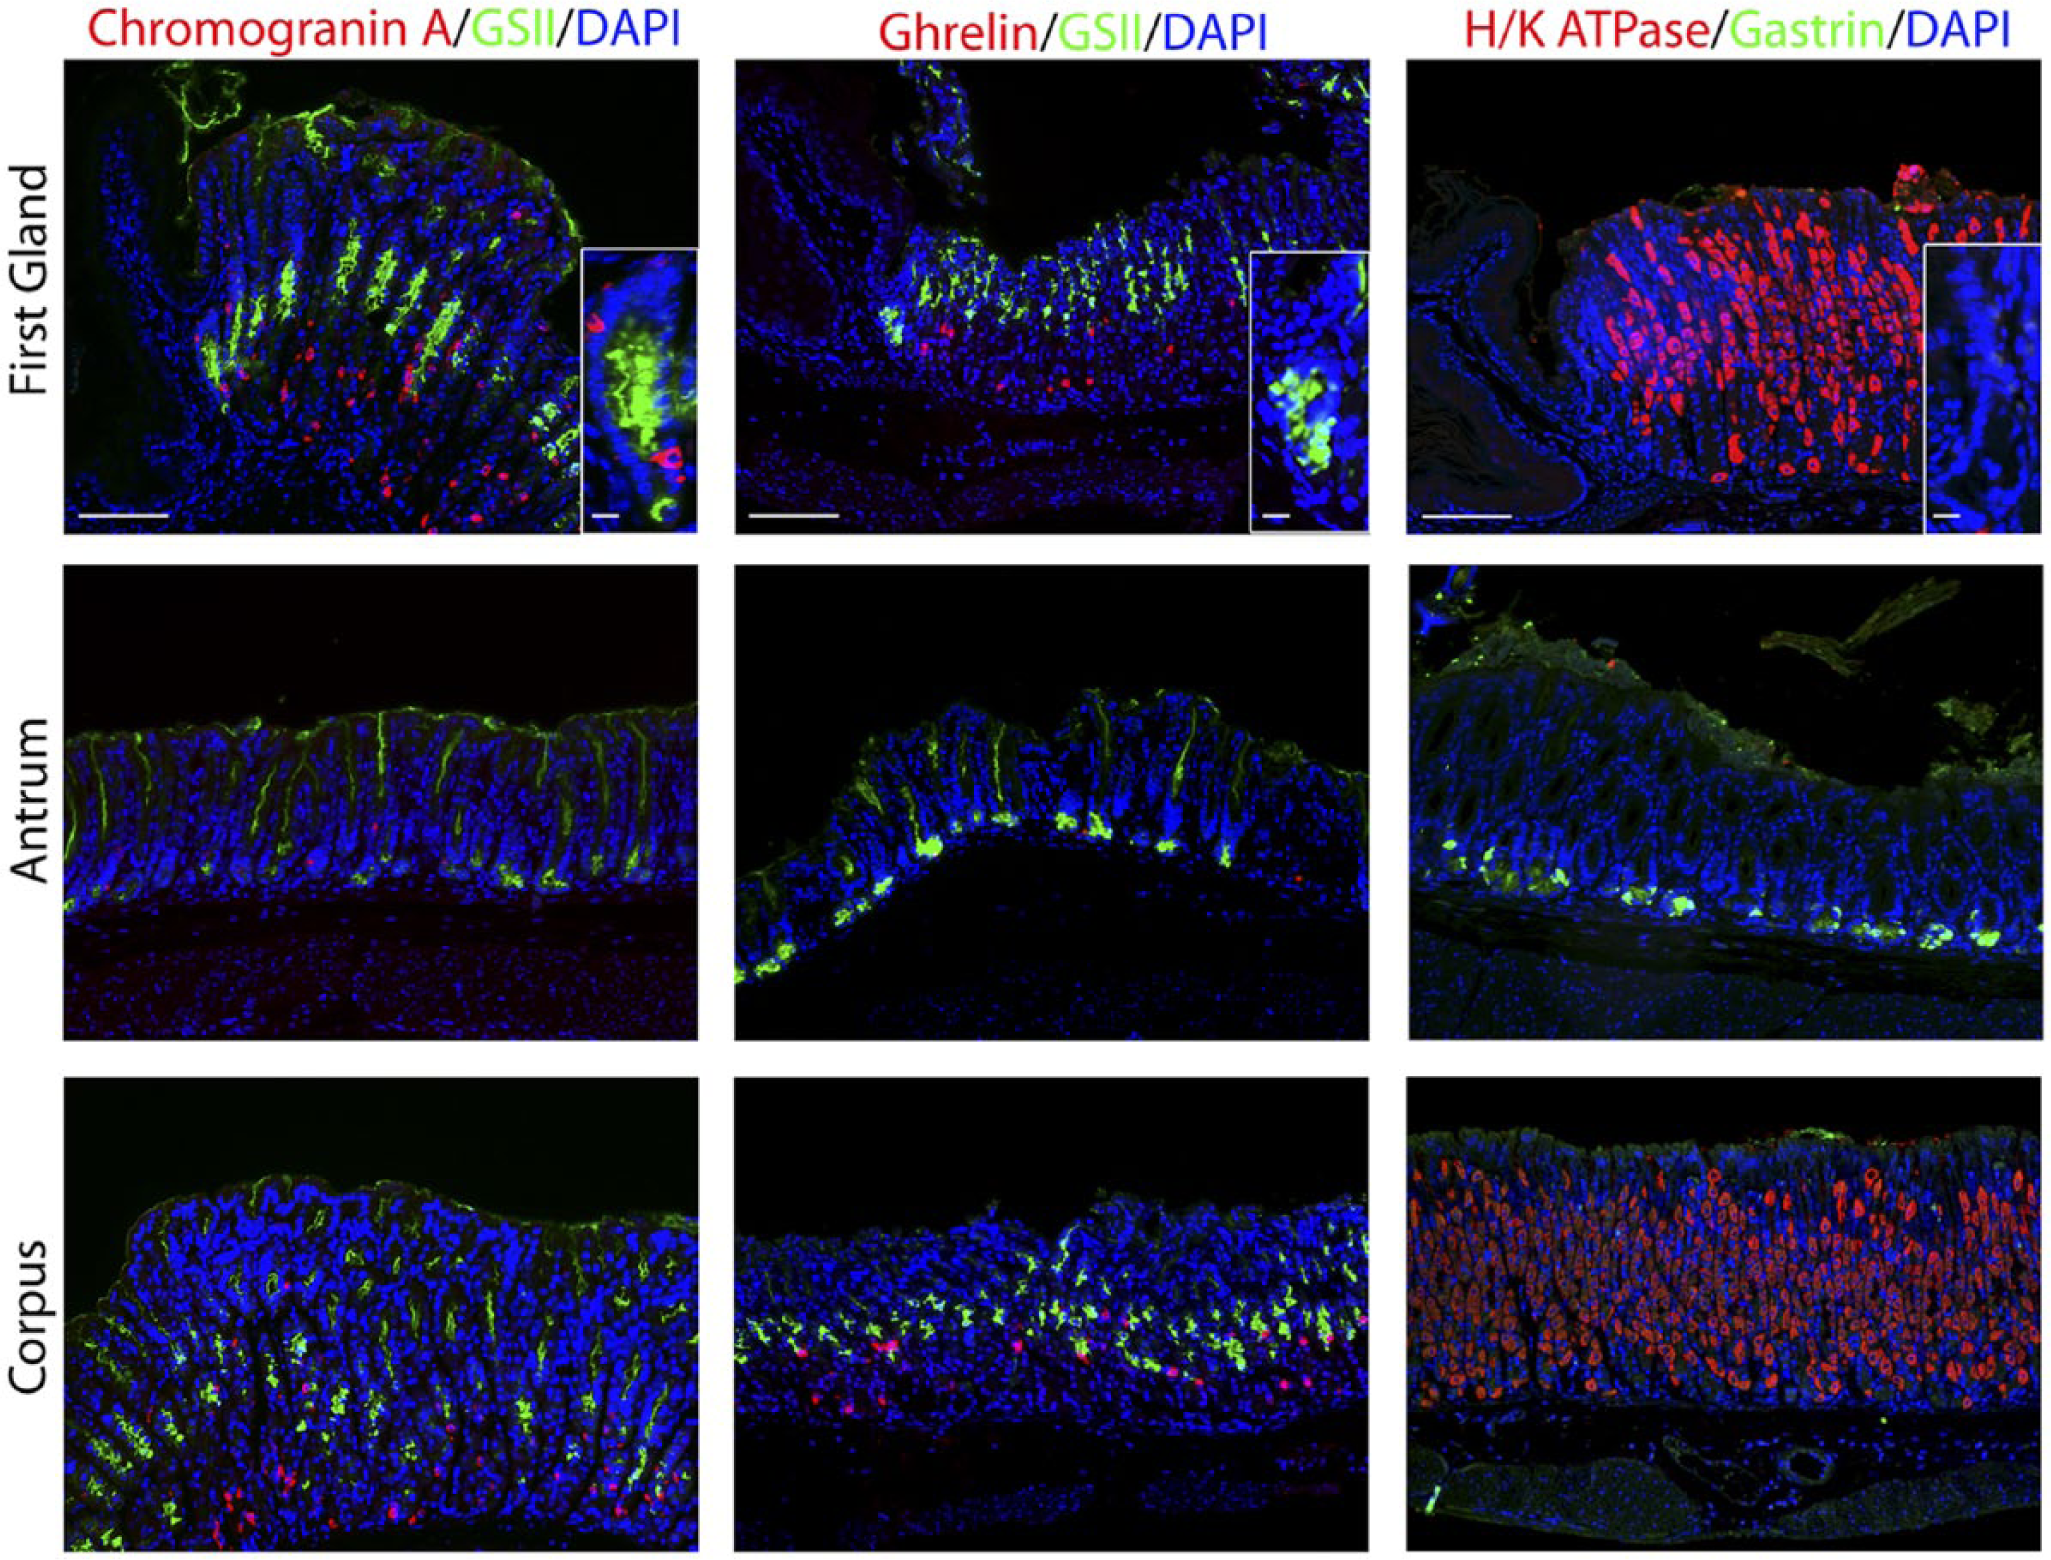
Immunostaining for enteroendocrine cell markers. Antibody labeling was assessed in first gland, antrum, and corpus sections. Left panels: Immunofluorescence labeling for endocrine cells using Chromogranin A (red) and GSII-lectin to label mucus cells (green) and DAPI (blue). Middle panels: Immunofluorescence antibody labeling for ghrelin (red) and GSII-lectin to label mucus cells (green) and DAPI (blue). Right panels: Immunofluorescence antibody labeling for G cells using anti-gastrin (green) and parietal cells using anti-H/K ATPase (red) and DAPI (blue). All insets show enlarged view of the first gland. Scale bars for full image = 10 µm. Scale bars for insets = 3 µm. Abbreviation: GSII, Griffonia simplicifolia-II; DAPI, 4′,6-diamidino-2-phenylindole.
Deep antral mucus glands have many characteristics with Spasmolytic polypeptide-expressing metaplasia (SPEM) lineages, which form in the corpus of the stomach in response to acute or chronic losses of parietal cells.28–31 We therefore examined gastric tissues with SPEM markers. Clusterin, also known as apolipoprotein J, has been implicated in many biological processes including oxidative stress, clearance of cellular debris, and inflammation. 32 Clusterin is upregulated in the stomach in metaplastic SPEM cells. 31 Although only scattered Clusterin positive cells were observed in the neck region of the corpus mucosa, nearly 72% of the cells in the first gland immunostained for Clusterin (Fig. 4, Table 2). The antrum also demonstrated Clusterin positive cells predominantly in cells at the base of the glands (Fig. 4).
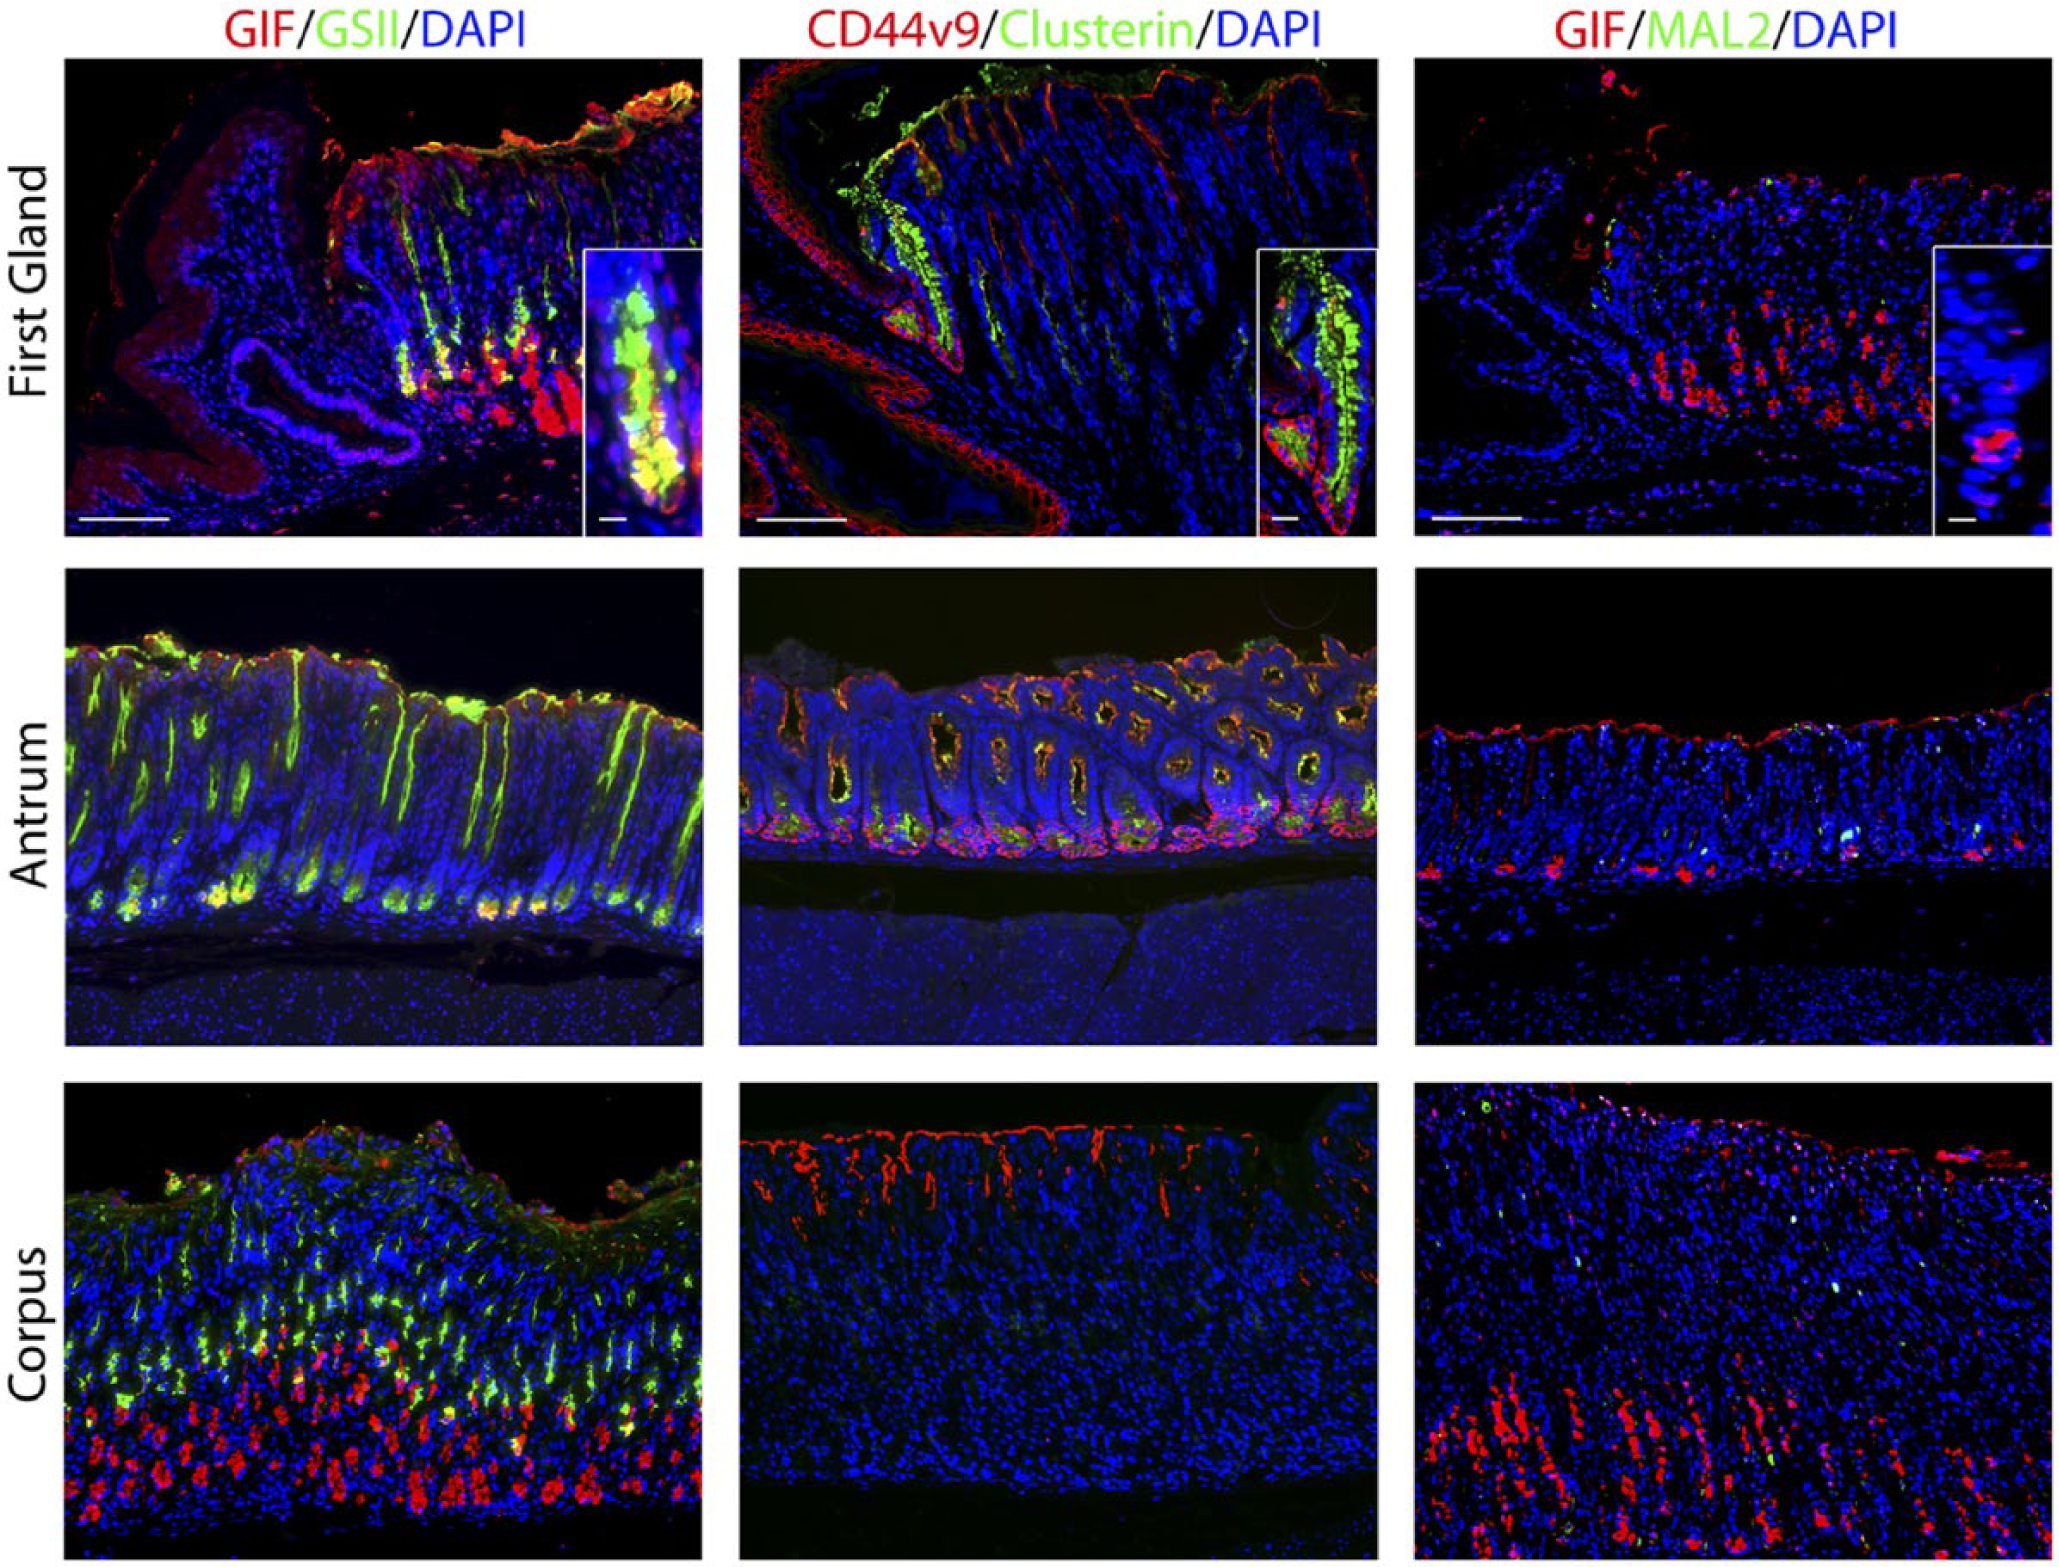
Staining for putative metaplastic markers in the first gland. Each antibody labeling was imaged in first gland, antrum, and corpus sections. Left panels: Immunofluorescence antibody labeling using GIF (red) co-labeled with GSII-lectin (green) and DAPI (blue). Middle panels: Immunofluorescence antibody labeling for CD44v9 (red), Clusterin (green), and DAPI (blue). Note that staining of surface mucin with anti-CD44v9 is a consistent artifact. Right panels: Immunofluorescence antibody labeling for GIF (red) and MAL2 (green) and DAPI (blue). All insets show enlarged view of the first gland. Scale bars for full image = 10 µm. Scale bars for insets = 3 µm. Abbreviations: GIF, gastric intrinsic factor; GSII, Griffonia simplicifolia-II; DAPI, 4′,6-diamidino-2-phenylindole; CD44v9, CD44 variant 9.
CD44 variant 9 (CD44v9) is a splice variant of CD44 that is absent from the normal corpus but is present in the basolateral membrane in deep antral glands and SPEM lineages. 33 CD44v9 staining was found in the basolateral membrane in 32% of cells at the base of the first gland (Fig. 2, Table 2). CD44v9 was also identified in the cells of the base of the antral glands (Fig. 2). The corpus mucosa contained no CD44v9 positive cells.
MAL2 is a trafficking protein that was recently discovered to be upregulated in SPEM. 34 No MAL2 staining was detected in the first gland (Fig. 4). MAL2 was positive in only a few scattered cells in the antrum and the corpus.
MUC4 is an intestinal mucin that is a marker of poor prognosis in gastric tumors.35–37 Previous studies have indicated expression of MUC4 in both gastric tumors and Barrett’s esophagus.36,38–40 MUC4 is upregulated in SPEM in rodent models.31,41 MUC4 staining revealed 47.7% MUC4-expressing cells in the first gland, although there were no MUC4 positive cells in either the antrum or corpus (Fig. 5, Table 2).
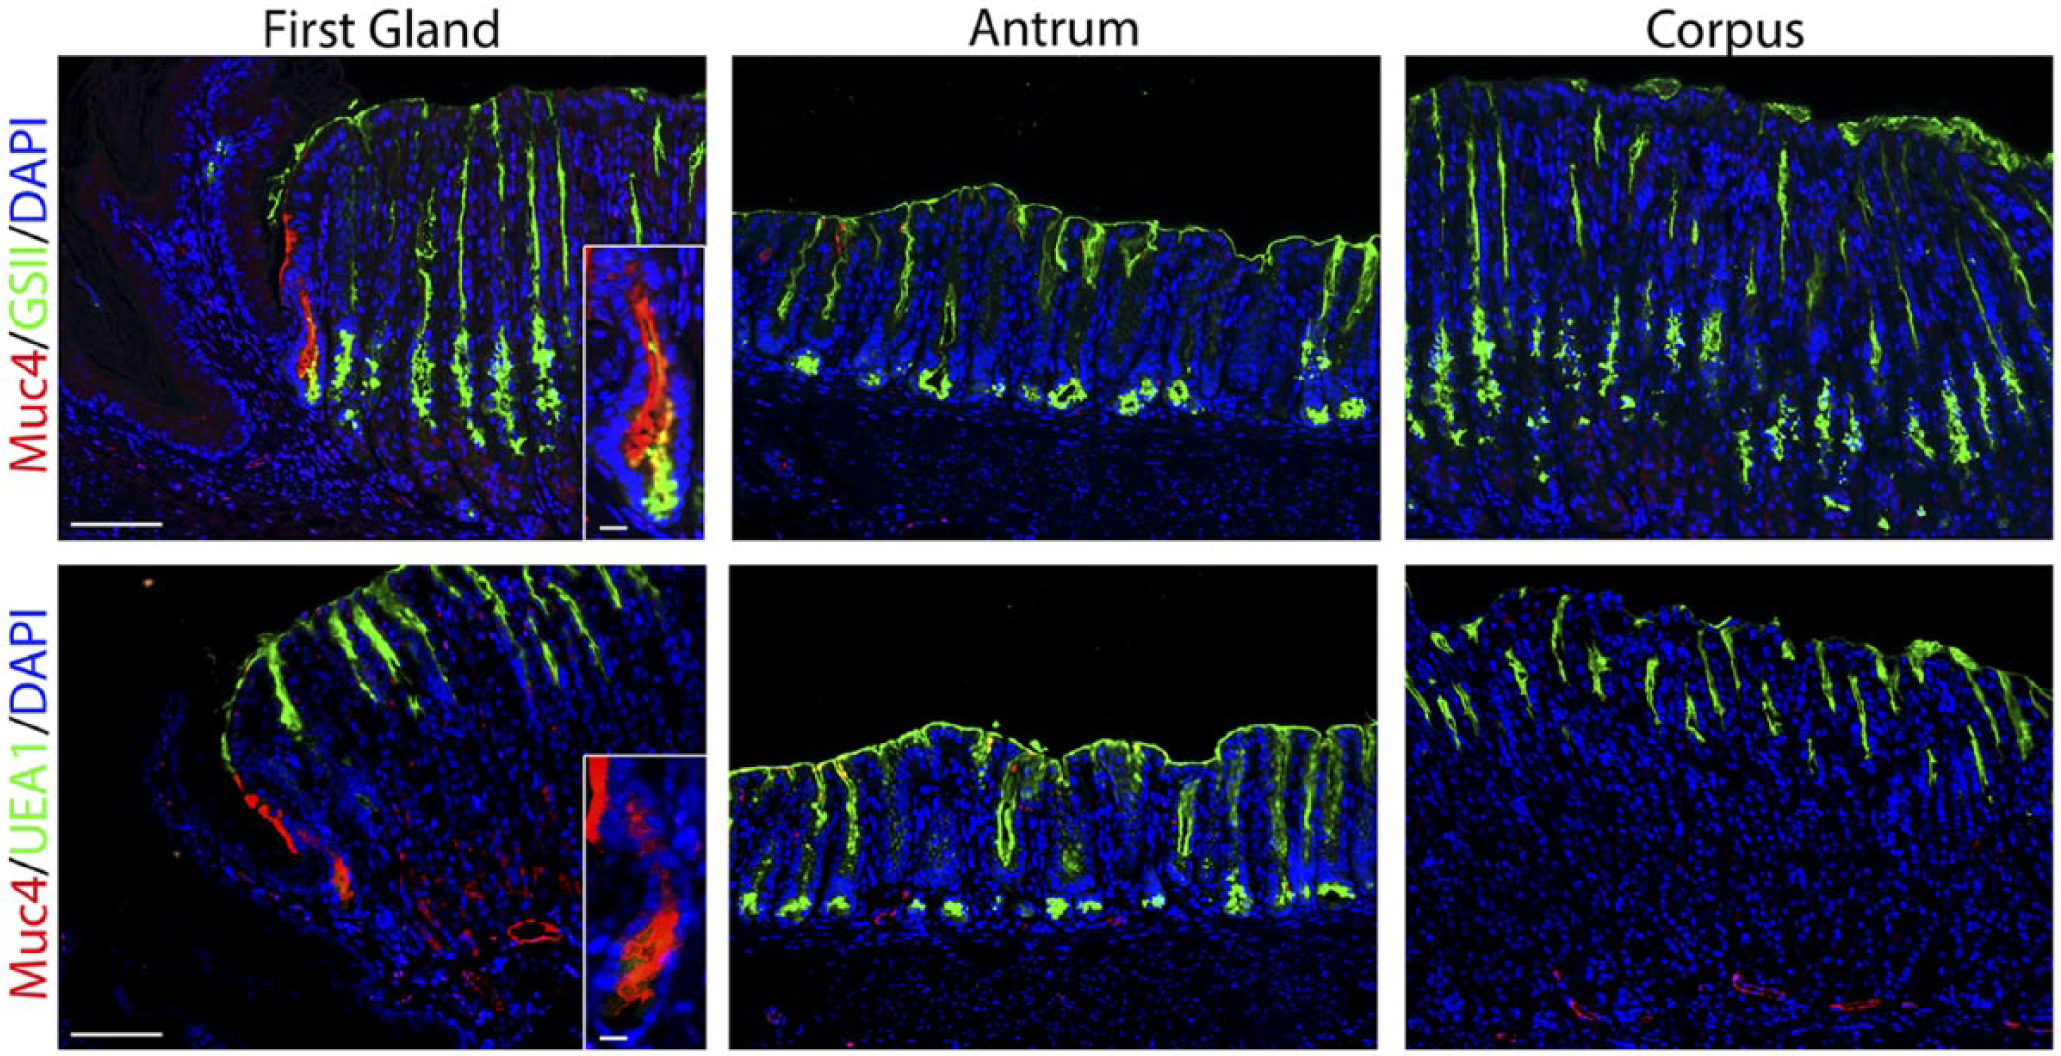
The first gland cells express MUC4. Each antibody labeling was imaged in the first gland, antrum, and corpus sections. Upper panels: Immunofluorescence antibody labeling for MUC4 (red) co-labeled with GSII-lectin (green) and DAPI (blue). Lower panel: Immunofluorescence antibody labeling for MUC4 (red) co-labeled with UEA1-lectin to label surface cells (green) and DAPI (blue). Note that in addition to staining the first gland, MUC4 staining can also be observed in some endothelial cells in the corpus and antrum submucosa. All insets show enlarged view of the first gland. Scale bars for full image = 10 µm. Scale bars for insets = 3 µm. Abbreviations: GSII, Griffonia simplicifolia-II; DAPI, 4′,6-diamidino-2-phenylindole; UEA1, Ulex europaeus agglutinin-1.
Finally, EpCAM is also highly expressed in Barrett’s esophagus. 42 Thus, we examined staining for EpCAM in comparison with MUC4 in the first gland (Fig. 6). As with MUC4, EpCAM expression was not observed in either the squamous forestomach or in the oxyntic mucosa of the corpus. However, the first gland cells stained strongly for both EpCAM and MUC4 (Fig. 6). These studies suggest that MUC4 and EpCAM specifically mark the mucinous cells of the first gland in mouse.
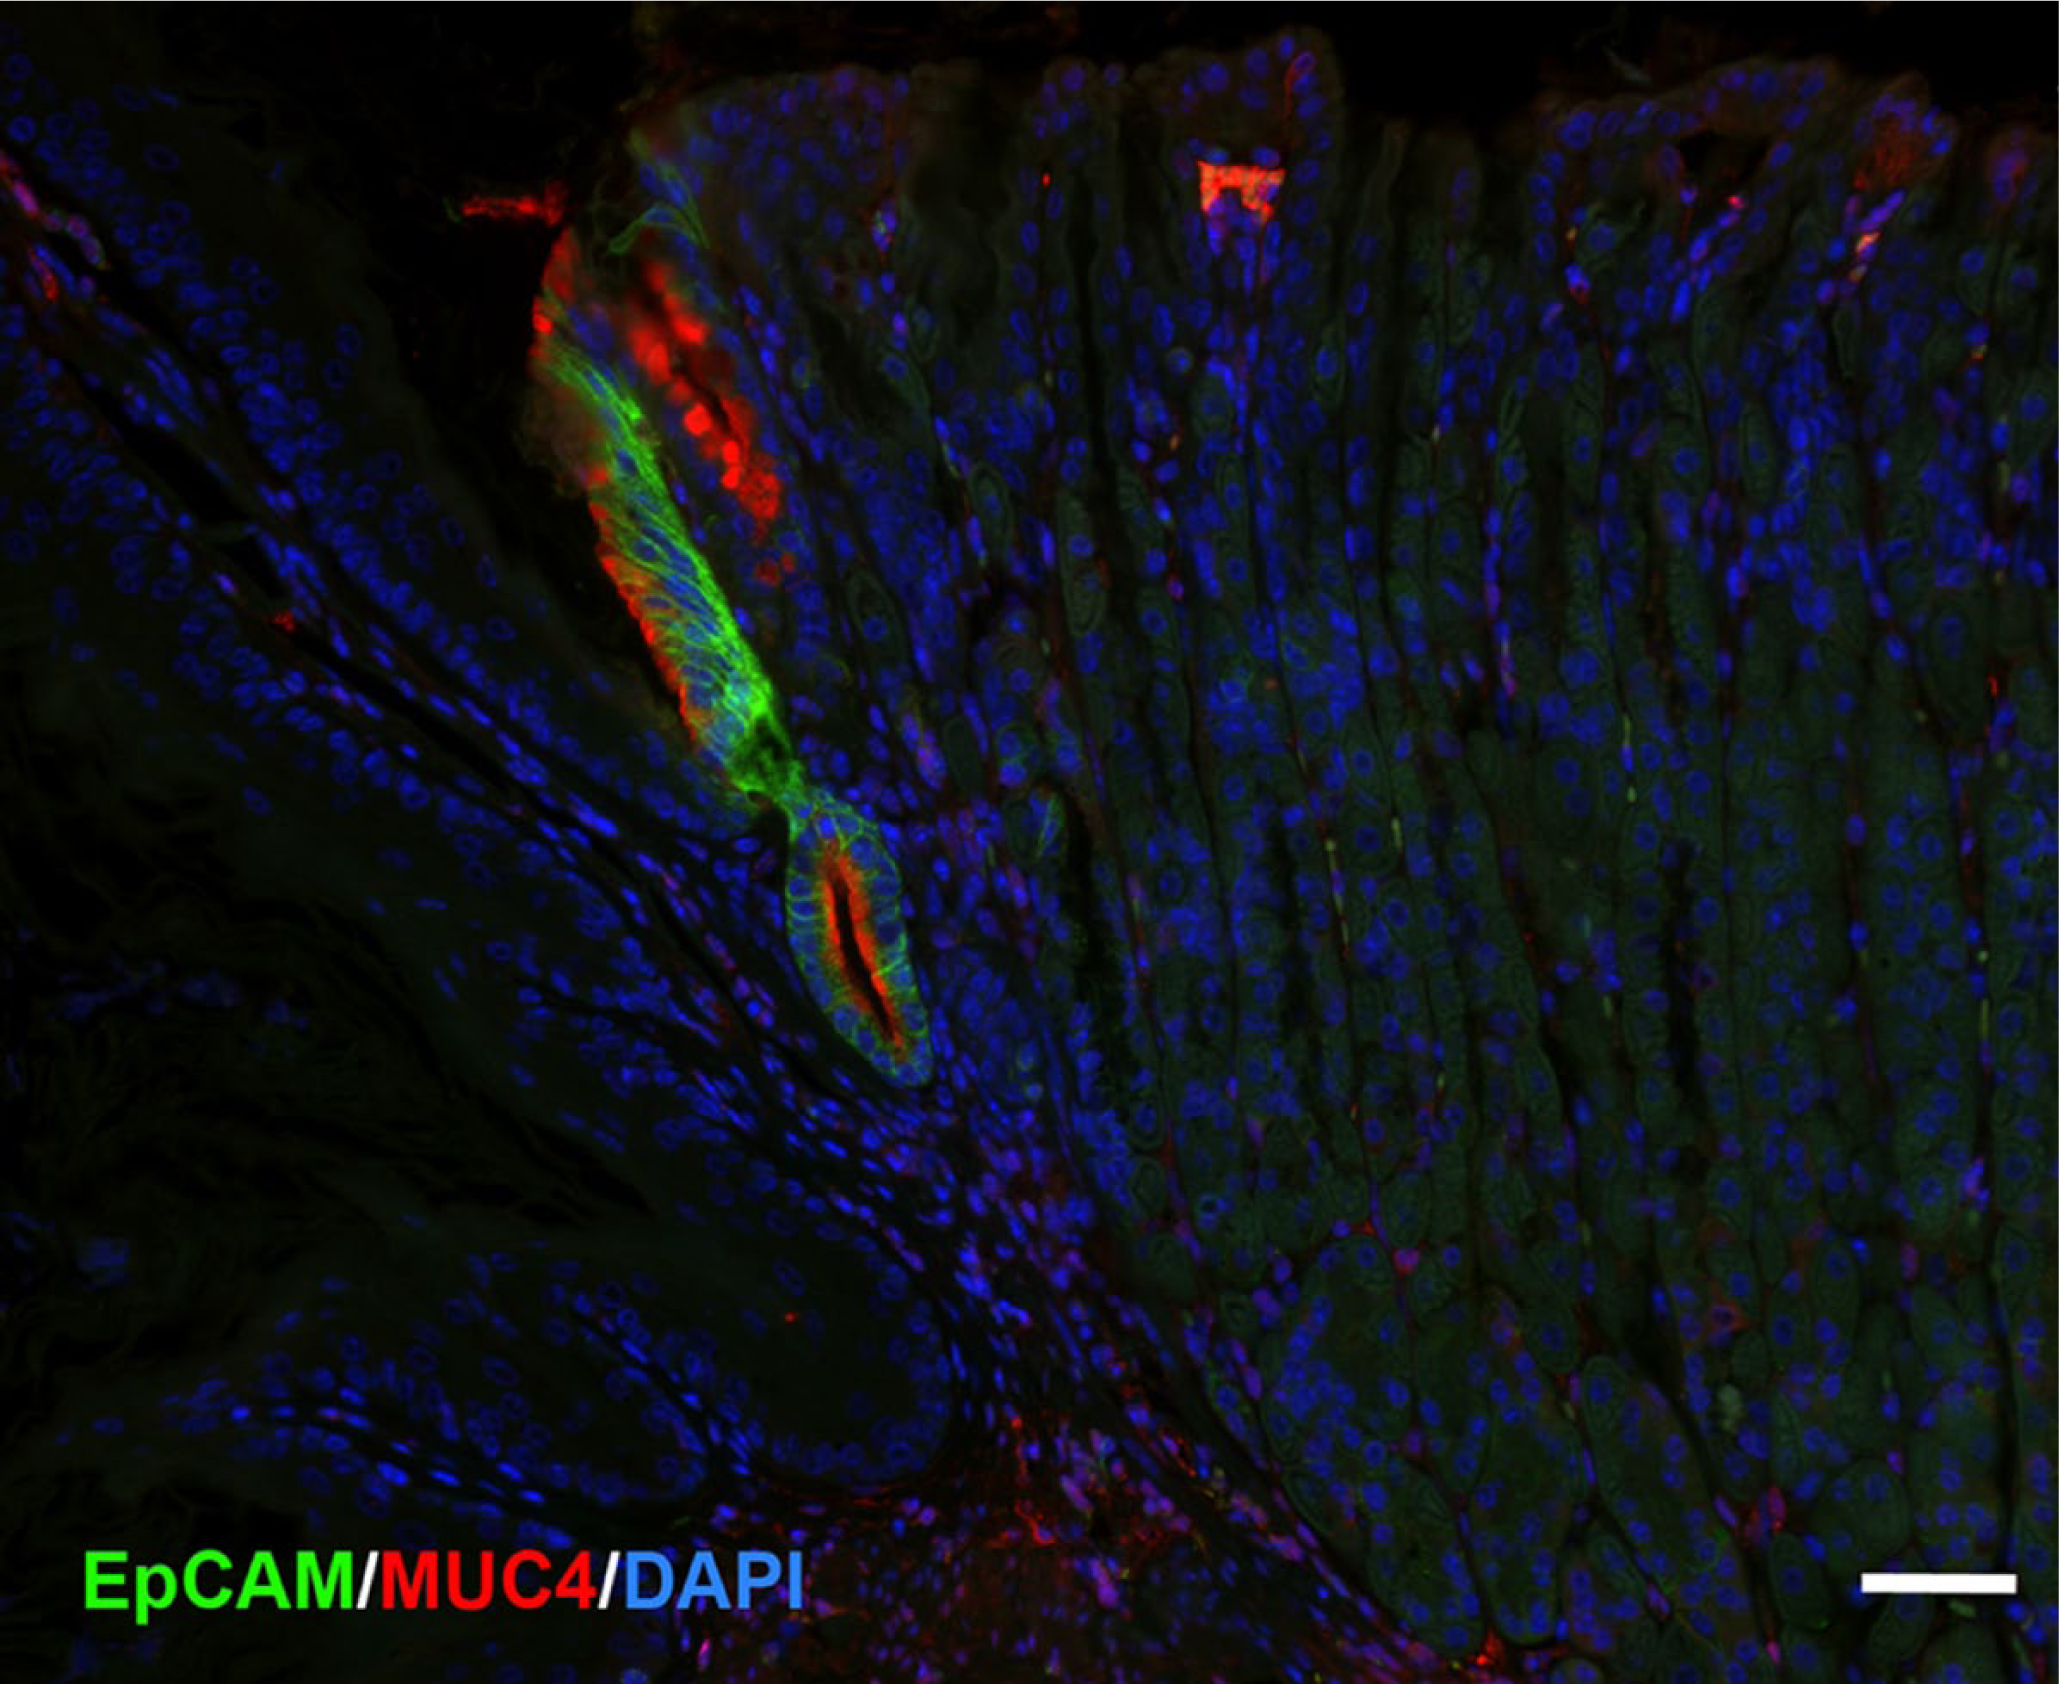
First gland cells express both EpCAM and MUC4. A section of proximal mouse gastric corpus was immunostained for EpCAM (green) and MUC4 (red) with nuclear staining for DAPI (blue). The cells of the first gland are stained for both EpCAM and MUC4. Bar = 50 µm. Abbreviation: DAPI, 4′,6-diamidino-2-phenylindole.
Discussion
The results presented here clarify the cellular makeup of the first gland in the glandular mucosa of the stomach. The findings show that the first gland has characteristics that are distinct from the glands in both the corpus and the antrum. Although some cells of the first gland were positive for markers found in cells of the corpus glands, our results indicate the first gland more closely resembles the glands of the antrum. Other markers such as Clusterin and MUC4 appear to define the first gland as a unique anatomically defined structure that marks the transition between the squamous forestomach and gastric corpus.
Lgr5 expression in the deep antral glands is characteristic of the mouse antrum.22,23 Similar to the antral glands, Lgr5-expressing cells also reside in the base of the gland. 22 In the antrum, Lgr5-positive progenitor cells give rise to all the other cell types in the antral gland. 22 Although we were unable to show Lgr5 cells actively undergoing mitosis, Ki67 staining pattern of the first gland closely resembles that of the antrum. Cells labeling with Ki67 antibody and Lgr5-GFP labeling cells were distributed toward the base of the first gland. In contrast, in adjacent corpus glands, no Lgr5-GFP positive cells were present, and the proliferative zone was located closer to the lumen. 43 Thus, the proliferative organization of the first gland appears to mimic the structure in antral glands.
The lineage characteristics of the first gland also support a more antral-like derivation. The first gland lacks both parietal cells and MIST1-expressing chief cells. GIF is usually considered a relatively characteristic marker of mouse chief cells, but, as noted here and in previous investigations, some GIF staining can be observed in scattered deep antral gland cells. 44 Similar to these antral glands, the deep cells in the first gland express only a small amount of GIF relative to the much higher levels observed in the chief cells of the corpus. These cells were positive for GSII-lectin and TFF2, but were negative for MIST1. In addition, we also observed expression of CD44v9 in the cells at the base of the first gland in a pattern that was similar to that in antral glands. CD44v9 was not expressed in the normal corpus glands. Interestingly, the gastric mucosa during development is initially lined with glands that are more characteristic of the antral mucosa, lacking both chief cells and parietal cells.45–47
Nevertheless, the first glands do not simply represent a remnant antral gland after the population of the glandular stomach with oxyntic lineages. No gastrin-expressing cells were expressed in the first gland and none of the first gland cells expressed Pdx1. These patterns are more characteristic of corpus glands. Furthermore, the first gland showed a number of unique properties. As previously reported, the first gland contains an unusually large number of tuft or brush chemosensory cells.1,2,21,48,49 In addition, the first gland cells prominently expressed Clusterin. Clusterin is considered a stress response protein and has been associated with metaplastic lineages in the stomach such as SPEM. 31 The first gland cells also prominently expressed both MUC4 and Sox2, which were not significantly expressed in the corpus and antrum, but are observed in SPEM. 31 Thus, the patterns of lineage expression show aspects of SPEM, suggesting that the first gland could have characteristics of a reparative metaplasia. Given the high expression of Clusterin and the presence of large numbers of chemosensory cells in the first gland, it is tempting to hypothesize that the first gland may represent a source for reparative lineages in the proximal stomach.
The cells in the first gland lying at the gastroesophageal junction are at the heart of discussions about the origin of columnar metaplasia in Barrett’s epithelium. 9 Furthermore, the first gland may be connected to the observation of various extents of so-called cardia mucosa, which is characterized by an absence of parietal cells and chief cells adjacent to the gastroesophageal junction.8,50 Recent studies have implicated the first gland as the source of reparative metaplasia in the setting of Barrett’s epithelium. 51 These studies have suggested that pluripotent stem cells can migrate out of the first gland into the esophagus to take up residence and generate metaplastic mucus glands. Interestingly, Barrett’s esophagus expresses a similar pattern of gene expression as that found in antral gastric glands. 43 The position of the first gland and the existence of Lgr5-postive progenitor cells as well as numerous tuft cells all support a possible role for the first gland in generating the Barrett’s epithelium. It is also notable that MUC4 and EpCAM are strongly expressed in Barrett’s epithelium.38–40,42,52,53 The first gland has also been suggested as a target for graft versus host disease. 54 In mouse models, the first gland has also been implicated in the generation of neoplastic lineages. Smad3 knockout mice notably develop invasive neoplastic lesions, which are associated with large numbers of tuft cells. 55 These invasive tumors, which are strongly positive for TFF2, appear to originate from the first gland. Similarly, in ED-L2-IL-1b transgenic mice, invasive lesions also develop that arise from the region of the first gland.56,57 The first gland has also been implicated in neoplastic lesions resulting from loss of BMPR1a. 10 These findings suggest that the first gland may represent a source of both reparative and possibly preneoplastic lineages. Further investigations will be necessary to define precisely the factors that influence such properties in the first gland unit.
Footnotes
Competing Interests
The author(s) declared no potential conflicts of interest with respect to the research, authorship, and/or publication of this article.
Author Contributions
AO performed and designed experiments, prepared figures and the manuscript draft, and edited the manuscript. CPP, EC, and ACE performed and designed experiments, prepared figures, and edited the manuscript. JRG designed experiments, prepared figures, and edited the manuscript. All authors have read and approved the final manuscript.
Funding
The author(s) disclosed receipt of the following financial support for the research, authorship, and/or publication of this article: These studies were supported by grants from a Department of Veterans Affairs Merit Review Award (I01BX000930) and National Institutes of Health (NIH) RO1 DK071590. C.P.P. was supported by an NIH–National Research Service Award (NRSA) Predoctoral Fellowship (F31 DK104600). A.O. was supported by a Summer Research Fellowship from T35 DK007383. A.C.E. was supported by an Institutional NIH Postdoctoral Fellowship (T32 CA106183). This work was supported by core resources of the Vanderbilt Digestive Disease Center (P30 DK058404), the Vanderbilt-Ingram Cancer Center (P30 CA68485), and imaging supported by the Vanderbilt Digital Histology Shared Resource.