
Abstract
Androgen receptor (AR) and prostate-specific antigen (PSA) are expressed in the prostate and are involved in prostate cancer (PCa). The aim of this study was to develop reliable protocols for reproducible quantification of AR and PSA in benign and malignant prostate tissue using time-resolved fluorescence (TRF) imaging techniques. AR and PSA were detected with TRF in tissue microarrays from 91 PCa patients. p63/ alpha-methylacyl-CoA racemase (AMACR) staining on consecutive sections was used to categorize tissue areas as benign or cancerous. Automated image analysis was used to quantify staining intensity. AR intensity was significantly higher in AMACR+ and lower in AMACR- cancer areas as compared with benign epithelium. The PSA intensity was significantly lower in cancer areas, particularly in AMACR- glands. The AR/PSA ratio varied significantly in the AMACR+ tumor cells as compared with benign glands. There was a trend of more rapid disease progression in patients with higher AR/PSA ratios in the AMACR- areas. This study demonstrates the feasibility of developing reproducible protocols for TRF imaging and automated image analysis to study the expression of AR and PSA in benign and malignant prostate. It also highlighted the differences in AR and PSA protein expression within AMACR- and AMACR+ cancer regions.
Keywords
Introduction
Prostate cancer (PCa) is one of the most common cancers in men (IARC 2012). Measuring prostate-specific antigen (PSA) in the blood is a very sensitive means to detect increased risk of lethal disease at a very early stage but it lacks specificity at slightly to moderately elevated levels (Vickers et al. 2013). There is a need for new biomarkers that could aid in the better detection of PCa, predict patient outcomes, or allow for targeted therapy in certain patients (Bjartell et al. 2011). Biomarkers at the protein level are commonly detected by immunohistochemistry (IHC); however, due to a lack of standardized quantification methods, the results are often difficult to interpret and thus difficult to implement in clinical practice.
To solve some of the problems related to IHC quantification, there has been increased interest in digital pathology and automated digital image analysis solutions in the recent years (Al-Janabi et al. 2012; Di Cataldo et al. 2012). Thanks to high-quality scanners and software, the digitalization and quantification of standard IHC is becoming more common (Dahlman et al. 2011; Konsti et al. 2011), whereas quantification of immunofluorescence (IF) still needs further development.
Although IF provides the advantage of multiple staining of the same tissue section, the problems include bleaching of the fluorescent signal and difficulties in using IF on paraffin-embedded tissue as a result of background autofluorescence, which can be distracting. An alternative to IF is time-resolved fluorescence (TRF) imaging, which uses lanthanide chelates, such as europium or terbium, conjugated to antibodies, for direct or indirect IF (Sevéus et al. 1992; Bjartell et al. 1999a; Väisänen et al. 2000). TRF offers particular advantages over conventional IF in terms of a lack of autofluorescence, a low frequency of non-specific signals, stability over multiple exposures, linear signal-to-concentration aspect, and the benefit in terms of its multiplexing capabilities (Sevéus et al. 1994; Bjartell et al. 1999b)
Androgen receptor (AR) signaling is critical to normal development of the prostate as well as in its malignant transformation and progression, with AR signaling commonly dysregulated at advanced stages of PCa (Kim and Coetzee 2004; Zhou et al. 2015). Increased AR expression in cancer has been reported to be associated with shorter disease-free survival (Li et al. 2004; Inoue et al. 2005; Cordon-Cardo et al. 2007). However, the prognostic role of AR expression in PCa is not completely understood, and quantitative methods to reliably determine AR expression have not been developed (Mohler 2008). PSA protein has been reported to be downregulated in PCa as compared with its expression in benign tissue (Erbersdobler et al. 2009). Even though PSA is regulated by AR, no studies to date have investigated their co-expression patterns, mainly due to methodological shortcomings.
Many studies show that there is a difference between the expression of proteins in cancerous versus benign glands. In IHC analysis, the distinction between cancer and benign can prove to be difficult due to the fact that malignant glandular structures and scattered tumor cells infiltrate the stroma and are intermingled with benign epithelium. Recent developments in digital pathology are paving the way for the improvement of such methods.
IHC staining for the cytoplasmic alpha-methylacyl-CoA racemase (AMACR) (Luo et al. 2002; Jiang et al. 2004) combined with the basal cell marker p63 (Signoretti et al. 2000; Weinstein et al. 2002) is commonly used in pathology to help to distinguish cancerous from benign glands in the prostate (Varma and Jasani 2005). Whilst AMACR staining has a relatively high specificity for malignant cells, a decrease in its expression has been observed in more advanced cancers (Rubin et al. 2005); as such, a distinction between AMACR-positive (AMACR+) and AMACR-negative (AMACR-) cancer regions may be of clinical importance.
In this study, we set out to use TRF imaging to investigate the expression of AR and PSA protein in PCa tissue microarrays (TMAs). The TRF method allows the co-staining the two antigens on the same tissue and results in a highly quantifiable, specific and sensitive signal with low autofluorescence. Moreover, with the aid of digital section alignment and automated image analysis algorithms, we distinguished benign from cancer epithelium within tissue samples and quantified the protein expression that is specific to these areas.
Materials & Methods
Patient Material
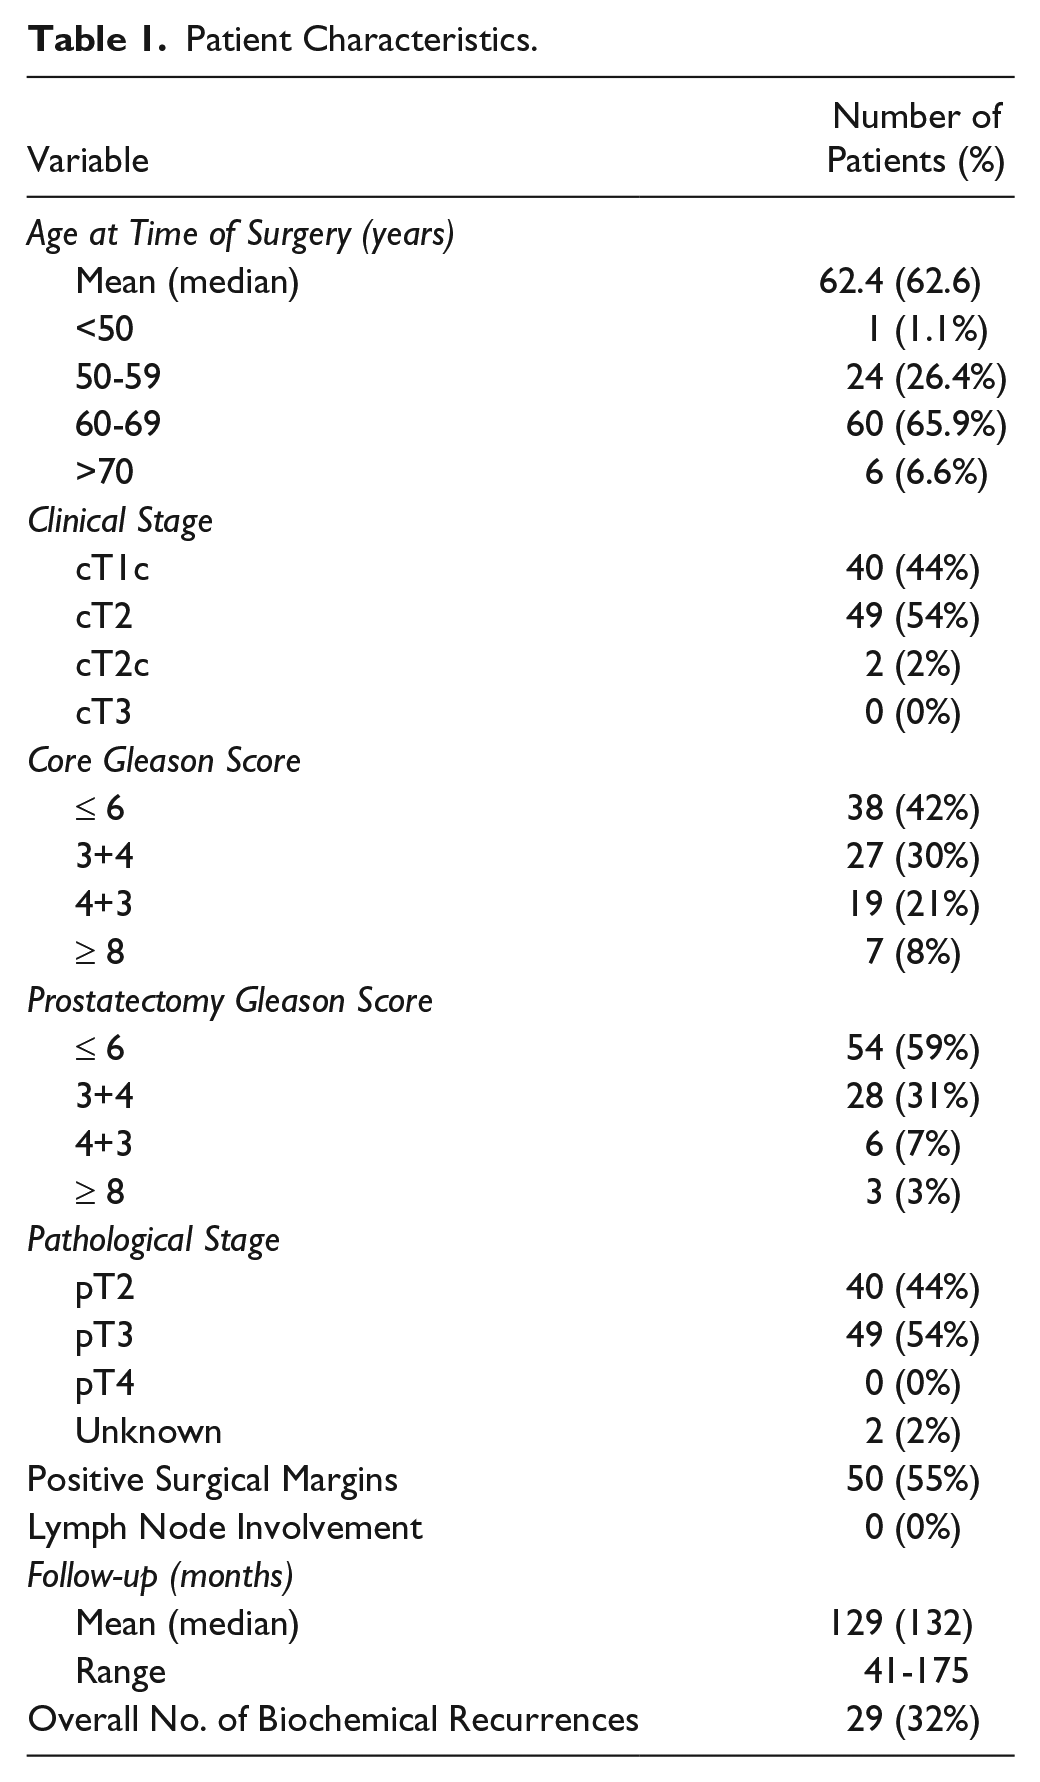
A TMA was constructed using a previously described protocol (Tassidis et al. 2010) from a population-based cohort of PCa patients who underwent open radical prostatectomy between 1998 and 2006 at the Department of Urology, Skåne University Hospital, Malmö, Sweden. Benign and malignant cores from each patient were mounted on paraffin blocks. The cores were 1 mm in diameter. Consecutive sections from five blocks (comprising 148 patients) were used for IHC and TRF studies. Hematoxylin & eosin (H&E)-stained cores were scored by a senior pathologist and assigned a Gleason score. The clinical and pathological characteristics of the PCa patients were obtained from patient charts and are shown in Table 1. The mean follow-up time was 133.4 months (range, 41–175 months). Biochemical recurrence (BCR) was used as an outcome measurement and is defined as a blood PSA level of at least 0.2 ng/ml with a subsequent confirmatory value. Only patients with corresponding benign and cancer cores (confirmed by the pathologist) were included in the study, with one cancer core and one benign core analyzed for each patient. Fifty-seven patients were excluded because of missing cores, missing patient information, a lack of glandular structure, or because the patient received adjuvant therapy. The final number of patients used for analysis was 91. The study was approved by the Local Ethics committee at Lund University (no. 494/2005).
Patient Characteristics.
Immunohistochemistry (IHC)
Paraffin sections (4-μm thick) from the TMA blocks were used for routine IHC and TRF. Antigen retrieval of the deparaffinized tissue sections was performed using a PT-Link module (DAKO; Glostrup, Denmark) at 95°C to 99°C for 20 min in 0.01 M citric acid buffer (pH 6.0) prior to immunostaining for mouse anti-PSA (1:200; clone 2E9 (Pettersson et al. 1995)) and mouse anti-AR (1:400; clone AR-441, Neomarkers, Freemont, CA) with a standard IHC protocol. To recognize benign and malignant epithelium, we used double-immunostaining with mouse anti-p63 (1:50; clone 4A4, NordicBiosite, Sweden) and rabbit anti-AMACR (1:100; clone 13H4, LS Bio, Seattle, WA), followed by secondary antibodies with a mixture of anti-rabbit-ALP and anti-mouse HRP conjugates (DAKO).
For TRF, a series of sections, consecutive to the p63/AMACR, was triple-stained for AR/PSA/pancytokeratin (see protocol below). After obtaining TRF images, the coverslip was removed and the sections were stained with Meyer’s hematoxylin solution, and coverslips were mounted in Cytoseal XYL (Richard–Allan Scientific; Kalamazoo, MI). The H&E stain was performed to aid the automatic registration and to obtain Gleason scores of the cores used for analysis.
TRF Immunostaining Protocol
Lanthanide chelate-labelled antibodies were prepared by K. Pettersson and M. Peltola at the Department of Biotechnology at Turku University. The methods were adapted from those of Väisänen and colleagues as described in Väisänen et al. (2000) and von Lode et al. (2003).
Antibodies used for TRF chelate labelling were monoclonal 2E9 clone for PSA (a gift from HL) and monoclonal AR antibody, clone 441 from NeoMarkers. The antibodies were labelled with terbium (Tb) and europium (Eu), respectively. The chelate labelling reaction was carried out in 50 mmol/L carbonate buffer (pH 9.8) at 4°C overnight or at room temperature for 1 hr, using a ×30 molar excess of chelate. The labelled mAb was separated from free chelate by size fractionation using a Superdex 200 HR 10/30 column in a FPLC system (Pharmacia Biotech; Uppsala, Sweden) with 50 mmol/L Tris-HCl (pH 7.4), 0.9% NaCl, 0.05% NaN3 as an elution buffer. The labelling degree was determined by calculating protein and Tb/Eu content of the labelled antibody. The Tb/Eu ions were removed from the chelate with 0.1 mol/L HCl and diluted in DELFIAI enhancement solution; 15 min in 0.1 mol/L HCl was observed to separate all Tb/Eu ions from the chelate structure. With subsequent dilution in DELFIAI enhancement solution, the signal could be reliably measured and compared to a Tb/Eu standard (Perkin-Elmer Life Sciences; Turku, Finland). Protein concentration was determined by the Bradford method (Bio-Rad Protein Assay, Bio-Rad Laboratories; Hercules, CA). The obtained concentration of AR-Eu was 149 µg/ml and PSA-Tb was 312 µg/ml. For immunostaining, the final dilutions were 1:50 and 1:25, respectively.
The sections were deparaffinized and antigen retrieval was performed as described above. After rehydration, the tissue sections were rinsed three times in 50 mmol/L Tris-HCl (pH 7.6), 0.9% NaCl. The anti-AR-Eu, anti-PSA-Tb and anti-pCK-FITC (1:50; monoclonal clone PCK-26, Sigma-Aldrich, St Louis, MO) antibody mix was applied in a humidified dark chamber in Tris buffer with 2% bovine serum albumin (BSA, Sigma-Aldrich) and left overnight at 4°C. The next day, the slides were washed in Tris buffer and dehydrated with a series of increasing concentrations of ethanol, incubated in xylene for 10 min, and mounted with Merckoglas (Merck Millipore; Darmstadt, Germany).
Image Acquisition
A 20× magnification image of every IHC-stained slide was taken using the Aperio ScanScope XT Slide Scanner (Aperio Technologies; Vista, CA) system for brightfield microscopy. For TRF images, a Nikon Eclipse E600 light microscope with ET630/50m and ET560/40m as well as standard FITC filters (Chroma Technologies; Bellows Falls, VT) was used, as previously described (Väisänen et al. 2000). Images were captured with the aid of a cooled scientific CCD camera, Apogee Alta U32 (Apogee Imaging Systems; South Windsor, CT) and ImageProPlus software (Media Cybernetics; Rockville, MD).
A 60-W Xenon flash lamp (Perkin-Elmer Life Sciences; Boston, MA) was used for pulsed excitation at 340 nm wavelength, and the following conditions used for detection of Eu/Tb-chelate luminescence: emission wavelength, 615/545 nm; excitation pulse length, 1 µs; pulse energy, 0.4 J/pulse; delay time after excitation, 300 µs; detection period after excitation, 1200 µs; repetition frequency of excitation and detection, 500 Hz; and measurement time, 30s. One photo from each of the three filters was taken per core at 20× magnification. Areas photographed were chosen randomly but with at least some glands present in the image.
Image Analysis
The scripts in all of the steps outlined below were created using the Matlab (Mathworks Inc; Natick, MS) and CellProfiler software (Lamprecht et al. 2007). A flow diagram of the image analysis method is shown in Fig. 1, and more details, including images and masks, can be seen in Fig. 2.
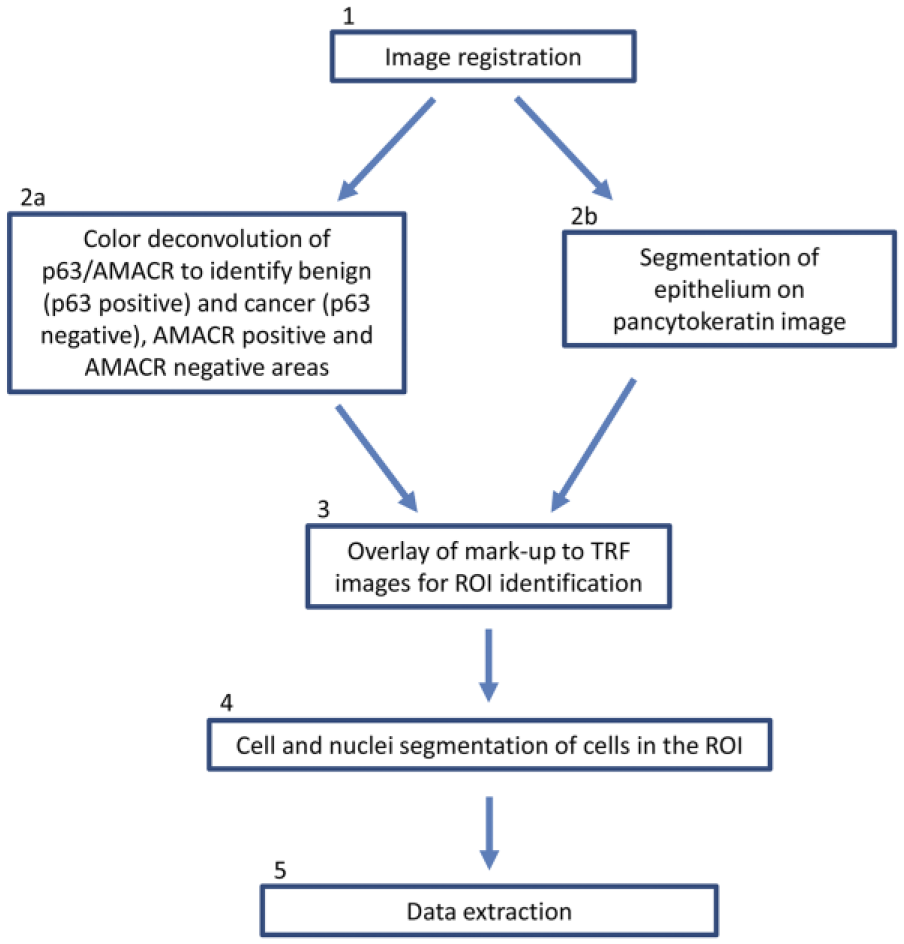
Flow diagram of the image analysis process. Full details of the process can be found under the subheading ‘Image Analysis’ in the Materials & Methods. Numbers correspond to the processing steps written in parentheses for each sub-section.
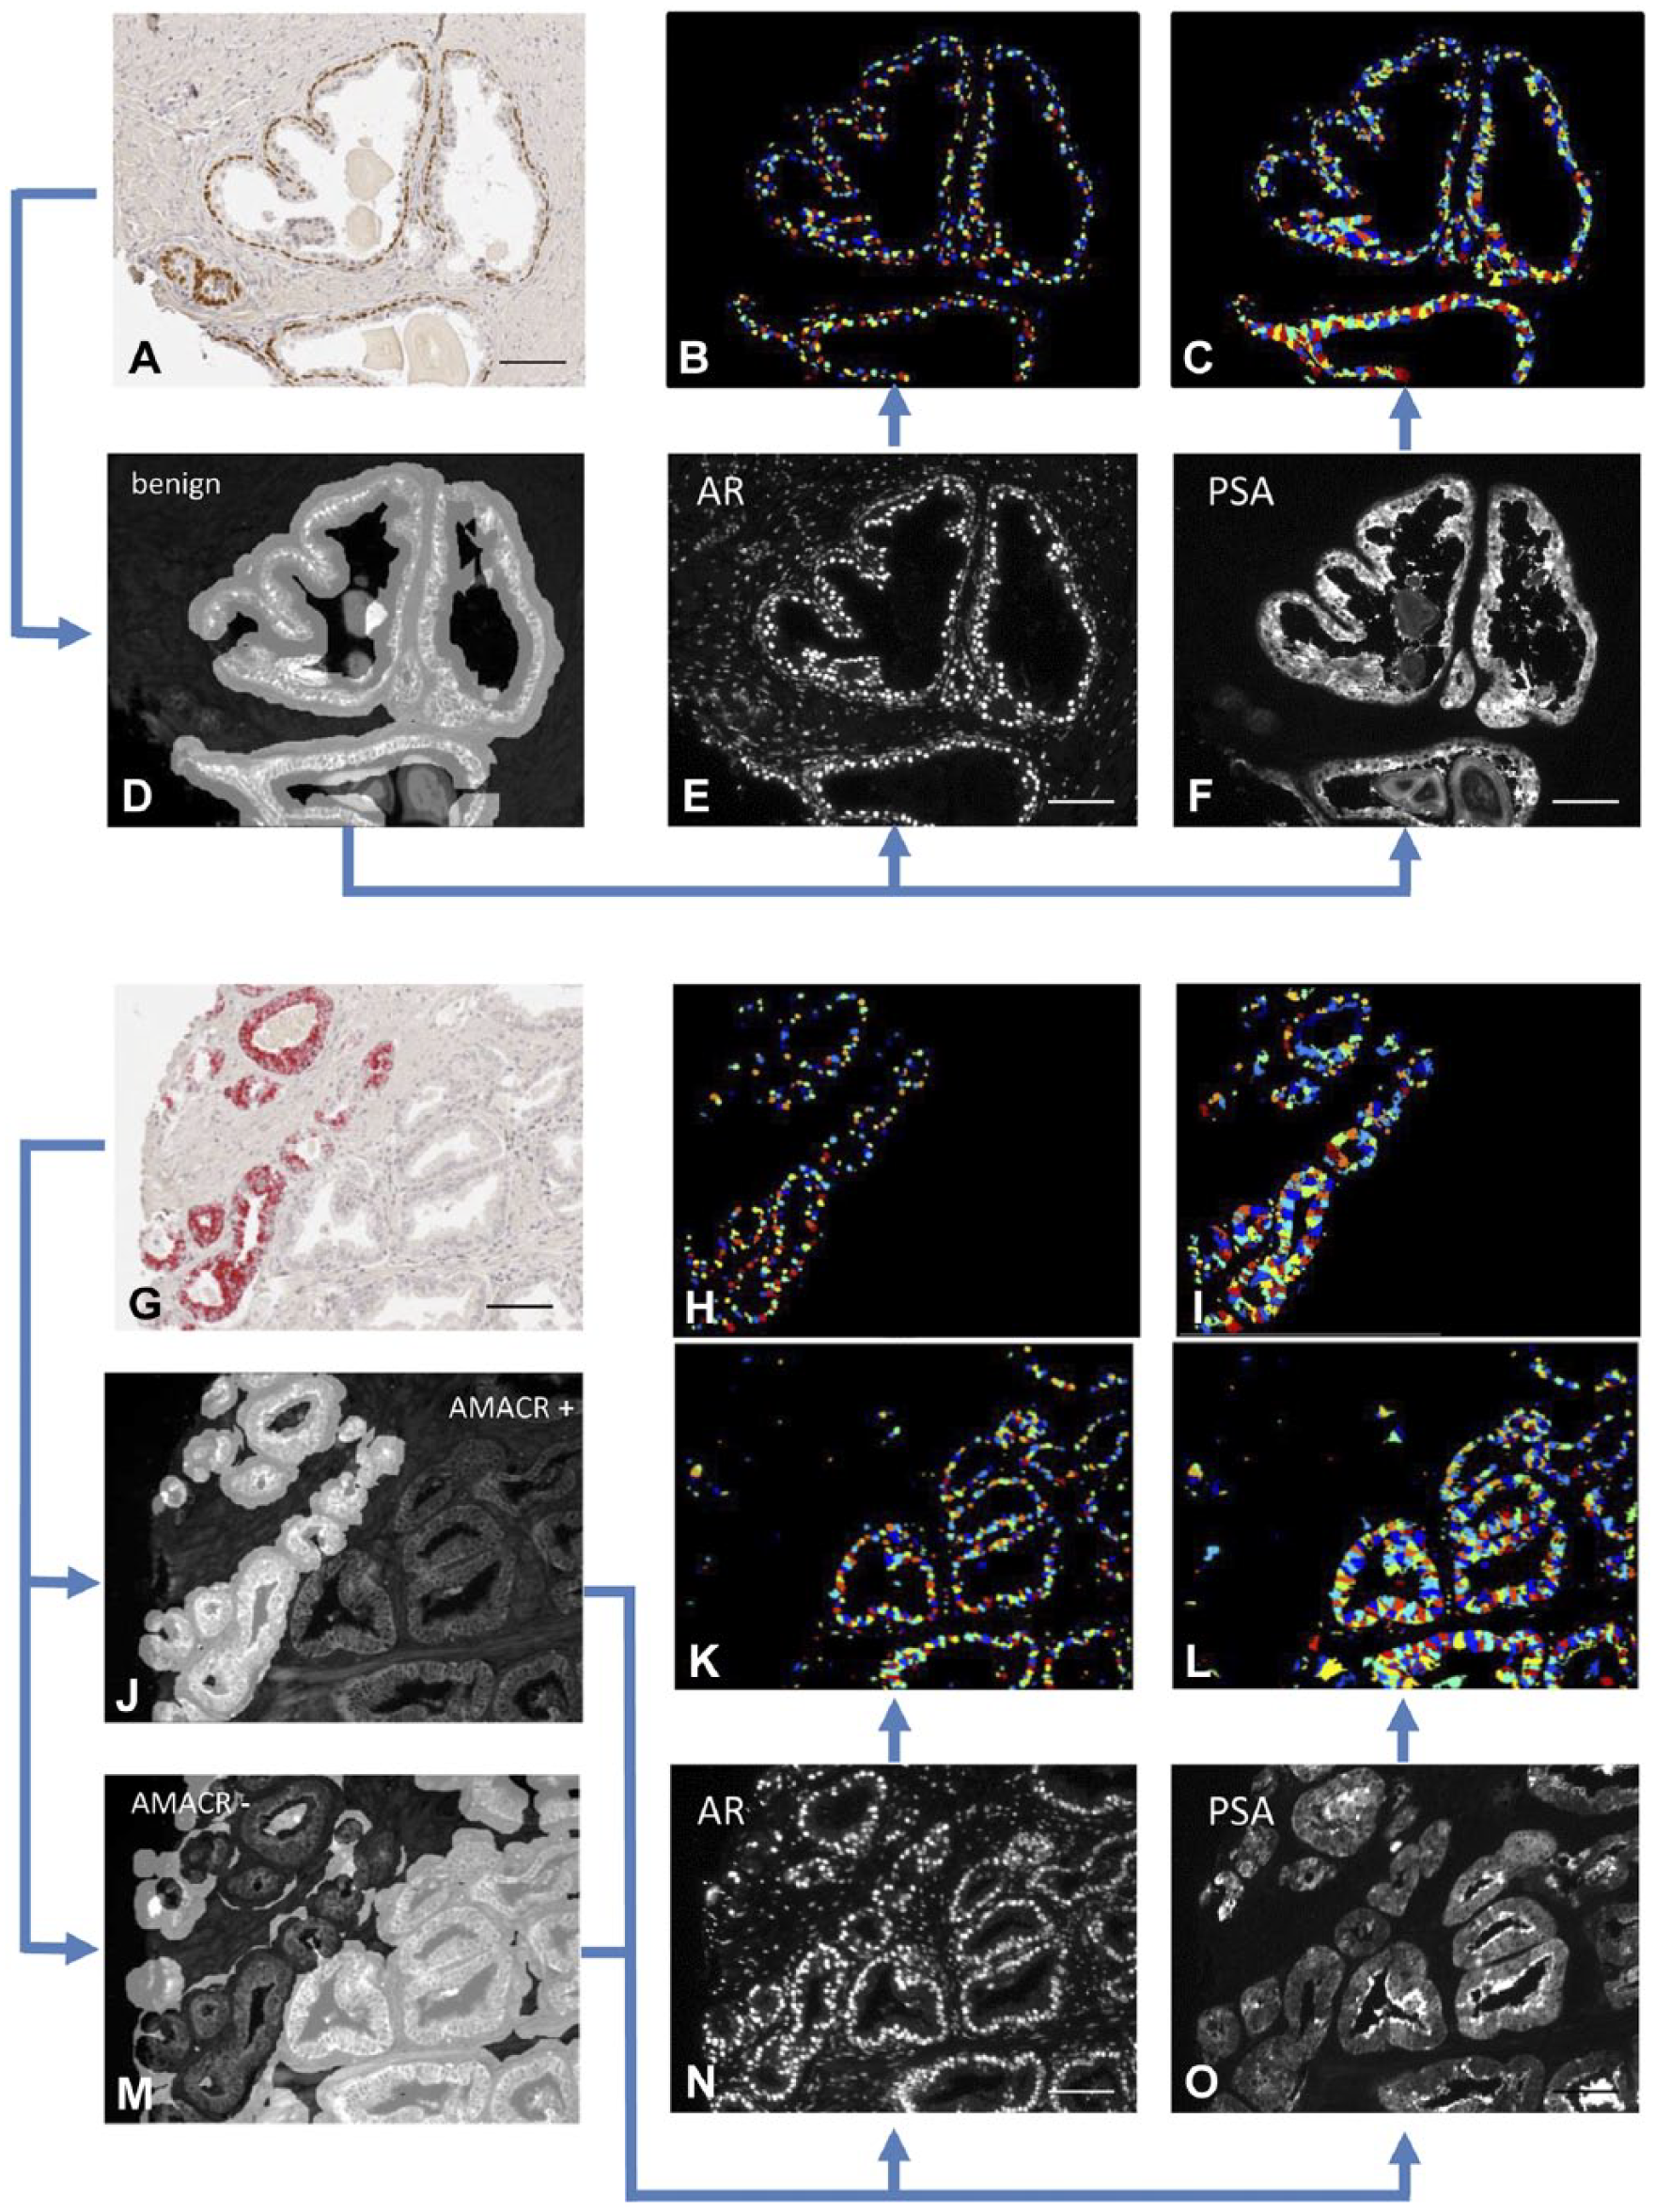
Alignment, classification and mark-up of images. Prostate cancer tissues were immunostained for p63/AMACR (A and G) and consecutive sections were triple-labelled with pancytokeratin-FITC (D, J, M), AR-Eu (E, N) and PSA-Tb (F, O). An algorithm was applied that differentiated benign areas (p63 positive, D) from cancerous areas (p63 negative; AMACR positive (J) and negative (M) areas were calculated separately). Pancytokeratin staining (D, J, M) was used to differentiate epithelial tissue from stroma and lumini. The benign/cancer mark-up was applied to the pancytokeratin delineated areas. Another algorithm was applied to distinguish between nuclei and cytoplasm. The mean intensities of AR in the nuclei (B, H, K) and of PSA in the cytoplasm (C, I, L) were calculated for each image. AR, androgen receptor; PSA, prostate-specific antigen; AMACR, alpha-methylacyl-CoA racemase. Scale, 200 µm.
(1) Automated Registration and Alignment
Automated registration and alignment of the IHC, H&E and TRF images was conducted. A detailed registration protocol can be found in (Lippolis et al. 2013).
(2) Identification of Regions of Interest (ROIs)
(2A) Automated Segmentation of the IHC Image
Color deconvolution (Ruifrok and Johnston 2001) of the three stains (brown, red and blue) was performed in the RGB color space in order to obtain the three deconvoluted channels for p63, AMACR, and rest of the tissue (hematoxylin), respectively. A binary mask for glands containing p63-positive basal cells (assigned as benign) and AMACR-containing glands (assigned as AMACR+ cancer) was obtained by choosing an appropriate threshold for each channel. Morphological operations were then used to delete noisy pixels and dilate selected areas. Sixty-eight of 91 cancer cores included both AMACR-positive and AMACR-negative glands, and 33 of 91 cancer cores included benign, AMACR-positive and AMACR-negative glands. All 91 benign cores produced only benign masks.
(2B) Segmentation of the IF Image
Automatic segmentation of the pancytokeratin image, based on textural features of the glands versus stroma and background, was performed. The limits of detection were based on the average of sampled background values plus two SDs. The average intensity of the background was comparable amongst the different cores. First, a spectral residual saliency filter (Hou and Zhang 2007) was applied to highlight significant characteristics of the epithelium, including small glandular structures. Next, an entropy filter was applied to increase the separation between areas with different texture. Finally, the image was oversegmented by using a modified version of the SLIC superpixel segmentation (Achanta et al. 2012). This method allowed us to have superpixels with a uniform texture inside and that adhere to the borders of the glandular structures. The final segmentation of epithelial cells and the rest of the sample is performed through k-means clustering of superpixel mean intensity and SD. Once the epithelium was identified, the resulting ROI was combined with the benign and AMACR+ region masks. This produced benign, AMACR+ regions and, consequently, allowed us to exclude AMACR- epithelial regions and stromal regions from analysis.
(3) Overlay of Mark-up to TRF Images for ROI Identification
The areas segmented based on the p63/AMACR staining (as per section 2A) were overlaid with the areas segmented based on the pancytokeratin staining (as per section 2B). This ensured that only epithelial areas were included in the ROIs.
(4) Cell Segmentation
Robust background thresholding and morphological smoothing was used to identify cell nuclei on the AR image. The method assumes that the ‘background’ distribution approximates a Gaussian distribution by trimming the brightest and dimmest 5% of pixel intensities. Then, it calculates the mean and SD of the remaining pixels and calculates the threshold as the mean plus two SDs. The size of the smoothing filter is automatically calculated based on the typical diameter of objects, in pixel units (Min, Max). Then, a propagation algorithm, which uses nuclei as seeds and the cytokeratin image to segment the cells, was used to define nuclei and cytoplasm.
(5) Data Extraction
Intensities of nuclear AR and cytoplasmic PSA were measured and average intensities were calculated for the separate regions (benign, AMACR+ and AMACR-) for each image. The values for pixel intensity were based on the 16-bit scale. One mean staining intensity value was obtained per image, per category (benign, AMACR+ and AMACR-) and used for the calculations.
All of the produced mark-ups for ROIs were revised and those considered far off from a correct segmentation were manually delineated and classified as benign, AMACR+ and AMACR- cancers; this, however, occurred in very few cases (<10%). Each core was checked for the correct assignment of cancer or benign by a pathologist. No prostatic intraepithelial neoplasia (PIN) samples were included in the analysis.
Statistical Analysis
All calculations and statistical analyses were performed using SPSS version 22 software (IBM; Chicago, IL). Spearman’s Rho was used to determine correlations between variables. Comparisons between paired groups were performed using a paired t-test or Wilcoxon Signed Ranks test for non-normally distributed data. One-way ANOVA with Dunnet’s post-hoc (normally distributed data) or ANOVA on ranks with Dunn’s post-hoc test (non-normally distributed data) was used for non-paired comparisons. Cox proportional hazard regression and Kaplan–Meier with Log-rank test were used to determine a possible association between variables and clinical outcome. p≤0.05 determined significant differences between groups.
Results
Antibody Validation
The specificity of the AR-Eu and PSA-Tb antibodies was verified with the aid of AR- and PSA-positive and -negative cell lines and tissues (Supplementary Fig. 1). The suitability of TRF for biomarker quantification was confirmed by obtaining a linear relationship between the antibody concentration and the observed signal intensity (Supplementary Fig. 2A–2C). Moreover, we confirmed that the TRF antibodies were more resistant to bleaching as compared with regular fluorescent antibodies (Supplementary Fig. 2D). When consecutive sections were immunostained with standard IF and for TRF, the images obtained from TRF sections demonstrated a superior quality over staining with standard IF, with more intense signal and lower background fluorescence (Fig. 3). Figure 4 demonstrates the very similar staining patterns for AR and PSA using IHC and TRF on consecutive sections.
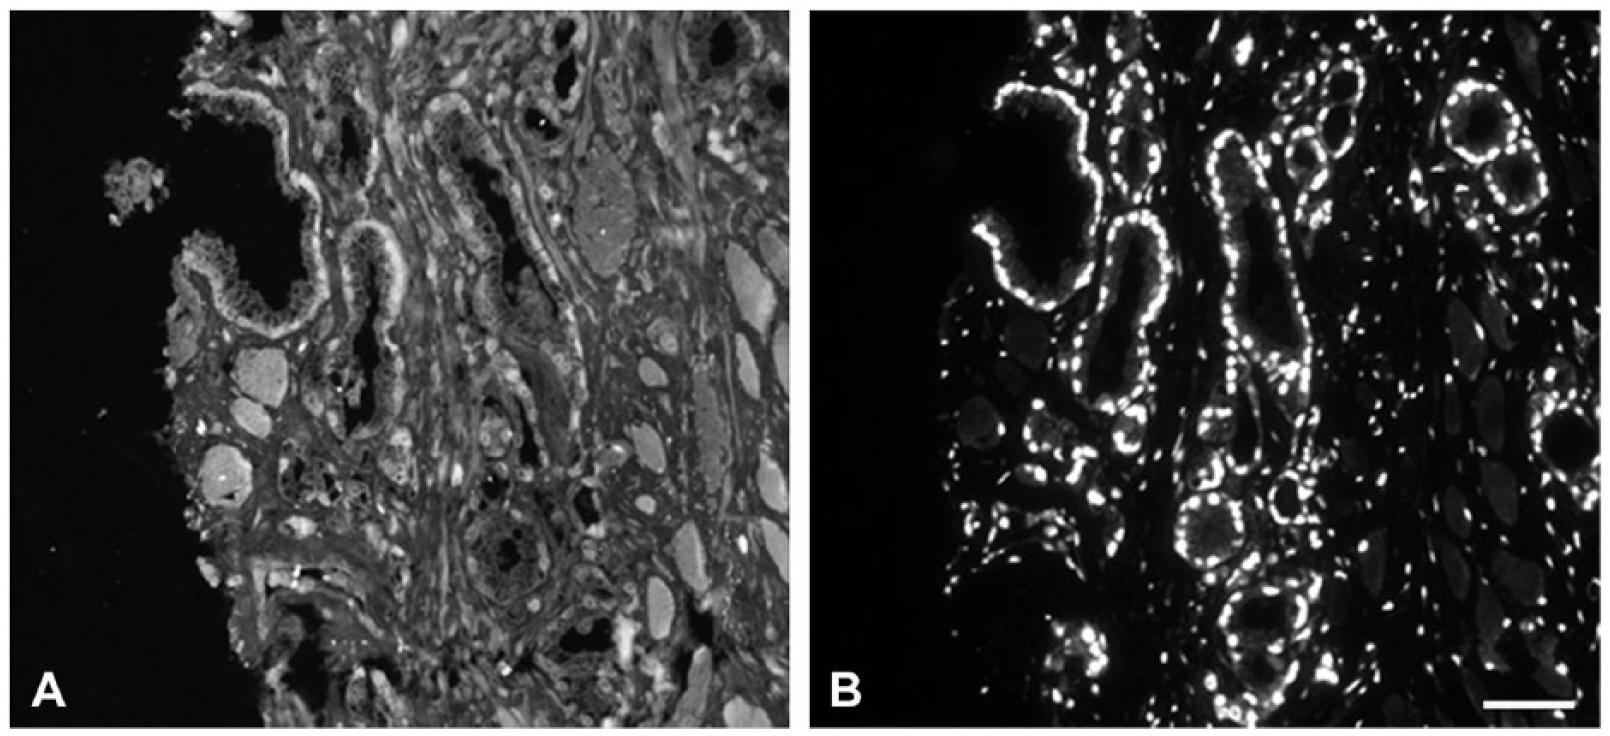
Comparison of normal IF and TRF. Consecutive sections immunostained with AR-IF (A, two-step labelling of AR with clone AR-441 antibody, 1:25, recognized with a FITC-labelled secondary) and AR-TRF (B, clone AR-441, 1:50; directly labelled with Eu chelate). AR, androgen receptor; TRF, time-resolved fluorescence. Scale, 50 µm.
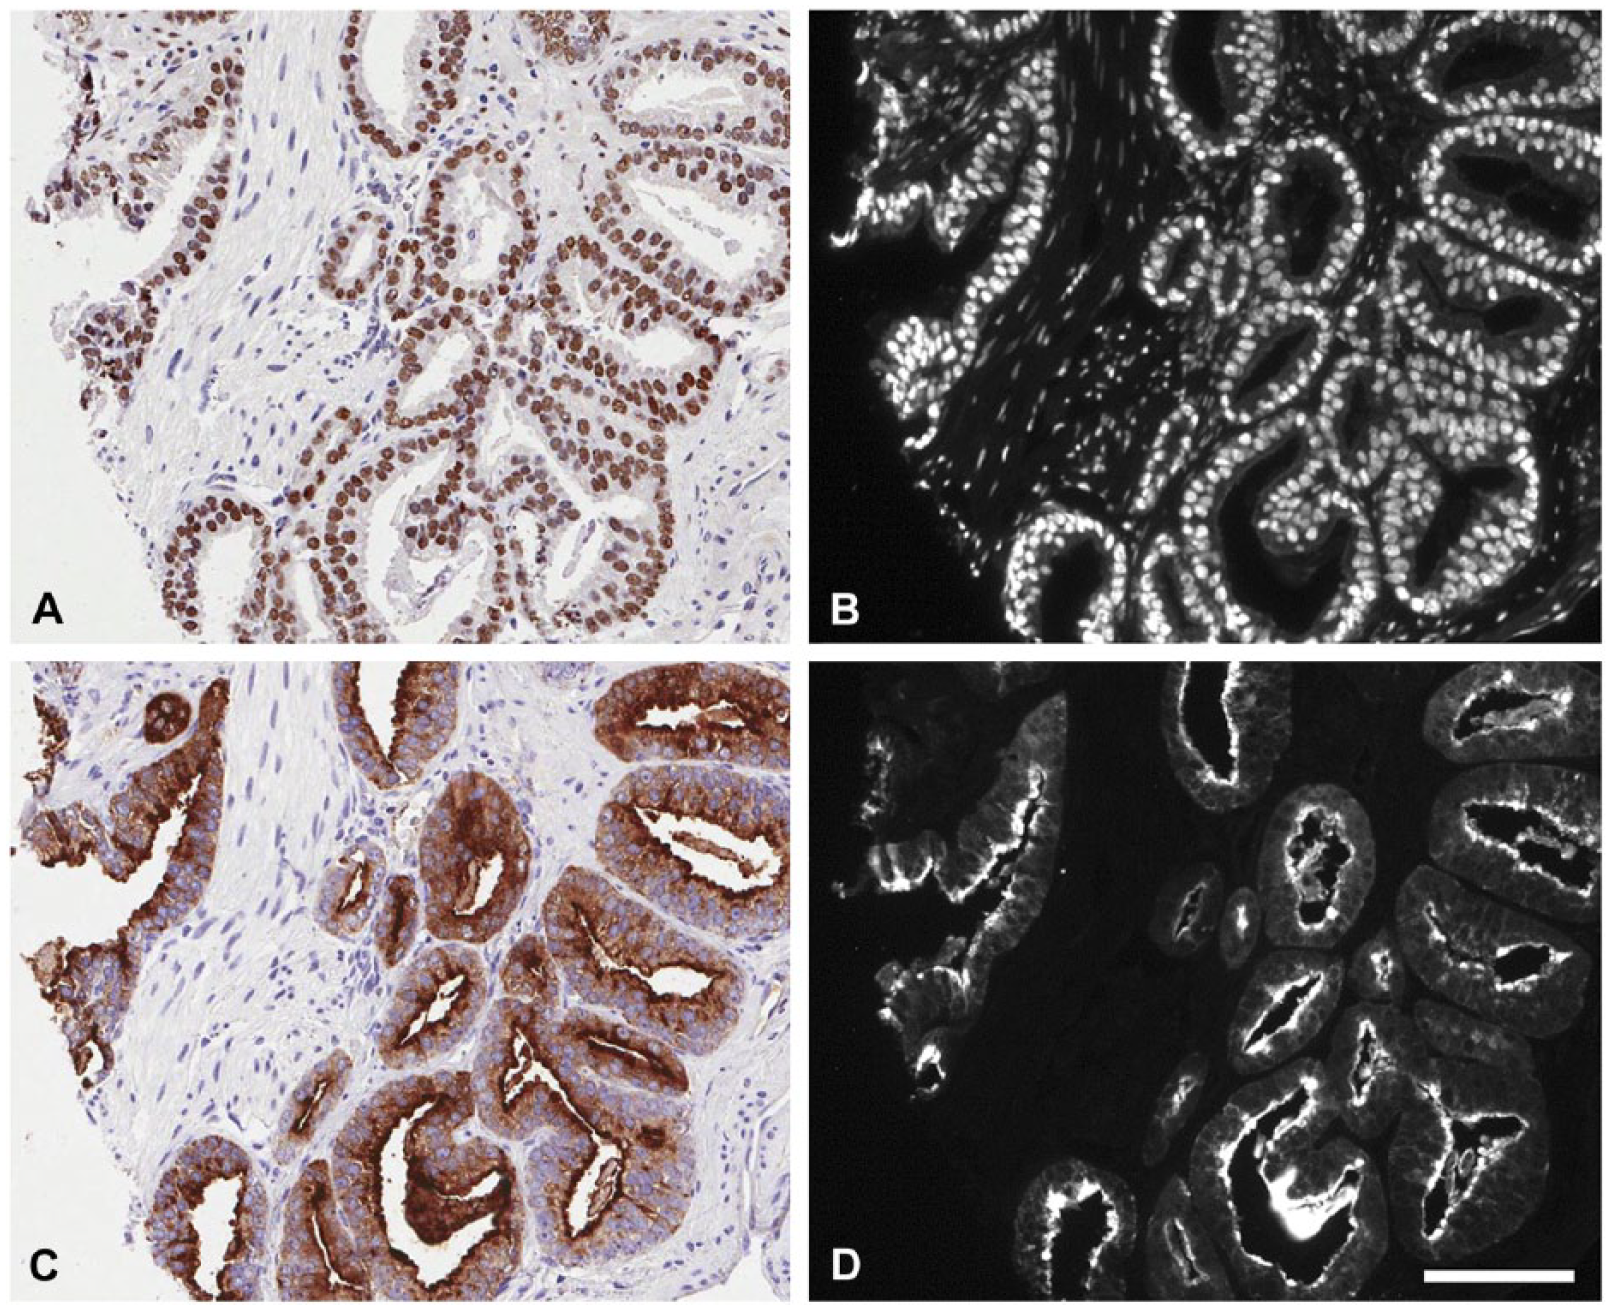
Comparison of immunostaining of AR and PSA with traditional IHC and TRF. Consecutive sections immunostained with AR-IHC (A), AR-TRF (B), PSA-IHC (C) and PSA-TRF (D). AR, androgen receptor; PSA, prostate-specific antigen; TRF, time-resolved fluorescence. Scale, 100 µm.
Quantification of AR and PSA Protein Expression by TRF
Mean pixel intensities of AR (in the epithelial nuclei) and PSA (in epithelial cytoplasm) in marked-up regions were calculated for each patient. Supplementary Fig. 3 shows the range of the signal intensities obtained in the different categories. The malignant epithelial areas in the cancer cores were separated into AMACR+ and AMACR- and compared to benign areas in tissue cores from areas at a distance from the tumor lesions. The benign nature of these glands was verified by their expression of the basal cell marker p63 on an adjacent tissue section (Fig. 2) and confirmed by the pathologist.
The mean pixel intensity of AR in cancer areas overall was not significantly different from that of benign cores (Table 2). When cancer areas were subdivided into AMACR+ and AMACR–, we observed significantly higher values of AR intensity in the AMACR+ glands, compared to benign epithelium (p=0.035), and a decrease in the AMACR– glands, compared to benign tissue (p≤0.001; Table 2). There was a significant difference between the expression of AR in AMACR+ and AMACR- glands (p=0.001). All comparisons were performed as paired comparisons within each patient (paired t-test).
Mean Pixel Intensities of AR and PSA Expression in Benign and Cancer Areas and AR/PSA Expression Ratio.
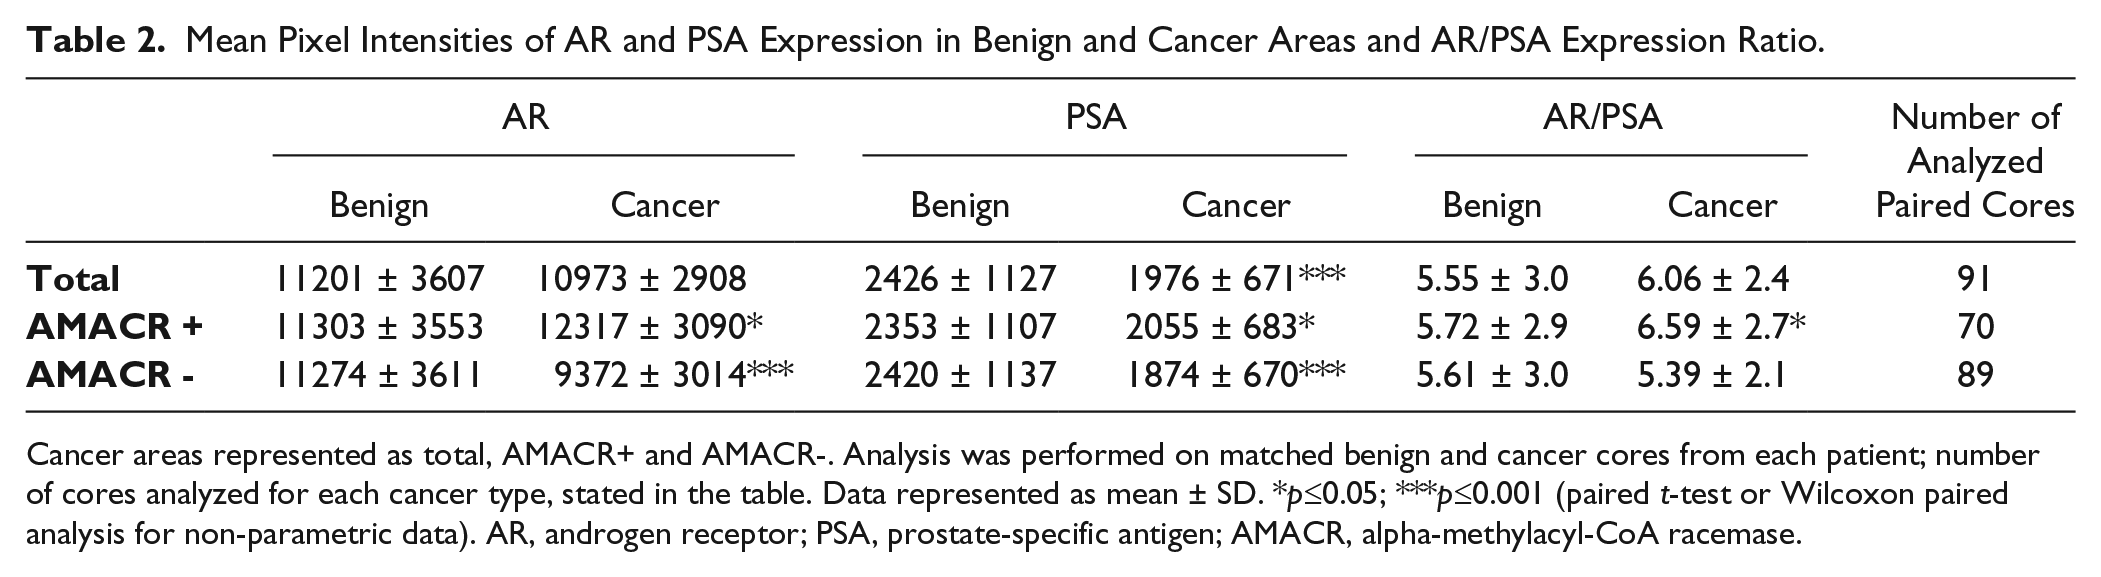
Cancer areas represented as total, AMACR+ and AMACR-. Analysis was performed on matched benign and cancer cores from each patient; number of cores analyzed for each cancer type, stated in the table. Data represented as mean ± SD. *p≤0.05; ***p≤0.001 (paired t-test or Wilcoxon paired analysis for non-parametric data). AR, androgen receptor; PSA, prostate-specific antigen; AMACR, alpha-methylacyl-CoA racemase.
The mean pixel intensity of PSA was significantly lower in cancer compared with benign epithelium (p≤0.001) and in AMACR- cancer glands compared to benign (p≤0.001; Table 2). PSA intensity in AMACR+ cancer glands tended to be lower than that of benign, but did not reach significance (p=0.091). There was a significant difference between the expression of PSA in AMACR+ and AMACR- glands (p=0.001), with PSA expression higher in AMACR+ glands. All comparisons were performed as paired comparisons within each patient (Wilcoxon paired test).
Overall, there was no difference between the ratio of AR/PSA in cancer versus benign cores; however, a significant increase in the AR/PSA ratio was observed in the AMACR+ glands as compared with benign areas (p=0.042, paired t-test; Table 2).
No correlation between AR and PSA expression was found in benign, cancer overall, AMACR+ glands, or AMACR- glands when analyzing the average intensity per core as well as when the analysis was done on a cell by cell basis (Supplementary Fig. 1).
Expression of AR and PSA in Relation to Gleason Score
To examine AR and PSA expression trends at different stages of the disease, the results of the staining intensities were plotted in four groups corresponding to the Gleason Score (GS) given to the patient at the time of the pathological examination (Fig. 5). We performed the same analysis taking into account the GS assigned to individual cores and obtained results that were not statistically different from those based on the pathological GS (data not shown). Benign cores used in this analysis (n=91) were from the same patients as the tumor cores.
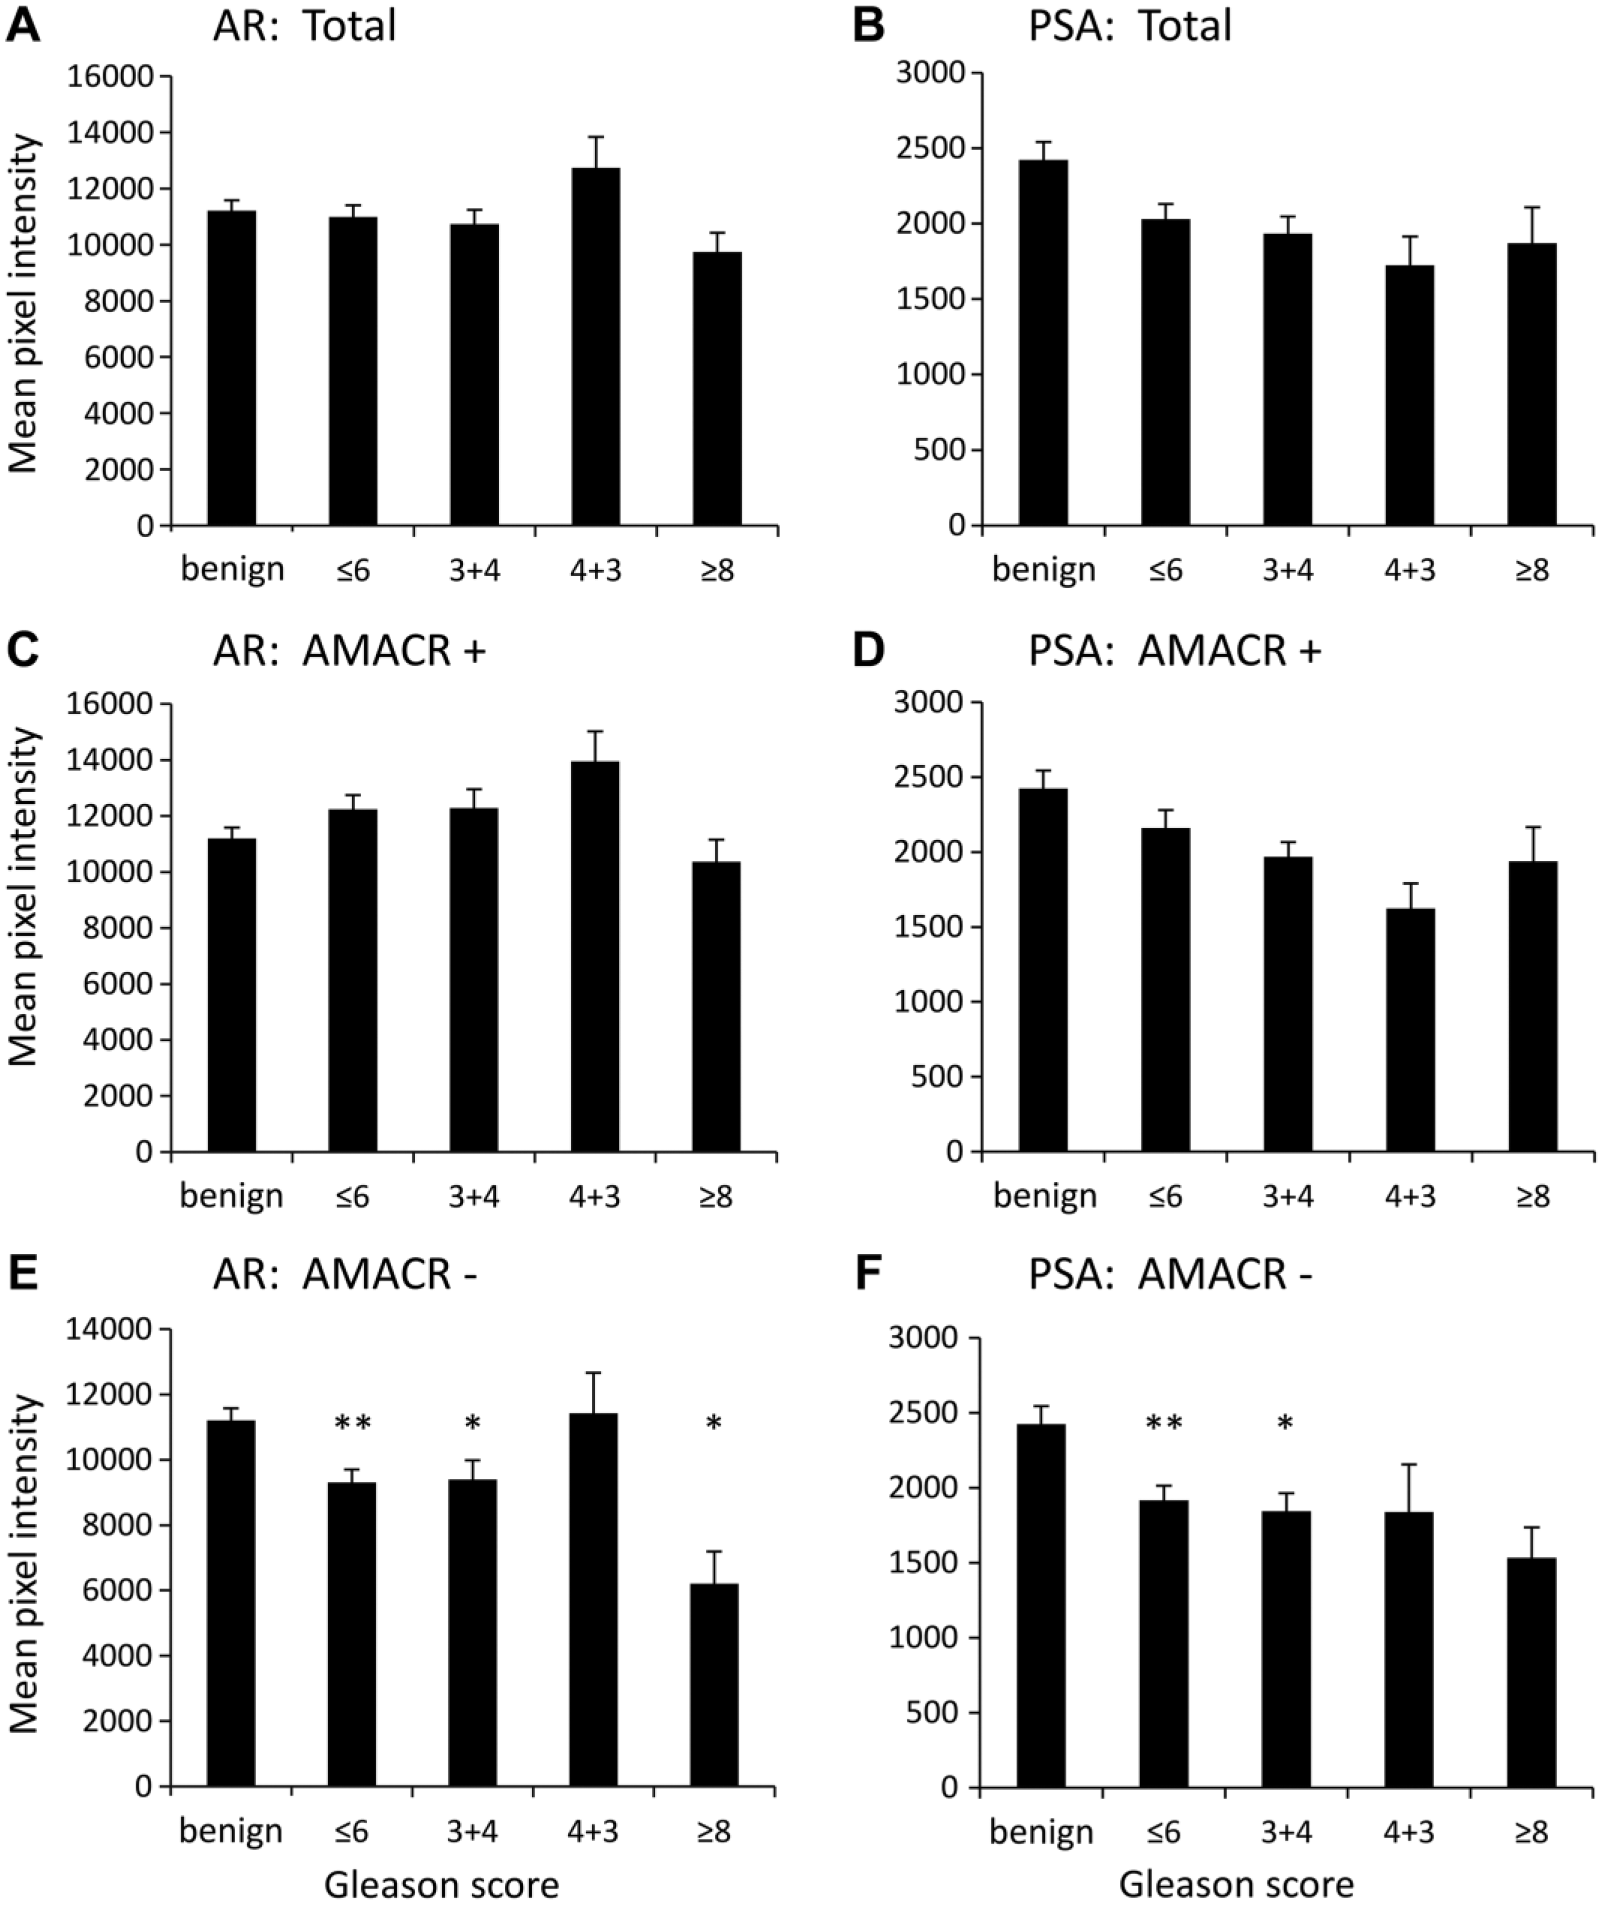
AR and PSA pixel intensity in cores separated by patients overall pathological Gleason score. Graphs represent intensities in benign (n=91) versus differently staged cancer cores (≤6, n=54; 3+4, n=28; 4+3, n=6; ≥8, n=3). The staining intensity was analyzed in all of the cancer regions (“total”, A and B), AMACR+ regions (C and D) and AMACR– regions (E and F). Data are the mean ± SEM of average pixel intensity of each core. *p≤0.05; **p≤0.01; one-way ANOVA with Dunnett’s post-hoc test and ANOVA on ranks with Dunn’s post-hoc test in case of non-normally distributed data. AR, androgen receptor; PSA, prostate-specific antigen; AMACR, alpha-methylacyl-CoA racemase.
When stratifying the results based on the GS, no significant differences in the mean intensity of AR staining of benign versus total cancer cores were observed (Fig. 5A). However, the intensity of AR in AMACR- regions was significantly lower in cancer cores as compared with benign cores overall (p≤0.001) and specifically in cores with GS ≤6, 3+4 and ≥8 (p≤0.05, one-way ANOVA; Fig. 5E).
The intensity of PSA immunostaining in AMACR- cores was significantly different between benign and cancer overall (p≤0.001, ANOVA on ranks; Fig. 5F), specifically in cores with GS ≤6 and 3+4 (p≤0.05, ANOVA on ranks; Fig. 5F).
Association among AR, PSA and AR/PSA Ratio and Biochemical Recurrence
A univariate Cox regression analysis was performed to identify whether AR or PSA protein expression, or their ratio, could be a predictor of BCR. No statistically significant correlation was found. Patients were dichotomized into groups based on the median value for the Kaplan–Meier survival analysis with Log-rank test for significance (Table 3). No significant associations were found, although there was a tendency for decreased time to BCR in patients with higher AR/PSA ratio in the AMACR- areas (Fig. 6).
Test of Equality of Survival Distributions for the Different Levels of AR, PSA and AR/PSA Ratio Plotted against Time to BCR.
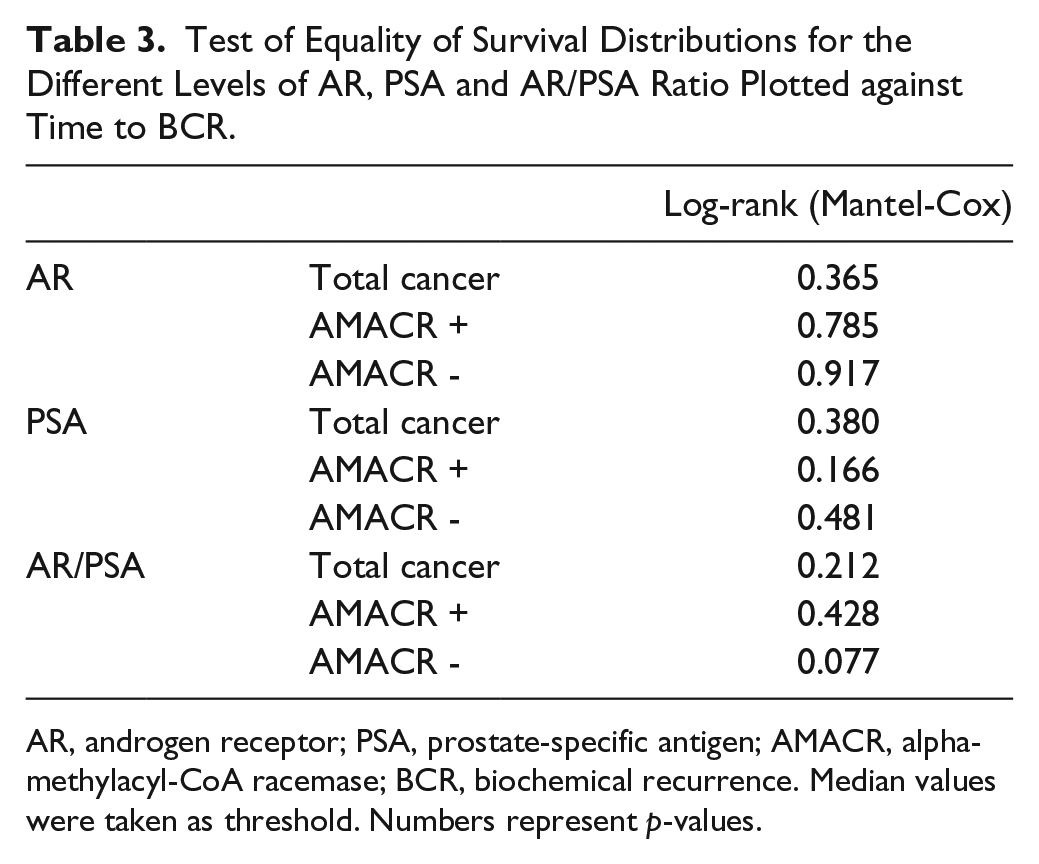
AR, androgen receptor; PSA, prostate-specific antigen; AMACR, alpha-methylacyl-CoA racemase; BCR, biochemical recurrence. Median values were taken as threshold. Numbers represent p-values.
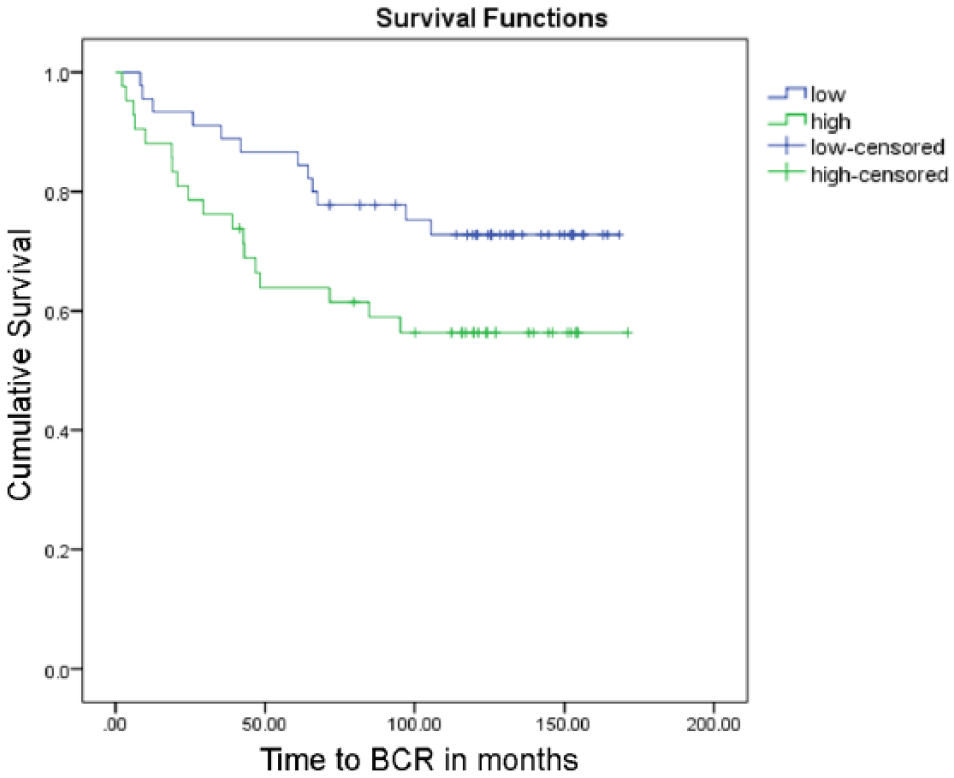
Kaplan–Meier curve for AR/PSA ratio in AMACR- regions stratified based on above or below median AR/PSA value. p=0.077. Number of events (BCR) = 29. AR, androgen receptor; PSA, prostate-specific antigen; AMACR, alpha-methylacyl-CoA racemase.
Discussion
In this paper, we present a method for algorithm-based segmentation and automated quantification of IF images using TRF. Our method allows for analyzing two or more fluorescent biomarkers along with pancytokeratin, which permits gland delineation and co-alignment with a consecutive section (IHC stained for p63/AMACR). The p63/AMACR staining allowed the algorithm to characterize the tissue as benign or cancerous and subdivide cancerous regions into AMACR+ and AMACR-. Our results indicate differences in the expression of AR and PSA not only between benign and cancerous tissues but specifically between AMACR+ and AMACR- cancer tissues.
The TRF technique presents advantages over traditional IHC and IF. Traditional IF allows the possibility of multiple staining but is not usually recommended for paraffin-embedded tissues, as it generates a disruptive background autofluorescence and is prone to bleaching, resulting in unreliable quantification. A recent paper investigating IF AR expression in PCa TMAs reported an exclusion of 37% of samples due to “autofluorescence and poor antigenicity” problems (Donovan et al. 2010), which is bound to introduce bias. The TRF method provides the advantage of reduced autofluorescence, improved signal-to-background ratio, and minimal bleaching, resulting in stable, linear and quantifiable staining with a high degree of sensitivity (Bjartell et al. 1999a; Vuorinen et al. 2006). Previous studies from our laboratory have shown that the directly labelled TRF method can be used to extrapolate antigen concentration in the tissue (Siivola et al. 2000). Moreover, TRF technology has been commercially adapted for high-sensitivity ELISA (Perkin Elmer DELFIA system) and lanthanide chelates have been recommended for high-performance RT-PCR (Nurmi et al. 2002). We propose the TRF imaging method as an attractive alternative to both IF and IHC in a TMA setting.
The use of europium- and terbium-conjugated antibodies is compatible for multiplexing with traditional IF, as demonstrated here together with the FITC-labelled anti-pancytokeratin, used to identify epithelial cells. As pancytokeratin was not intended for quantification, high IF autofluorescence was not an issue; however, care was taken to optimize the protocol with respect to antibody concentration, blocking, antigen retrieval, and obtain sufficient signal strength for detection by our algorithm. Apart from intensity thresholds, the algorithm was designed to detect spectral and entropy filters to distinguish texture differences, thus allowing us to segment epithelium from stroma.
The automated alignment of images from consecutive sections was performed as described in (Lippolis et al. 2013) using a feature-based approach. This approach results in a highly robust consecutive section alignment; however, some differences between consecutive sections are inevitable. In order to make sure that entire glands on the p63/AMACR section were included, the mask was made slightly larger. To certify that no stroma was included on a TRF-stained section, we used cytokeratin staining, which ensured that only glandular structures were included. The cytokeratin stain was on the same section as the AR and PSA (triple-staining), therefore no issue of alignment was present.
We applied the alignment algorithm together with the above-mentioned segmentation algorithm to produce masks of benign, AMACR+ and AMACR- cancer areas. p63/AMACR staining has been proposed as a useful tissue biomarker of, respectively, benign and cancerous regions in the prostate (Luo et al. 2002; Varma and Jasani 2005). However, in more aggressive cancers, AMACR can be downregulated and this lower expression tends to be associated with a worse outcome (Rubin et al. 2005). Interestingly, we noticed changes in both AR and PSA protein expression analyzed in the AMACR- regions, which may be of relevance to the disease progression. Differences between AR expression in AMACR+ and AMACR- areas have been reported previously by Donovan and colleagues who performed a multiplex IF study of AR in PCa (Donovan et al. 2008). They observed that high AR expression levels in AMACR- areas are predictive of clinical failure. We have not found a significant correlation but Donovan and colleagues used a considerably larger number of samples (>800 patients) than we used.
Our finding that tissue PSA decreases in PCa agrees with previous reports (Lintula et al. 2005; Sterbis et al. 2008; Erbersdobler et al. 2009). To our knowledge, this is the first study investigating differences in PSA expression in AMACR+ and AMACR- regions in histological tissue and it is also the first report to investigate a direct correlation between AR and PSA protein expression in the same tissue, with the aid of double-staining and TRF imaging.
Interestingly, we have not found any significant correlation in the expression of these two proteins, both on a whole-gland basis and after specifically analyzing individual cells. PSA is known to be strongly regulated by AR (Kim and Coetzee 2004) so a direct relationship in their expression patterns would be expected. As PSA is a secretory protein, it is possible that some of the protein produced is secreted, therefore making it difficult to estimate the influence of AR on the intracellular concentration of PSA. Also, it is likely that the expression of AR protein does not reflect the activation status of the receptor and it possible that different variants of AR affect the regulation of PSA; however, this is more likely to occur in castration-resistant PCa (CRPC) (Kim and Coetzee 2004). Finally, there have been reports that PSA can be induced independently of AR (Blaszczyk 2004) and that PSA itself regulates AR (Saxena et al. 2012), which suggests that the AR–PSA relationship is more complex than initially thought.
In the present study, the subjects presented localized PCa and none of them had CRPC. As most of the subjects were in the early stages of the disease, some of the changes were not very pronounced and it was difficult to see any correlations with BCR. Also, given that this was a proof-of-principle methodological study, the number of samples used was limited (<100), with very few events of BCR, thus also occluding the emergence of any important trends. Moreover, it is important to consider that, in the current study, only a representative section of each core was analyzed rather than the whole core. Using cores as a representation of the whole organ has its limitations, especially in diseases such as PCa where there is a lot of tissue heterogeneity. Repetitive samples from the same patient would provide a better representation; this, however, was not possible with the material available in this study. In any case, we have observed changes in both AR and PSA expression and such changes at an early stage of the disease might be indicative of further malignant development. Our findings need validation in a larger cohort. Also, it would be interesting to expand the study to include samples from CRPC and metastatic patients. The strengths of this study comprise the automated image analysis methods, which are likely to be highly reproducible, non-subjective and observer-independent.
In summary, we successfully implemented TRF imaging and automated image analysis to study the expression of AR and PSA in tissue sections of the benign and malignant prostate. We found significant differences in the expression of both proteins in the cancer samples, with particularly significant decreases in AMACR- regions. Future studies will include expanding the cohort size in order to verify any possible predictive trends in the expression of AR, PSA or their expression ratio in PCa.
Footnotes
Acknowledgements
We are grateful to Elise Nilsson and Kristina Ekström-Holka at the Department of Translational Medicine, Center for Molecular Pathology in Malmö, Lund University, Sweden for excellent technical assistance with immunostainings and to Ari Kuusisto, Turku, Finland for technical support with the TRF workstation.
Author Contributions
AK performed the experiments, collected and analyzed the data and wrote the manuscript; GL collected and analyzed the data, designed the algorithms and wrote the manuscript. LH provided pathological scoring of the tissue. AA was involved in data analysis. MP and KP developed the TRF antibodies and optimized the protocol. HL was involved in the critical revision of the manuscript. AB conceived and supervised the study. All authors have read and approved the final manuscript.
Competing Interests
The authors declared the following potential competing interest with respect to the research, authorship, and/or publication of this article: Hans Lilja holds patents for free PSA, hK2, and intact PSA assays, and is named, on a patent application for a statistical method to detect PCa. The method has been commercialized by OPKO. All other authors report no competing interests.
Funding
The authors disclosed receipt of the following financial support for the research, authorship, and/or publication of this article: This work was financially supported by European Union 7 Framework/Marie Curie Initial Training Networks (ITN) PRONEST/FP7-PEOPLE Contract no. 238278, and FAST-PATH/FP7-PEOPLE Contract no. 285910, the Swedish Cancer Foundation, the Swedish Research Council, Government Funding of Clinical Research within the National Health Services, Lund University (ALF), the Malmö University Hospital Research Foundations and the Gunnar Nilsson’s Cancer Foundation.
References
Supplementary Material
Please find the following supplemental material available below.
For Open Access articles published under a Creative Commons License, all supplemental material carries the same license as the article it is associated with.
For non-Open Access articles published, all supplemental material carries a non-exclusive license, and permission requests for re-use of supplemental material or any part of supplemental material shall be sent directly to the copyright owner as specified in the copyright notice associated with the article.