
Abstract
Calneuron-1 and -2 are members of the neuronal calcium-binding protein family (nCaBP). They are transmembrane Calmodulin-like EF-hand Ca2+-sensors, and a function in the control of Golgi-to-plasma membrane vesicle trafficking has been assigned to both proteins. In this paper, we describe the distribution of Calneuron-1 in rat and human brains. We show that Calneuron-1 is ubiquitously expressed in all brain regions examined. The protein is most abundant in Purkinje cells of the cerebellum and principal neurons of the cortex and limbic brain whereas no expression in glial cells is apparent. In addition, we identify two novel splice isoforms of Calneuron-1 with extended N-termini. These isoforms are particular abundant in the cerebellum. Taken together, these data set grounds for a better understanding of the cellular function of Calneurons.
Introduction
Calneurons are Calmodulin-like, calcium-sensor proteins of the nCaBP family that are prominently localized to the trans-Golgi network (TGN) (McCue et al. 2009; Mikhaylova et al. 2006, 2009, 2010; Wu et al. 2001). Calneuron-1 and -2 (also known as CaBP8 and -7) are closely related to each other with 64% identity at the amino acid level (Mikhaylova et al. 2006). In particular, the functional Ca2+-binding EF-hands 1 and 2 are almost identical and even the second non-functional EF-hand domain shows high similarity between both proteins (Mikhaylova et al. 2006, 2009). Interestingly, Calneurons have the highest reported global Ca2+ affinities of all neuronal calcium sensors, with a Kd of 180 nM for Calneuron-1 and 230 nM for Calneuron-2, respectively (Mikhaylova et al. 2006, 2009).
We have previously shown that both proteins are involved in Ca2+-dependent regulation of the local synthesis of phospholipids, which are crucial for TGN-to-plasma membrane trafficking (Mikhaylova et al. 2009). Calneurons associate at the TGN with Phosphatidylinositol 4-OH kinase IIIβ (PI-4Kβ) in a Ca2+-independent manner and strongly inhibit PI-4Kβ activity. Calneurons are tail-anchored proteins that are inserted into endoplasmic reticulum (ER) membranes via the TRC40/Asna1 chaperone, which is then trafficked to the Golgi complex (Hradsky et al. 2011; McCue et al. 2011). Interestingly, in previous work, we found no evidence for a cytosolic pool of Calneurons (Hradsky et al. 2011). Furthermore, we could demonstrate that self-association of Calneurons in vivo is restricted to membrane-inserted proteins (Hradsky et al. 2011). The dimerization properties and the finding that they, unlike every other Calmodulin-like Ca2+-sensor, are transmembrane proteins in the secretory pathway suggest a high degree of specificity for the physiological target interactions of these proteins.
At present, very little is known about the protein expression of Calneurons in the brain; therefore, assigning a function to these proteins will be helpful to obtain such information. Because Calneuron-1 is more abundant at the mRNA level, we analyzed in the present study the distribution of Calneuron-1 using immunoblotting and immunostaining in rat and human brain in more detail. In addition we identified two novel splice isoforms of Calneuron-1.
Materials & Methods
Animals
Adult Wistar rats (12 weeks old) were obtained from the animal facility of the Leibniz Institute of Neurobiology (Magdeburg, Germany). Animal housing and experimental procedures were authorized and approved by the Institutional State and Federal Government regulations (Institutional Animal Care and Use Committee: Landesverwaltungsamt Sachen-Anhalt; License No. 42502-2-987IfN) in accordance with the European Communities Council Directive (86/609/EEC).
Purification of Specific Anti-Calneuron-1 Antibodies for Immunoblotting from Rabbit Serum
MBP-Calneuron-1 was produced in E. coli BL21(DE3) after transformation with a pMAL-Calneuron-1 expression vector containing the rat (Q06BI3) coding sequence obtained from rat brain cDNA (Mikhaylova et al. 2006). Each animal was subjected to three injections (1st, 4th and 14th day). The immunization procedure was done at Biogenes, Berlin, Germany. Sera were collected over a period of 6 months. The sera collected after the last bleeding were affinity purified on recombinant MBP-Calneuron-1 or MBP-Calneuron-2. To this end, 200–300 µg of protein was loaded on a big loading pocket SDS gel and subjected to SDS-PAGE/western blotting. After performing ponceau staining, the protein bands were cut out from the membrane, washed for 10 min in Tris-buffered saline (20 mM Tris-HCl pH 7.4, 150 mM NaCl) containing 1% Triton-X-100 (TBS-T), and then blocked for 2 hr at room temperature in blocking solution. Membrane pieces were again washed for 3 × 5 min wash with phosphate-buffered saline (PBS) containing 0.1% bovine serum albumin (BSA) and 0.1% Tween-20, and then incubated with 1 ml of the individual serum or corresponding pre-immune serum over night at 4°C. Membrane pieces were washed 3 × 10 min with PBS containing 0.1% BSA and 0.1% Tween-20 to remove unbound immune serum. Bound antibodies were then eluted by the addition of 200 µl 0.1 M glycine, pH 2.5, incubation for 2 min at room temperature. The eluates were then immediately neutralized by the addition of 30 µl of 1 M Tris pH 8.0. In total five elution steps were performed for each purification. After checking the pH, eluents were combined. To avoid cross-reactivity between Calneuron-1 and -2, half of the combined Calneuron-1 antibody fraction was further absorbed overnight on membrane pieces with MBP-Calneuron-2 and vice versa. Both the original eluates as well as the pre-cleaned ones were finally mixed with glycerol in a ratio of 1:1 and then kept at -20°C. Purification of MBP-tagged Calneuron proteins was done as previously described (Mikhaylova et al. 2006, 2009). The purified antibody turned out to be only useful for immunoblotting; in immunohistochemical applications, we only observed very dim staining (data not shown).
COS7 cells were plated into the wells of 6-well plates, grown to optimal density, and then transfected with 4 µg of Calneuron-1 (216 aa), Calneuron-1 (261 aa), or Calneuron-2 in pcDNA3.1 vector (Mikhaylova et al. 2009) using standard calcium phosphate approach. Twenty-four hr after the transfection, the cells were lysed in 1 × TBS-T containing protease inhibitor cocktail (Roche Applied Science; Mannheim, Germany). After the addition of SDS sample buffer, cell lysates were incubated at 95°C for 5 min and the final protein concentration was measured by Amidoblack method. Next, 10 µg of the lysate containing different Calneuron-1 isoforms or Calneuron-2 were subjected to SDS-PAGE and analyzed by immunoblotting using the purified, home-made anti-Calneuron-1 rabbit antibody (1:1,000). An anti-beta-actin antibody (1:10,000; Sigma-Aldrich, St Louis, MO) was used to visualize equal loading.
Immunoblot Analysis
Rat brain tissue homogenates from different brain regions were prepared from adult rat brain as described by Dieterich et al. (2008). Processing of human tissue was done as described previously (Bernstein et al. 2003, 2007). Detection of Calneuron-1 was performed with a 1:500 dilution of the purified, homemade anti-Calneuron-1 rabbit antibody (1:1,000), described above. Equal loading and blotting was controlled with a mouse anti-β-Tubulin-III antibody (T8660; Sigma-Aldrich).
Identification of Calneuron-splice Isoforms
Preparation of cDNA from whole adult rat brain was done as previously described by Landgraf et al. (2014). Pfu-based blunt-end PCR amplification of the Calneuron-1 coding sequence for different splice isoforms from cDNA was performed using an individual forward primer together with a universal Calneuron-1-specific reverse primer (5′-ctactccatgccgctccgcaggatctggtt-3′). The primer sequences were deduced from database entries for the mRNA of Calneuron1-A (219-aa protein; DQ914829; 5′-atgccgttccaccatgtaactgctggcttg-3′) and Calneuron1-B (261-aa protein (NM_001077201; 5′-atgcggctgcctgagcaacctggagatgga-3′). For the potential 293-aa isoform (Calneuron1-C / EDM13458), the downstream sequence of a possible start codon (5′-atgtacccccaaatctctgaccacatcacc-3′) located in the 5′-site flanking region of the Calneuron-1 gene (Gene ID: 363909) was used. The translation product of this sequence matches with the N-terminal amino acid sequence of the predicted isoform. Individual PCR products, prepared using Taq polymerase, were purified from agarose gels using the NucleoSpin Gel and PCR clean up kits (Macherey-Nagel; Düren, Germany). Ligation of the desired PCR products into pGEM-T easy vector (Promega; Fitchburg, WI) and transformation into E. coli XL10-Gold was done according the vector manufacturer’s protocol. Plasmid preparation from single colonies after blue/white screening was then performed using the NucleoSpin Plasmid kit (Macherey-Nagel). Plasmids were finally sequenced using standard M13 and SP6 sequencing primers.
Immunohistochemistry of Rat Brain Slices
Adult rats were anesthetized with Isofluran Baxter (Baxter Deutschland GmbH, Edisonstrasse, Germany), perfused with 0.9% NaCl, and then fixed with 4% paraformalydehde (PFA) in PBS for 10 min. Brains were isolated, and then post-fixed in 4% PFA containing 0.5 M sucrose for 1 day. Forty-µm thick frontal and horizontal brain sections were prepared using a cryostat (Leica CM3050S, Leica Microsystems, Wetzlar, Germany) as described previously (Mikhaylova et al. 2014).
DAB (3,3’-diaminobenzidine) staining was performed on frontal and sagittal cryosections of adult rat brain with a thickness of 40 µm, as described previously (Mikhaylova et al. 2014). A rabbit anti-Calneuron-1 antibody (TA316588; OriGene Technologies, Rockville, MD), directed against the first 16 aa at the N-terminus, was used at a dilution of 1:300. The antibody was not suitable for immunoblot analysis because it did not detect the denatured protein. To test specificity, depletion of anti-Calneuron-1 antibody was performed by pre-incubating the diluted antibody (blocking buffer) with 200 µg of MBP- (control) or MBP-Calneuron-1 bound to 50 µl amylose resin (NEB) overnight at room temperature. Non-absorbed antibody was subjected to same incubation steps but without adding the recombinant proteins. For double immunofluorescence staining, slices were co-stained with a chicken anti-GFAP antibody (ab4674, Abcam, Cambridge, UK) diluted 1:400. Secondary antibody labeling was done with an Alexa Fluor 568 goat anti-rabbit IgG at 1:500 (A-11011; Invitrogen, Carlsbad, CA) and a DyLight™ 649 donkey anti-chicken IgY (IgG) (H+L) F(ab’)2 fragment at 1:1000 (#703-496-144; Jackson ImmunoResearch Laboratories, West Grove, PA), with both antibodies diluted in PBS containing 0.4% BSA. The secondary antibody incubation was followed by extensive washes with PBS, followed by a 2-hr incubation with Alexa Fluor 488-conjugated anti-MAP2 mouse antibody (#MAB3418X; Millipore Corp., Billerica, MA) diluted 1:400 in the same buffer as that used for the secondary antibody. After another PBS wash, slices were subjected to DAPI staining (1 µg/ml) for 30 min and finally mounted on microscope slides and embedded using Mowiol.
DAB staining was imaged using an Axioskop 2 microscope (Carl Zeiss Microscopy GmbH, Germany) equipped with a DFC500 camera (Leica Microsystems) and AxioVision software (Carl Zeiss Microscopy GmbH, Germany). Image acquisition following double immunofluorescence staining was done using a TCP SP5II confocal laser scanning microscope (Leica Microsystems) as described by Karpova et al. (2013). Images were processed using ImageJ (NIH, Bethesda, MD) and Photoshop (Adobe Systems Software, Ireland) software.
Human Brain Samples
Brains were obtained from the New Magdeburg brain collection. The case recruitment, acquisition of personal data, performance of autopsy, and handling of autoptic material were conducted in accordance with the Declaration of Helsinki and was approved by the Ethical Committee of Magdeburg (License No. 47/10). In addition, written consent was obtained from the next-of-kin. The brains of four human subjects (2 males, 2 females; mean age: 51.0 ± 4.0 years) without a history of neuropsychiatric disorder were investigated. None of the subjects had a history of substance abuse or alcoholism. An experienced neuropathologist ruled out changes due to neurodegenerative or traumatic processes.
Tissue Processing of Human Brain Sections
The subjects’ brains were removed within 13–27 hr after death and fixed in 8% phosphate-buffered formaldehyde for at least 2 months (pH = 7.0, T = 15–20°C). The frontal and occipital poles were separated by coronal sectioning anterior to the genu and posterior to the splenium of the corpus callosum. After embedding all of the brain sections in paraffin, serial coronal sections of the middle block were cut (20 μm) and mounted. The distance between the sections was 1 mm. Every 50th section was Nissl and myelin stained (Heidenhain/Woelke stain), as described earlier (Bernstein et al. 1998).
Immunohistochemistry of Human Brain Sections
Calneuron-1 immunoreactivity was detected with a mouse polyclonal antibody (H00083698-A01; Abnova, Taipei, Taiwan) used previously (Mikhaylova et al. 2009) employing the nickel-enhanced avidin–biotin technique, as described elsewhere (Bernstein et al. 1999, 2007). For immunohistochemical staining, six whole brain frontal sections from each case were used; these samples were obtained 10–15 years before staining. Sections were pre-incubated with methanol/H2O2 to block endogenous peroxidases and then subjected to repeated washing with PBS. Sections were then incubated with antibody that was applied at a working dilution of 1:200 in PBS. Thereafter, the sections were processed with the avidin–biotin method (Vectastain-peroxidase kit; Vector Laboratories, Burlingame, CA) and the reaction product was visualized with DAB. The color reaction was enhanced by the addition of 2 ml of a 0.5% (v/v) nickel ammonium sulfate solution to the DAB. The specificity of the immunoreaction was controlled by incubation with buffer and omitting the antiserum. No specific staining was observed after performing control reactions.
Results
Alternative Splicing and Expression of Calneuron-1 in Rat and Human Brains
To investigate the expression of Calneuron-1 in different rat brain regions, whole tissue homogenates were subjected to immunoblotting (Fig. 1A). Next to the rat tissue extracts, we loaded a sample from human cortex. Equal loading and immunoblotting was ensured by staining the blot with an anti-β-Tubulin III mouse antibody (Fig. 1a). We loaded 20 µg total protein per lane, and observed a prominent band ~25 kDa in all tissues investigated, with much higher intensities in all rat brain tissues as compared to those in human cortex samples, where the Calneuron-1 immunoreactive band was only visible after longer exposure times. This difference in intensity might reflect different processing of rat and human tissue but possibly also a different glial content in the cortex between these two species. Within rat brain, the highest level of expression was observed in the striatum and the cerebellum. Interestingly, Calneuron-1 is present at very low levels in the olfactory bulb (Fig. 1A). Of note, particularly in cerebellum, there was a higher molecular weight band of about 30 kDa (Fig. 1A), and this higher molecular weight band was the most prominent Calneuron-1 immunoreactive band in this brain region. Based on the molecular weights of both bands, we assumed that the lower molecular weight band referred to the 219-aa Calneuron-1 protein (Q06BI3) whereas the higher molecular weight band to a larger isoform of 261 aa (Q06BI2) (Fig. 1B, 2A). Because the antibody was generated using the full-length, recombinant, 219-aa protein, the detection of both isoforms is likely, as the 261-aa isoform harbors an extended N-terminus (Fig. 2A, 2B). In addition, according to entries in the NCBI protein database, another isoform might exist (EDM13458) which encodes a protein of 293 aa (Fig. 1B, 2A, 2B). Analogous to the 261-aa protein, alternative splicing results in an extended N-terminus in this 293-aa protein (Fig. 1B, 2A, 2B). This third isoform might be present in rat hippocampus as well as the thalamus, where a Calneuron-1 immunoreactive band migrating at 33 kDa was visible after longer exposure (Fig. 1A). The Calneuron-1 antibody employed for immunoblotting did not detect Calneuron-2 after its heterologous expression in COS7 cells (Fig. 1C). RT-PCR from rat brain mRNA confirmed the presence of all three isoforms at the transcript level (Fig. 1D).
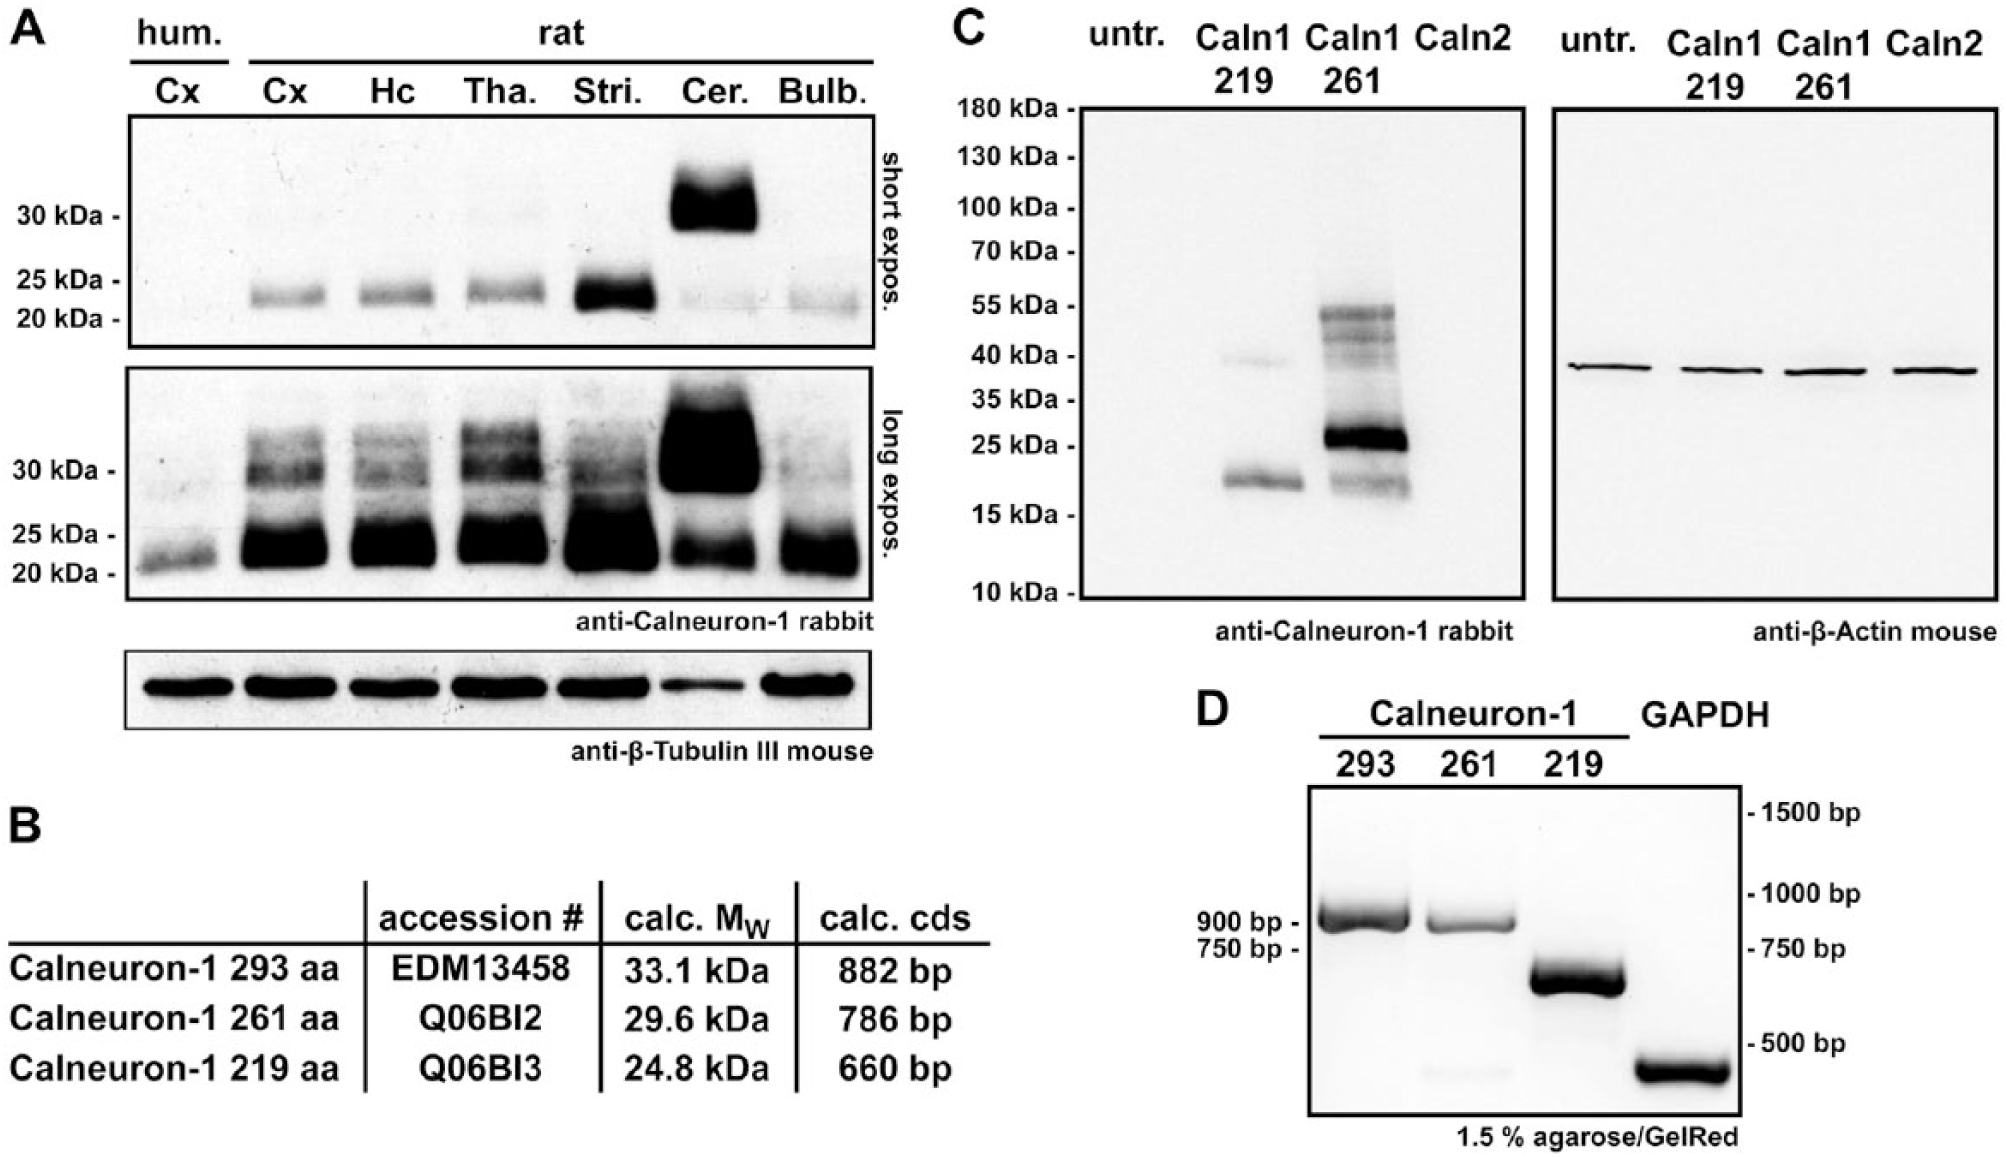
(A) Immmunoblotting of different rat brain tissues as well as a sample from human cortex developed with anti-Calneuron-1 and anti-β-Tubulin III antibodies (20 µg total protein/lane). In both the short (upper panel) and long (middle panel) ECL exposures, a band of ~25 kDa appears for all rat brain tissues, which matches the calculated weight of the 219-aa rat Calneuron-1 protein. The highest intensity staining for this band can be seen in the striatum and lowest in the cerebellum and olfactory bulb. Although the loading control did not show significant differences (lower panel), the 25-kDa band in the human cortex only appears after the long exposure. Interestingly, next to the 25-kDa band, a band of ~30 kDa appears in all rat tissue and even, albeit very fade, in human cortex tissue. This band is most prominent in the rat cerebellum, where it is even more intense than the 25-kDa band. A third band, >30 kDa, shows up in all rat brain tissues, and is best visible in the thalamus after the long exposure. All three bands can be assigned to the calculated mass of all three rat Calneuron-1 proteins listed in the NCBI database and shown in (B). (C) The Calneuron-1 antibody only detects Calneuron-1 but not -2 after heterologous expression in COS7 cells. Higher molecular weight bands might be accounted for by dimerization (Hradsky et al. 2011). Anti-β-actin antibody was applied to the same blots as a loading control. (D) PCR products, separated on agarose gels, were generated with isoform-specific forward and a pan-Calneuron-1 reverse primer from total rat brain cDNA, using GAPDH as a control. The DNA bands can be assigned by size to the calculated cds of the individual proteins given in (B). Abbreviations: hum., human; expos., exposure; Cx, cortex; Hc, hippocampus; Tha, thalamus; Stri, striatum; Cer, cerebellum; Bulb, olfactory bulb; untr., untransfected.
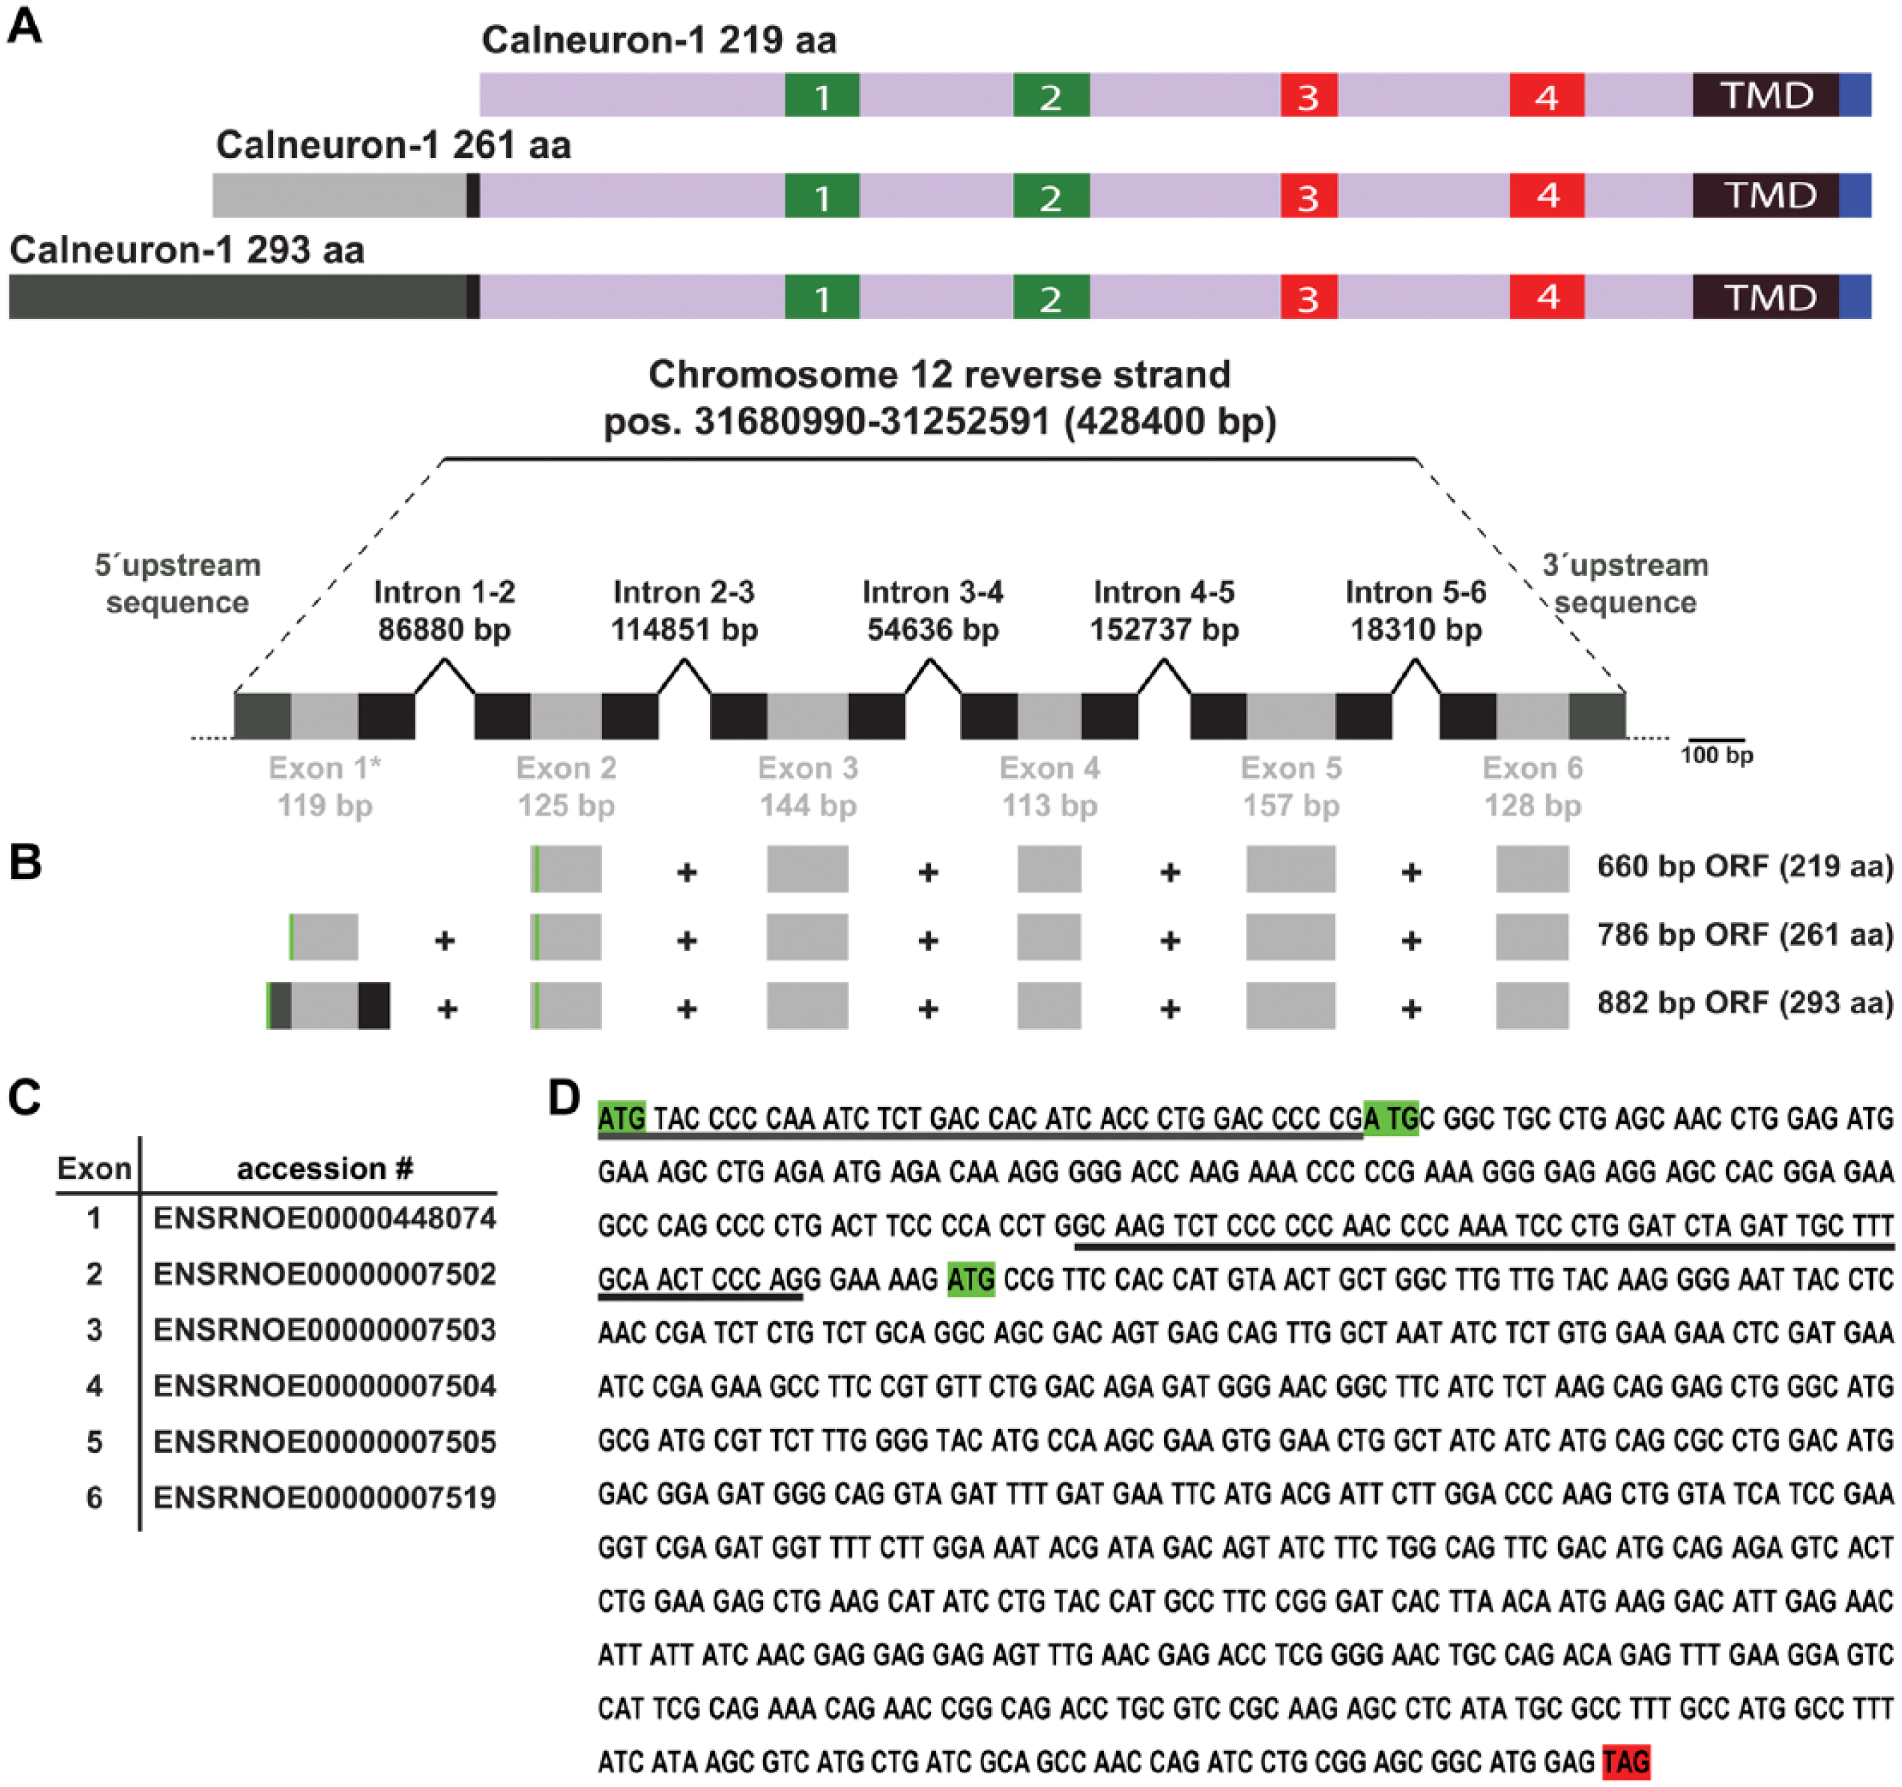
(A) Upper schematic shows the different Calneuron-1 isoforms with different N-termini. Numbers indicate EF-hands. TMD, Transmembrane domain. Lower schematic shows the organization of the intron–exon structure of the rat Calneuron-1 gene (CALN1) corresponding to the NCBI database entries. (B) Exon organization (scaled and aligned to (A) for the known mRNAs of the 219-aa and 261-aa Calneuron-1 proteins and the potential organization of the mRNA for a 293-aa homolog, with an upstream and downstream extension of Exon 1. Start codons are indicated by green lines. The 219-aa start codon is in-frame with both the potential 293aa and the 261 aa cds. ORF, open reading frame. (C) Individual exons and their corresponding Ensembl-database (www.ensembl.org) accession numbers. (D) Coding sequence for the potential 293-aa protein. Non-underlined sequences are according to the exons given in (C), whereas the underlined sequences correspond to exon1 up- and downstream flanking sites. The start codons for all three isoforms are indicated by green boxes, with that for the 219-aa protein in-frame and for the 261-aa protein out of frame. The stop codon is highlighted by a red box.
Analysis of the exon/intron structure of the rat Calneuron-1 gene (CALN1) revealed that the three alternative start codons result in three splice isoforms that all share the last 219 amino acids (Fig. 2B, 2C). The longer isoforms result from alternative splicing of exon 1 (Fig. 2B, 2C) and the usage of two upstream start codons, which leads to an extended N-terminus.
Regional and Cellular Distribution of Calneuron-1 Immunoreactivity in Rat Brain
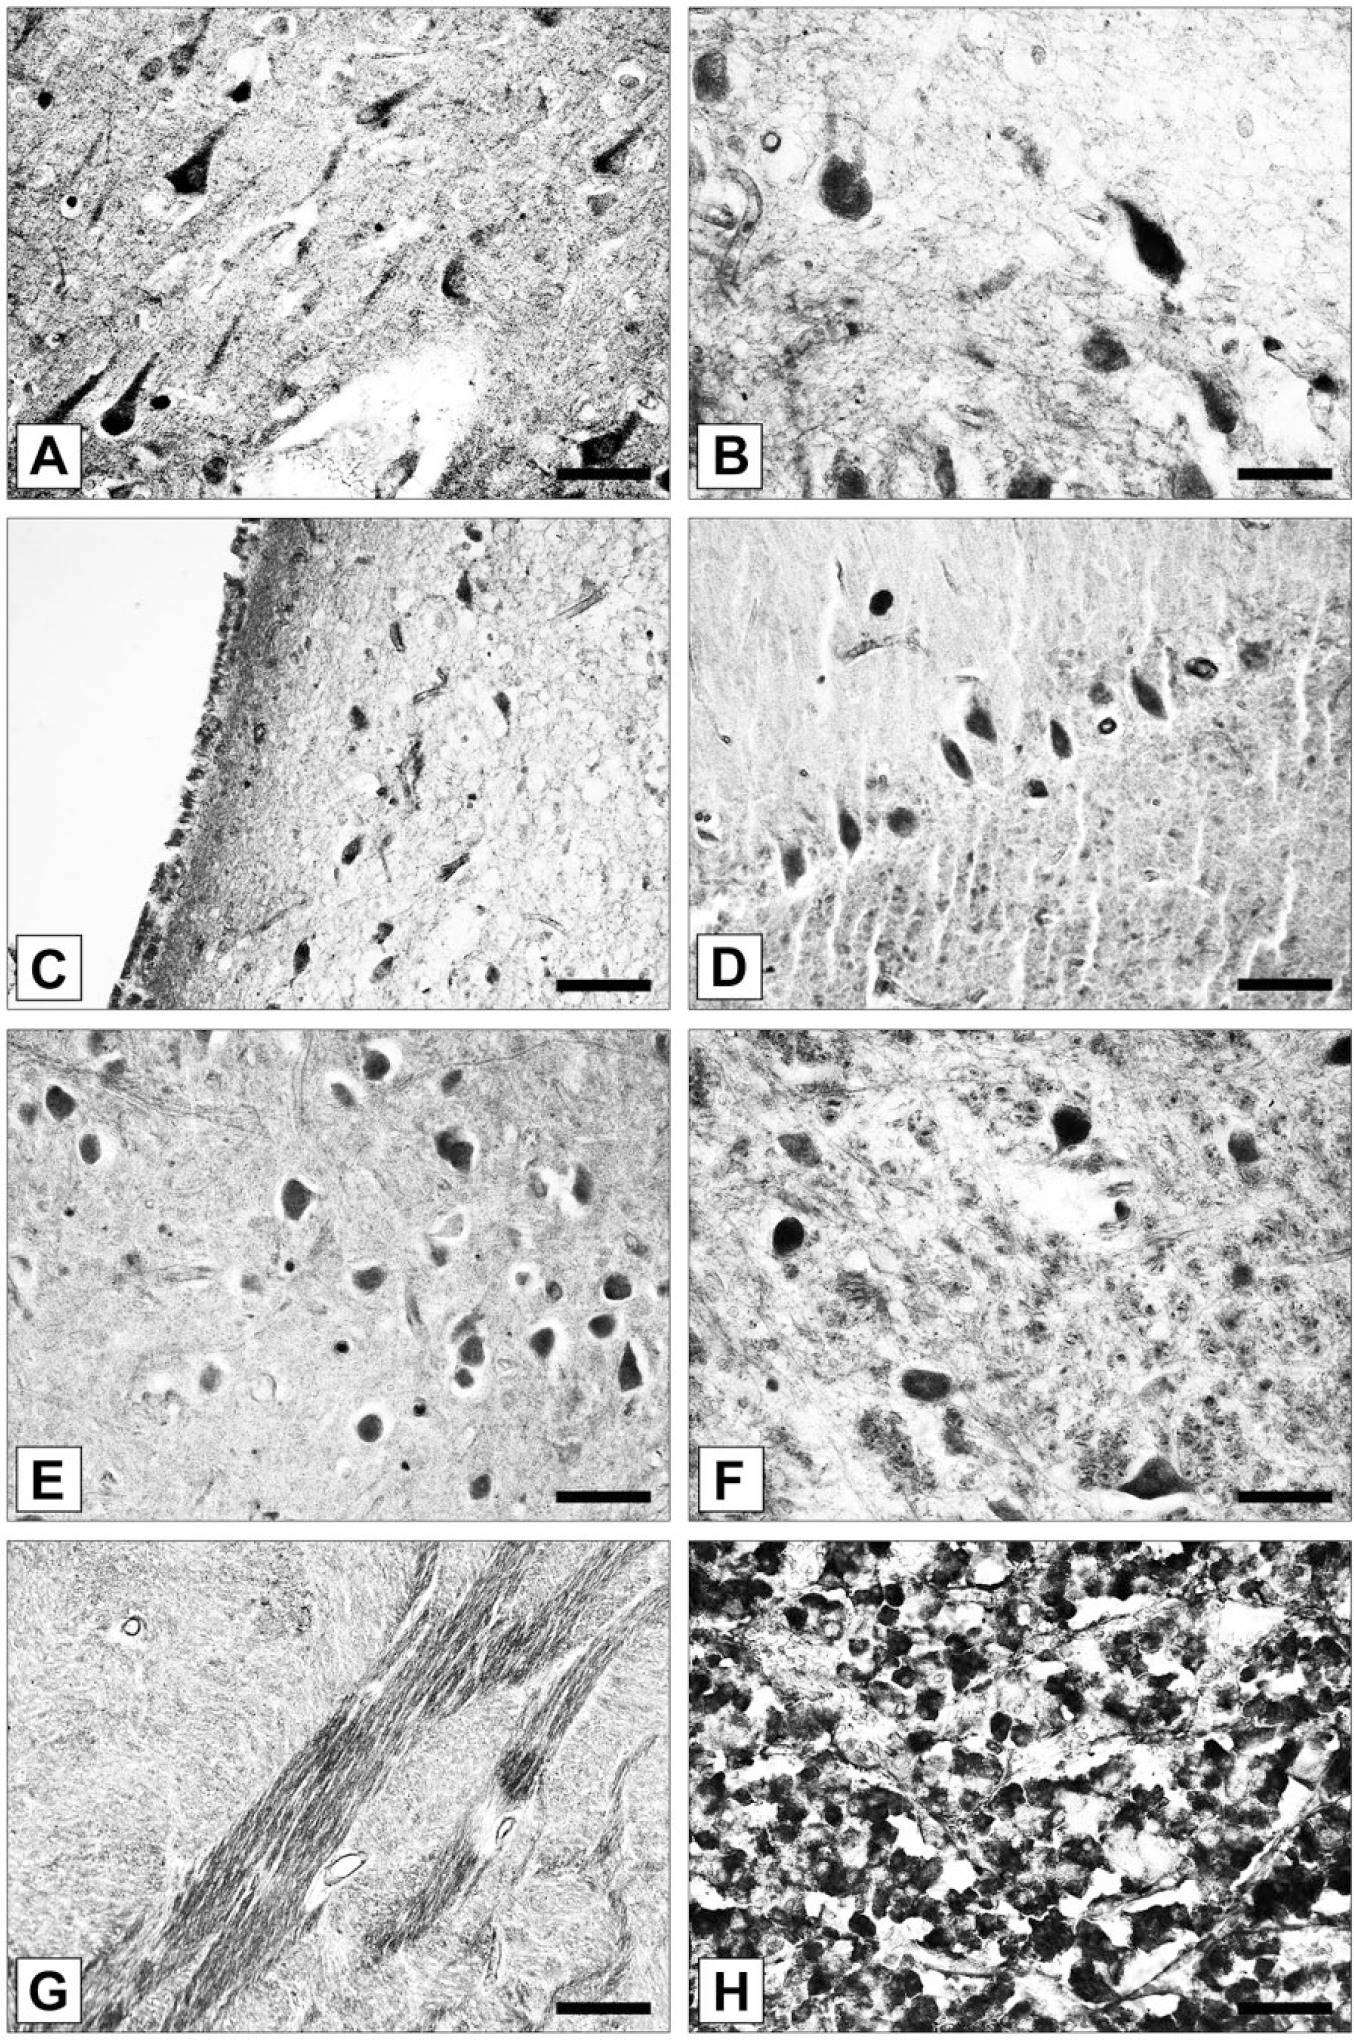
In addition to the immunoblotting experiments, we also performed immunohistochemical staining on adult rat brain slices to investigate the specific region and cellular expression of Calneuron-1. No immunostaining was detectable after omitting the primary antibody and a clearly reduced signal was seen after pre-absorption (Supplemental Fig. 1). As depicted in Figure 3A and 3B using frontal and sagittal whole-brain sections, Calneuron-1 expression can be detected in almost all regions of the brain. Strongest immunolabeling was detected in the hippocampus (Fig. 3C), cortical areas (Fig. 3D), and in the cerebellum (Fig. 3E). The Calneuron-1 antibody strongly labeled the cerebellar Purkinje cells (Fig. 3I) and neurons in the Locus coeruleus (Fig. 3J) and Pontine nuclei (Fig. 3K). A detailed evaluation of the expression and staining intensity in different brain regions is provided in Table 1. At the cellular level, strong immunoreactivity was visible in somata but also in dendritic processes, as shown in higher magnification images of the hippocampus and cortex (Fig. 3F–3H). In double immunofluorescence staining, no co-localization was observed with GFAP-immunopositive astrocytes, shown for the CA1 region of the hippocampus (Fig. 4A) and the dentate gyrus (Fig. 5A). However, Calneuron-1 immunoreactivity was visible in all MAP2-positive cells (Fig. 4B, 5B).
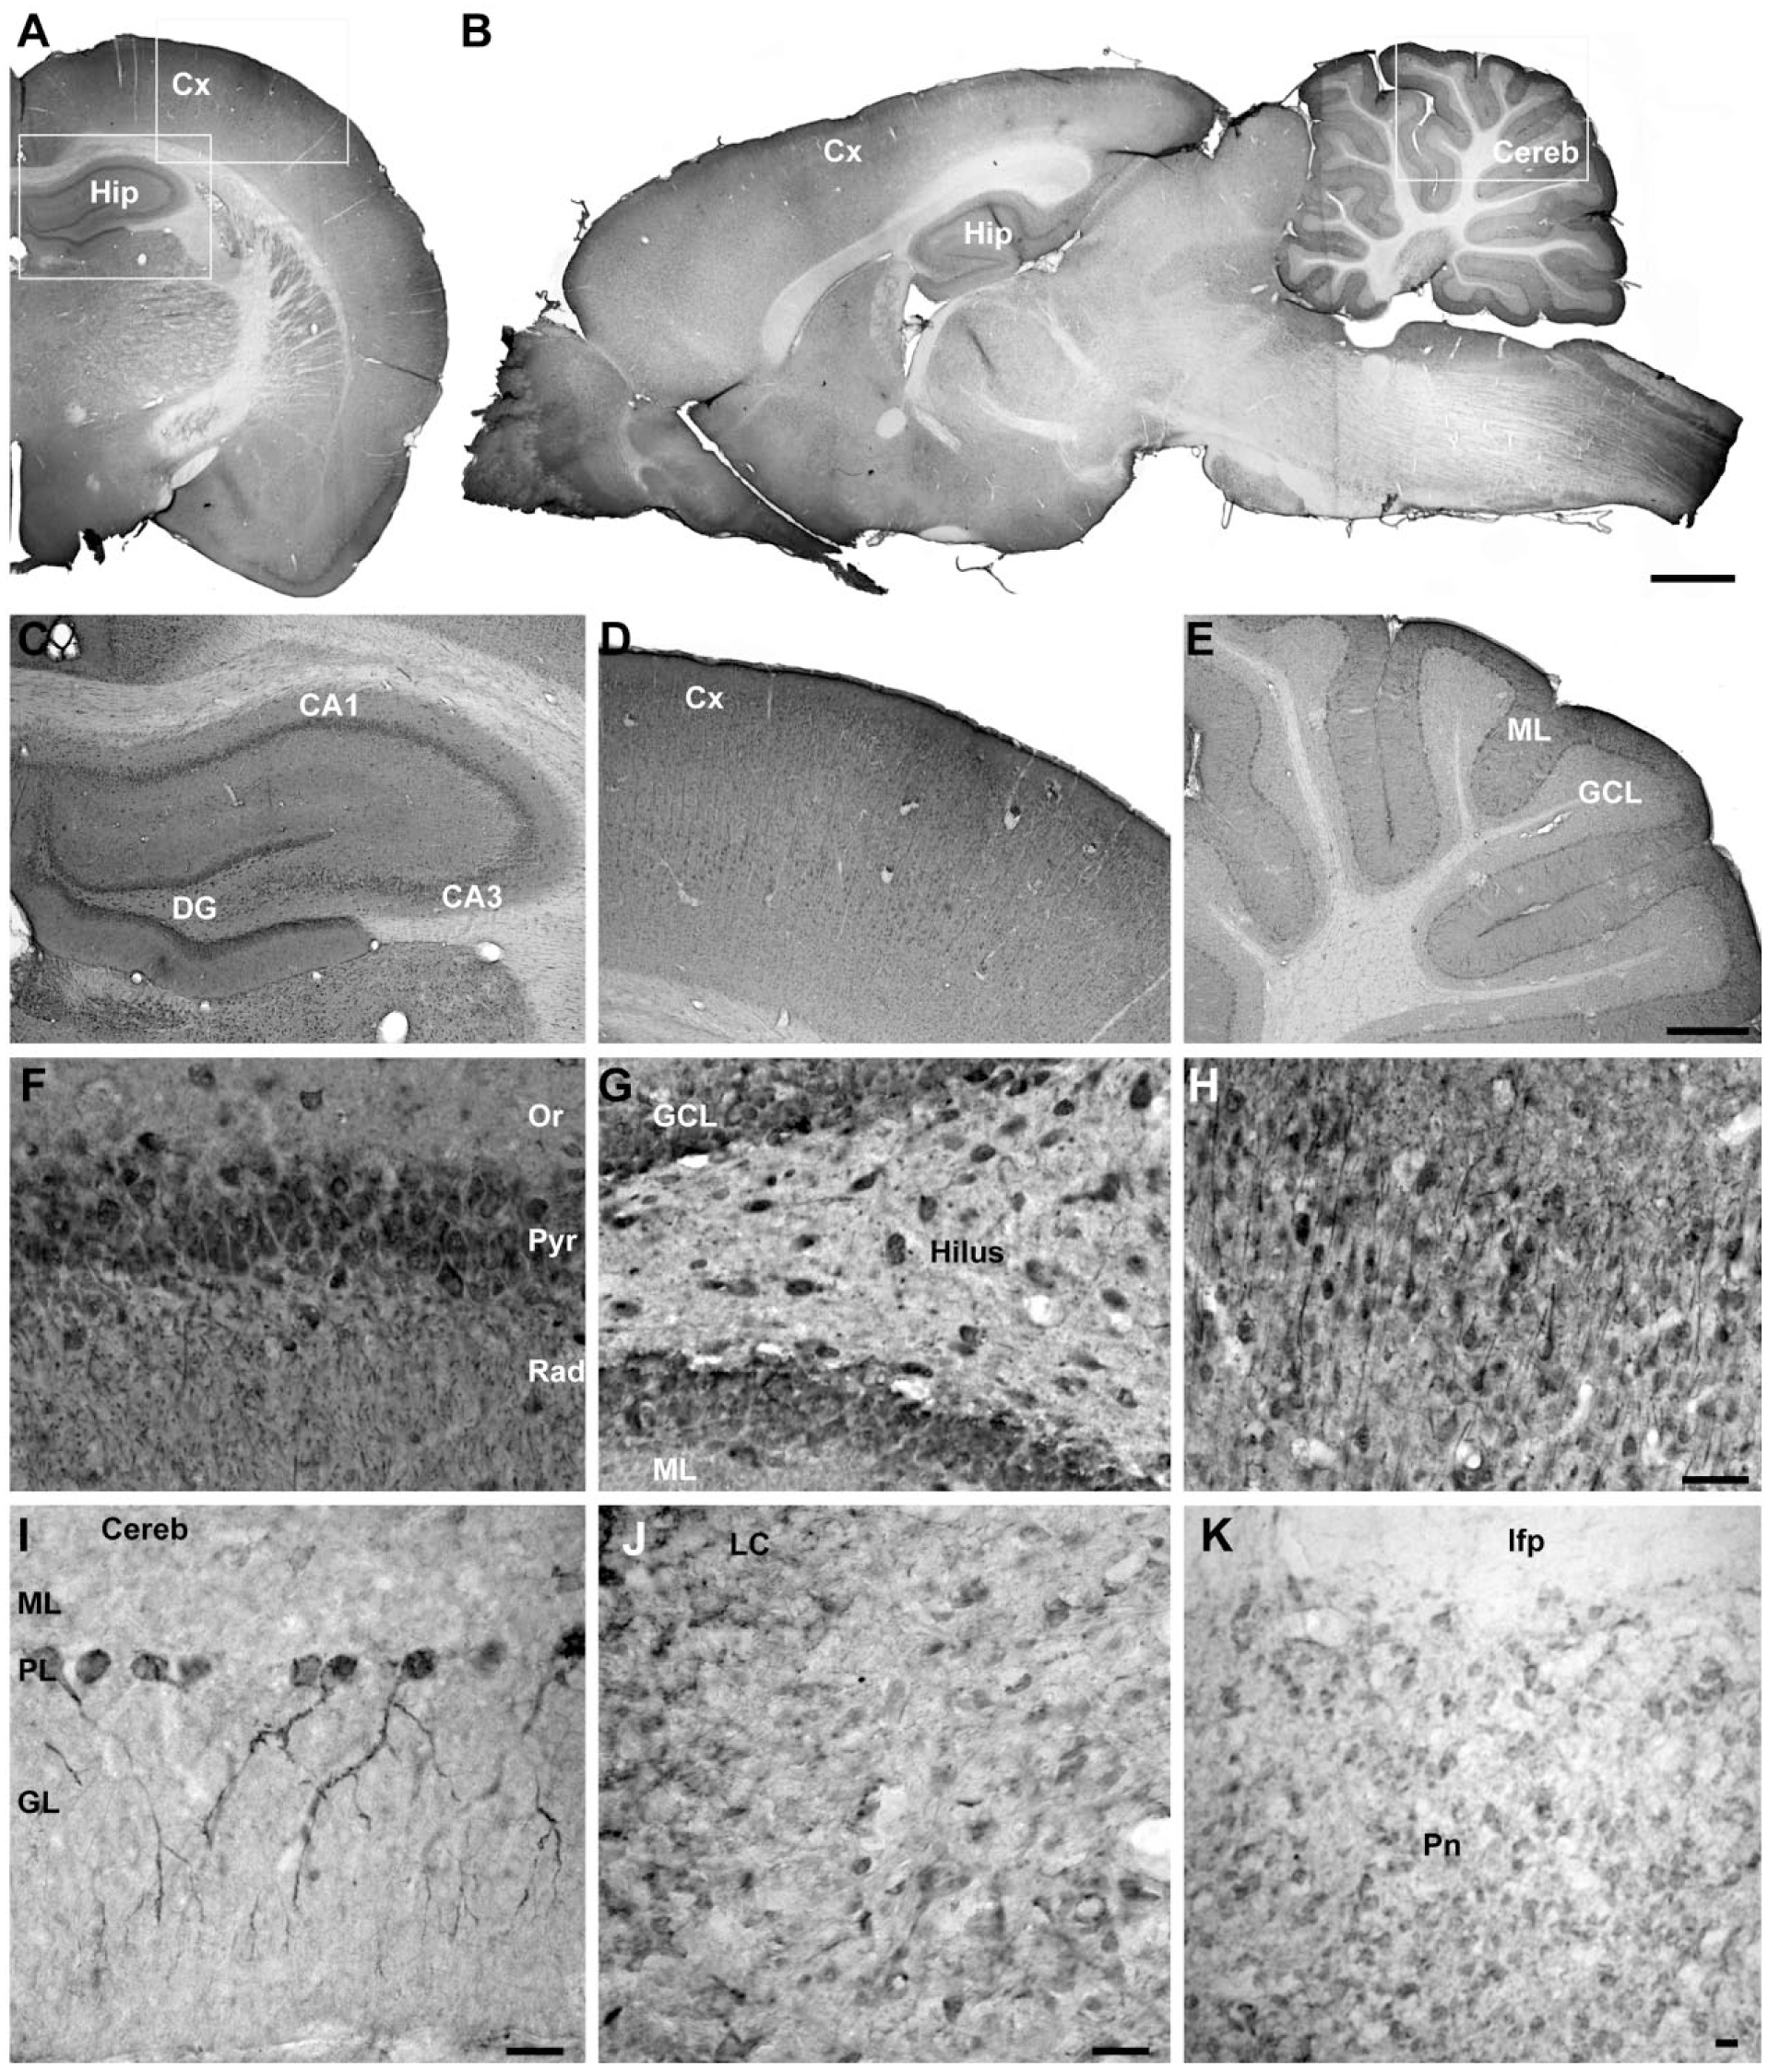
Brightfield images of adult rat brain slices stained with anti-Calneuron-1 antibody and DAB as chromogenic substrate. Overview of frontal (A) and sagittal (B) sections from combined single images. Higher magnified overview of the dorsal hippocampus (C) and cerebral cortex (D) from a frontal slice as well as the cerebellum (E) from a sagittal section. Magnifications of (C) and (D) at cellular level show strong staining intensities in the soma and a lower degree of staining in the dendrites of hippocampal CA1 pyramidal cells and in interneurons within the stratum oriens and stratum radiatum (F), granular cells and interneurons in the dentate gyrus (G), as well as pyramdial cells and interneurons of the cerebral cortex (H). Calneuron-1 antibody staining is strong for cerebellar Purkinje cells (I) and neurons in the Locus coeruleus (J) and Pontine nuclei (K). Scale (A, B) 1 mm; (C–E) 250 µm; (F–H) 25 µm; (I–K) 20 µm. Abbreviations: Hip, hippocampus; Cx, cortex; Cereb, cerebellum; LC, Locus coeruleus; Pn, Pontine nuclei; CA1, Cornu Ammonis area 1; CA3, Cornu Ammonis area 3; DG, dentate gyrus; Or, stratum oriens; Pyr, pyramidal cell layer; Rad, stratum radiatum; GCL, granular cell layer; ML, molecular layer; PL, Purkinje layer; GL, granular layer.
Intensity of Calneuron-1 Staining in Human and Rat Brain.
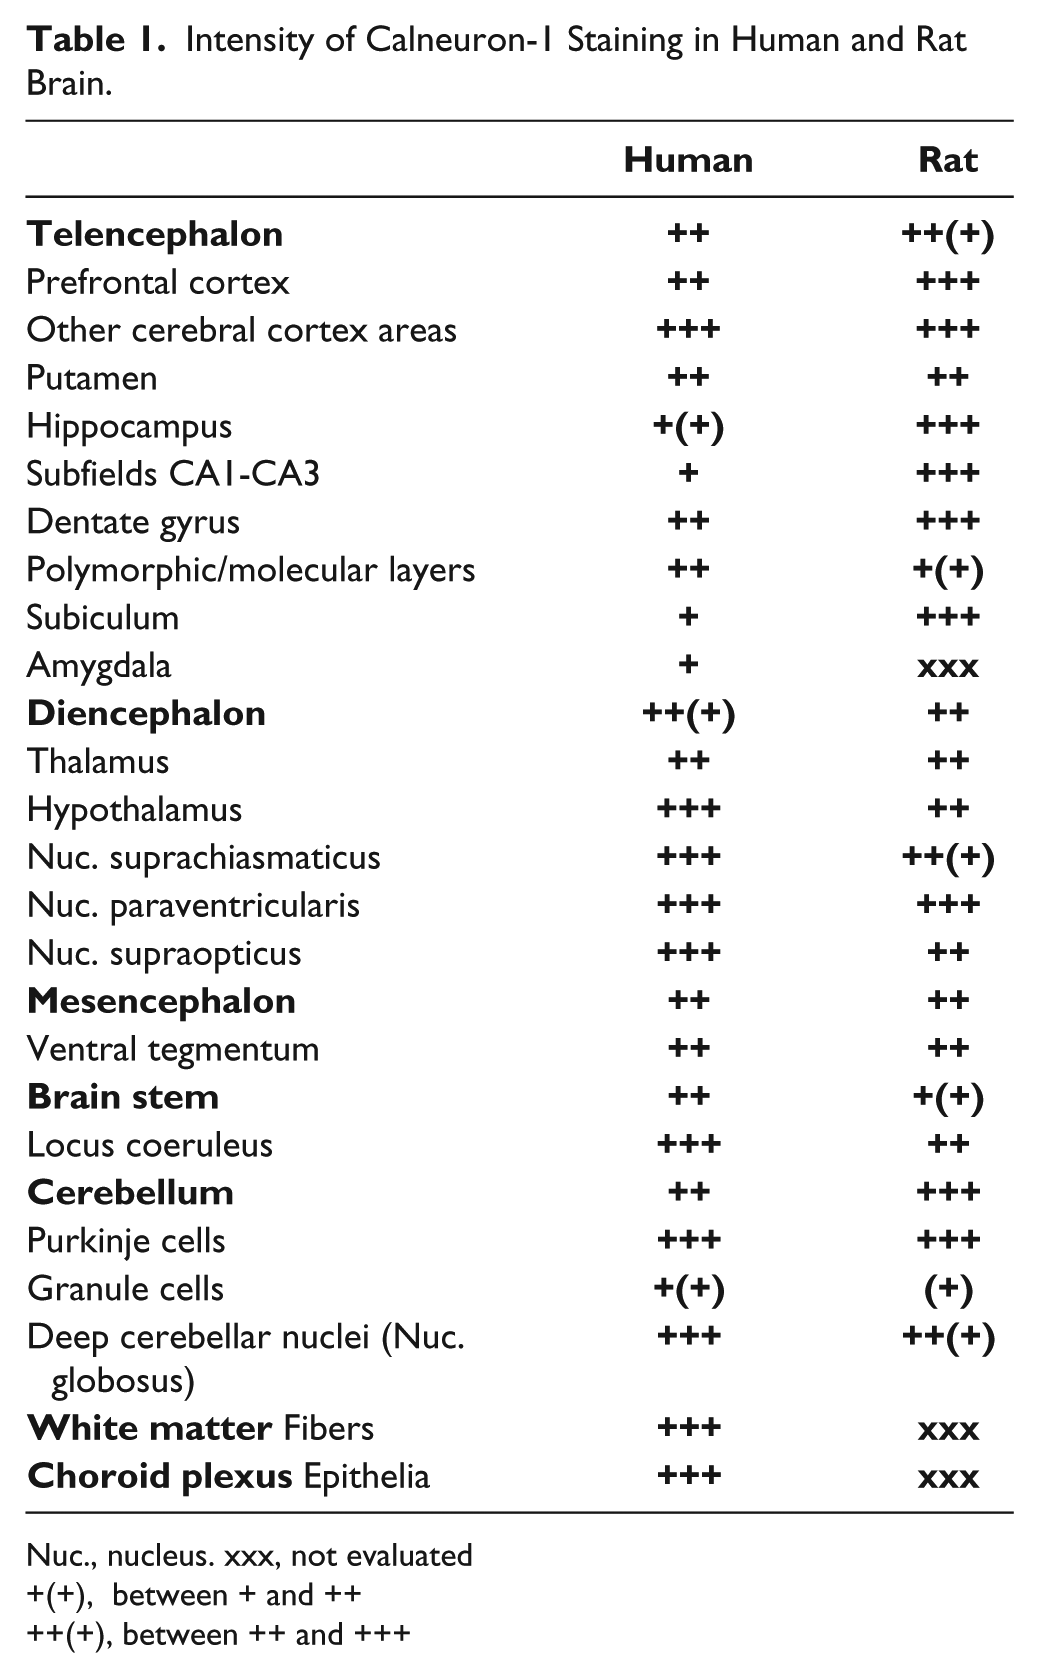
Nuc., nucleus. xxx, not evaluated
+(+), between + and ++
++(+), between ++ and +++
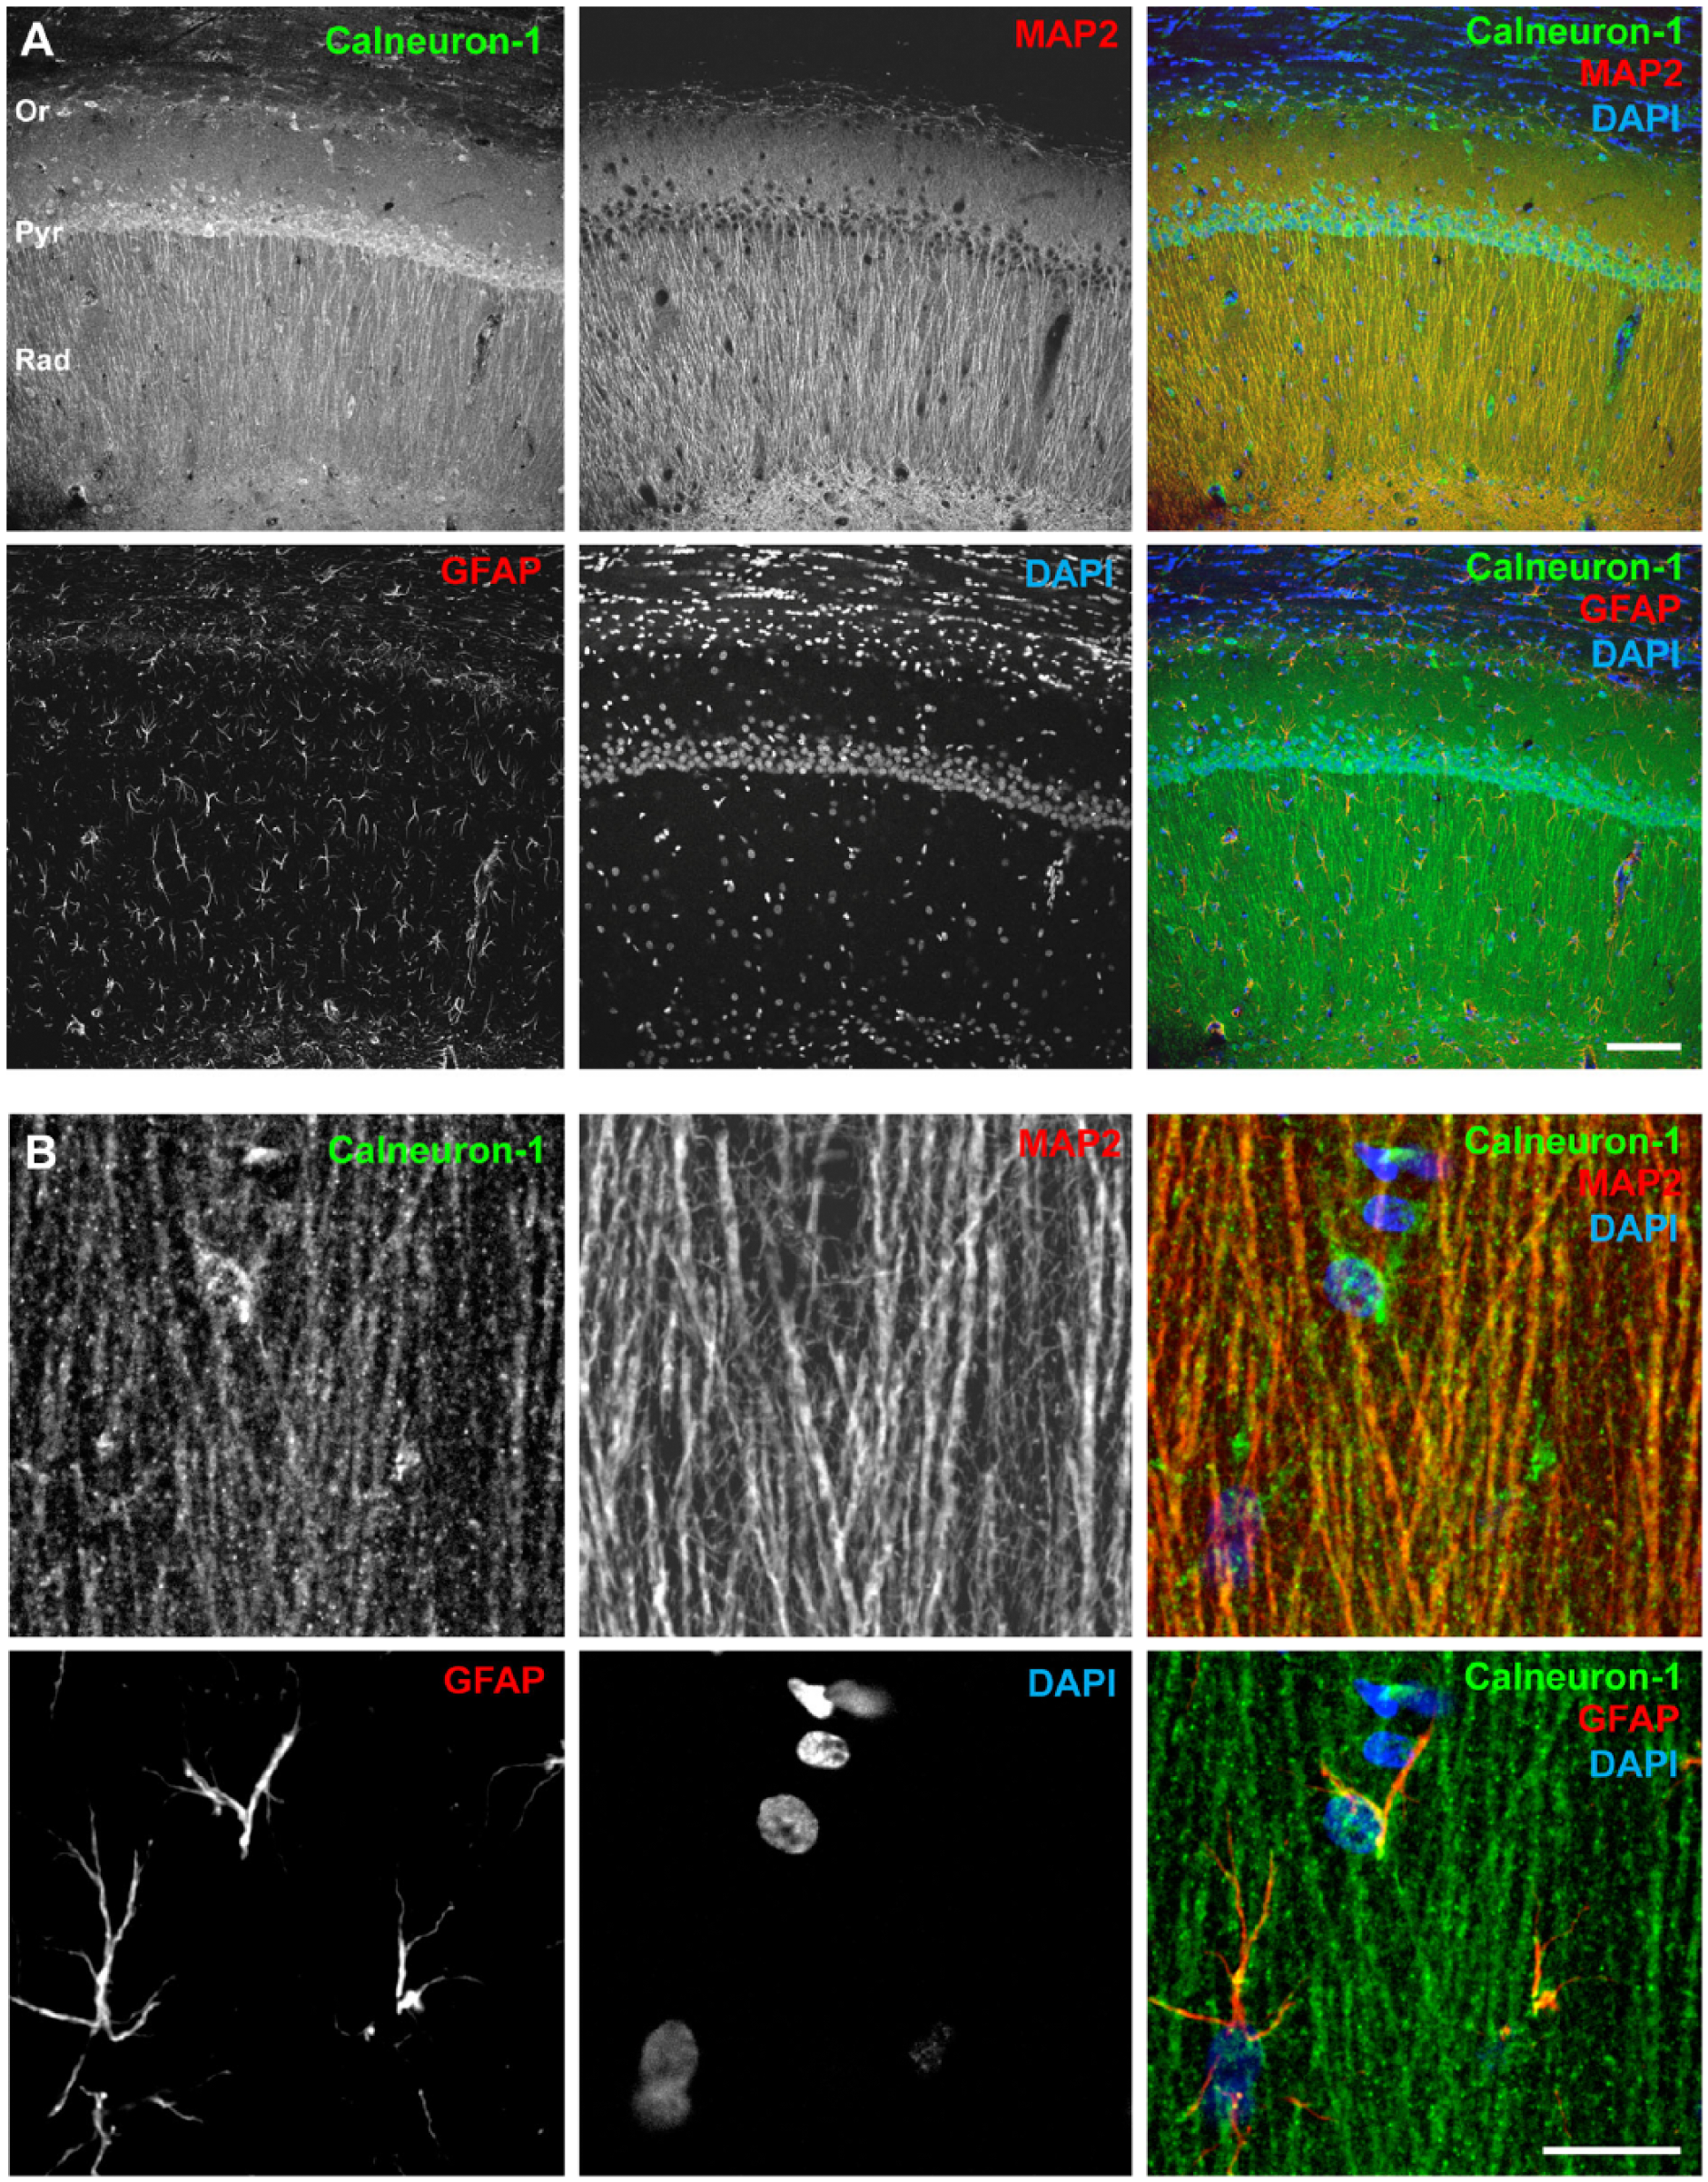
Calneuron-1 is expressed in adult rat hippocampus. (A) Overview of the CA1 area labeled for Calneuron-1, GFAP, MAP2 and nuclear marker, DAPI. Calneuron-1 immunoreactivity was observed in all MAP2-positive neurons, whereas no co-localization was observed with GFAP-immunopositive astrocytes. (B) Higher magnification of the CA1 apical dendrites. Scale (A) 100 µm; (B) 20 µm. Abbreviations: Or, stratum oriens; Pyr, pyramidal cell layer; Rad, stratum radiatum.
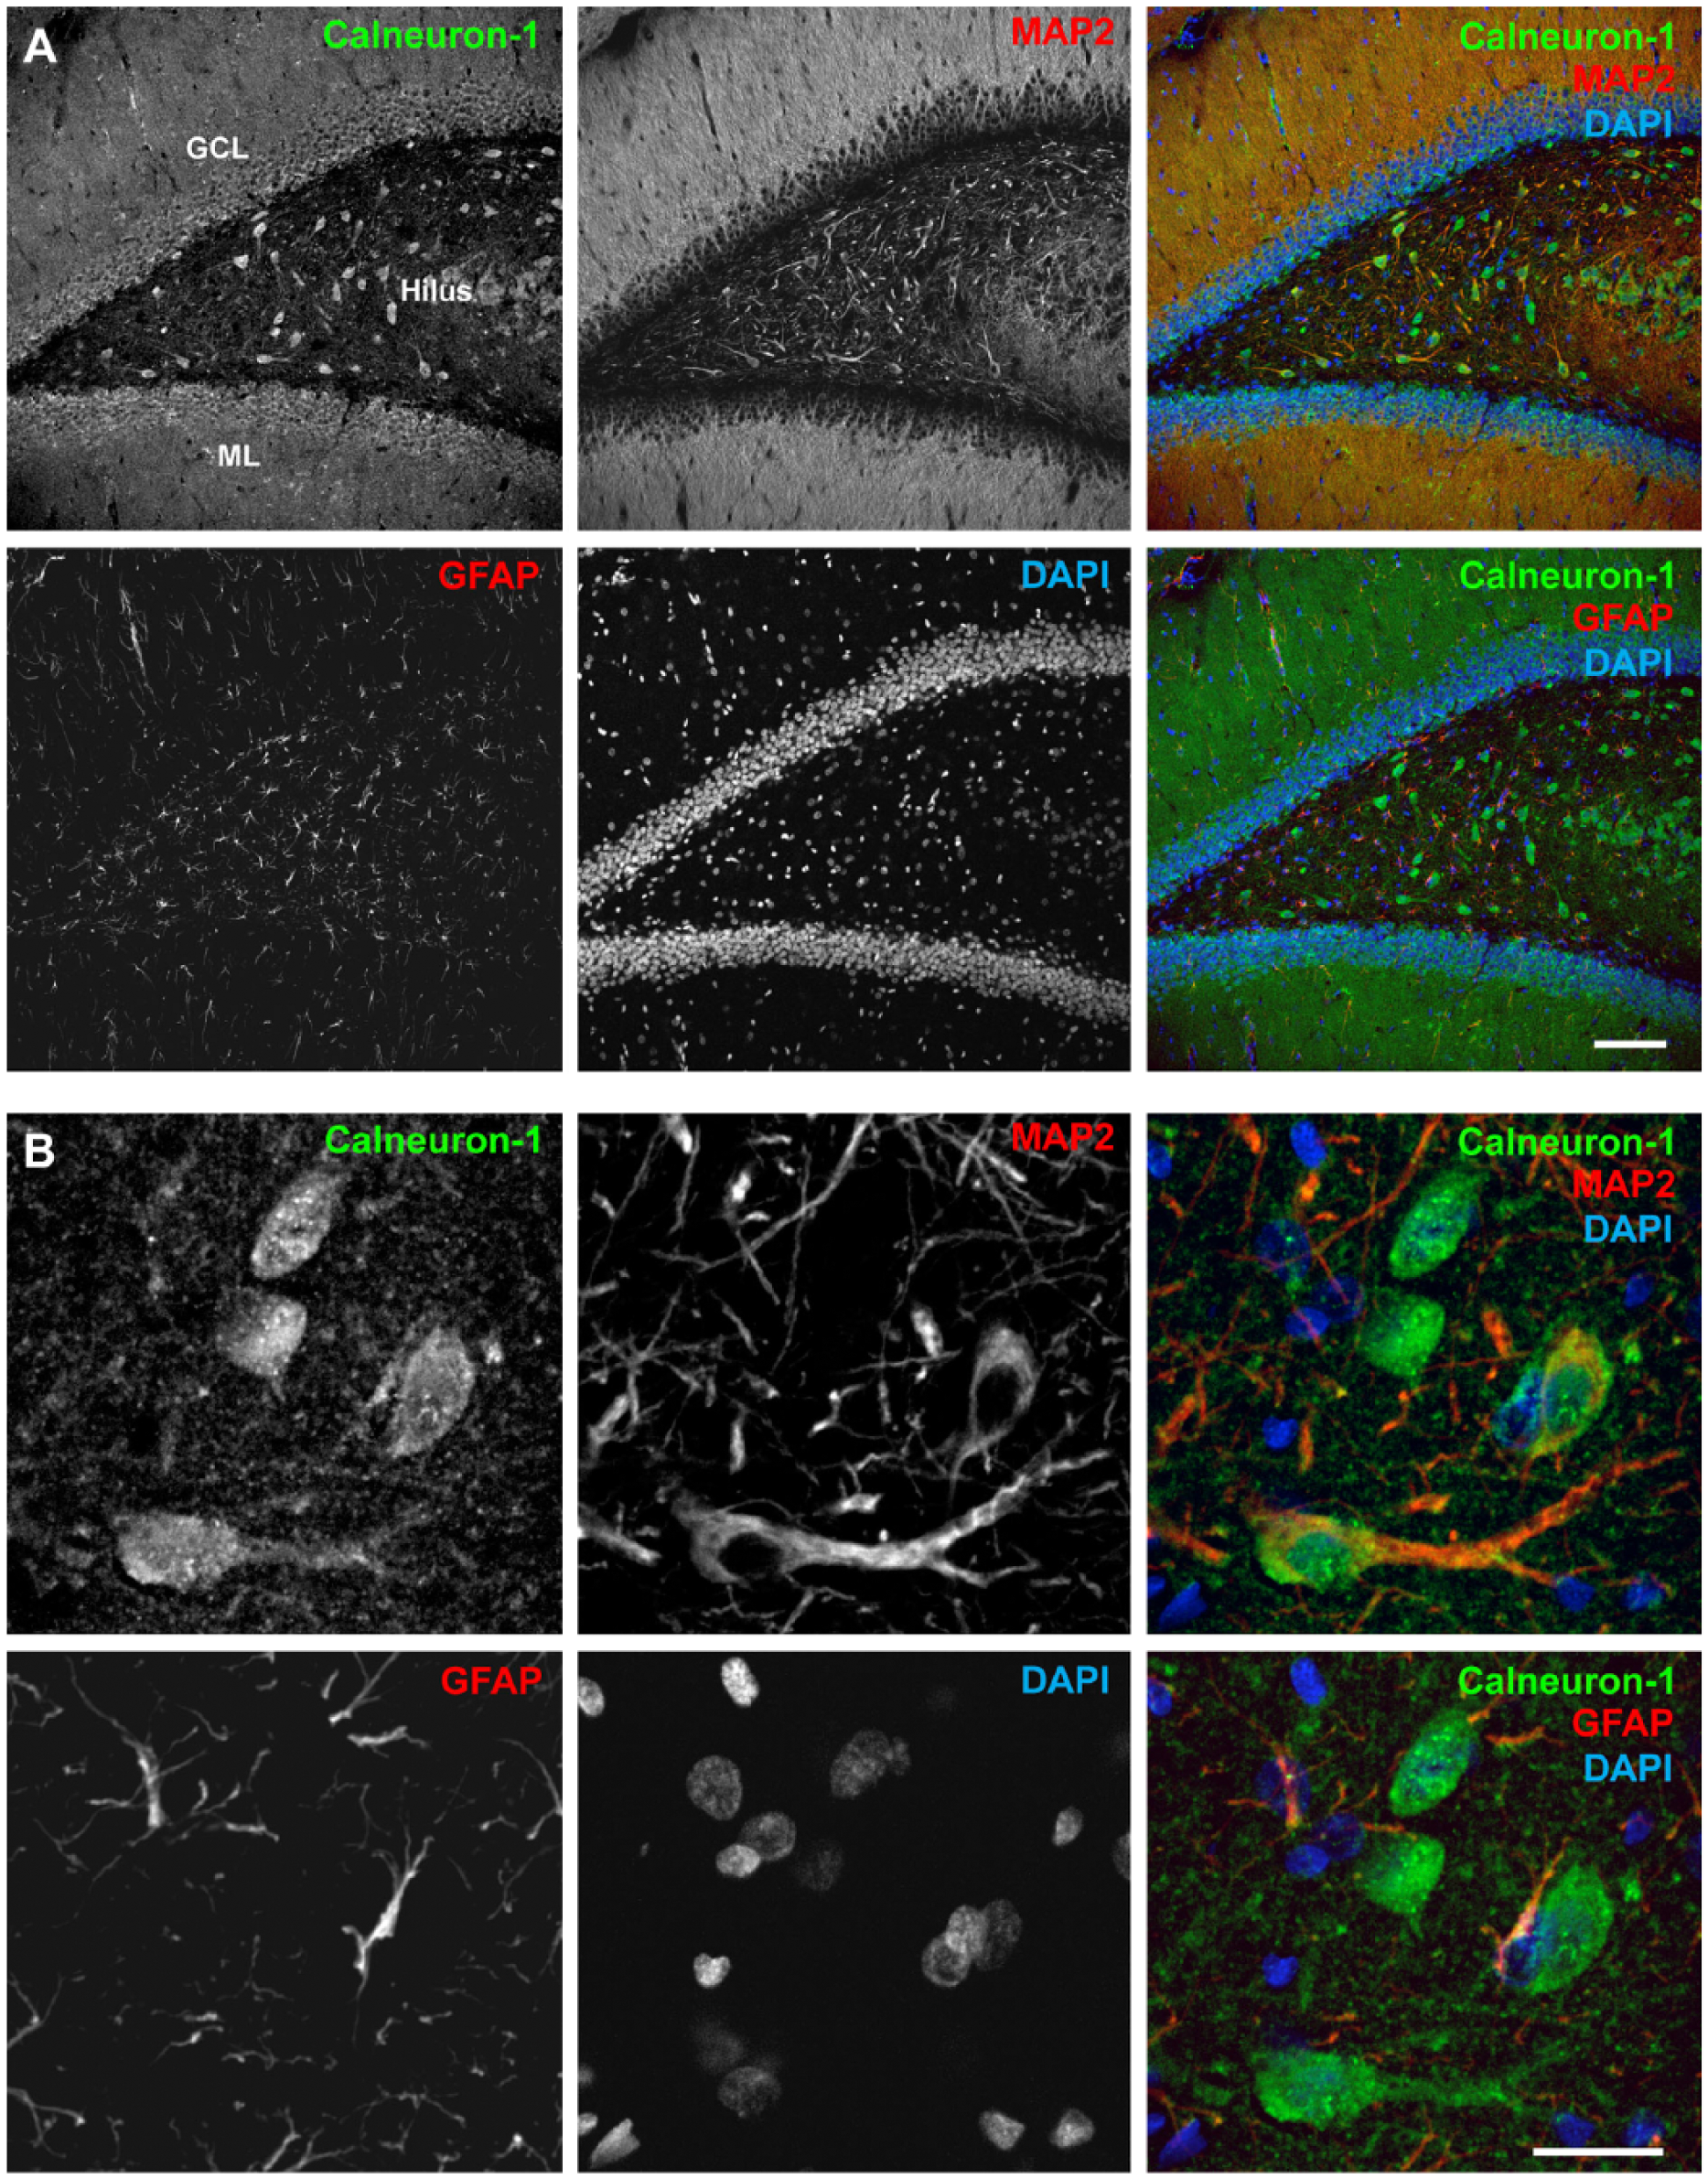
Calneuron-1 is expressed in adult rat hippocampus. (A) Overview of the dentate gyrus area labeled for Calneuron-1, GFAP, MAP2 and the nuclear marker, DAPI. Calneuron-1 immunoreactivity was noted in all MAP2-positive cells, whereas no co-localization was observed with GFAP-immunopositive astrocytes. (B) Higher magnification of neuronal processes of the dentate gyrus. Scale (A) 100 µm; (B) 20 µm. Abbreviations: GCL, granular cell layer; ML, molecular layer.
Regional and Cellular Distribution Patterns of Calneuron-1 Immunoreactivity in Human Brain
The distribution of Calneuron-1 immunoreactivity in human brain is summarized in Table 1. Calneuron-1 immunoreactivity in the human brain was nearly exclusively found in neurons (Fig. 6). Calneuron-1-immunopositive neurons were found in all cortical areas under investigation (parahippocampal, entorhinal, orbitofrontal, inferior temporal, medial temporal, medial frontal, superior frontal, anterior cingulate, and dorsolateral prefrontal cortex). However, the number of strongly stained Calneuron-1-immunopositive nerve cells was rather low in prefrontal cortical areas such as the anterior cingulate or dorsolateral prefrontal cortex, whereas strong immunostaining was visible in the large layer III and layer V pyramidal cells (Table 1). In other cortical areas, such as the medial and inferior temporal cortices, Calneuron-1 was found to be abundant in multiple neurons situated in all cortical layers (Fig. 6A). The intracellular immunoreaction was located in perikarya and dendrites (Fig. 6A). Typically, cell nuclei were free of reaction product. At times, the neuropil showed a weak to moderate immunoreactivity for Calneuron-1.
(A) Immunolocalization of Calneuron-1 in multiple pyramidal cells and interneurons of the human temporal cortex. Somata and proximal dendrites are immunolabeled. (B) High-power microphotograph showing Calneuron-1-immunopositive neurons in the hypothalamic supraoptic nucleus (SON). (C) Calneuron-1-expressing neurons in the hypothalamic suprachiasmatic nucleus. (D) Calneuron-1-immunoreactive neurons in the cerebellum. Purkinje cells highly express the protein, whereas only a weak expression is seen in the majority of granule cells. (E) Intense immunostaining for Calneuron-1 in cerebellar nucleus (Nuc.) globosus neurons. (F) Calneuron-1 is highly expressed in a subset of Locus coeruleus neurons. (G) Calneuron-1 immunoreactivity is observed in fiber tracts of the Capsula externa. (H) Human adenohypophysis. Multiple cells are intensely immunostained for the protein. Scale (A) 40 µm; (B, F) 25 µm; (C) 70 µm; (D, E, G) 50 µm; (H) 70 µm.
In the hippocampus, the majority of CA1, CA2 CA3 polymorphic and subicular pyramidal neurons showed Calneuron-1 immunostaining (Table 1). Dentate gyrus neurons were moderately stained for the protein (Table 1). A small number of amygdaloid neurons were immunoreactive for Calneuron-1. Some immunopositive nerve cells were scattered over the entire striatum. Intensely immunostained cells were observed in the subventricular zone. The hypothalamus was among the brain regions with the most prominent immunolocalization of Calneuron-1. Particular pronounced immunostaining appeared in magno- and parvocellular neurons of the paraventricular nucleus as well as in neurons situated in the supraoptic and suprachiasmatic nuclei (Fig. 6B, 6C). Similar to the rat, somata of the Purkinje neurons from human samples were strongly immunostained for Calneuron-1 (Fig. 6D). At times, the reaction product was also observed in Purkinje cell dendrites. Besides, granule cells appeared more weakly immunolabeled (Fig. 6D), whereas strongly immunoreactive neurons were detected in the deep cerebellar nucleus globosus (Fig. 6E). Interestingly, strong immunostaining was seen in neuronal cells of the locus coeruleus (Fig. 6F) and numerous fiber bundles were immunopositive for Calneuron-1, indicative of an axonal localization (Fig. 6G). Interestingly, we also observed that multiple adenohypophyseal cells expressed Calneuron-1 (Fig. 6H), indicating expression of the protein in secretory cells of the pituitary gland.
Discussion
In this study, we provide the first overview of Calneuron-1 protein expression in rat and human brains. We found expression of Calneuron-1 in various neuronal cell types and in all brain regions examined; albeit, the expression levels appear to differ among the tissues examined, as evidenced by immunohistochemistry and western blotting. A comparison between human and rat brain revealed a very similar distribution, with prominent neuronal expression and no indication for immunolabeling in glial cells. Taken together, the widespread expression probably indicates no specific function in certain neuronal cell types but a more general role in Golgi-to-plasma membrane trafficking as reported previously (Mikhaylova et al. 2009). Although Calneuron-1 immunoreactivity was most prominent in somata, it was also detectable in processes, which might reflect association with vesicles and post-ER secretory carriers in dendrites. Along these lines, in a recent study an association with purinergic A2A and dopaminergic D2 receptors was reported (Navarro et al. 2014).
Calneuron-1 is highly conserved during evolution, with 99% identity at the amino acid level between rat and human (Mikhaylova et al. 2006). Given the rather similar distribution observed in human and rat brain, it is likely that both proteins have conserved functions in several neuronal cell types. Many calcium sensors of the NCS and nCaBP families exhibit a much more restricted expression pattern (Mikhaylova et al. 2011). With the exception of Caldendrin, Calneurons are the only nCaBP family member expressed abundantly in the brain; Calneuron also exhibits a more widespread distribution than Caldendrin and appears to be expressed in all major neuronal cell types, as shown here and by others (Laube et al. 2002). The Calneuron proteins comprise their own subfamily within the nCaBPs (McCue et al. 2010; Mikhaylova et al. 2006, 2011), with a non-functional C-terminal EF-hand domain (McCue et al. 2011; Mikhaylova et al. 2006). Both Calneuron proteins show very high similarity to each other, with 64% identity at the amino acid level but only 30% to their closest relative Caldendrin in the nCaBP family (McCue et al. 2010; Mikhaylova et al. 2010, 2011). Of interest in this regard is the identification of two novel splice isoforms of Calneuron-1 in this study. The function of the extended N-terminus in these splice isoforms is at present unclear. Aside from the PxxP motif for potential SH3 domain binding, these proteins do not contain any other motif that would point to specific functions of the protein; but it is conceivable that they either might provide binding interfaces for specific interaction partners or alter the properties of the EF-hand containing C-terminus. In summary, we found that Calneuron-1 is, in contrast to many other neuronal calcium sensor proteins, expressed in the majority of neuronal cell types in the brain and might have conserved functions in these cells that probably includes regulation of Golgi-to-plasma membrane trafficking.
Footnotes
Acknowledgements
The authors gratefully acknowledge the professional technical assistance of Corinna Borutzki and Stefanie Hochmuth from the Leibniz Institute for Neurobiology.
Competing Interests
The authors declared no potential competing interests with respect to the research, authorship, and/or publication of this article.
Author Contributions
JH, HGB, MMikhaylova, and MMarunde performed experiments; JH, HGB, MMikhaylova and MRK analyzed data; JH, HGB Mikhaylova and MRK designed experiments. JH, HGB, MMikhaylova and MRK wrote the paper. All authors have read and approved the final manuscript.
Funding
The authors disclosed receipt of the following financial support for the research, authorship, and/or publication of this article: This work was supported by grants of the Deutsche Forschungsgemeinschaft; Grant number Kr1879/3-1 and SFB TPB8 (to M.R.K.) and DFG Emmy-Noether Programm (Ml 1923/1-1) to MMi.
References
Supplementary Material
Please find the following supplemental material available below.
For Open Access articles published under a Creative Commons License, all supplemental material carries the same license as the article it is associated with.
For non-Open Access articles published, all supplemental material carries a non-exclusive license, and permission requests for re-use of supplemental material or any part of supplemental material shall be sent directly to the copyright owner as specified in the copyright notice associated with the article.