
Abstract
Phosphohistone H3 (pHH3), a biomarker of the late G2- and M-phase of the cell cycle, provides a powerful indication of the proliferative state of many cancers. We investigated the prognostic significance of pHH3 by immunostaining 80 neuroblastomas and counting the average number of strongly stained nuclei and mitotic figures. The median and 75th percentile pHH3 proliferation indices (PIs) were 0.54% and 1.06% (range, 0.01% to 2.23%) respectively. pHH3 expression was significantly higher in neuroblastomas from patients with adverse clinical characteristics, all unfavorable pathological factors including high mitosis karyorrhexis index (MKI), and adverse biological factors including MYCN oncogene amplification. High pHH3-PIs, at 1% threshold, were significantly associated with a shorter overall survival (OS) and event-free survival (EFS) in the univariable Cox regression analyses. In the multivariable models, high pHH3 counts were significantly associated with worse OS after adjustment for age but were not independent of either high MKI or MYCN amplification. In children less than 18 months of age, high MKIs and high PHH3-PIs were associated with significantly worse OS and EFS. In conclusion, high pHH3 expression correlates strongly with high MKI and MYCN amplification and indicates poor prognosis in neuroblastomas.
Introduction
Neuroblastomas (NBs) are embryonal tumors arising in the sympathetic nervous system. They comprise a heterogeneous group with prognosis in well-defined subsets ranging from death for high-risk disease to long-term survival for those with low-risk disease. The estimated 5-year survival rates for patients with non-high-risk and high-risk NBs are 90% and 50%, respectively (Park et al. 2013). Adverse clinical prognostic factors include age ≥18 months at diagnosis, advanced-stage (stage 4), and abdominal location of the primary tumor. Unfavorable biological factors include MYCN oncogene amplification and segmental chromosomal abnormalities such as loss of chromosome 1p, 11q deletion, or gain of chromosome 17q (Cohn et al. 2009). Unfavorable pathological features comprise un-differentiated or poorly-differentiated status, high mitosis karyorrhexis index (MKI) and unfavorable prognostic group, as defined by the international neuroblastoma pathology classification (INPC) system (Shimada et al. 1999a; Shimada et al. 1999b). MKI, the average sum of mitotic figures and karyorrhectic nuclei in 5000 tumor cells, is a major determinant of the age-linked prognostic system in the INPC system (Shimada et al. 1999a). The recent International Neuroblastoma Risk Group (INRG) classification system stratifies children diagnosed with peripheral neuroblastic tumors into risk categories to ensure homogeneous pretreatment groups using seven variables: INRG stage, age, histological category, grade of tumor differentiation, MYCN status, chromosome 11q status and DNA ploidy (Cohn et al. 2009).
Proliferation markers that are expressed in the specific phases of the cell cycle provide greater prognostic value and possibilities for therapeutic intervention in cancers than Ki67, which is expressed in all phases of the active cell cycle (Williams and Stoeber 2012). Phosphohistone H3 (pHH3) is strongly expressed in the late G2- and M-phase (mitotic-phase) of the cell cycle, and high pHH3 expression has been shown to correlate with shorter survival in a variety of tumors such as those of the central nervous system (Colman et al. 2006; Kim et al. 2007), melanomas (Ladstein et al. 2012; Tetzlaff et al. 2013) and carcinomas (Aune et al. 2011; Gudlaugsson et al. 2013; Klintman et al. 2013; Nakashima et al. 2013; Nowak et al. 2014; Skaland et al. 2007). Furthermore, in a series of lymph node-negative breast cancer patients, high pHH3 expression emerged as the strongest prognostic variable (Skaland et al. 2007).
As the previous report of pHH3 in NBs included only six samples (Idikio 2006), here pHH3 immunoexpression was investigated in a series of NB samples by traditional optical microscopy to determine the following: (1) the potential significance of pHH3, based on associations with the well-established clinical, biological and pathological features; and (2) its value as an indicator of prognosis.
Materials & Methods
Patients and Tissue Samples
The study cohort consisted of 80 patients with malignant peripheral neuroblastic tumors (NBs and ganglioneuroblastomas, GNBs) treated at Bristol Children’s Hospital between January 1994 and November 2013. Staging was based on the International Neuroblastoma Staging criteria (Brodeur et al. 1994; Brodeur et al. 1988): stage 1, n=7 (9%); stage 2, n=11 (14%); stage 3, n=18 (22%); stage 4, n=39 (49%); stage 5, n=5 ( 6%). The distribution of the number of cases in each stage was in line with a large European study comprising 1277 cases (Cotterill et al. 2000). Subjects were treated according to the appropriate clinical protocols based on these characteristics. Clinical information was extracted from medical records, and all patient data were de-identified. The tumors were classified into prognostic groups according to the INPC system (Peuchmaur et al. 2003; Shimada et al. 1999a): NBs (n=79) and GNB (n=1), which was of the nodular subtype.
All samples were obtained from the Pediatric Pathology files of the Bristol Royal Infirmary. Paraffin-embedded specimens were available for all 80 patients, and all of the samples were obtained at primary resection (stages 1 and 2) or before chemotherapy was administered (stages 3 and 4). The study was approved by the South Bristol and North Somerset Research Ethics Committee (09/H0106/06).
Immunohistochemistry
Four-µm-thick serial sections from a representative paraffin-embedded block of each tumor were processed using steamer antigen retrieval for 20 min in Bond Epitope Retrieval Solution 2 (no.AR9640, Leica Biosystems, Newcastle Ltd, Newcastle upon Tyne, UK) of the BOND-III automated immunostainer (Leica Biosystems, Melbourne, Australia). Rabbit polyclonal anti-pHH3 (pHH3 Ser10, #06-570, Merck-Millipore, Watford, UK) was applied in 1:1000 dilution for 1 hr. Ki67 immunostaining was performed using anti-MIB1 antibody (1:100, mouse monoclonal, Dako; Glostrup, Denmark) for 1.5 hr. A reactive lymph node was used as a control for both antibodies. Mitotic figures in the germinal center of the lymphoid follicles served as positive controls. Each test slide was checked for the presence of at least one pHH3-immunoreactive nucleus or mitotic figure to ensure that the test worked. Omission of the primary antibody served as negative control for each antibody.
Assessment of MKI and pHH3 Proliferation Indices
MKIs were counted by taking an average of the mitoses and karyorrhexis in a background of at least 5000 neuroblastoma cells, as recommended by the INPC (Shimadaet al. 1999a). Similarly, Ki67-immunostained nuclei were counted as an average by optical microscopy. Strong pHH3 immunoexpression was noted in the nuclei and mitotic figures (prophase, metaphase, anaphase and telophase) (Skaland et al. 2007); these were counted as averages against a background of 5000 neuroblastoma cells in multiple representative fields by two observers using optical microscopy. The mean counts of the two observers were used for analyses.
Ki67 proliferation indices (Ki67-PIs) and pHH3 proliferation indices (pHH3-PIs) were calculated as the total number of Ki67-immunostained nuclei or pHH3-immunostained nuclei plus mitotic figures divided by the total number of tumor cells (immunolabeled-Ki67 or pHH3 plus hematoxylin-stained nuclei) × 100, respectively.
Statistical Analyses
Non-parametric methods were used to study the relationships between the pHH3-PI values with clinical, pathological and biological factors because the PI values were not normally distributed. When two groups were compared, we used a two-tailed Mann-Whitney U-test, and when more than two groups were compared, we used a Kruskal-Wallis test. Chi-square test (or the Fisher’s exact test) was used to compare the proportion of patients with the MKI classes (high, intermediate and low) and pHH3-PIs (< vs > median or < vs > threshold 1%) levels for different categories of clinical, pathological and biological prognostic variables. Spearman correlation and kappa statistical analyses were performed to study the agreement between the pHH3-PI counts of the two observers.
Patients with stage 1, 2, 3 and 4s tumors were combined due to their clinical similarities and the smaller number of patients in these groups. Patients were divided into high-risk and non-high-risk groups. Patients with non-amplified MYCN stage 1, 2, 3, 4s tumors and children <18 months with stage 4 disease and NBs that lacked MYCN amplification were classified as non-high-risk. Patients with MYCN amplified tumors and children ≥18 months of age with stage 4 disease were classified as high-risk.
Event-free survival (EFS) was calculated from the time of diagnosis until the time of first occurrence of relapse, progression, secondary malignancy, or death, if none of the former had occurred. Overall survival (OS) was determined from the time of diagnosis to death. Kaplan–Meier and Cox regression estimates for OS and EFS were calculated for the subgroups defined as high or low by dichotomizing pHH3-PI counts based on the median values as (<0.54 vs >0.54) or threshold of 1% (~75% percentile).
Cox proportional hazards regression models were used to estimate unadjusted hazard ratios for OS and EFS by patient characteristics, and clinical and pathological markers of disease. Multivariable Cox models were used to estimate hazard ratios for OS and EFS by high and low categories using the threshold of 1% adjusted for MKI, MYCN amplification and age for the entire cohort (n=80). To prevent the confounding effect of age, and in line with the INRG methodology (Cohn et al. 2009), we analyzed MKI and age separately in lieu of the INPC.
Because high MKI was the strongest prognostic histology variable in children younger than 18 months in the INRG analyses (Cohn et al. 2009), univariable Cox proportional hazards regression analyses of pHH3-PIs (average counts) using a threshold of 1% and MKI classes were performed in the subset of children younger than 18 months of age with NBs and nodular GNB in our cohort (n=42). Multivariable Cox proportional hazards regression analyses of pHH3-PIs with adjustment for MKI and age were also performed. The statistical analyses were performed using the Stata 13.0 software package (Stata for Windows, StataCorp; College Station, TX).
Results
Clinical Characteristics of the Patients
The clinical characteristics of the 80 patients with NBs and nodular GNBs are summarized in Table 1. The median age at presentation of the entire cohort (n=80) was 15.2 months (range, 0.03–221.3 months). Within the subset of children younger than 18 months (n=42), the median was 5.90 months (range, 0.03–15.54 months). The median follow-up time for all of the survivors was 121.3 months (range, 30.7–242.2 months).
Relationship between Phosphohistone H3 Proliferation Index with the Variables in Nodular Ganglioneuroblastoma and Neuroblastoma.
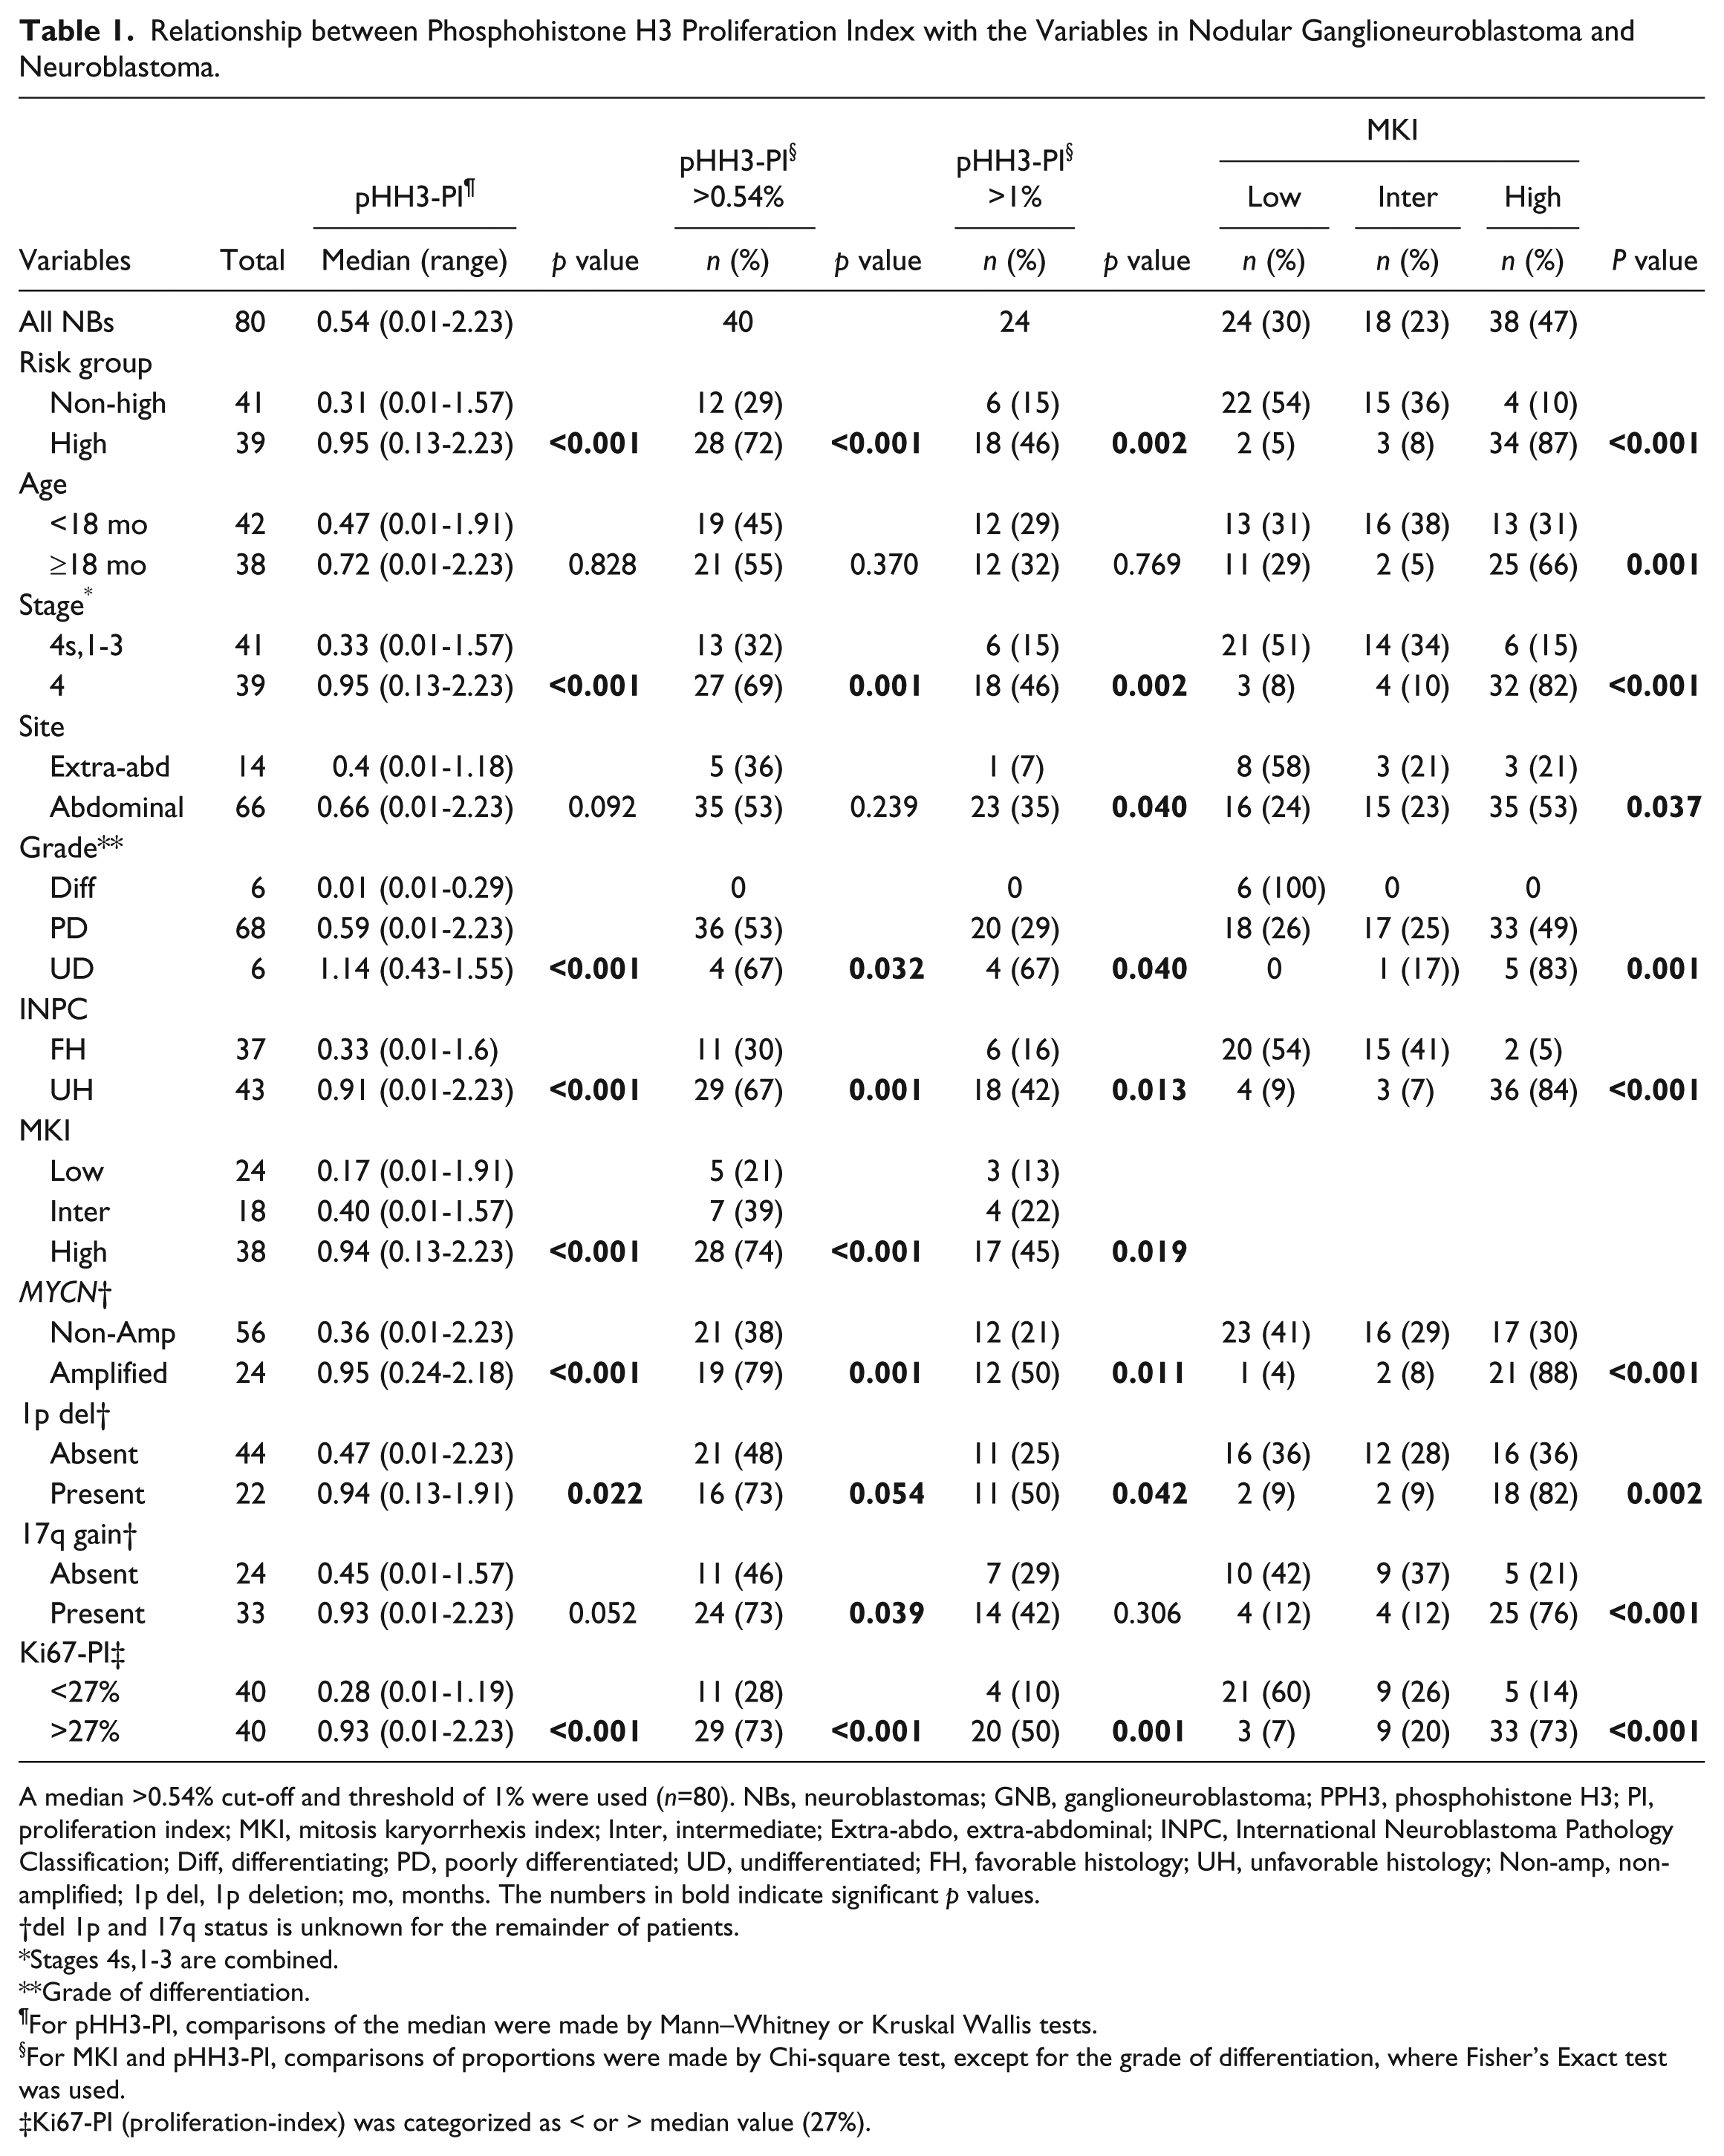
A median >0.54% cut-off and threshold of 1% were used (n=80). NBs, neuroblastomas; GNB, ganglioneuroblastoma; PPH3, phosphohistone H3; PI, proliferation index; MKI, mitosis karyorrhexis index; Inter, intermediate; Extra-abdo, extra-abdominal; INPC, International Neuroblastoma Pathology Classification; Diff, differentiating; PD, poorly differentiated; UD, undifferentiated; FH, favorable histology; UH, unfavorable histology; Non-amp, non-amplified; 1p del, 1p deletion; mo, months. The numbers in bold indicate significant p values.
del 1p and 17q status is unknown for the remainder of patients.
Stages 4s,1-3 are combined.
Grade of differentiation.
For pHH3-PI, comparisons of the median were made by Mann–Whitney or Kruskal Wallis tests.
For MKI and pHH3-PI, comparisons of proportions were made by Chi-square test, except for the grade of differentiation, where Fisher’s Exact test was used.
Ki67-PI (proliferation-index) was categorized as < or > median value (27%).
pHH3 Staining Patterns
Distinct, strongly stained nuclei and mitotic figures (Fig. 1A, parts 1–4) were highlighted by pHH3. Less than 10% of the mitotic figures failed to react to pHH3. Interphase nuclei with a weak, finely granular staining pattern also expressed pHH3; these were excluded. The proportion was variable from tumor to tumor, but overall was seen in <10% of the cells. Apoptotic cells or karyorrhectic nuclei were not stained with pHH3 (Fig. 1B). The median and 75th percentile pHH3-PIs were 0.54% and 1.06% (mean, 0.7%; range, 0.01% to 2.23%), respectively.
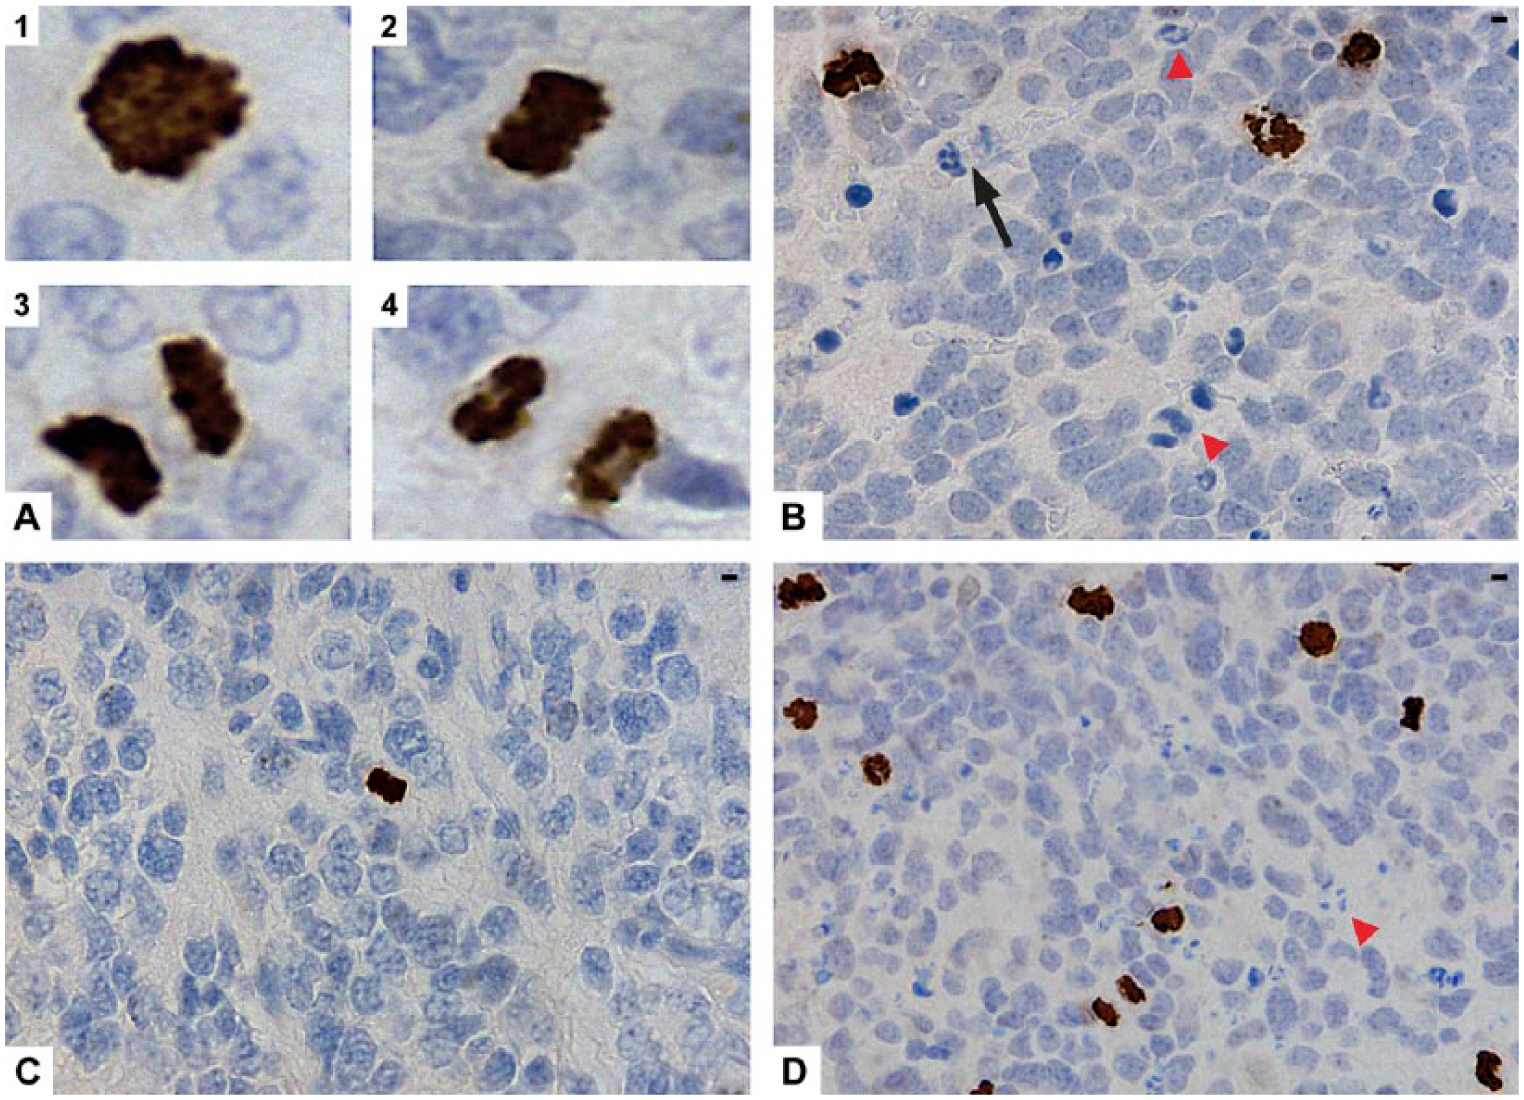
Immunohistochemical expression of phosphohistone H3 (pHH3) in neuroblastomas (NBs). (A) pHH3 stained the mitotic figures in prophase (1) metaphase (2), anaphase (3) and telophase (4). (B) pHH3 did not stain neutrophils (black arrow) or karyorrhectic debris (red arrowheads). (C) A low pHH3 proliferation index (pHH3-PI) was found in a non-MYCN amplified NB with low mitosis karyorrhexis index (MKI). (D) A high pHH3-PI in a MYCN-amplified NB with high MKI (red arrowhead points to karyorrhectic debris). Scale, 3.17 µm.
pHH3-PI and MKI Counts Are Higher in NBs from Patients with Unfavorable Clinical, Pathological and Biological Variables
The relationships between the pHH3-PIs, categories of pHH3-PI counts at the median and 1% threshold (~75th percentile) cut-off values, and the clinical, pathological and biological variables are shown in Table 1. The relationships among the three MKI classes with the variables for comparison with pHH3-PIs are also shown in Table 1. pHH3-PI counts were significantly higher in NBs from children with all of the important unfavorable characteristics, with the exception of an age of ≥18 months at presentation. MKIs were significantly higher in NBs from patients with all of the adverse clinical, pathological characteristics and biological factors, including the age at presentation. Representative sections of pHH3-PIs from NBs with low and high MKI are illustrated in Figure 1C and 1D, respectively. High pHH3-PIs at both cut-off values and MKIs were also significantly associated with high Ki67 proliferation indices (≥27 median Ki67-PI).
Correlation of pHH3-PIs
There was a very good correlation between the pHH3-PI counts of the two observers (Rho = 0.99); p<0.001). There was 100% agreement between the visual counts of pHH3 by the two observers: kappa 1.0.
Survival Analyses
At the last follow-up, 24 of 80 patients (30%) had died, and 32 patients (40%) had relapsed. The estimated OS at 5 years was 71% (95%CI, 61% to 81%) and the estimated 5-year EFS was 60% (95%CI, 48% to 70%).
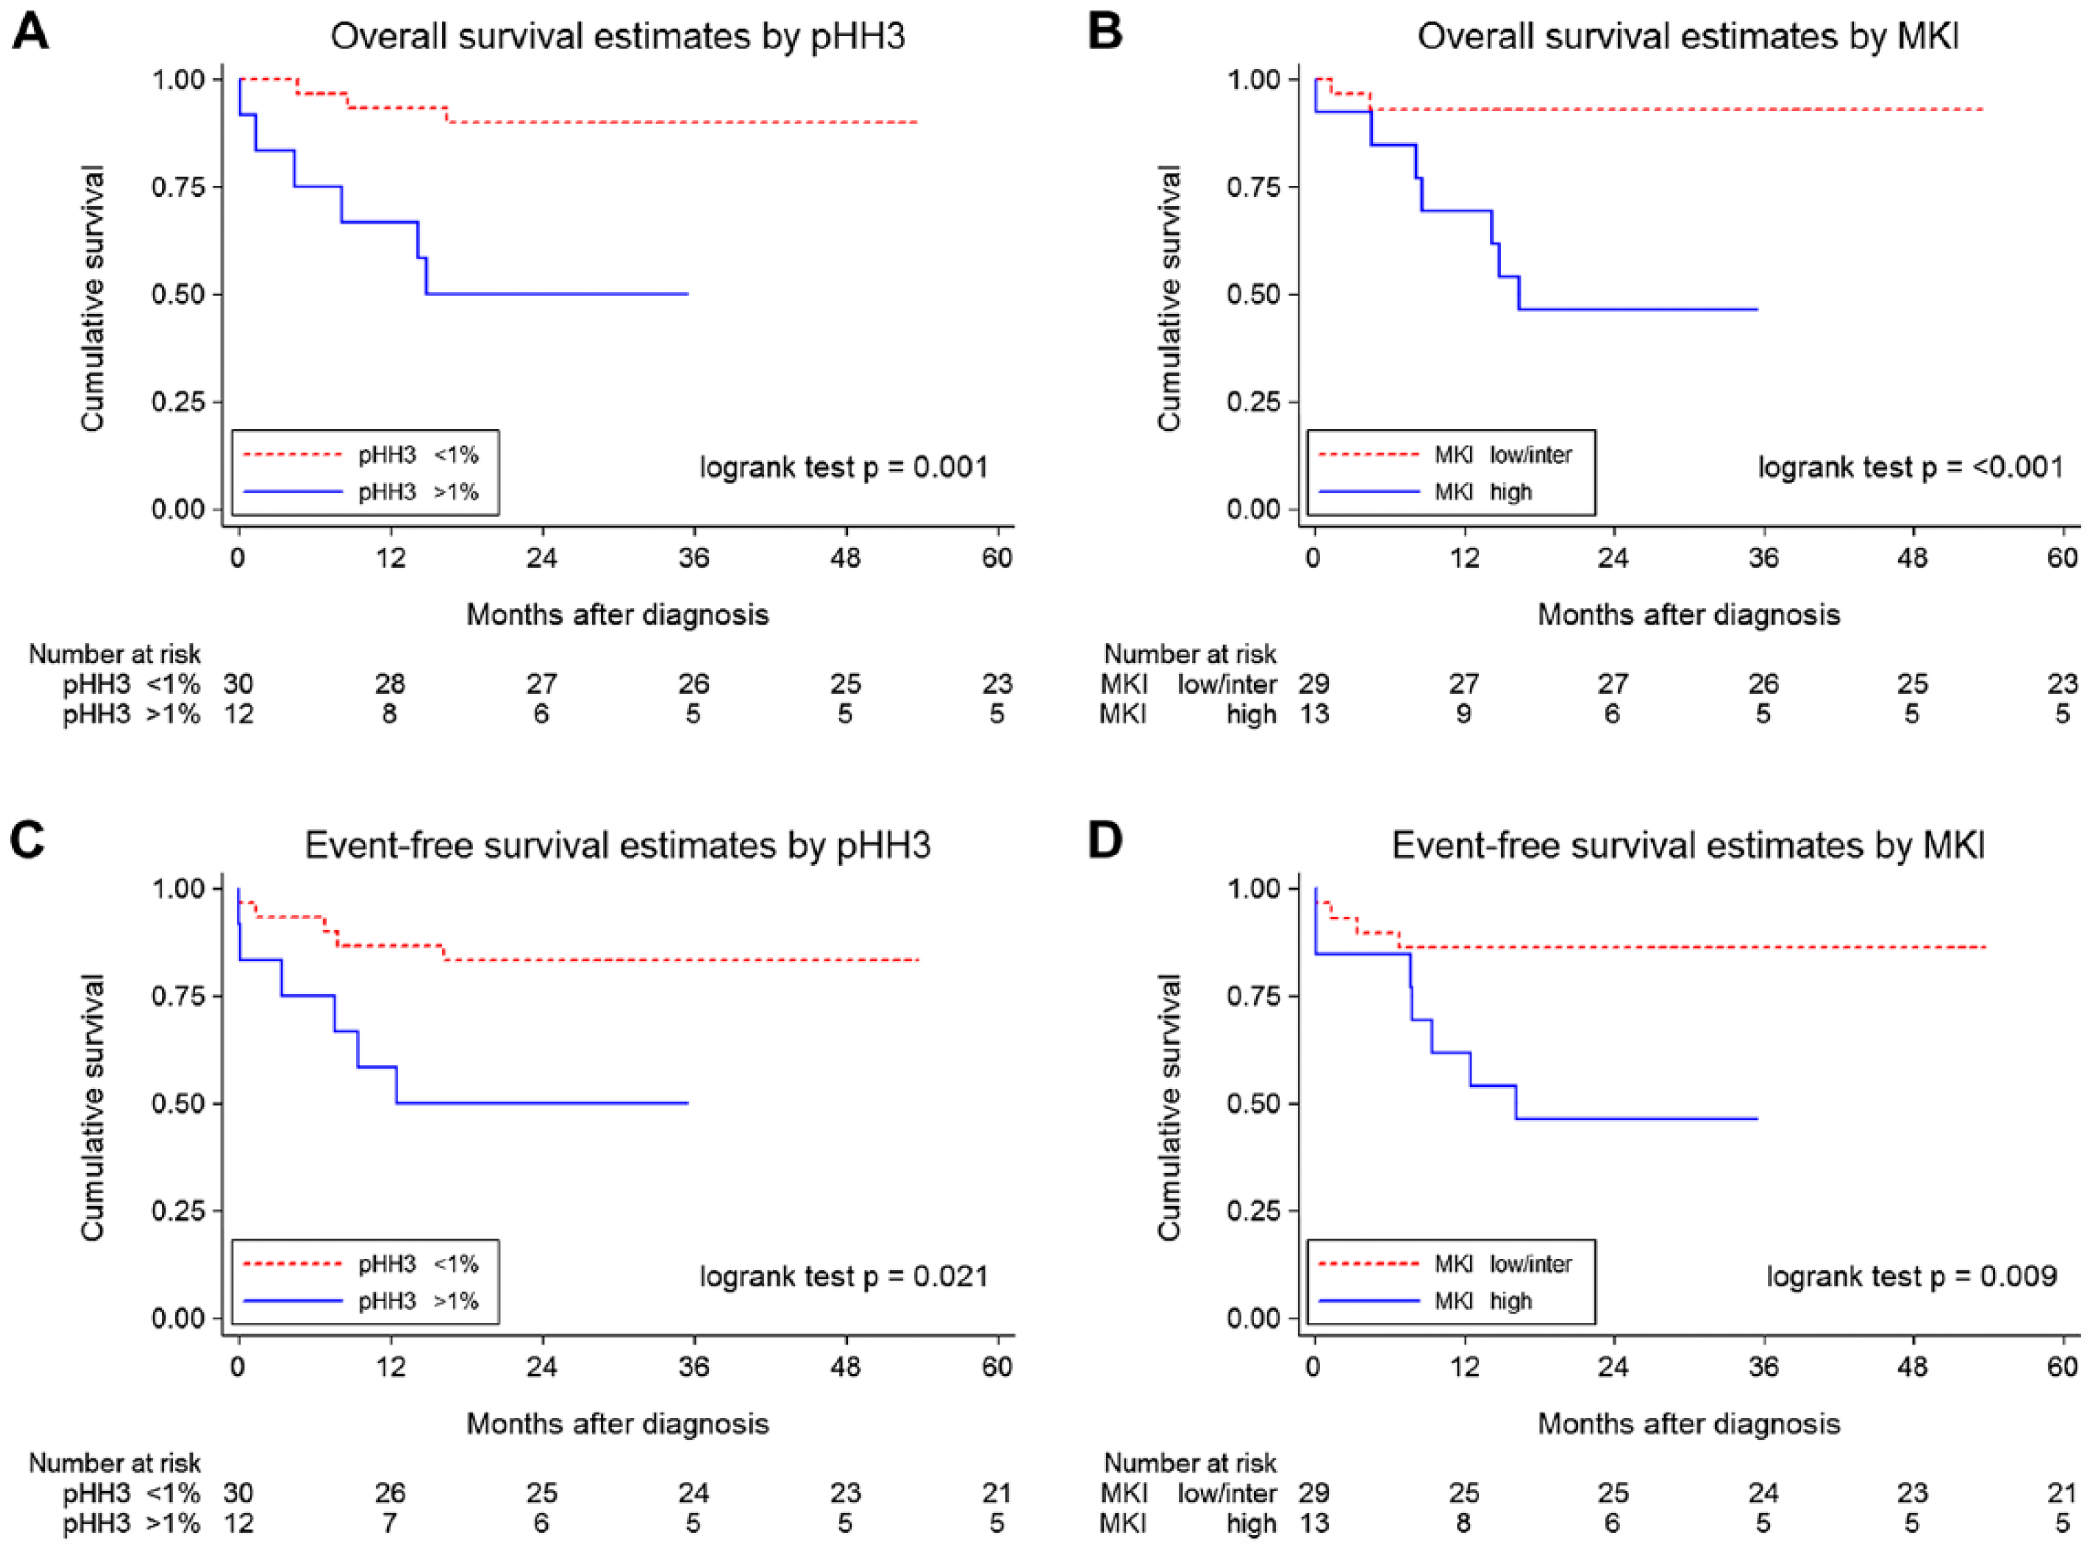
The estimated OS at 5 years for pHH3-PI, when the median values (0.54 vs 0.54%) were used as the cut-off, was 75% (95%CI, 58% to 86%) for low and 67% (95%CI, 50% to 79%) for high pHH3-PI (p=0.249). When the 1% threshold was used to categorize pHH3-PIs, the estimated OS at 5 years for high pHH3-PI was significantly worse, at 78% (95%CI, 65% to 87%) for low and 53% (95%CI, 31% to 71%) for high pHH3-PI, as shown in the Kaplan–Meier curve (Fig. 2A). For comparison, the estimated OS at 5 years differed according to the MKI classes (91% [95%CI, 70% to 98%] for low as compared with 83% [95%CI, 57% to 94%] for intermediate and 52% [95%CI, 35% to 67%] for high MKI, as shown in the Kaplan–Meier curve (Fig. 2B).
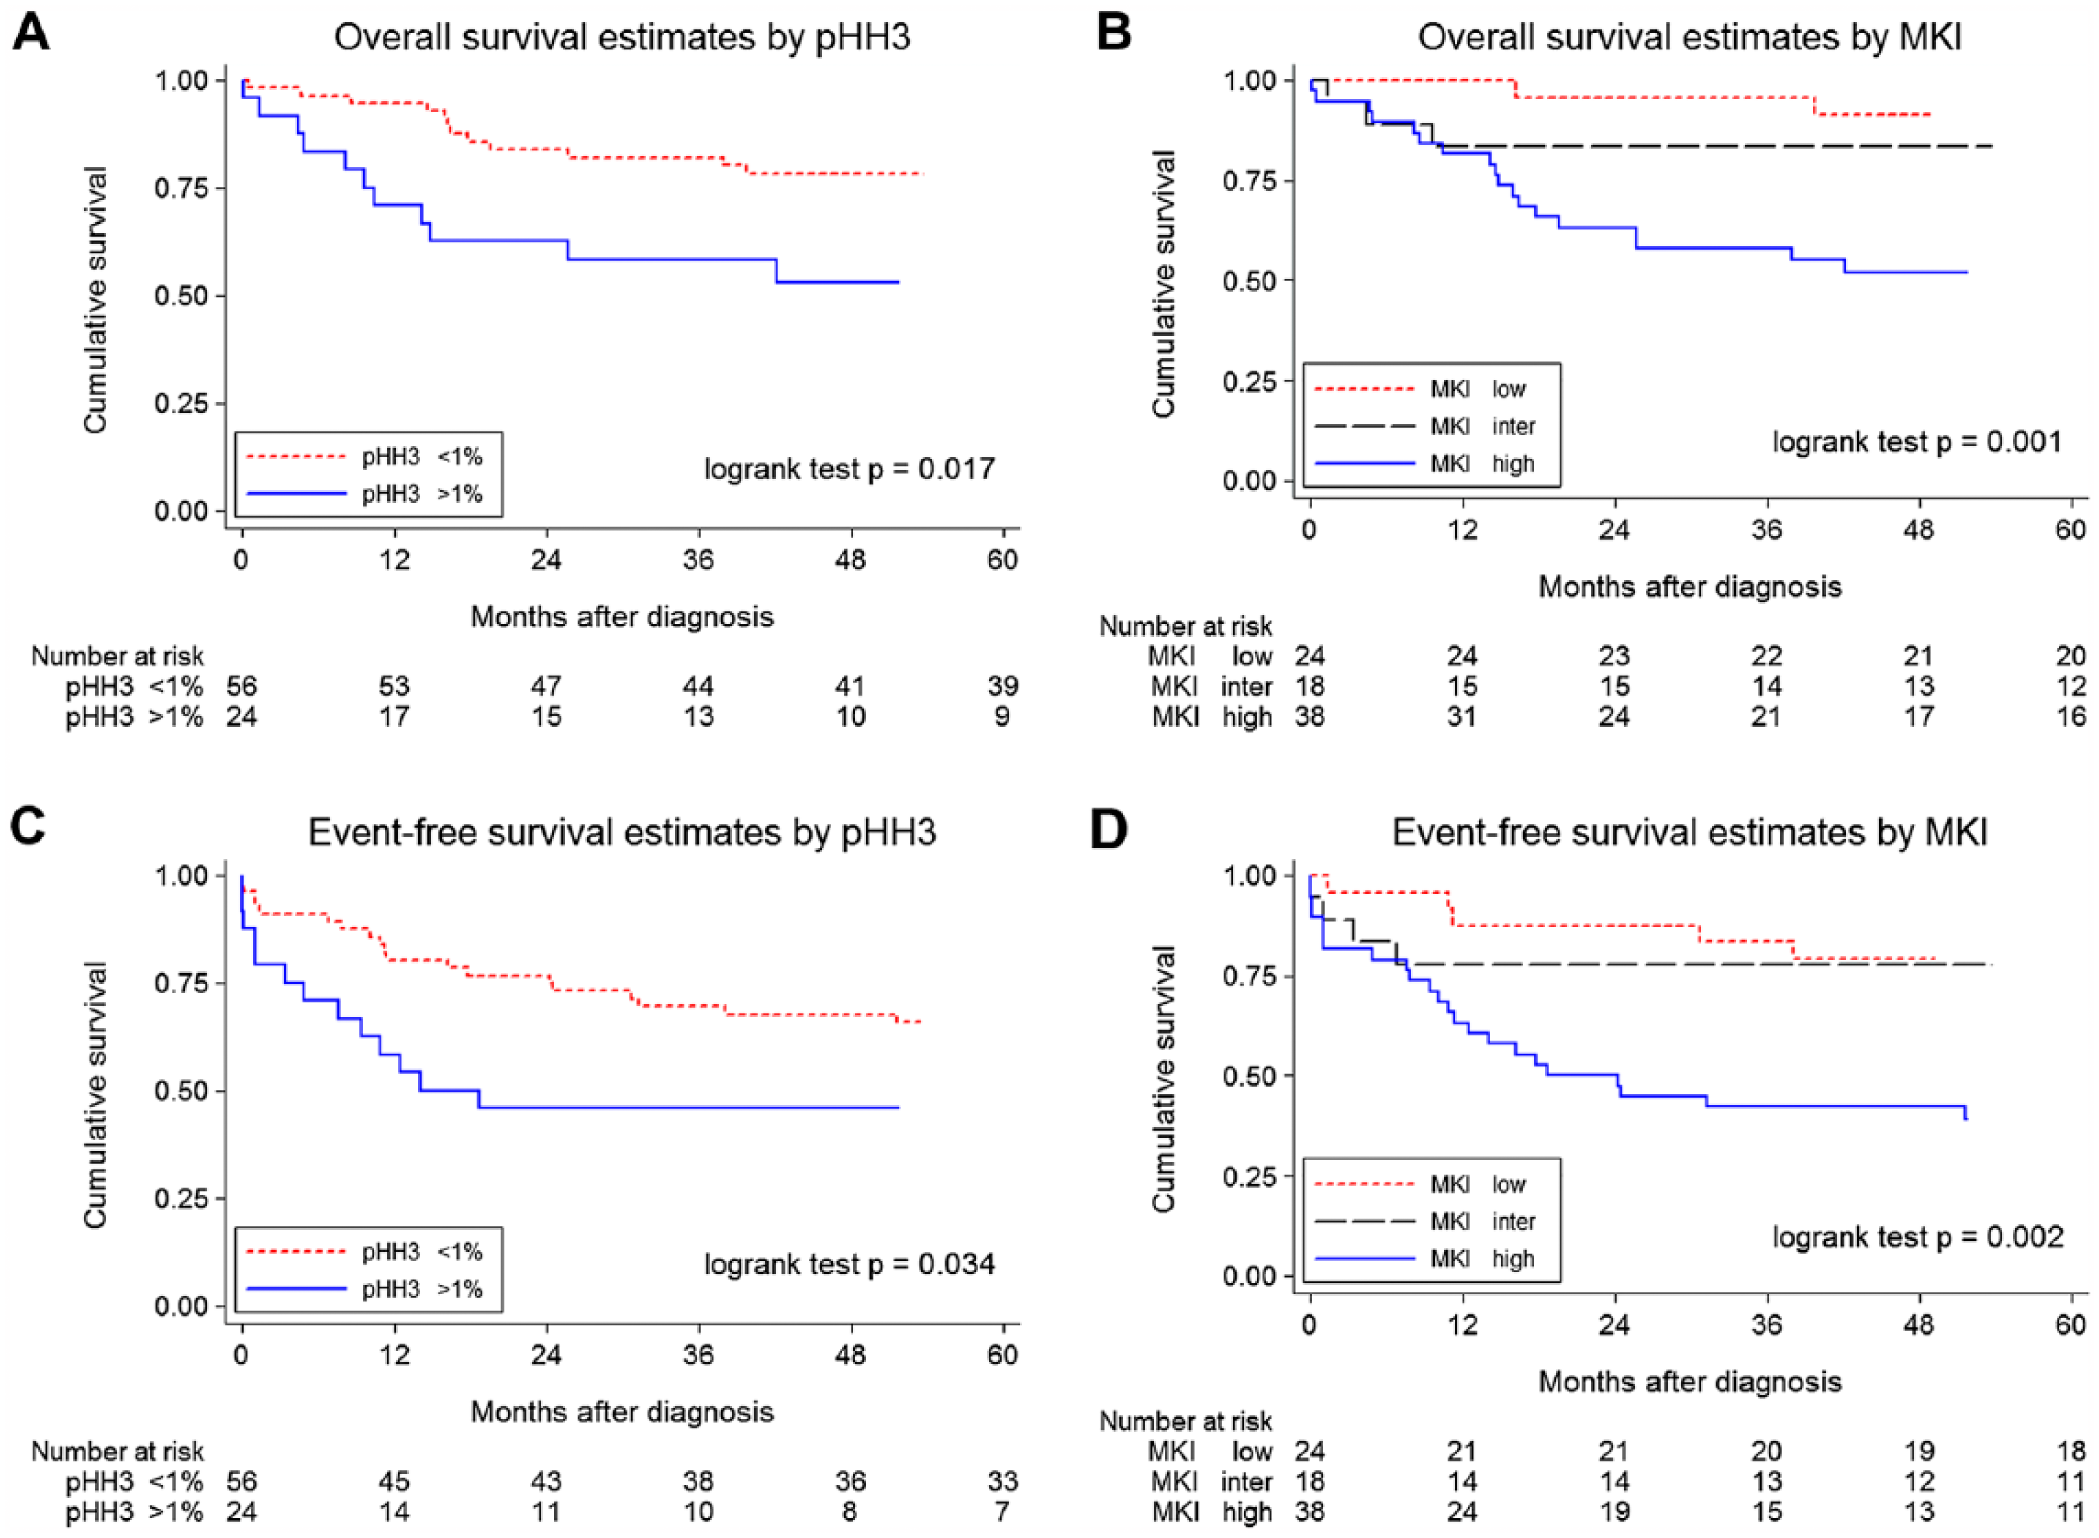
Kaplan–Meier survival curves for phosphohistone H3 (pHH3) proliferation indices (pHH3-PIs) and mitosis karyorrhexis index (MKI) in neuroblastomas (NBs) in the entire cohort (n=80). (A) Overall survival (OS) of patients with NBs dichotomized at the 1% threshold for pHH3-PIs. (B) OS of patients with NBs with low, inter, intermediate and high MKIs. (C) Event-free survival (EFS) of patients with NBs dichotomized at the 1% threshold for pHH3-PIs. (D) EFS of patients with NBs with low, inter, intermediate and high MKIs.
Similar patterns of survival curves were observed for the estimated EFS at 5 years for pHH3-PIs and MKI. For pHH3-PI, the estimated EFS at 5 years was 62% (95%CI, 46% to 75%) for low pHH3-PI as compared with 57% [95%CI, 40% to 71%] for high pHH3-PI (p=0.501) when the median values (0.54% vs 0.54%) were used as the cut-off points. When a threshold of 1% was used to categorize pHH3-PIs, the estimated EFS at 5 years for low pHH3-PI was 66% [95%CI, 52% to 77%] and 46% [95%CI, 26% to 64%] for high pHH3-PIs, as shown in Figure 2C. The estimated EFS at 5 years differed according to the MKI classes: 79% [95%CI, 57% to 91%] for low compared with 78% [95%CI, 51% to 91%] for intermediate and 39% [95%CI, 23% to 54%] for high MKIs, as shown in Figure 2D.
Results of the series of Cox proportional hazards regression analyses that were carried out to explore the relationships of OS and EFS with various other parameters across the entire cohort (n=80); the results are shown in Tables 2 and 3. In the univariable analyses, the high-risk group, advanced stage (stage 4), INPC unfavorable prognostic group, high MKI counts, MYCN amplification, and 1p deletion were associated with a significantly lower EFS and OS (Table 2). Age ≥ 18 months at presentation and 17q gain were associated with a significantly lower EFS but not OS. By univariable Cox proportional hazard regression analyses, high pHH3-PIs (threshold of 1%) were associated significantly with worse OS and EFS but not high pHH3-PIs when the median value (0.54%) was used as the cut-off point (Table 2).
Overall- and Event-Free Survival Estimates from Univariable Cox Regression Models.
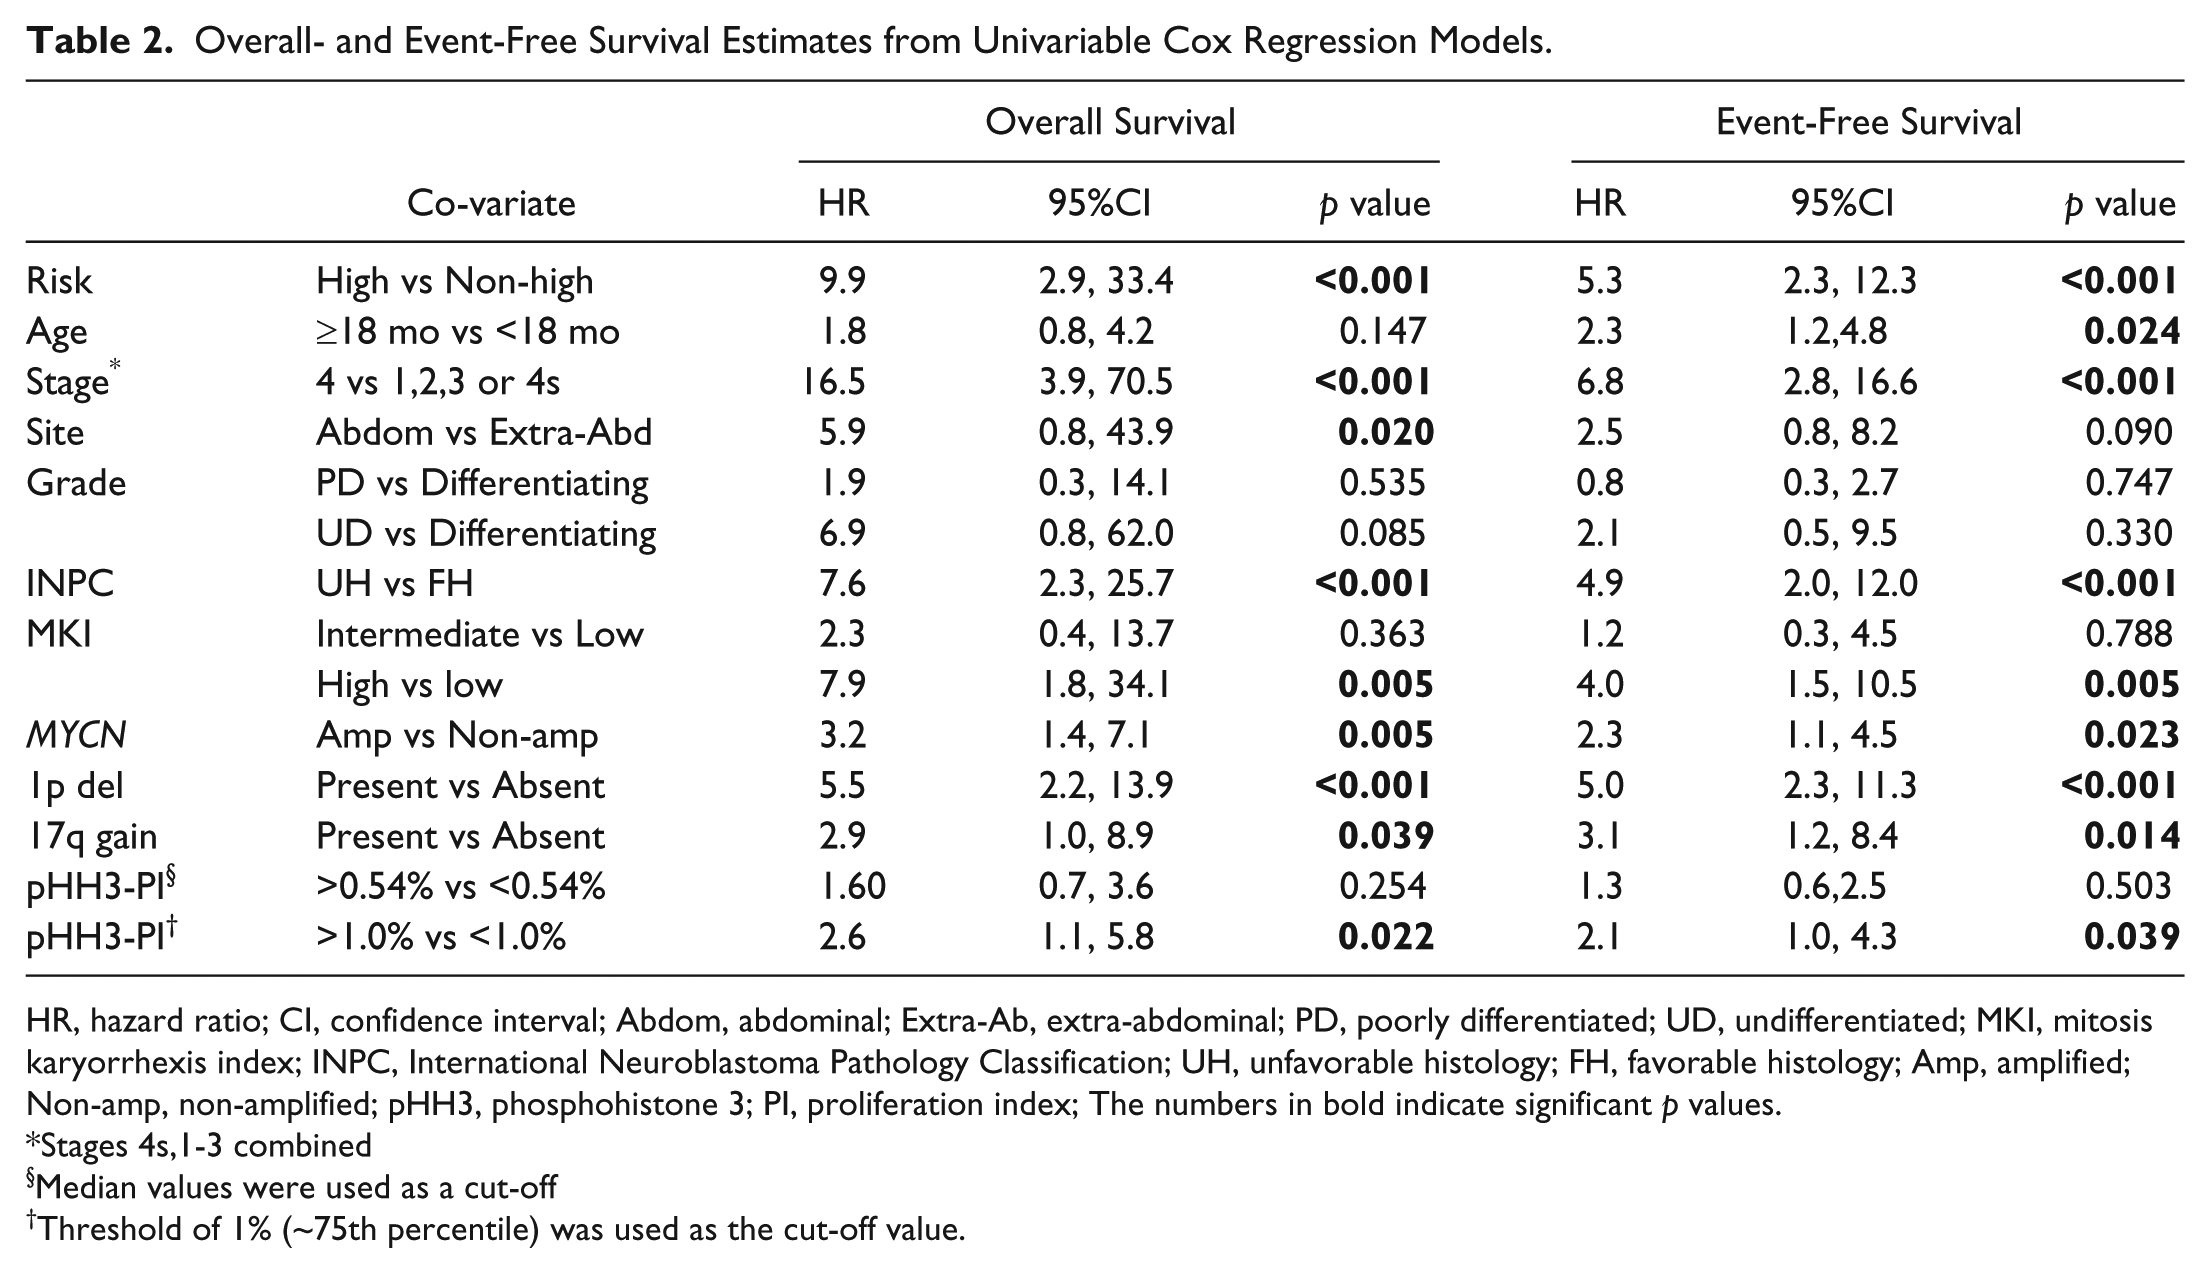
HR, hazard ratio; CI, confidence interval; Abdom, abdominal; Extra-Ab, extra-abdominal; PD, poorly differentiated; UD, undifferentiated; MKI, mitosis karyorrhexis index; INPC, International Neuroblastoma Pathology Classification; UH, unfavorable histology; FH, favorable histology; Amp, amplified; Non-amp, non-amplified; pHH3, phosphohistone 3; PI, proliferation index; The numbers in bold indicate significant p values.
Stages 4s,1-3 combined
Median values were used as a cut-off
Threshold of 1% (~75th percentile) was used as the cut-off value.
Overall and Event-Free Survival Estimates from Cox Regression Models for pHH3-PI in Neuroblastomas and Ganglioneuroblastoma.
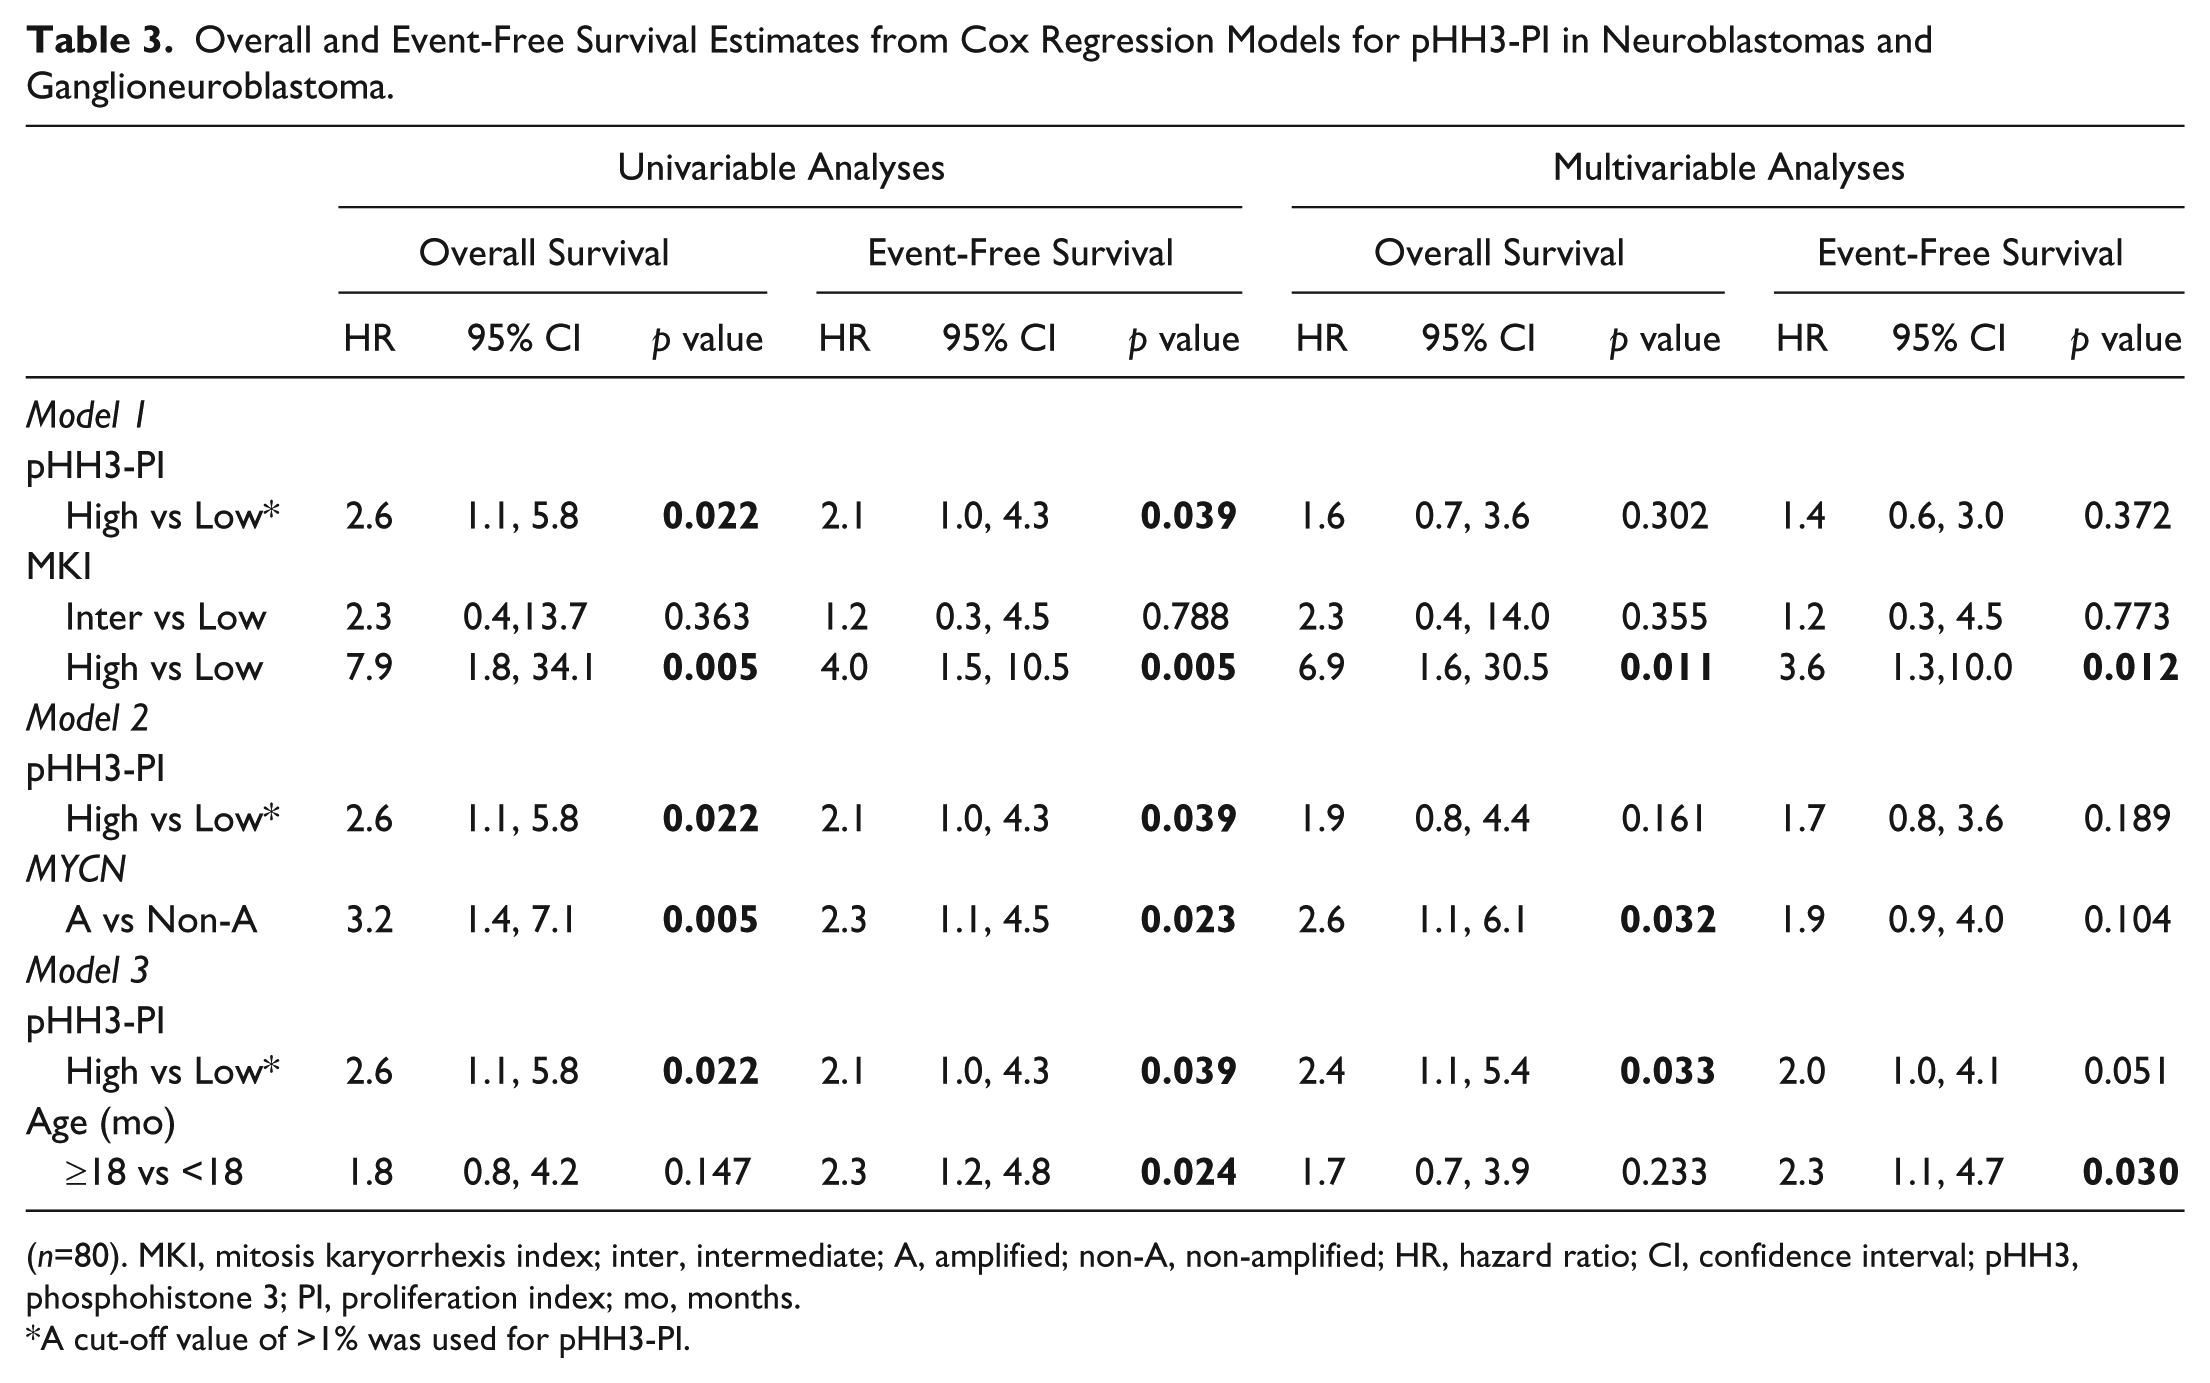
(n=80). MKI, mitosis karyorrhexis index; inter, intermediate; A, amplified; non-A, non-amplified; HR, hazard ratio; CI, confidence interval; pHH3, phosphohistone 3; PI, proliferation index; mo, months.
A cut-off value of >1% was used for pHH3-PI.
By the multivariable Cox proportional hazard regression analyses of the entire cohort (n=80), the presence of high MKIs were significantly associated with shorter OS and EFS but high pHH3-PIs (>1%) failed to reach statistical significance after adjustment for either MKI or MYCN amplification (Table 3, models 1 and 2, respectively). However, high PHH3-PIs were associated with worse OS (statistically significant) and worse EFS (borderline significance) after adjusting for age (Table 3, model 3).
The univariable Cox proportional hazard regression analyses in the subset of NBs from children younger than 18 months of age (n=42) are shown in Table 4 (left-hand columns). Because of the low number of events, low and intermediate MKIs were combined in the analyses. High MKI compared with low plus intermediate MKI and high-PHH3-PIs (>1%) but not age (≥6 months vs <6 months) were associated with statistically significant worse OS and worse EFS. Figure 3 shows the Kaplan–Meier curves for worse OS and EFS for children with high pHH3 and high MKI.
Overall and Event-Free Survival Estimates from Cox Regression Models for pHH3-PI in Neuroblastomas from Children Aged Less Than 18 Months.
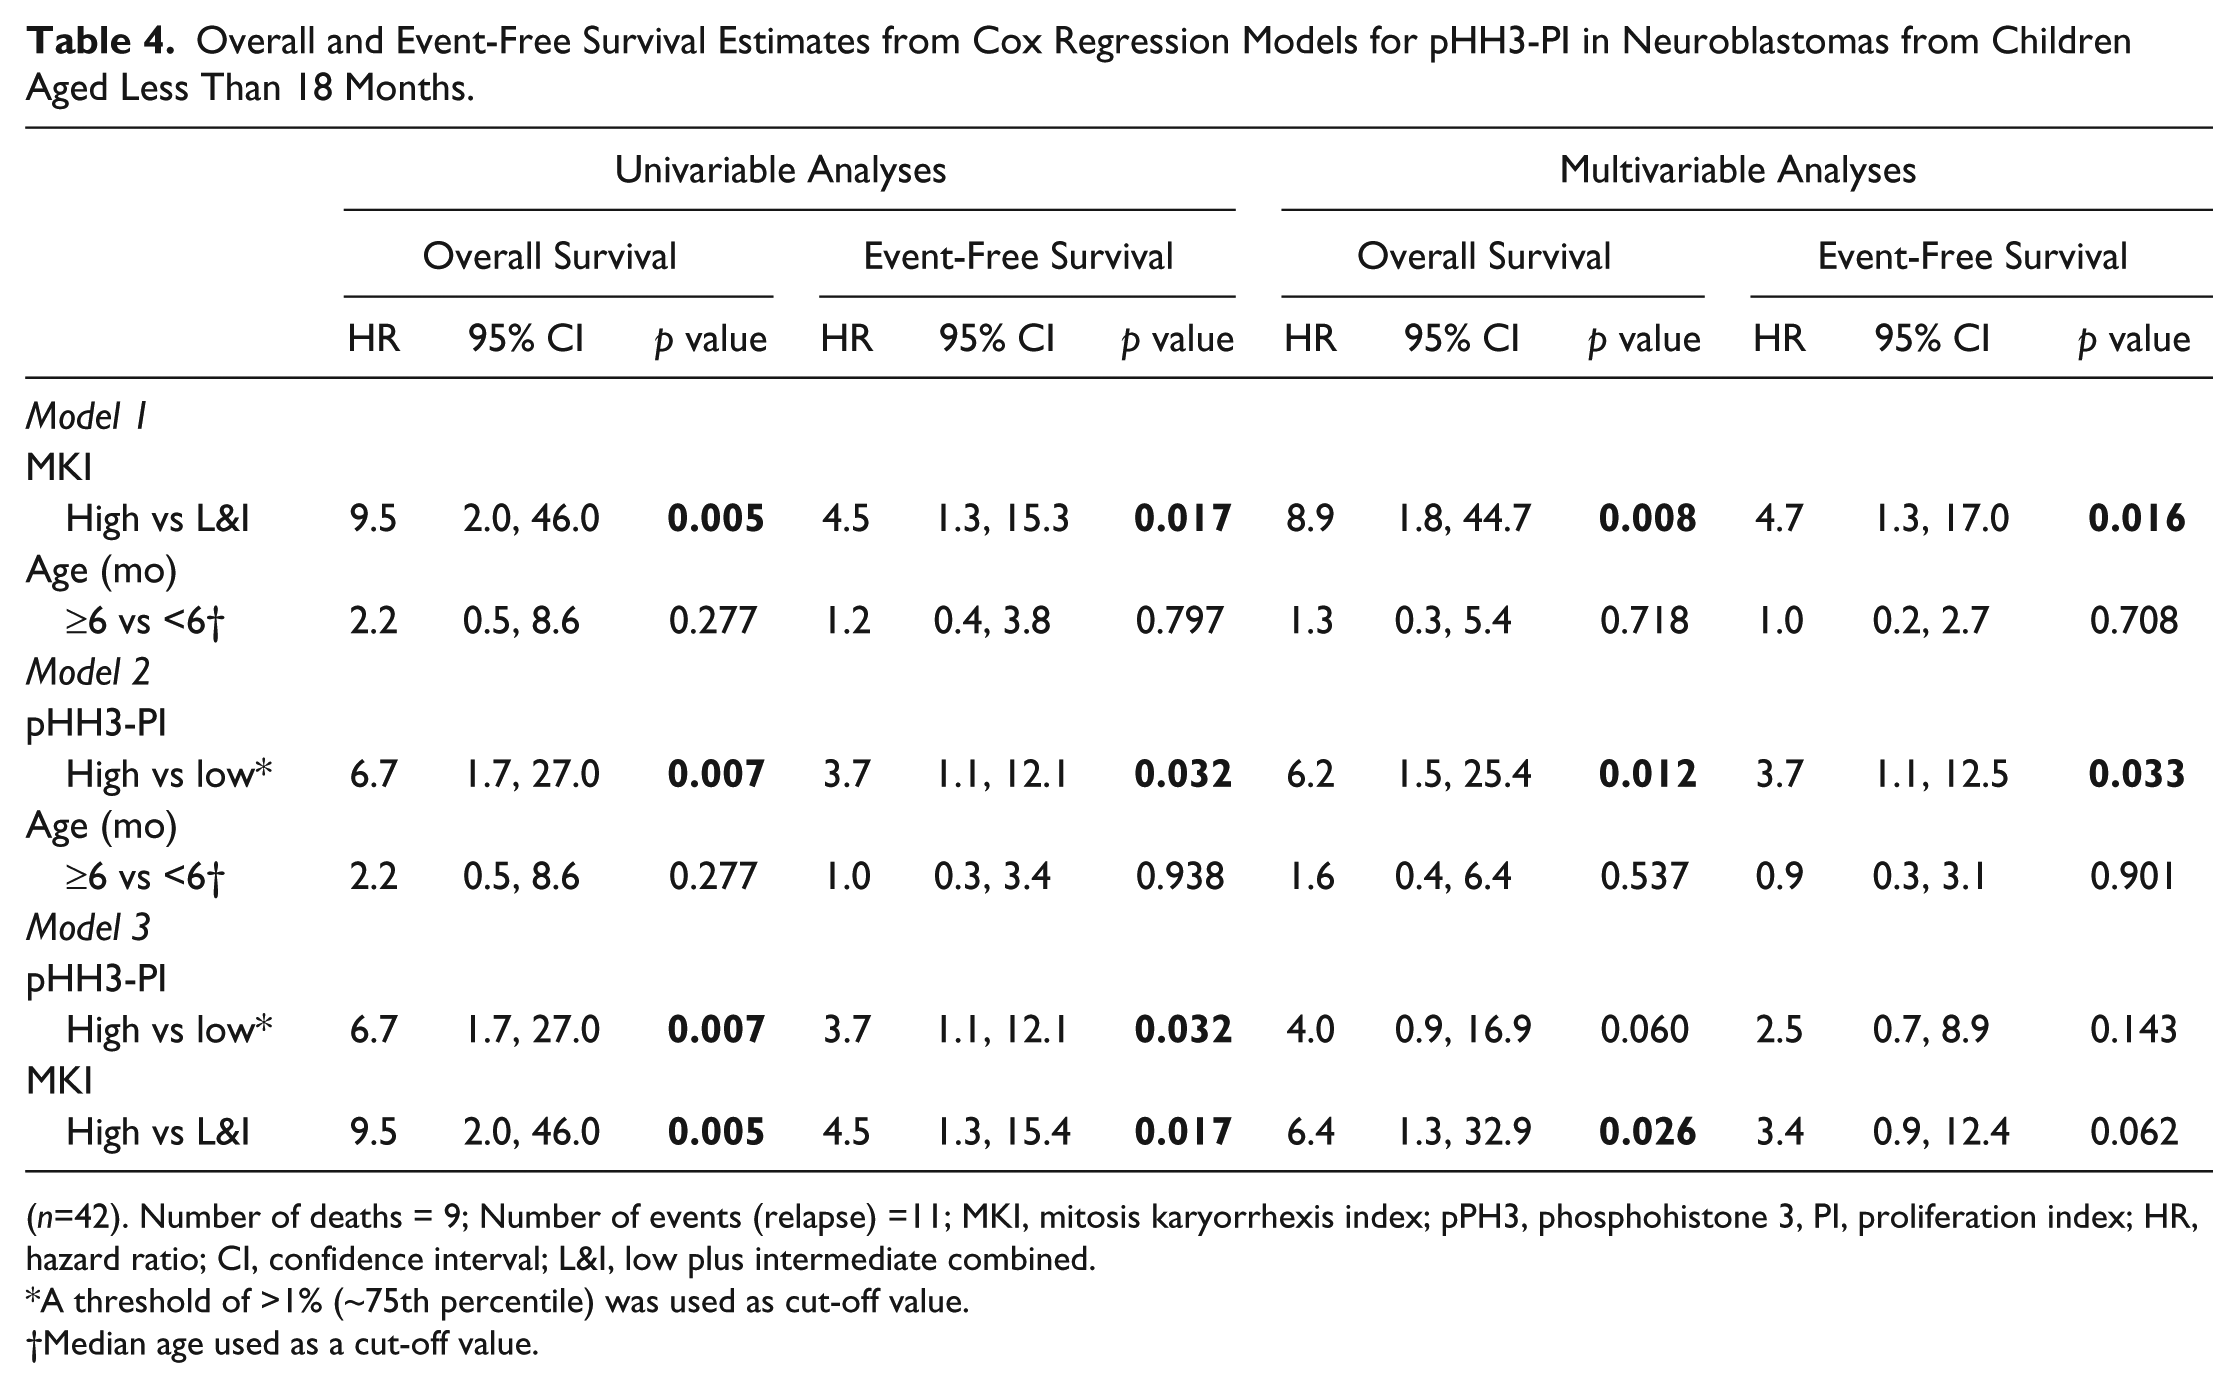
(n=42). Number of deaths = 9; Number of events (relapse) =11; MKI, mitosis karyorrhexis index; pPH3, phosphohistone 3, PI, proliferation index; HR, hazard ratio; CI, confidence interval; L&I, low plus intermediate combined.
A threshold of >1% (~75th percentile) was used as cut-off value.
Median age used as a cut-off value.
Kaplan–Meier survival curves for pHH3 proliferation indices (pHH3-PIs) and mitosis karyorrhexis index (MKI) in neuroblastomas (NBs) in the children younger than 18 months of age (n=42). (A) Overall survival (OS) of patients with NBs dichotomized at the 1% threshold for pHH3-PIs. (B) OS of patients with NBs with low plus inter, intermediate and high MKIs. (C) Event-free survival (EFS) of patients with NBs dichotomized at the 1% threshold for pHH3-PIs. (D) EFS of patients with NBs with low plus inter, intermediate and high MKIs.
The multivariable Cox proportional hazard regression analyses in the subset of NBs from children younger than 18 months of age (n=42) are also shown in Table 4 (right-hand columns). High MKI and high PHH3-PI were statistically significant for worse OS and EFS after adjusting for age (Table 4, models 1 and 2, respectively). However, high PHH3-PIs failed to reach statistical significance for either OS or EFS in this cohort after adjustments were made for MKI (Table 4, model 3).
Discussion
Our findings confirm and expand upon the limited observation of the previous study showing that pHH3 immunodetection is useful in enumeration of mitoses in neuroblastomas (Idikio 2006). Phosphorylation of the core histone H3 protein occurs at Ser10 almost exclusively during late G2-phase and M-phase of the cell cycle and helps coordinate mitotic chromatin condensation (Hendzel et al. 1997). It is absent during apoptosis (Hendzel et al. 1998). pHH3 stained >90% of the mitotic figures in our study. By contrast, a high percentage (~24%) of unstained mitotic figures was noted in melanomas (Tetzlaff et al. 2013), and the authors suggested that other histone markers, such as H3K79me3T80ph (Martinez et al. 2012), may identify a subset of melanomas with an aggressive course. Besides the Ser10 residue, the core histone H3 protein is also phosphorylated at other residues, such as Ser28 (Goto et al. 1999; Hammond et al. 2014). In a study comparing the anti-phosphohistone H3 antibodies against Ser28 (pHSer28) and pHSer10, pHSer28 was identified in a smaller percentage of tumor cells than pHSer10 (Sun et al. 2012). Thus it is likely that the unstained mitotic figures, noted in our study and by others (Ladstein et al. 2012), would react to antibodies against H3 phosphorylated at residues other than Ser10.
MKI class determination requires an experienced pathologist to count the MKIs accurately and to achieve high inter-observer agreement (Shimada et al. 1999b; Shimada et al. 1984). Despite guidelines for determination of MKI categories without formal counting (Joshi et al. 1991), enumeration of MKIs can be time-consuming and tedious for surgical pathologists. In comparison to MKI, we found pHH3-PI could be counted objectively and quickly. Moreover, there was excellent agreement in the pHH3 counts from the two observers; both recently qualified biomedical staff with very little experience. Our study is the first to assess the prognostic value of pHH3 in a well-characterized cohort of NBs and clearly demonstrates that high pHH3-PIs correlate significantly with the adverse clinical prognostic features but not with the age at diagnosis, in line with the earlier study that compared high MKI with the unfavorable clinical group (Ambros et al. 2002).
High pHH3-PIs correlated with high Ki67-PI and high MKI class in our study. We also noted the strong association of high MKI with important adverse prognostic factors in line with a recent study (Teshiba et al. 2014); although, our cohort included a higher proportion of NBs belonging to the high MKI class. Moreover, the survival data of the low, intermediate and high MKI classes in our cohort are consistent with those of the INRG analyses (Cohn et al. 2009): 5-year EFS rates for low/intermediate vs high MKIs were 74% vs 37% in that report. In our series, the 5-year EFS rates for low vs intermediate vs high MKIs were 79% for low, 78% for intermediate, and 39% for high. Thus, despite the difference in actual proportions of MKI classes between our study compared to the cohort reported by Teshiba et al. (2014) and the INRG (Cohn et al. 2009), the clinical relevance and prognostic outcome of the high MKI class is very similar. The proportions of NBs with low, intermediate and high MKI classes in our study are comparable with those of a Spanish cohort reporting MKI data of 157 NBs: 37%, 22% and 41% for low, intermediate and high MKIs, respectively (Burgues et al. 2006). Moreover, the 5-year OS rate for patients with high MKI in our study was 52%; this is comparable with the 5-year OS rate of 48% reported by the Spanish group (Burgues et al. 2006).
High pHH3-PIs correlated significantly and positively with the unfavorable INPC prognostic group in our series. The INPC incorporates histological category, MKI, age and differentiation to define favorable and unfavorable prognostic groups, and has been widely used by pathologists since the first publication in 1999 (Shimada et al. 1999a; Shimada et al. 1999b) and subsequent revision in 2003 (Peuchmaur et al. 2003). However, neither MKI nor INPC were included in the seven prognostic variables for stratifying children diagnosed with neuroblastic tumors into risk categories by the recent INRG (Cohn et al. 2009). INPC was not included because it is an age-linked pathology classification, and age is an independent clinical variable (Cohn et al. 2009). In line with the INRG justification for analyzing the individual components of the INPC, we analyzed MKI and age as separate variables; pHH3 failed to reach statistical significance after adjustment for the MKI, most likely because of its strong correlation with MKI. Interestingly, high pHH3-PIs were associated with statistically significant worse OS after adjusting for age in our study of 80 cases.
In the subset of 42 patients younger than 18 months with GNB nodular and NB tumors in our series, high MKIs retained their strong association with worse OS and EFS, similar to the INRG analyses (Cohn et al. 2009). Moreover, high PHH3-PIs were associated with significantly worse EFS and OS after adjustments were made for age. However, high PHH3-PIs failed to reach statistical significance for worse EFS and OS in the presence of the more prognostic MKI variable.
There was also a significant association between high pHH3-PI counts and MYCN amplification in our series, similar to the strong association of high MKI with MYCN amplification noted in the previous studies (Goto et al. 2001; Shimada et al. 1995; Teshiba et al. 2014). However, multivariable analyses showed that the effect of pHH3-PI was not independent of MYCN amplification (like MKI) on both OS and EFS; most likely because of the strong correlation between high PHH3-PI with high MYCN amplification. Over-expression of MYCN protein is associated with upregulation of cell cycle proliferation markers such as Aurora kinases A and B, which play critical roles in cell cycle progression and mitosis (Gustafson and Weiss 2010; Murphy et al. 2011). H3 serine 10 phosphorylation is carried out by Aurora kinases A and B (Crosio et al. 2002; Hirota et al. 2005) and levels of pHH3 are decreased upon downregulation of Aurora kinase A and B activity by the dual inhibitor CCT137690 in neuroblastomas (Faisal et al. 2011). Furthermore, CCT137690 treatment of MYCN-amplified NB cell lines decreases MYCN protein expression and inhibits cell proliferation (Faisal et al. 2011).
We acknowledge a few weaknesses in our retrospective study: mainly that relatively small numbers were available, resulting in underpowered analyses. Nonetheless, our cohort is representative of a large European series (Cotterill et al. 2000) and studies that show that more than half of the children present with metastatic stage 4 disease (Maris et al. 2007). Furthermore, the 5-year OS and EFS rates for MKI are consistent with those reported by the INRG (Cohn et al. 2009). Our study lacks correlative11q data because these are not available for half of our cohort, as 11q genetic status was not routinely evaluated in our Institution before 2005.
In conclusion, pHH3-PI counts can be obtained quickly and objectively with minimal training. High pHH3-PI counts failed to reach statistical significance for worse OS or EFS in the presence of the more prognostic variables of high MKI and MYCN amplification. However, high pHH3-PI counts are associated with statistically significant worse OS, which is independent of age.
Footnotes
Acknowledgements
The authors are grateful to Mike Luckett for technical advice and help.
Declaration of Conflicting Interests
The authors declared no potential conflicts of interest with respect to the research, authorship, and/or publication of this article.
Funding
The authors disclosed receipt of the following financial support for the research, authorship, and/or publication of this article: The authors thank Above and Beyond Charities of the University Hospitals Bristol Foundation Trust for their financial support.