
Abstract
Activation of numerous pathways has been documented in non-small cell lung cancer (NSCLC). Epidermal growth factor receptor (EGFR) has emerged as a common therapeutic target. The mitogen-activated protein kinase (MAPK) and AKT signaling pathways are downstream of EGFR and deregulated via genetic and epigenetic mechanisms in many human cancers. We evaluated selected markers in the EGFR pathway with reference to outcome. Tissues from 220 cases of NSCLC patients presented in a tissue microarray were assayed with immunohistochemistry for phosphorylated AKT, phosphorylated MAPK, phosphorylated mTOR, and EGFR and then quantified by automated image analysis. Individually, the biomarkers did not predict. Combined as ratios, p-mTOR/p-AKT, and p-MAPK/EGFR function as prognostic markers of survival (p=0.008 and p=0.029, respectively), however, no significance was found after adjustment (p=0.221, p=0.103). The sum of these ratios demonstrates a stronger correlation with survival (p<0.001) and remained statistically significant after adjustment (p=0.026). The algebraic combination of biomarkers offer the capacity to understand factors that predict outcome better than current approaches of evaluating biomarkers individually or in pairs. Our results show the sum of p-mTOR/p-AKT and p-MAPK/EGFR is a potential predictive marker of survival in NSCLC patients.
Keywords
Introduction
Lung cancer is the most common cause of cancer death in both men and women worldwide. Despite advances in treatment, such as combination chemotherapy and chemoradiation, survival has improved very little over the past few decades (Schiller 2001). Recently, many targeted agents have emerged (LoPiccolo et al. 2008), including gefitinib, the epidermal growth factor receptor (EGFR) tyrosine kinase inhibitor, which was approved in Japan for the treatment of non-small cell lung cancer (NSCLC) in 2002. It appears to be more efficacious in specific populations. Tumor characteristics, such as the presence of EGFR mutations and/or amplification, correlate with greater response rates. Mutations in members of the EGFR family induce oncogenic effects by activating signaling and anti-apoptotic pathways, notably those mediated by phosphatidylinositol 3-kinase (PI3K)-AKT. However, over-expression of EGFR does not successfully predict for treatment advantage with targeted therapeutics and prognosis in NSCLC (Howard et al. 2004; Sasaki et al. 2008; Vergis et al. 2008). Two major signaling pathways downstream of EGFR have been identified: the mitogen-activated protein kinase (MAPK) pathway and the PI3K/AKT/mammalian target of rapamycin (mTOR) pathway (Jorissen et al. 2003). AKT, activated by extracellular stimuli in a PI3K-dependent manner, plays a pivotal role in oncogenesis (Franke et al. 1997). Induction of these pathways is mediated by phosphorylation of the proteins involved. Numerous studies have independently examined the prognostic significance of members of these pathways (Pelloski et al. 2006; Herberger et al. 2007; Schmitz et al. 2007; Tsurutani et al. 2007; Guo et al. 2008; Hager et al. 2008; Schmitz et al. 2008; Al-Bazz et al. 2009; Galleges Ruiz et al. 2009; Scartozzi et al. 2012), but none has assayed these pathways as a group. Clinical trials with single molecularly targeted agents have demonstrated moderate success, with longer patient survival; however, these results have not been as successful as anticipated (Pandya et al. 2007; Donev et al. 2011; Ramalingam et al. 2013). Recent efforts have focused on combining multiple molecularly targeted agents, in acknowledgement of the pathway cross-talk that is common in many cancers.
In this study, we focused on the MAPK and AKT/mTOR pathway, utilizing immunohistochemistry to interrogate the phosphorylation status of MAPK, AKT, mTOR in combination with total EGFR expression on a lung cancer tissue microarray. Previously, we have demonstrated that ratio-based biomarkers can provide enhanced discrimination of patient survival over assessment of the biomarkers individually (Chung et al. 2009). This approach requires quantitative assessment of the biomarkers. Based on the ratio of biomarkers, where the downstream protein is the numerator to the upstream protein (denominator) for pathways of activation, we demonstrate that the ratio of phosphorylated mTOR (p-mTOR) to phosphorylated AKT (p-AKT) (p-mTOR/p-AKT) and the ratio of phosphorylated MAPK (p-MAPK) to EGFR (p-MAPK/EGFR) are predictive of survival in NSCLC.
Materials & Methods
Clinical Samples
A total of 220 NSCLC cases were selected from the pathology case archive of Toyama University Hospital based on the diagnosis and the quality of the available tissue on the paraffin blocks (Kitano et al. 2010; Chung et al. 2012). This study was approved by the ethics committee at Toyama University and a signed consent form was obtained from each subject. These patients underwent complete tumor resection between 1983 and 2003 and did not receive neoadjuvant treatment. The double cancer patients were excluded. The tumors were staged according to the International Union against Cancer’s tumor-node-metastasis classification and histology was defined and graded according to 2004 WHO guidelines (Fukuoka et al. 2004).
TMA Construction, Immunohistochemistry and Scoring
Tissue microarray (TMA) was constructed using a TMA arrayer (Pathology Devices, Westminster, MD) as previously described (Kononen et al. 1998). For each case, areas with the most representative histology were selected from review of hematoxylin and eosin (H&E)-stained slides. Normal tissues are included in the TMA as controls. The cylindrical tissue samples (0.6 mm) were cored from the above described areas in the donor block and extruded into the recipient array. Multiple 5-µm-thick sections were cut with a microtome and H&E-stained TMA slides were examined every 50th section for the presence of tumor cells.
EGFR (M3563) antibody was purchased from DAKO (Carpinteria, CA), and p-AKT (T308), p-MAPK and p-mTOR antibodies were purchased from Cell Signaling (Beverly, MA). The tissue sections were deparaffinized in xylene and rehydrated through a graded alcohol series to distilled water. After optimization of immunohistochemistry conditions, antigen retrieval for EGFR was performed using Proteinase K (DAKO), for p-mTOR using pressure chamber (Pascal, DAKO) with pH 6 Target Retrieval Solution (DAKO), and for other antibodies using pH10 Target Retrieval Solution (DAKO) pretreatment. These slides were blocked with hydrogen peroxide/methanol. After rinsing, the slides were incubated with the primary antibodies over night at 4C. The dilutions for each antibody were 1:1000 for EGFR, 1:100 for p-mTOR, 1:500 for p-MAPK, and 1:100 for p-AKT. Target signals were detected with LSAB peroxidase kit and DAB (DAKO) (Chung et al. 2009; Krishnan et al. 2006; Molinolo et al. 2007). Negative controls where performed to demonstrate the specificity of staining. The stained slides were lightly counterstained with hematoxylin and then imaged using the Aperio ScanScope CS Slide Scanner (Aperio Technologies, Vista, CA) system. Tumor cells for quantification were selected manually via annotation (Farris et al. 2011) in ImageScope and the positive pixel count algorithm (v1.0) was run within the Spectrum Plus Database (Aperio Technologies) to quantify cytoplasmic expression of p-AKT, p-MAPK and p-mTOR, and the membrane v9 algorithm was used to quantify the membranous expression of EGFR. The cutoff values were used for classification of pixels into four groups: strong positive, positive, weak positive and negative (Supplemental Table 1).
Statistical Analysis
Statistical analysis was performed using JMP Statistical Discovery Software, Version 7.0.1 (SAS Institute, Cary, NC). Weight Score (WS) was defined as WS = [(the number of strong positive pixels) ×1000 + (the number of positive pixels) ×100 + (the number of weak positive pixels) ×10 + (the number of strong negative pixels) ×1] / (the total number of pixels). WS above 10% of the highest score was considered high score group to evaluate each antibody. Using the chi-square test, the antibodies were evaluated in association with each other within each category. Overall survival was analyzed according to the Kaplan-Meier product-limit method, and the survival curves were compared with the log-rank test. p-mTOR/p-AKT and p-MAPK/EGFR were divided by each of the highest ratio value for normalization and dichotomized as positive or negative based on a cut-off value of above or below 0.01, respectively. The sum of ratios was defined as “algebraic biomarker”. The cut-off value for dichotomization was 0.015. We used a Cox proportional hazards model stratified by trial and adjusted for the following clinical prognostic variables: age at diagnosis (<60 years; ≥60 years), gender, cancer type, differentiation and stage. P values were considered significant when less than 0.05. Chi-square tests were used to compare the positive and negative score groups of the algebraic biomarker. Hierarchical clustering was performed based on the WS of four antibodies using JMP Statistical Discovery Software, Version 7.0.1 (SAS Institute). Based on the dendogram cluster analysis, four categories were evaluated for an association between clinicopathological factors and four categories using chi-square test.
Results
Patient Characteristics and Image Analysis
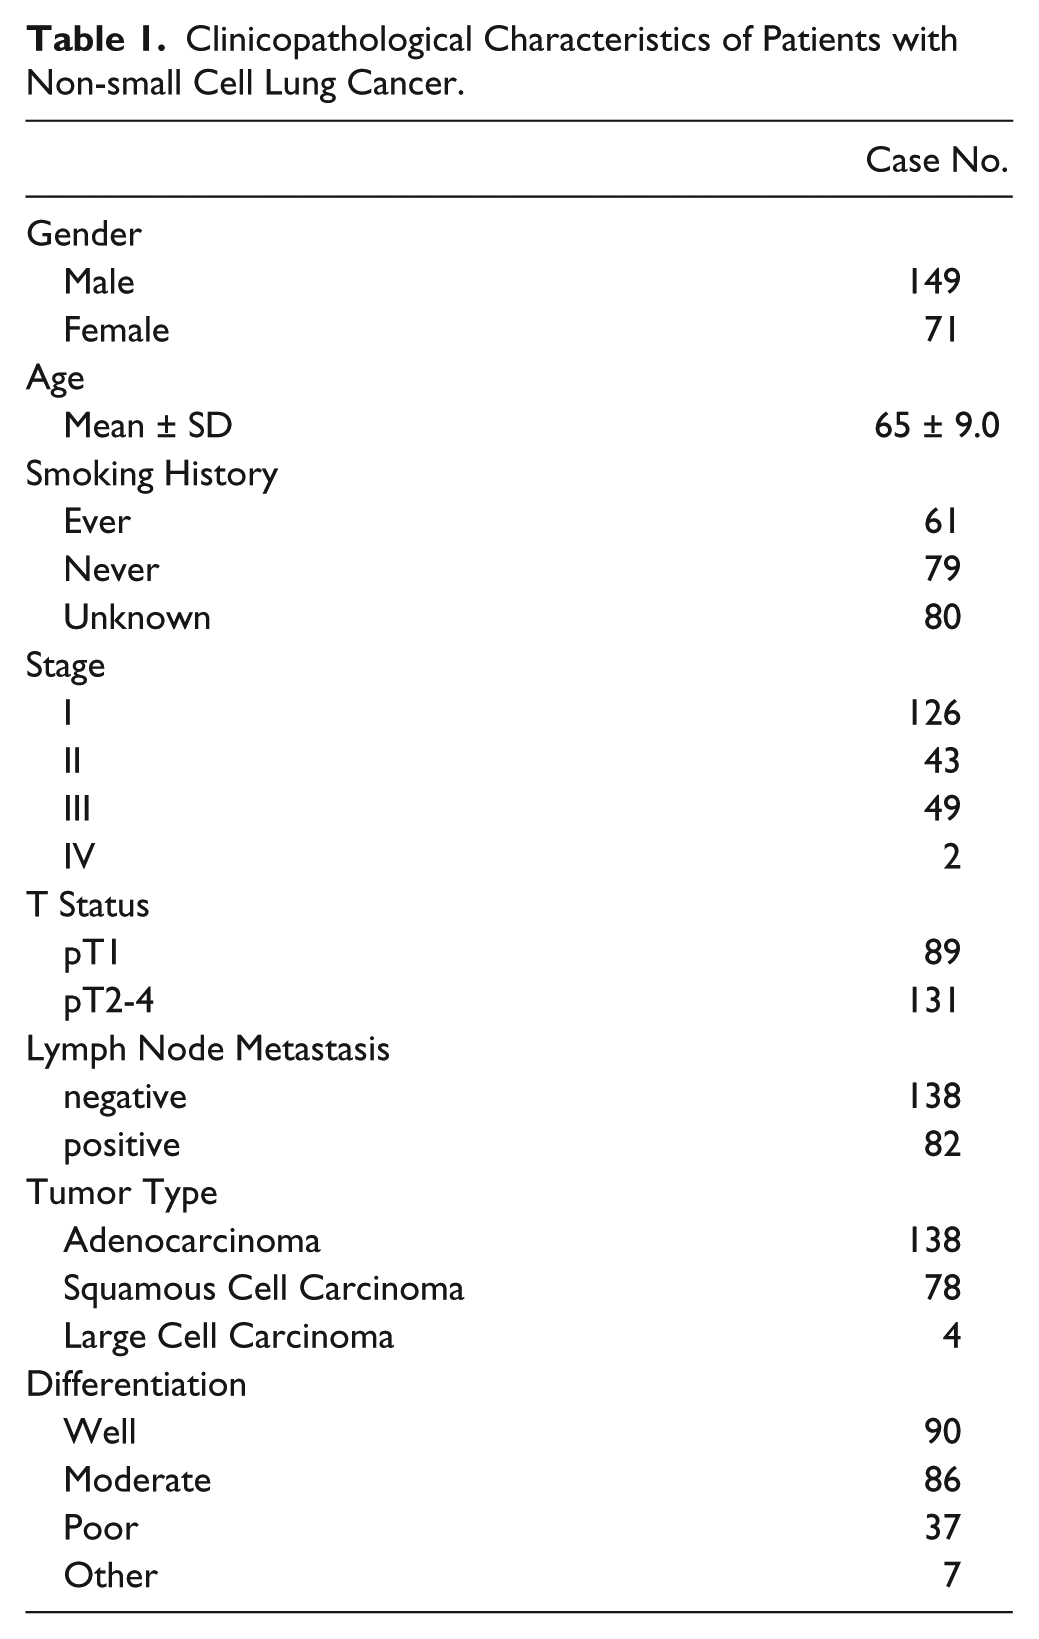
The number of cases eventually extracted for the final analysis is listed in Table 1, along with the associated clinical data. Smoking status was available as “smoker” (n=61), “non-smoker” (n=79) or unknown (n=80). No data is available on EGFR or RAS mutation status. The TMA was stained for p-AKT, p-mTOR, EGFR and p-MAPK. Slides were manually reviewed for quality of staining (Fig. 1A & B), and imaged with an Aperio Scanscope CS with a 20× objective. The TMAs were subsequently de-arrayed in Spectrum Plus, and tumor features were annotated by hand for each TMA core for image analysis. Cores with inadequate tumor were excluded. After tuning of the ‘positive-pixel’ and ‘membrane’ image analysis algorithms and annotation to select tumor regions, image analysis was performed on the TMA images (Fig. 1C). Statistical analysis of the expression of the biomarkers with reference to smoking history was not significant.
Clinicopathological Characteristics of Patients with Non-small Cell Lung Cancer.
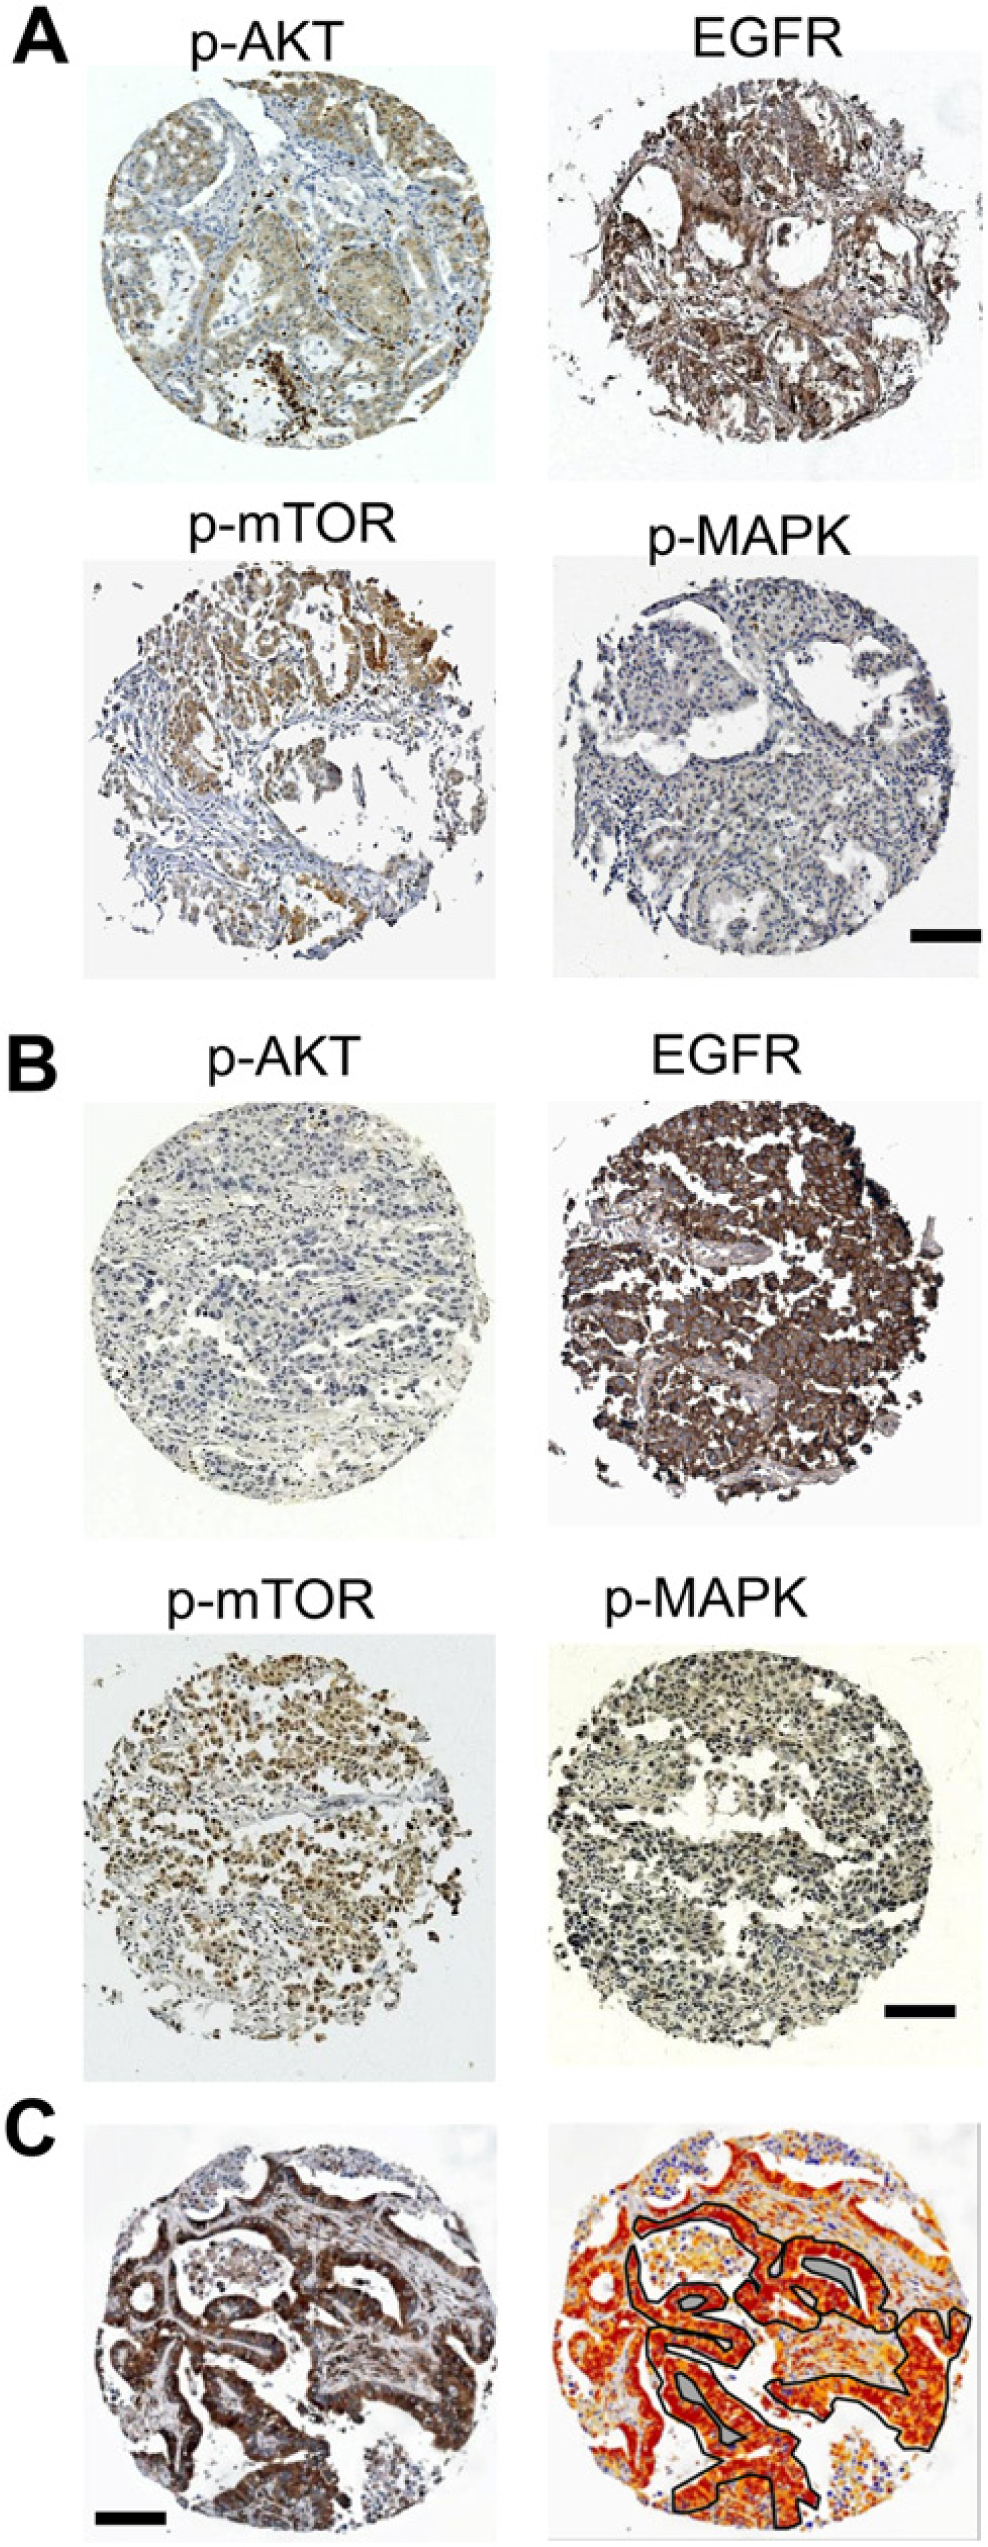
(A and B) Immunohistochemical staining of representative cores from two different patients for the panel of markers investigated: phosphorylated mammalian target of rapamycin (p-mTOR), phosphorylated protein kinase B (p-AKT; T308), phosphorylated mitogen-activated protein kinase (p-MAPK), and the epidermal growth factor receptor (EGFR). EGFR showed membrane staining, whereas p-AKT, p-mTOR and p-MAPK showed cytoplasmic staining. (C) Immunohistochemical staining and quantitative imaging: strong positive pixels are red, positive pixels are orange, weak positive pixels are yellow. The region of the tissue core used for the analysis is outlined in black, with excluded internal regions shaded-out in grey. Scale bars = 100 µm.
Survival analysis
Examination of patient survival was performed by means of Kaplan-Meier plots and log-rank analysis. Individually, p-mTOR, p-AKT, p-MAPK and EGFR did not predict survival (Fig. 2A) when the average score was used as a cut-off point for dichotomization. Based on a previous approach, we described with ratiometric biomarkers with continuous data (Chung et al. 2009). We analyzed the data with the ratios of p-mTOR/p-AKT and p-MAPK/EGFR. Similar to the previous metrics, the downstream targets are the numerators within the ratio. Using a cut-off value of 0.01, the normalized data was selected for both ratiometric biomarkers, based on inspection of the distribution of the calculated values. p-mTOR/p-AKT and p-MAPK/EGFR were statistically significant by log-rank analysis (p=0.008 and p=0.029) (Fig. 2B). After adjusting for covariates in a Cox hazards model, no significance was found (p=0.221 and p=0.103).
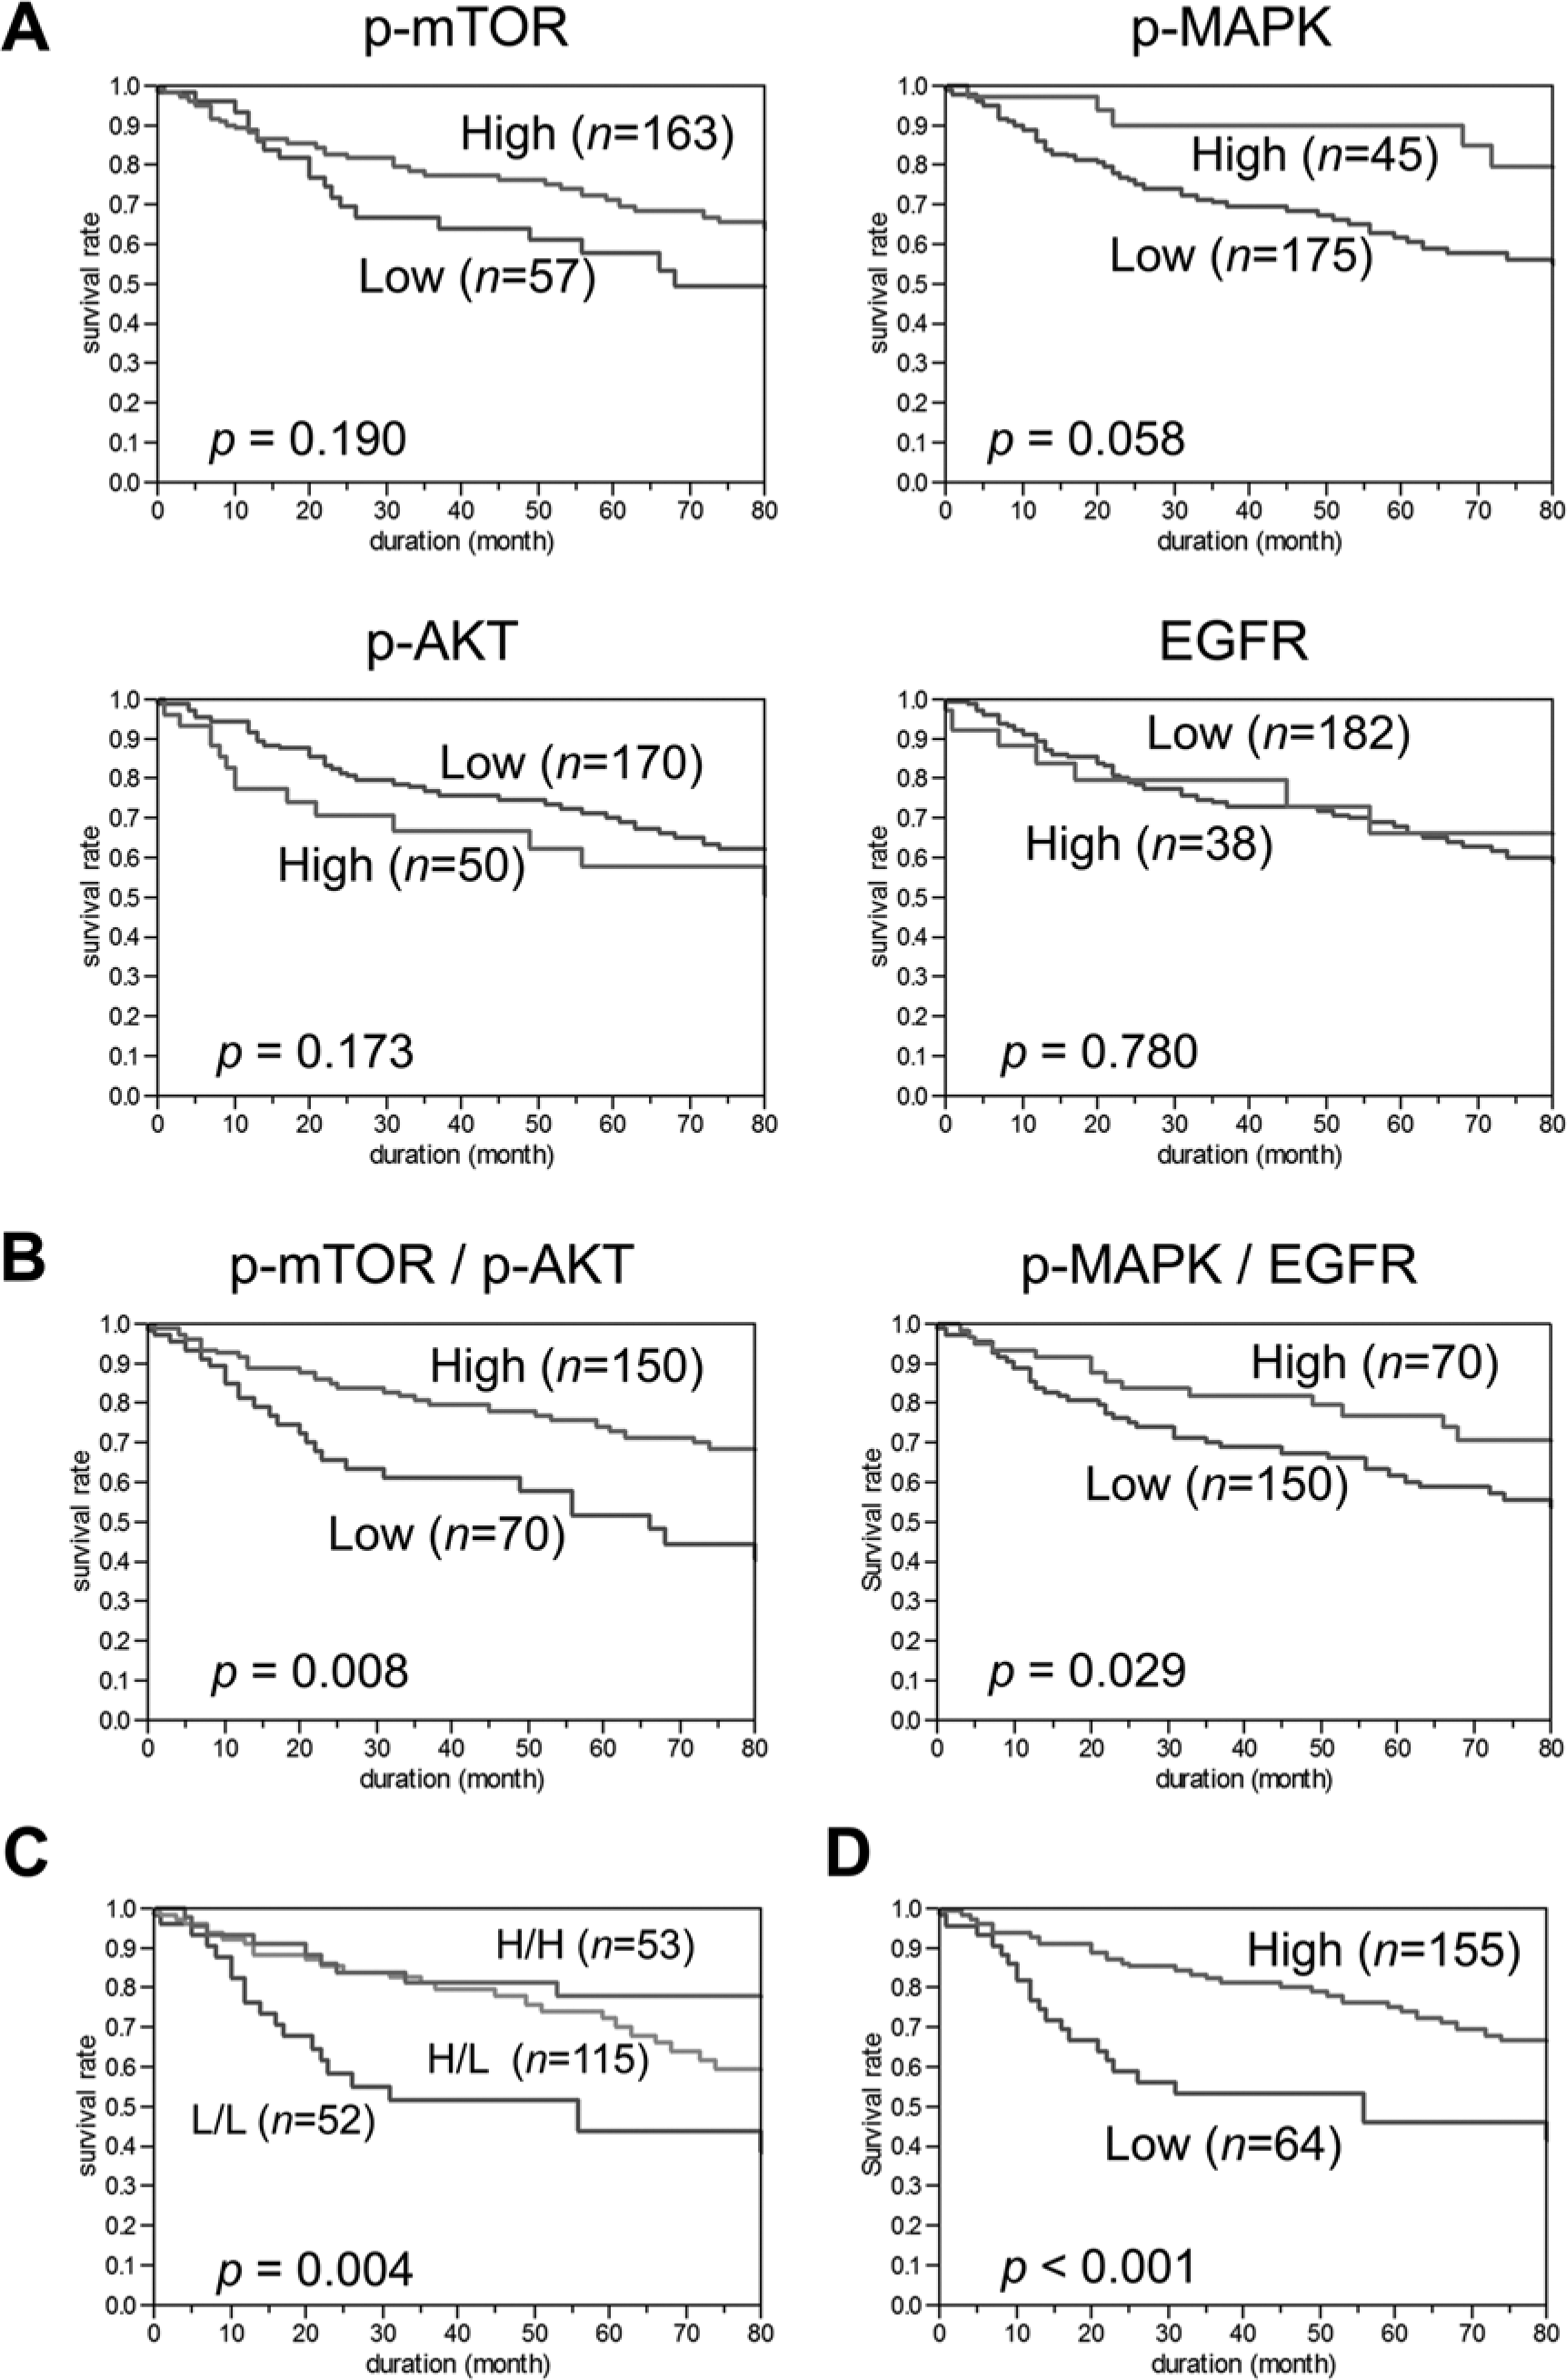
Kaplan-Meier survival analysis of non-small cell lung cancer patients. (A) Correlation of each single antibody expression with patient outcome. (B) Correlation of the ratio p-mTOR to p-AKT (p-mTOR/p-AKT) and the ratio of p-MAPK to EGFR (p-MAPK/EGFR) with patient outcome. (C) Correlation of three groups: both of the ratios were high (H/H), one was high (H/L), or both were low (L/L). (D) Correlation of double ratio with patient outcome.
Algebraic Biomarker (p-mTOR/p-AKT) + (p-MAPK/EGFR)
Acknowledging that the results were of limited utility even though statistically significant, as well as the previously identified cross-talk between these pathways, we sought to combine the two ratio-based biomarkers into a single biomarker. Analysis of the two biomarkers into three groups—both positive, discordant, or both negative—resulted in median 5-year survival rates of 78%, 72%, and 44%, respectively (p=0.004) (Fig. 2C). In an effort to further refine this, we added the two ratios, generating a formula of: (p–mTOR/p–AKT) + (p–MAPK/EGFR) = outcome value.
Utilizing a cut-off point of 0.015 for dichotomization—selected by evaluation of the distribution of values—the double ratio output demonstrates a more significant difference, with a 5-year survival rate of 75% for the algebraic biomarker positive patients and 46% for negative patients (Fig. 2D and Supplemental Fig. 1). The log-rank test of the Kaplan-Meier analysis was strengthened (p<0.001). The algebraic biomarker was associated with gender (p<0.001), T status (p<0.001), cancer type (p<0.001) and differentiation (p = 0.012), but not associated with smoking history, stage or lymph node metastasis. After adjustment for gender, age, cancer type, differentiation and stage, by Cox proportional hazards regression model, the algebraic biomarker remained significant (p=0.026) (Table 2).
Multivariate Analysis with Cox Proportional Hazards.
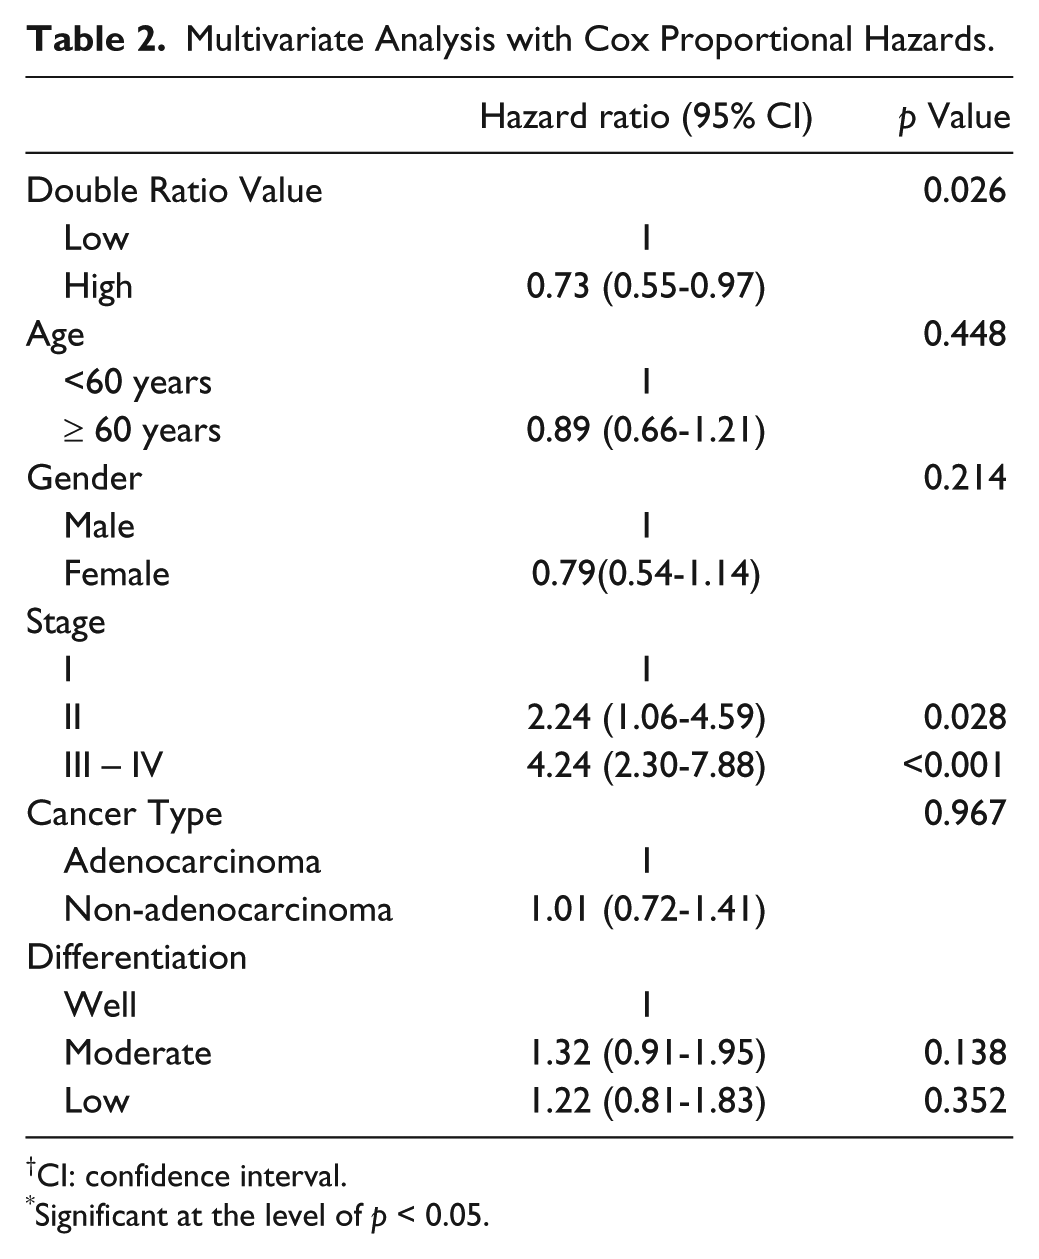
CI: confidence interval.
Significant at the level of p < 0.05.
Hierarchical Clustering and Correlations between Biomarkers
A total of 220 NSCLC cases were analyzed by hierarchical clustering with the continuous results from the immunohistochemistry imaging analysis. As shown in Figure 3, four categories were defined. Box plots of the scores for the individual biomarkers are presented in Figure 4. Category 1, (n=28) indicates signaling via the AKT-mTOR axis, with higher expression of p-AKT and p-mTOR than that in the other groups. In contrast, category 4 (n=27) indicates signaling via the EGFR pathway, with higher expression of EGFR and p-MAPK. Categories 2 (n=71) and 3 (n=94) represent the majority of patients and are largely separated because patients in category 2 have greater overall signaling activity across all four biomarkers than patients in category 3, who demonstrate the lowest average activity in three of the four biomarkers assayed.
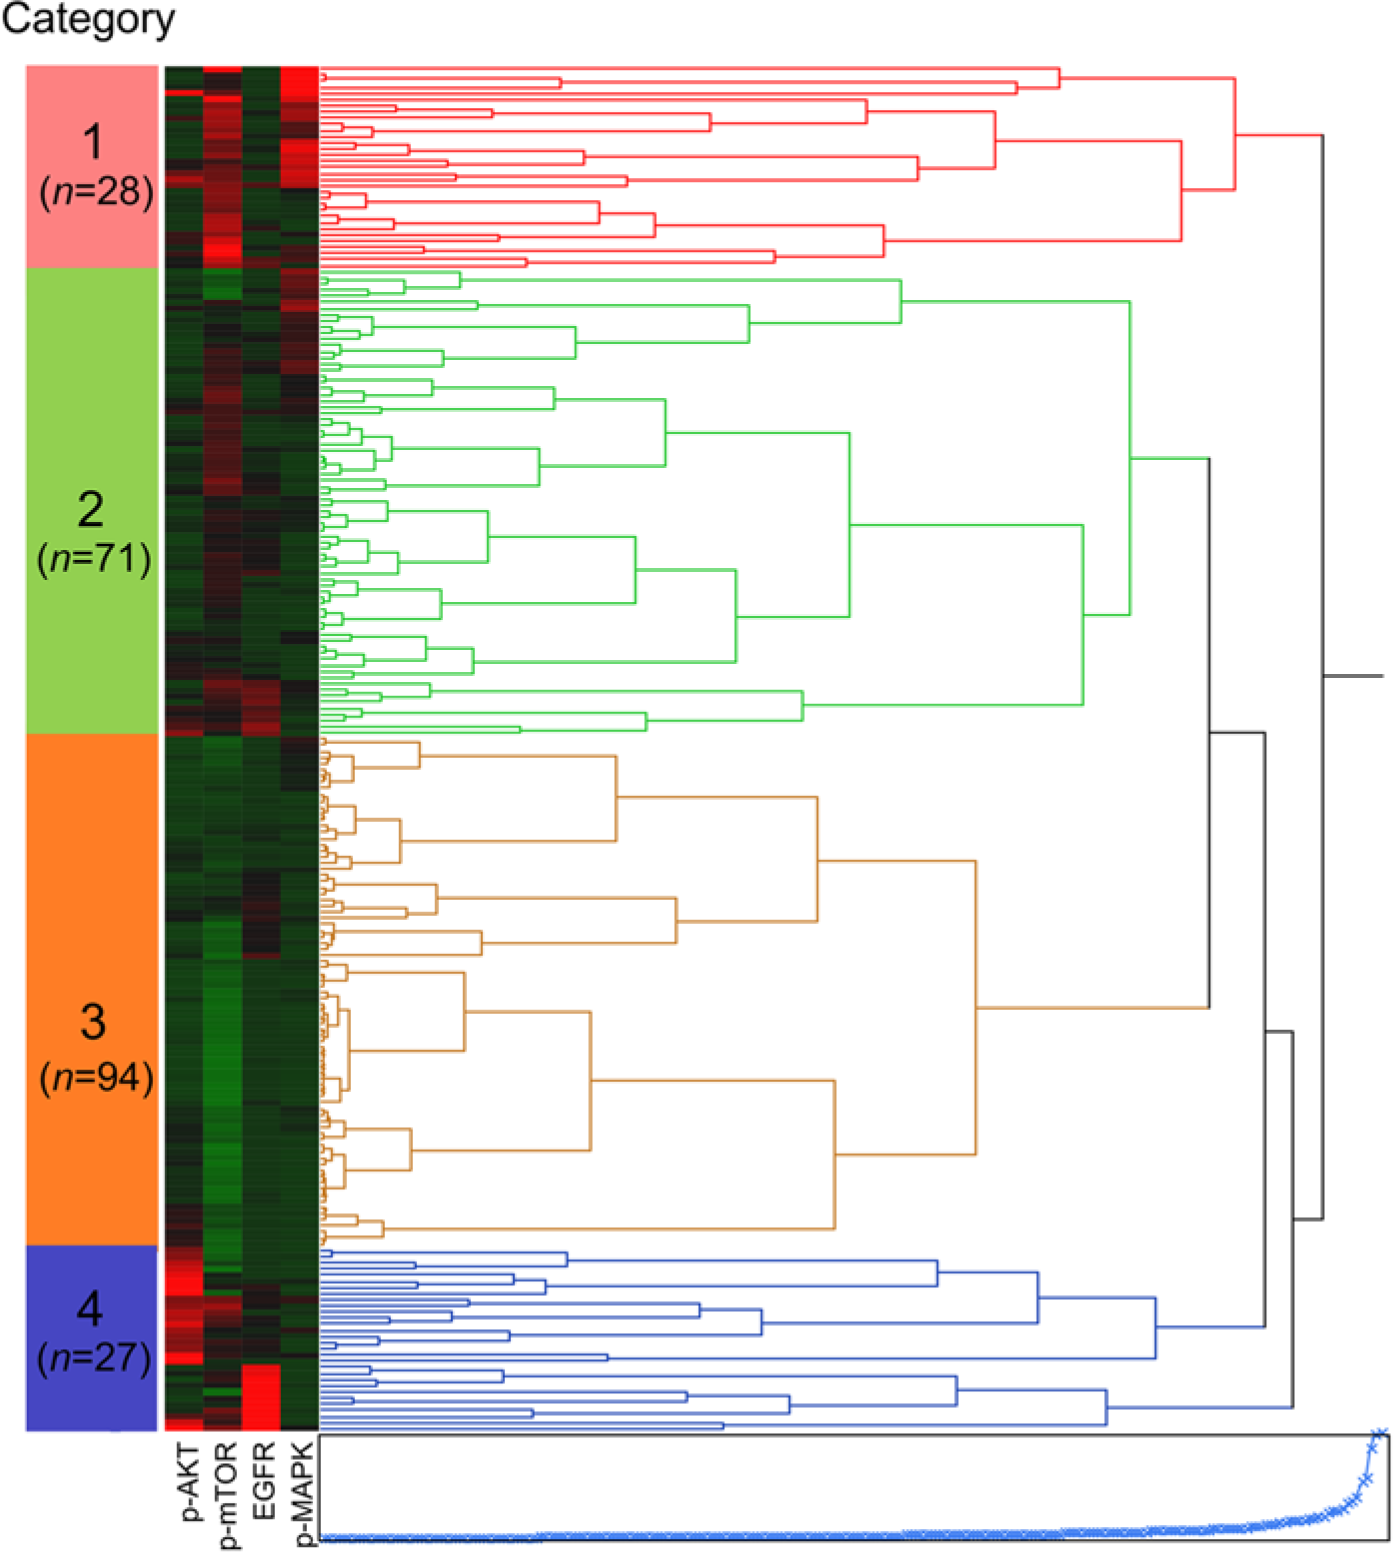
Hierarchical clustering of correlation coefficients for immunohistochemical expression of p-AKT, p-MAPK, p-mTOR and EGFR was performed with Weight Score. Four groups (Category 1 to 4) are defined.
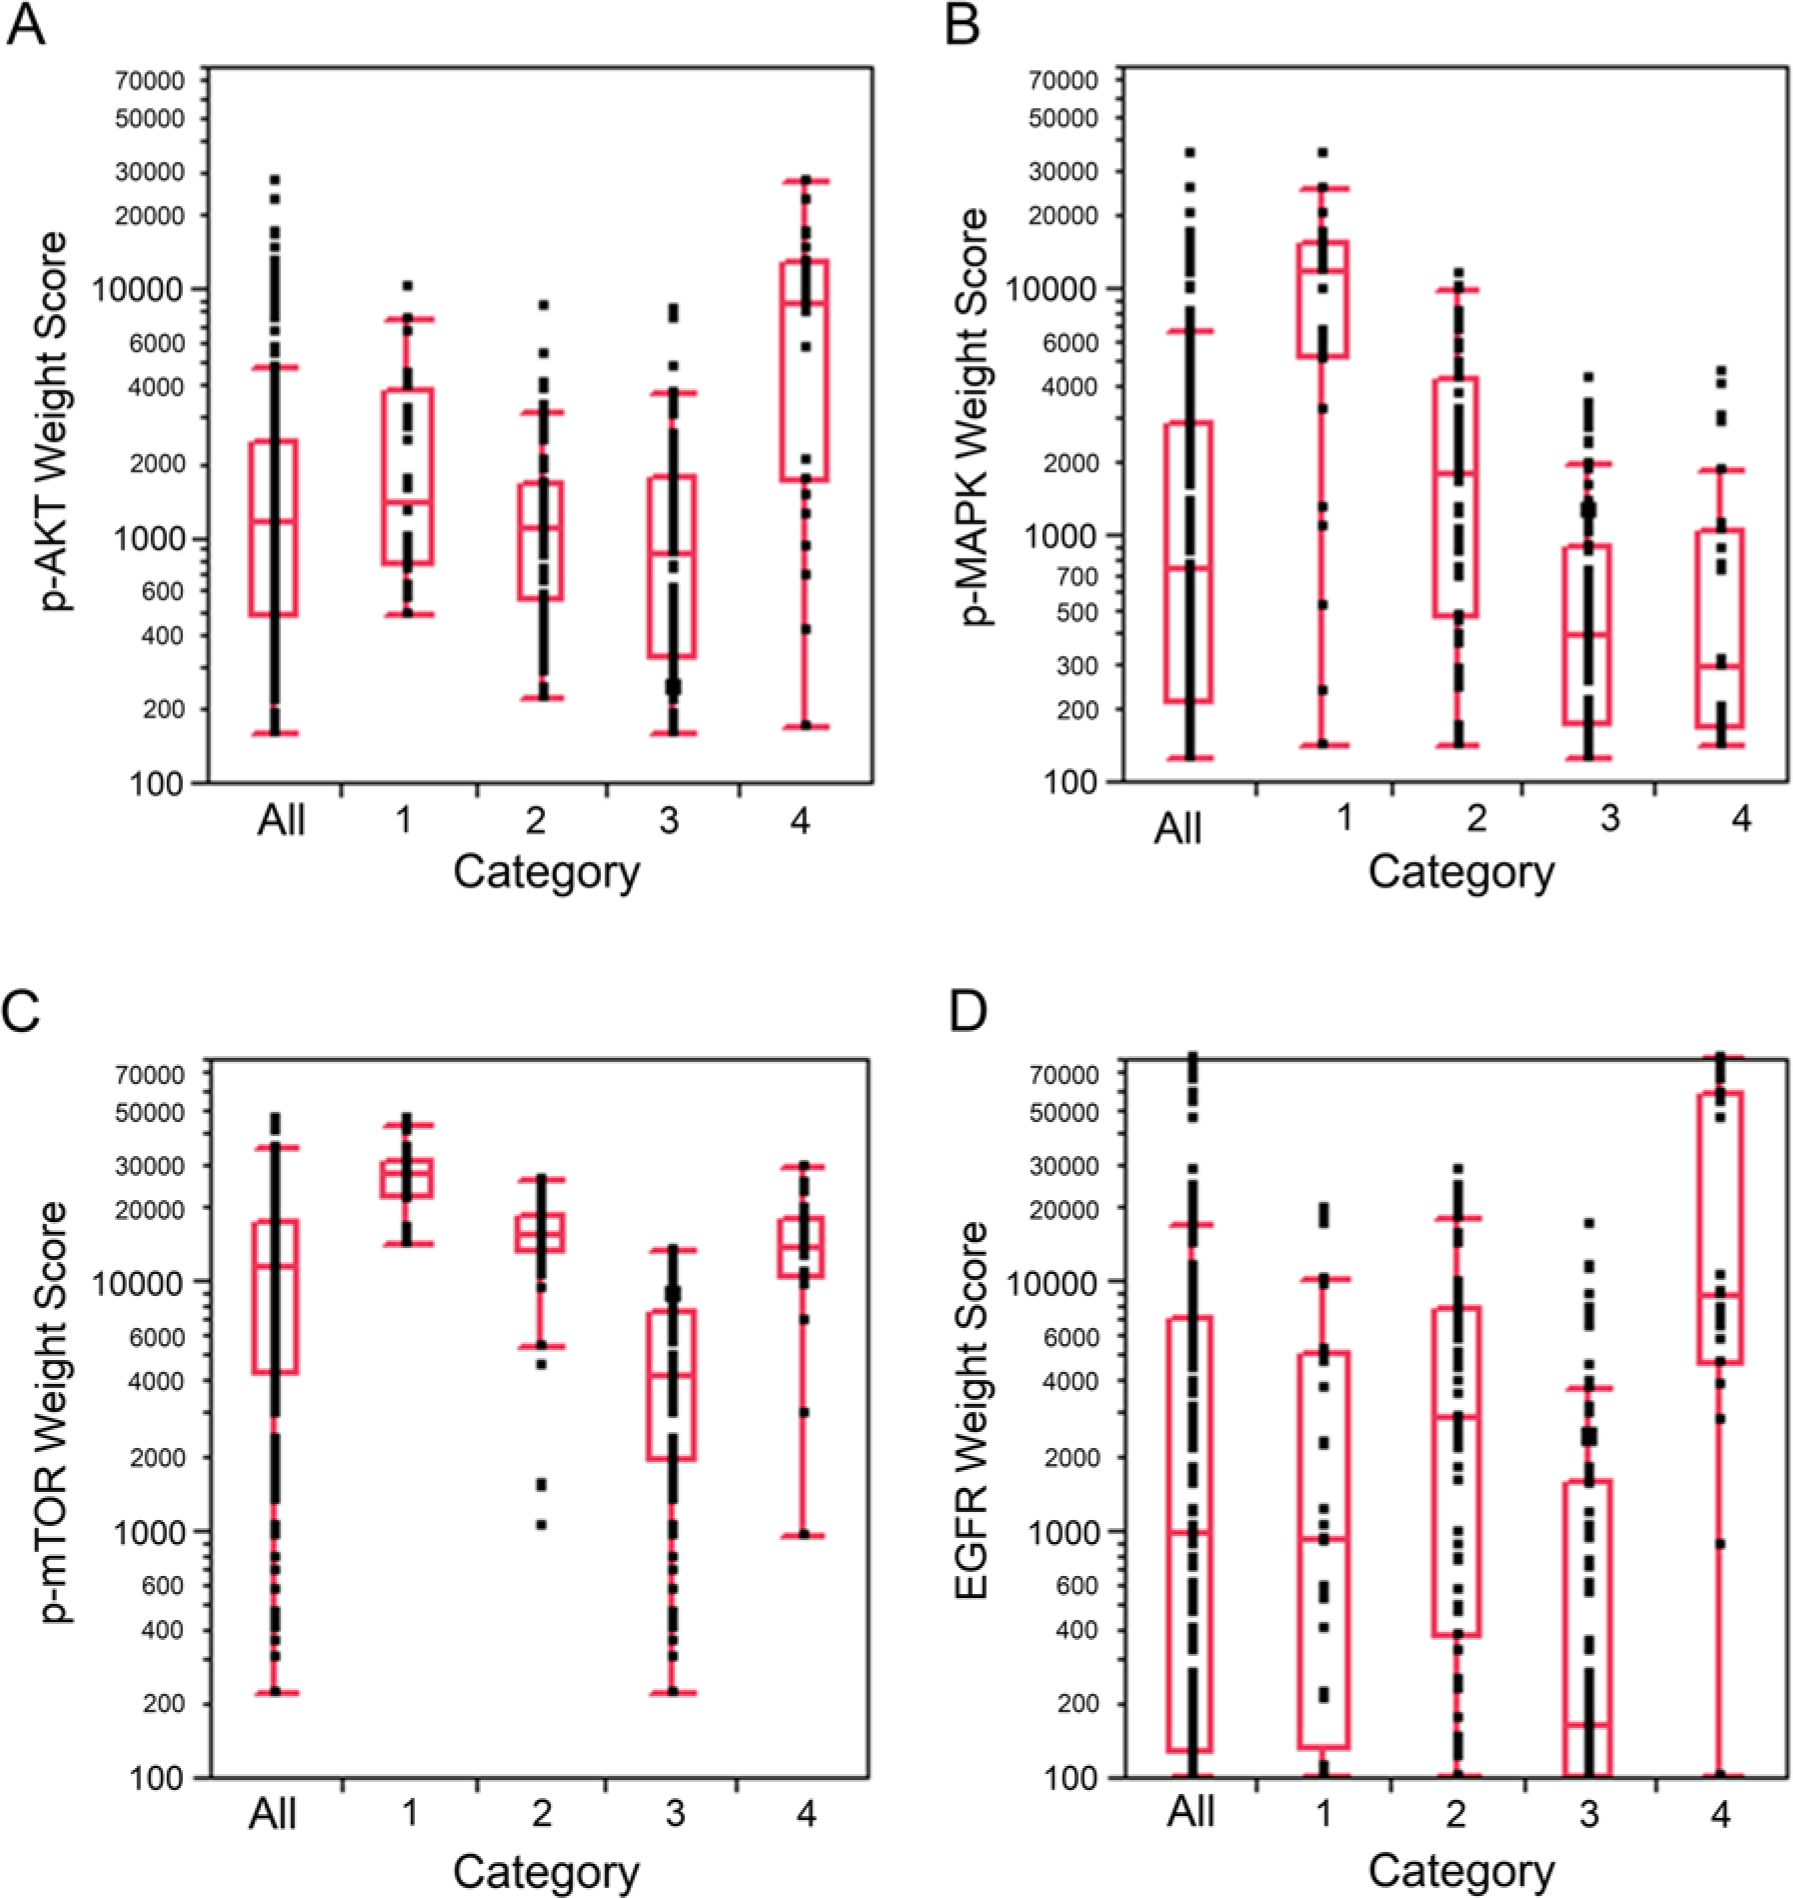
(A–D) Box plots of the scores of the individual biomarkers, p-AKT, p-MAPK, p-mTOR and EGFR, categorized by groups as defined by hierarchical clustering (Figure 3).
Analysis of the categories with reference to the clinicopathological factors failed to demonstrate a difference in survival based on category (Table 3), but did demonstrate differences in gender (excess men in categories 1 and 4) and stage (state I associated with category 1, and stages II-IV associated with category 4). Notably, category 4 had a substantially lower fraction of adenocarcinomas. Lastly, category 1 demonstrated the smallest fraction of smokers.
Association between Clinicopathological Characteristics and Four Groups Defined with Cluster Analysis.
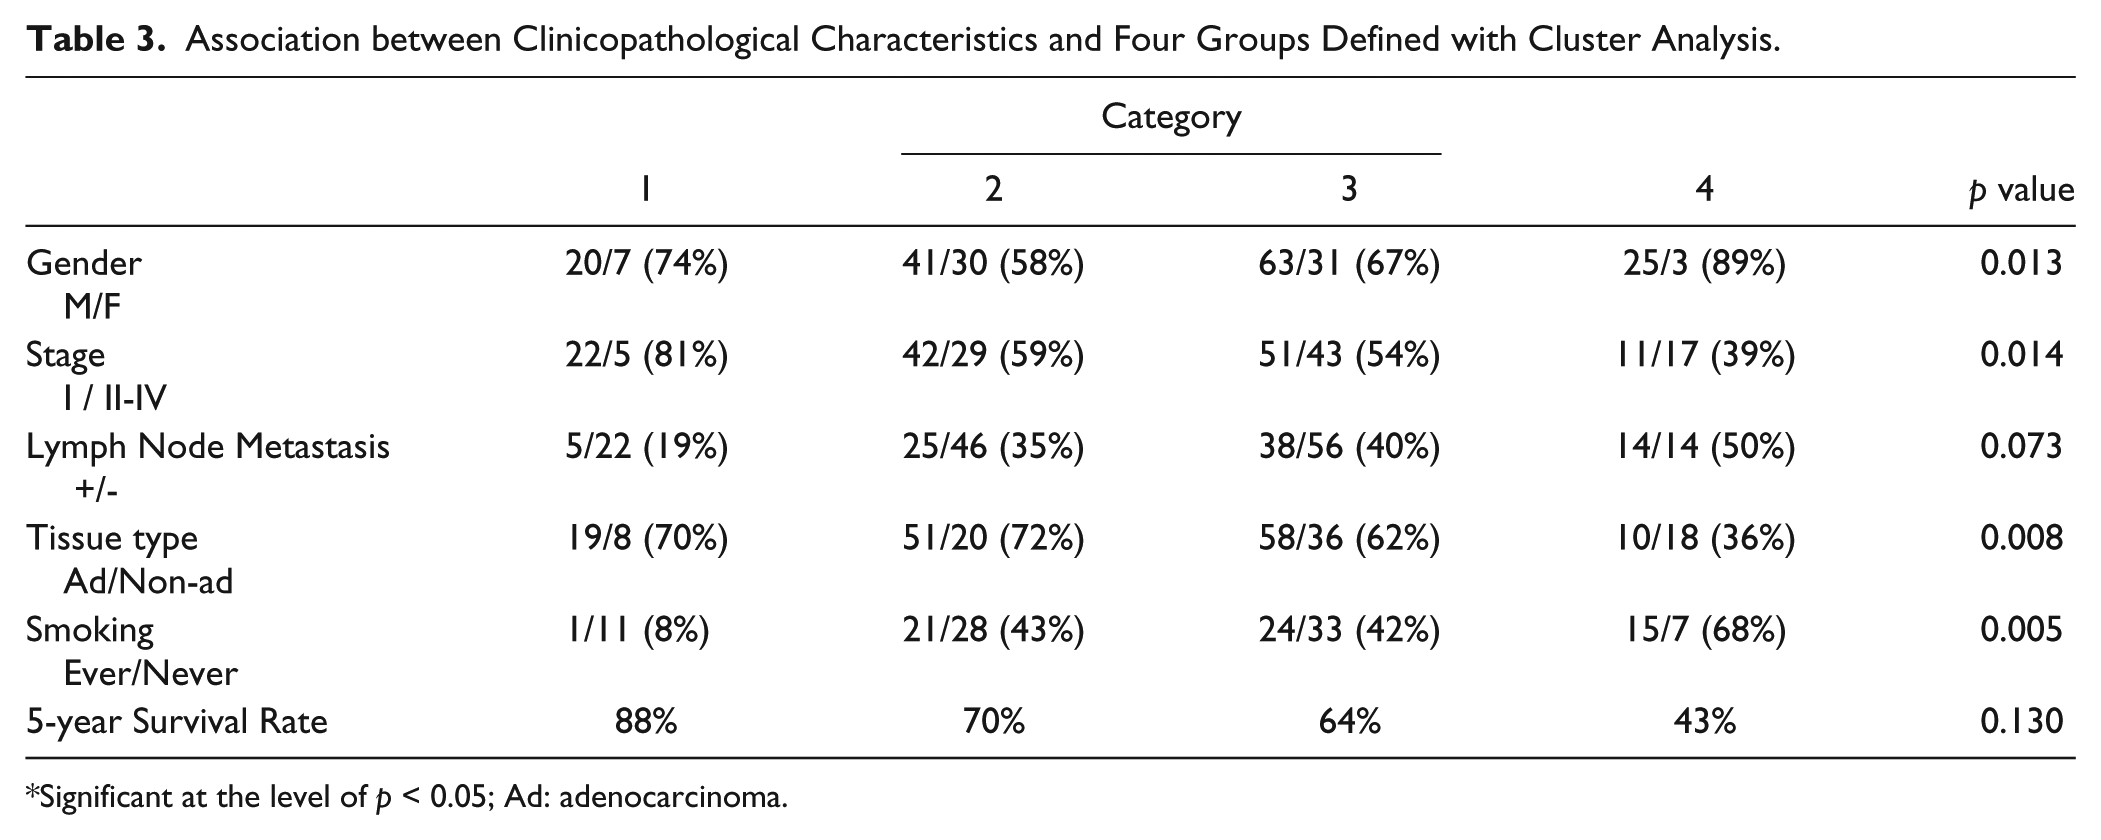
Significant at the level of p < 0.05; Ad: adenocarcinoma.
Category 1 of the hierarchical clustering contained patients with a good overall survival (88%), low stage, rare metastasis and high p-MAPK/EGFR and p-mTOR/p-AKT ratios, which is reflected in a high double ratio. Categories 2 and 3 were intermediate for all survival, stage and lymph node metastasis but different in molecular phenotype. In category 2, p-MAPK/EGFR was much lower, while the p-mTOR/p-AKT was elevated, with a similar proportion of double ratio-positive cases. In contrast, category 3 showed a reversal in the signaling pattern, low p-MAPK/EGFR and intermediate p-mTOR/p-AKT. Lastly, category 4 clinically had the poorest outcome, with shorter survival, despite similar stage and lymph node status within the cohort. Category 4 had the lowest double ratio and as well as lowest ratios for both p-MAPK/EGFR and p-mTOR/p-AKT, as well as the lowest proportion of patients with adenocarcinoma and the highest proportion of smokers.
Discussion
The capacity to combine biomarkers into a single output offers many advantages, most importantly, simplified decision processes to direct care. We have previously demonstrated that the ratio of markers within a defined pathway improves prognostication (Chung et al. 2009). In this paper, we have expanded upon this approach and demonstrated the combination of four antibody biomarkers into a single biomarker by way of addition of two ratio-based biomarkers. Each ratio is based on the measurements of proteins within a single pathway, and the combination of the two is an effort to account for concurrent signaling pathways. In the past, Kaplan-Meier analyses of multiple biomarkers produced graphs with two lines for each biomarker, resulting in multiple potential outcomes, which lessened their utility. The goal of this approach is to leverage biomarker information by combining multiple biomarkers that are physiologically related into a single metric, and to refine the outcome models. The developed biomarker is prognostic in nature, but as the proteins measured are drug targets, or downstream of drug targets, there may be a role in the identification of patients for targeted therapies.
Although we failed to define any of these proteins individually as prognostic biomarkers, we demonstrated that ratios of proteins in a signaling pathway can function as a biomarker of survival (Fig. 2C, D). The simple ratios of p-mTOR/p-AKT and p-MAPK/EGFR provide confirmation that the pathways are active and that the amplitude of the signal through a pathway is a better model than a single measurement of protein levels in reference to the outcome. p-mTOR/p-AKT contributes, in the majority of cases, more to the survival function than does the p-MAPK/EGFR ratio (Supplemental Figure 1). However, there is no clear trend as to which ratio contributes the most to the final biomarker, suggesting that information from both ratios is critical. We also applied Cox-proportional hazards analysis. Although the single ratios were insignificant in a Cox hazards model, the combination of the two demonstrated statistical significance. The algebraic biomarker was associated with decreased risk of death, differentiation and T status, but not with stage or lymph node metastasis. Subsequently, we utilized hierarchical cluster analysis in an effort to better understand the relationships between the biomarkers. We defined four groups that reflected differences in signaling. However, these groups failed to predict survival. The linkage of gender, stage, tumor histology and smoking history to these categories is not surprising (Tsurutani et al. 2007). Category 1 signifies those tumors with good clinical behavior by AKT to mTOR signaling, whereas category 4 represents more aggressive clinical behavior, especially smoking status, and is associated with EGFR pathway signaling. Categories 2 and 3 showed intermediate clinical behavior, but the former demonstrated more signal overall than the latter. Previous studies have implicated the AKT/mTOR pathway in a diverse range of lung cancers, and AKT regulates many cellular processes, including proliferation, mobility, neo-vascularization and survival (Samuels and Ericson 2006; Tang et al. 2006; Lim et al. 2007). MAPK can be phosphorylated by EGFR. There is no doubt that MAPK and AKT pathways are associated with smoking; however, as we did not have a smoking history for the majority of the patients, we had to exclude this variable from the Cox proportional hazard model.
In developing this approach, we noted that, for pathways of activation, the downstream proteins are numerators, and the upstream proteins are denominators. Conversely, in pathways of repression, the upstream (repressing) proteins are the numerators, and the repressed targets (or other downstream proteins) are the dominators. The cut-off values for dichotomization were based on inspection of the distribution of the calculated ratio, and not subject to iterative testing.
Immunohistochemical studies with manual scoring are qualitative, rather than quantitative, but remain popular for evaluating protein expression (Taylor 2000). Previous studies reported that p-AKT was observed in 20–89% of NSCLC and p-MAPK was in 22–77% (Cappuzzo et al. 2004; Massion et al. 2004; Mukohara et al. 2004; Sonobe et al. 2007). One of the reasons for the wide-range of positive rates for these expressions may be manual scoring. The application of image analysis revealed quantitative information and enabled the comparison of multiple protein expressions. In this study, we applied quantitative analyses, which are usually determined using a scale for the assessment of distribution and/or a scale for the assessment of intensity (Howard et al. 2004; Vergis et al. 2008; Yano et al. 2008). This approach of using the algebraic biomarker leverages quantitative measurements of individual biomarkers to generate ratios that reflect pathway activation.
The application of combining biomarkers is complex. The development of these tests requires a highly defined assay applied to well-characterized and high-quality samples with detailed clinical and outcome information. Once a presumptive biomarker has been defined, it requires additional validation, including replication of results and defining the assay (Hewitt et al. 2012). Ultimately, if a potential predictive biomarker is envisioned, it will require evaluation in a prospective trial (Poste et al. 2012). The process from a research finding to a clinical tool is lengthy and complex. It relies on careful the definition of the assays and replication of the data before it is suitable for clinical decision making (Poste et al. 2012). Ultimately the approach of profiling multiple biomarkers within the context of pathways has the potential to define more robust clinical biomarkers than does the current efforts of single biomarker analyses.
The AKT/mTOR and MAPK pathways have been extensively evaluated in NSCLC, both from the perspective of biomarkers of outcome and targets of therapy (Rini 2008; Jokinen et al. 2012; Akinleye et al. 2013; Dai et al. 2013; Ramalingam et al. 2013). There are many inhibitors in either pathway that have been evaluated in clinical trials; however, single-agent approaches to chemotherapy have proven to have limited efficacy. The dual activation of both AKT/mTOR and MAPK pathways is likely to result in resistance to the individual targeting of either pathway. Co-inhibition of both pathways has shown utility in reducing tumor growth in a variety of xenograft cancer models (Engelman et al. 2008; Hoeflich et al. 2009; Holt et al. 2012; Renshaw et al. 2013). Several trials that target the AKT/mTOR and MAPK pathways simultaneously are ongoing, utilizing the combination of AKT inhibitor plus MEK inhibitor or the combination of mTOR inhibitor and MEK inhibitor. What role(s) this cross-talk plays in modulating the transmitted signals is poorly understood (Samuels and Ericson 2006; Saini et al. 2013). Although pre-clinical studies suggest that combinations of signaling inhibitors might be highly effective, there always remains the risk of toxicity. The AKT/mTOR and MAPK signaling pathways regulate important physiological functions in non-transformed cells; however, there is concern that an elongated blockade period might not be feasible (De Luca et al. 2012).
Gefitinib, a selective EGFR tyrosine kinase inhibitor, appears to be more efficacious in only specific populations, which suggests evaluation of additional downstream targets that offer additional therapeutic opportunities. Hosokawa et al. (2009) showed that p-MAPK expression was an independent, negative prognostic factor for patients with gefitinib treatment whereas p-AKT or EGFR expression were not, and that EGFR mutation was associated with p-AKT, not p-MAPK and EGFR expressions. Cappuzzo et al. (2007) showed that both EGFR and p-AKT positive expression had better responses with gefitinib and significantly longer survival periods, but did not evaluate p-MAPK and p-mTOR. Janmaat et al. (2003) showed that constitutively active MAPK and AKT could contribute to resistance to anti-EGFR treatment, which may have important clinical relevance. Han et al. (2005) described that p-AKT positive patients without EGFR mutations tended to show a shorter survival rate. There are many targeted agents inhibiting AKT/mTOR pathway or MAPK pathway (Sawyers 2003; Easton and Houghton 2004; Rinehart et al. 2004; Lorusso et al. 2005; Gharbi et al. 2007; Fasolo and Sessa 2008; Prevo et al. 2008 ). Recent studies described that the combination of PI3K and/or AKT and MEK inhibitors might be synergistic (Smalley et al. 2006; Legrier et al. 2007; Yu et al. 2008; Tamborini et al. 2010). Unfortunately, our study is limited to the evaluation of survival and we lack information on treatment and response to treatment. Additionally, the mutational status of EGFR status (Cappuzzo et al. 2003; Suzuki et al. 2003) in this cohort is unavailable. However, in examining a small collection of patients in which EGFR mutational status is defined, there was no correlation between protein expression patterns and mutational status.
Overall, our data suggest that the use of a complex metrics of AKT and EGFR pathways elucidates prognostic information that is otherwise not obtainable from simpler measurements of pathway activity. The data reveal that the interactions between the AKT and EGFR pathways are important in tumor progression and patient survival. Harnessing a quantitative image analysis approach of immunohistochemistry with algebraic-like equations offers novel biomarkers of survival. The sum of p-mTOR/p-AKT and p-MAPK/EGFR is a superior predictor of outcome in this NSCLC cohort, albeit additional validation is required. The approach of combining the measurement of proteins based on pathway interactions may offer more robust biomarkers than single-protein approaches.
Footnotes
Declaration of Conflicting Interests
The author(s) declared no potential conflicts of interest with respect to the research, authorship, and/or publication of this article.
Funding
The author(s) disclosed receipt of the following financial support for the research, authorship, and/or publication of this article: This research was supported in part by the Intramural Research Program of the NIH, National Cancer Institute, Center for Cancer Research.