
Abstract
Hypertension is associated with the structural remodeling and stiffening of arteries and is known to increase cardiovascular risk. In the present study, we investigated the effects of overexpression and knock down of profilin-1 on the vascular structural remodeling in spontaneous hypertensive rats (SHRs) using an adenovirus injection to knock down or overexpress profilin-1 mRNA. As a control, blank adenovirus was injected into age-matched SHRs and Wistar-Kyoto rats (WKYs). We quantified arterial structural remodeling through morphological methods, with thoracic aortas stained with hematoxylin–eosin and picosirius red. Western blotting was performed to measure the protein expression of inducible nitric oxide synthase (iNOS) and p38 mitogen-activated protein kinase (p38), and peroxynitrite was quantified by immunohistochemical staining. Overexpression of profilin-1 significantly promoted aortic remodeling, including an increase in vessel size, wall thickness, and collagen content, whereas the knockdown of profilin-1 could reverse these effects. In addition, the expression of phosphorylated p38, iNOS and peroxynitrite was significantly upregulated in SHRs with profilin-1 overexpression along with an increased level of interleukin- 6 (IL-6). These changes could be reversed by knockdown of profilin-1. Our results demonstrate a crucial role for profilin-1 in hypertension-induced arterial structural remodeling at least in part through the p38–iNOS–peroxynitrite pathway.
Introduction
Vascular hypertrophy and remodeling in hypertension is an adaptive process in response to chronic changes in hemodynamic conditions during the development of vascular diseases (Krum and Gilbert 2007; Moustafa-Bayoumi et al. 2007). The ensuing changes in the size and/or composition of a remodeling blood vessel allows blood vessels to adapt and heal but they also underlie the pathogenesis of major cardiovascular diseases (Epstein et al. 1994).
Profilin-1 is a ubiquitous, small (12–15 kD) actin-binding protein that plays an important role in the regulation of actin polymerization and cytoskeleton remodeling by activating hypertrophic signaling cascades, such as mitogen-activated protein kinase (MAPK) signaling, to thus contribute to vascular hypertrophy and hypertension (Kim et al. 2010; Moustafa-Bayoumi et al. 2007). Numerous studies have provided strong evidence for the important role of profilin-1 in vascular inflammation (Romeo et al. 2007) and vascular remodeling (Hassona et al. 2011; Moustafa-Bayoumi et al. 2007), and have linked profilin-1 to inducible nitric oxide synthase (iNOS) and peroxynitrite production (Jin et al. 2012; Romeo et al. 2007). Also, peroxynitrite has been linked to vascular remodeling because it activates MAPKs (c-Jun N-terminal kinase [JNK], extracellular signal-regulated kinase 1/2 [ERK1/2]) (Bapat et al. 2001; Zhang et al. 2000). However, the relationship between profilin-1, iNOS and the associated remodeling in spontaneous hypertensive rats (SHRs) remains to be fully clarified.
Here, we studied the effects of profilin-1 on hypertension-induced vascular remodeling and its potential relationship with iNOS. We used SHRs as a classical, genetic hypertensive animal model. Overexpression of profilin-1 significantly promoted arterial structural remodeling in SHRs through a p38–iNOS–peroxynitrite– pathway. Profilin-1 may be a potential target for genetic therapy of hypertension-induced arterial structural remodeling.
Materials & Methods
Construction of Adenovirus Vector
The rat profilin-1 gene was synthesized and inserted in the pIRES2-EGFP plasmid (Invitrogen, Carlsbad, CA) to obtain the profilin-1 overexpression vector. We then generated four different profilin-1 microRNA (miRNA) vectors and identified pcDNA6.2-GW/EMGFP-miR-SR-2 as the vector with the greatest capacity to reduce profilin-1 expression following co-transfection in HEK293 cells. We next generated the adenovirus interference vector, pAd-miR-profilin-1, from pcDNA6.2-GW/EMGFP-miR-SR-2 using Gateway recombination technology. Finally, pAd-miR-profilin-1 was transfected into HEK293 cells for adenovirus packaging and titering.
The titre of the recombinant adenoviruses was measured by the immunization method. Primers for profilin-1 miRNA were; forward, 5’-TGCTGATTTCTTGTTGATCAAACCACGTTTTGGCCACTGACTGACGTGGTTTGCAACAAGAAAT-3’ and reverse, 5’- CCTGATTTCTTGTTGCAAACCACGTCAGTCAGTGGCCAAAACGTGGTTTGATCAACAAGAAATC -3’.
Transduction of Human Umbilical Vein Endothelial Cells (HUVECs) with Adenovirus Vector
HUVECs (CRL-2873) were obtained from The American Type Culture Collection (Manassas, VA). HUVECs were routinely grown in M199 (Gibco, Grand Island, NY) supplemented with 20% fetal bovine serum (FBS) (Gibco) and endothelial cell growth supplement (ECGS) (BD Biosciences, Bedford, MA) at 37C and 5% CO2. HUVECs (1×10⁵ cells/well) were seeded onto 1% gelatin-coated 6-well plates in supplemented M199 media. The next day, cells were transduced with 50 multiplicity of infection of profilin-1 miRNA adenovirus vectors, profilin-1 overexpression adenovirus vector or blank control adenovirus vectors for 6 hr before replacing the transduction solution with complete M199 medium. Alternatively, 72 hr after adenovirus transduction, profilin-1 mRNA levels were assessed by quantitative RT-PCR (qRT-PCR), and protein levels were assessed by western blot analysis.
Animal Preparation
Five-month-old male SHRs (n=75) and Wistar-Kyoto rats (WKYs) (n=20) were obtained from Slac Laboratory Animal Co. (Shanghai, P.R. China). All animal procedures were approved by the animal ethics committee of the Qilu Hospital, Shandong University. The animals were kept in a temperature- and humidity-controlled room with 12-hr light/dark cycles. They were given free access to tap water and standard rat chow. The room was kept at 20–22C and 50–55% humidity. SHRs were divided into 3 groups (n=25 each) for treatment: profilin-1 overexpression adenovirus vector (SHR-E), profilin-1 miRNA adenovirus vector (SHR-I) or negative control adenovirus (SHR-C) after 3 days adaptation. WKYs (n=20) were treated with negative control adenovirus at the same time. The adenoviruses were injected twice into the tail vein at 3×10⁹ infectious units per rat with an interval of 6 weeks between injections. At 3 weeks after the first administration, 15 SHRs from each of the three SHR groups (n=5 each) were killed. At 6 weeks after the second administration of adenovirus, the remaining SHRs (n=60) and WKYs were killed.
Blood Pressure and Body Weight Measurement
Systolic blood pressure (SBP) and body weight were measured in conscious animals before the start of treatment and weekly during treatment. Systolic blood pressure (SBP) was measured by means of a tail-cuff sphygmomanometer (BP-98A; Softron, Tokyo, Japan). Animals were trained for 3 days before starting the measurement to prevent stress and were pre-warmed at 30°C with use of a heater (LE5660/6, Letica Scientific Instruments). Before measuring blood pressure, rats were restrained in acrylic animal holders for 5–10 min in a warm, quiet room and were conditioned to numerous cuff inflation-deflation cycles by a trained operator. After the animals were accustomed to the procedure, blood pressure values were obtained from each rat from sequential cuff inflation-deflation cycles. Three consecutive SBP readings were collected and averaged to obtain the exact SBP for presentation.
Sample Collection, Histology and Quantification
At the end of week 13, rats were killed under etherization; thoracic aortas were removed completely and rapidly. Portions of the thoracic aorta were fixed in buffered 4% neutral formalin for hematoxylin and eosin and picrosirius red staining. Others were snap-frozen in liquid nitrogen and stored at -80C for protein and RNA extraction.
Specimens of the middle part of the thoracic aorta were fixed for 24 hr in 10% formalin, routinely processed in paraffin and cut into 5-μm-thick slices for staining with hematoxylin and eosin or trinitrophenol-picrosirius red. The internal circumference and wall thickness of the thoracic aorta were determined using Image-Pro Plus (Media Cybernatics, Inc., Rockville, MD). The arteriolar circumference was calculated by averaging three measurements obtained from three different video frames with the same reference point used as a marker for measuring each vessel in each frame. Picrosirius-red-stained sections were revealed by polarized light and measured using Image-Pro Plus to obtain the percentage of collagen per media area.
Transfection Efficiency Detection
Six days after the second injection of adenovirus, five rats in each group were killed and thoracic aortas were removed to determine transfection efficiency. After fixation in 4% formaldehyde solution at 4C for 48 hr, thoracic aorta specimens were embedded in Jung Tissue Freezing Medium (Leica, Germany) and sectioned at 5 μm for enhanced green fluorescent protein (EGFP) observation. Tissues underwent sky blue staining to shield the autofluorescence of the vascular tissues and DAPI staining was used to locate the nuclei. EGFP expression in the vascular tissues was observed by fluorescence microscopy (DX51, Olympus, Japan) and used to determine transfection efficiency. For each sample, EGFP expression and transfection efficiency were evaluated in six randomly chosen fields per section and quantitated using Image-Pro Plus 6.0 software (Media Cybernetics, Inc.).
Immunohistochemical Analysis
Aortic sections (5-μm-thick) were incubated with mouse IgG monoclonal profilin-1 (1:100) or rat IgG polyclonal iNOS (1:50, both Abcam, Hong Kong) at 4C overnight, followed by incubation with species-appropriate secondary antibodies (ZSGB-BIO, Beijing) at room temperature for 25 min, and finally peroxidase-conjugated streptavidin/peroxidase. The stained tissue slides were examined using an Olympus microscope (model BX-51, Japan). We used a semi-quantitative scoring system to describe the intensity of immunoreactivity by grouping positively stained cells according to the following categories: 0 (no staining), +1 (weak, but detectable), +2 (moderate), and +3 (intense). In each slide, five areas were evaluated under a microscope at 40× original magnification. For each tissue, an H-score value was calculated by multiplying the percentage of cells grouped in one intensity category with the weighed intensity of the staining, then added these products using the formula H-score = ∑(Pc×s), where s represents the intensity scores and Pc the corresponding percentage of the cells.
Measurement of NO, IL-6 and Peroxynitrite Production
NO and interleukin 6 (IL-6) levels were measured from plasma samples according to manufacturers’ instructions using specific kits (NO assay kit, Nanjing Jiancheng Bioengineering Institute, Nanjing, China; rat IL-6 Quantikine ELISA Kit, R&D Systems, Minneapolis, MN). Aortic samples for vascular NO assay were homogenized 1:9 (w:v) in 0.9% saline. The homogenates were then centrifuged at 1000 rpm for 5 min at 4C and the supernatant used for aortic NO assay. The NO assay has been previously described elsewhere (Chen et al. 2012; Yi et al. 2011; Zhao et al. 2013).
Nitrotyrosine staining was used to evaluate peroxynitrite (ONOO–) levels in aortic tissues, as previously described (Gragasin et al. 2003; Oudit et al. 2007). For nitrotyrosine staining, aortic tissue sections were immunostained with polyclonal nitrotyrosine antibodies (1:100; Upstate Biotechnology, Lake Placid, NY). Fluorescent images were observed with an Olympus Fluoview laser-scanning confocal microscope mounted on an Olympus microscope.
Western Blot Analysis
Denatured protein samples were equally (60 µg) loaded onto SDS-PAGE gels and transferred to PVDF membranes by the Bio-Rad electrotransfer system (BioRad, Hercules, CA). After blocking, blots were incubated with primary antibodies for profilin-1 (rabbit polyclonal, 1:1500; Sigma-Aldrich, St. Louis, MO), iNOS (rabbit polyclonal, 1:800; Abcam, Cambridge, MA), phospho-p38 (rabbit monoclonal, 1:2000; Cell Signaling Technology, Beverly, MA), p38 (rabbit monoclonal, 1:2000; Cell Signaling Technology) and GAPDH (rabbit polyclonal, 1:800; Abcam) at 4C overnight. After washing, membranes were then incubated with goat anti-rabbit secondary antibodies (1:10,000; ZSGB-BIO, Beijing) for 1 hr. Proteins were detected by enhanced chemiluminescence (ECL) according to the manufacturer’s instructions and viewed using a Gel-Pro Analyzer Imaging System (Cybernetics, Silver Spring, MD). The densitometric values were normalized to that of GAPDH immunoreactivity to correct for any loading and transfer differences between samples. Band intensities were quantified by immunoblot densitometry using the Gel-Pro Analyzer software.
RNA Preparation and Quantitative Real-Time PCR
Total RNA was extracted by the TRIzol reagent protocol (Omega Bio-Tek, Norcross, GA), and DNA contamination was removed with an RNase-free DNase kit (Qiagen, China). Sample purity was subsequently evaluated using the spectrophotometer to measure absorbance ratios A260/A280 and A260/A230. A260/A280 ratio was between 1.9 and 2, whereas A260/A230 ratio comprised between 2.19 and 2.23 for the assays. The RNA concentration was determined by spectrophotometry using an Eppendorf Biophotometer. For relative quantification of profilin-1 and iNOS mRNA, total RNA was used for cDNA synthesis with the First Strand cDNA Synthesis Kit (Fermentas, Burlington, ON, Canada). The qPCR reactions were performed using RealMaster Mix with SYBR Green as a fluorogenic reagent (Tiangen, Beijing, China). The qPCR program was 95C for 1 min, followed by 35 cycles of 95C for 5 sec, 58C for 15 sec and 68C for 20 sec. Primer sequences were: profilin-1, forward, 5’-ATGCAGGGATGATGTTCTGG-3’ and reverse, 5’- GTGCAAAAGCCAAAGGGAG-3’ (349 bp); iNOS, forward, 5’-GACATCGACCAGAAGCTGTC-3’ and reverse, 5’-GGGCTCTGTTGAGGTCTAAAG-3’ (253 bp); GAPDH, forward, 5’-GACAACTTTGGCATCGTGGA-3’ and reverse, 5’-ATGCAGGGATGATGTTCTGG-3’ (135 bp). PCR efficiency was calculated from the slope of the standard curve using the following formula: PCR efficiency = 10(-1/slope)-1. The standard curve was generated using a 10-fold dilution of the template. PCR efficiency ranged from 90% to 100%. Each gene was measured in triplicate in at least three independent experiments. Calculation of relative mRNA expression was conducted using the ΔΔCT method. As GAPDH is not altered by transfection in vivo or different between WKY and SHR, the relative mRNA level was normalized to that of GAPDH and to a normal control.
Statistical Analysis
Results are expressed as mean ± SEM. Comparisons among groups involved ANOVA followed by the Fisher protected least significant difference or unpaired Student t-test. Differences were considered significant at p<0.05.
Results
Transfection Efficiency of Adenovirus Vector
The high transfection efficiency was confirmed by observing EGFP expression under fluorescence microscopy and detecting the mRNA and protein expression of profilin-1 (Figs. 1, 2) both in vivo and in vitro. HUVECs were transduced with 50 multiplicity with three types of adenovirus vectors or saline. As shown in Figure 1A, EGFP expression was observed in more than 90% cells for each transduction group. After injection into rats, EGFP expression was observed in both endothelial cells and smooth muscle cells of the aorta (Fig. 2A). Profilin-1 expression was higher in HUVECs and aortic tissues after profilin-1 overexpression by adenovirus vector transfection, but was reduced by profilin-1 miRNA vector treatment (Figs. 1B, 2B).
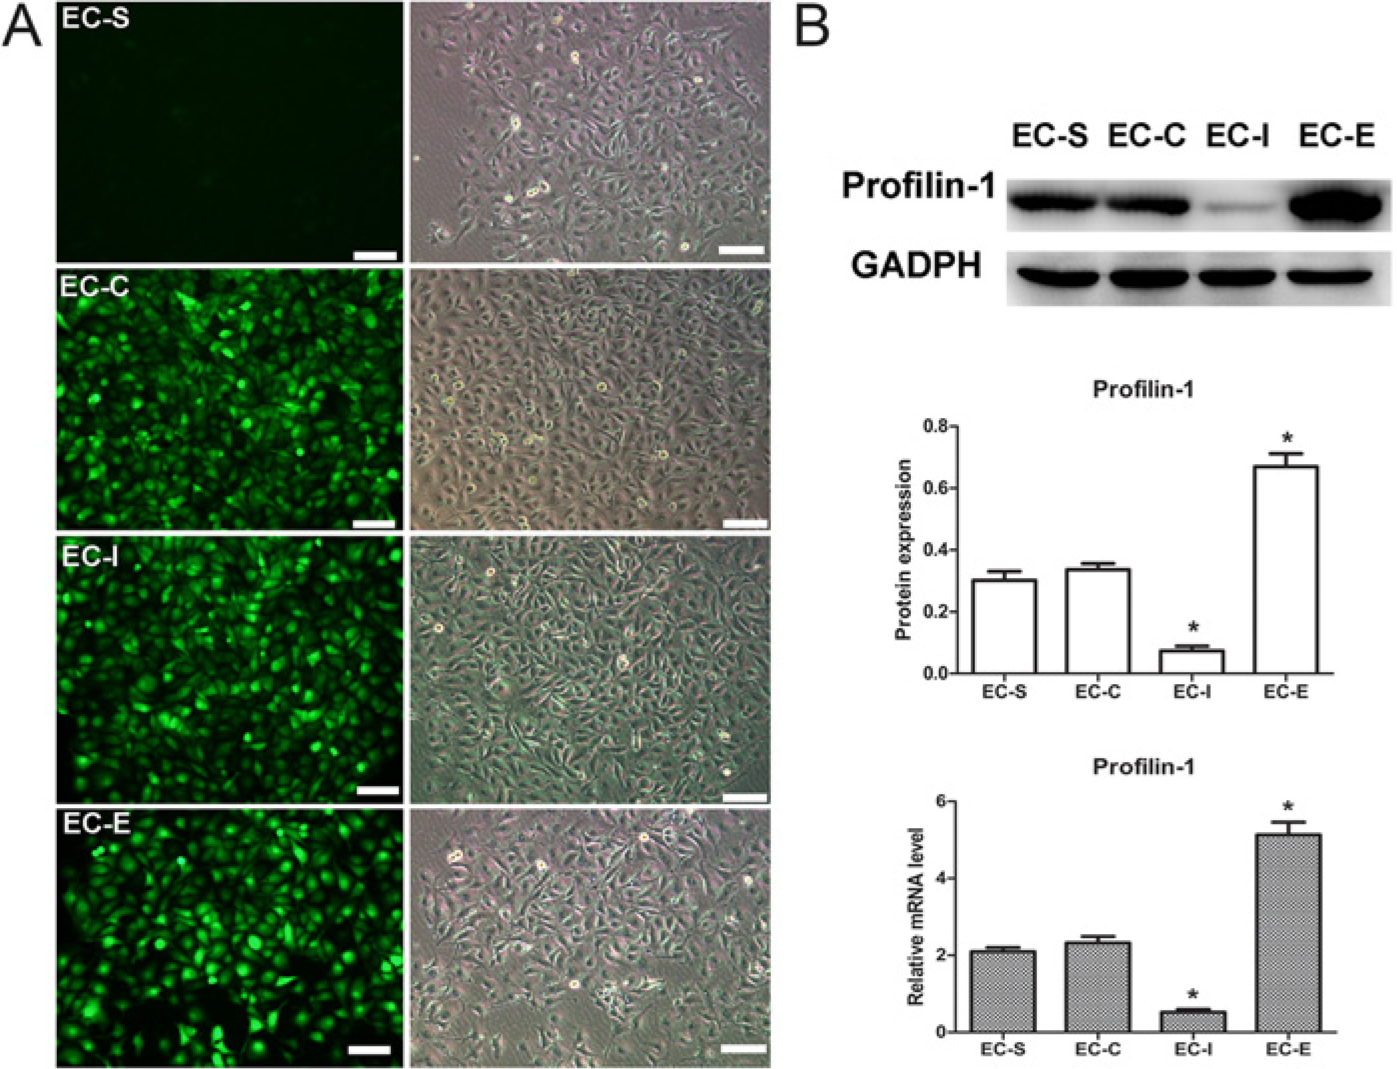
Effect of adenovirus on the expression of profilin-1 in human umbilical vein endothelial cells (HUVECs). (A) Adenovirus transfection efficiency was indicated by green fluorescent protein (GFP) expression. (B) Real-time PCR and western blot analyses showing profilin-1 expression in HUVECs. EC-S: cells treated with saline; EC-C: cells treated with negative control adenovirus; EC-I: cells treated with adenovirus vector to inhibit profilin-1 expression; EC-E: cells treated with adenovirus vector to overexpress profilin-1. GAPDH was used as a loading control. Data are shown as mean ± SEM, *p<0.05 vs. EC-C. Bars, 50 μm.
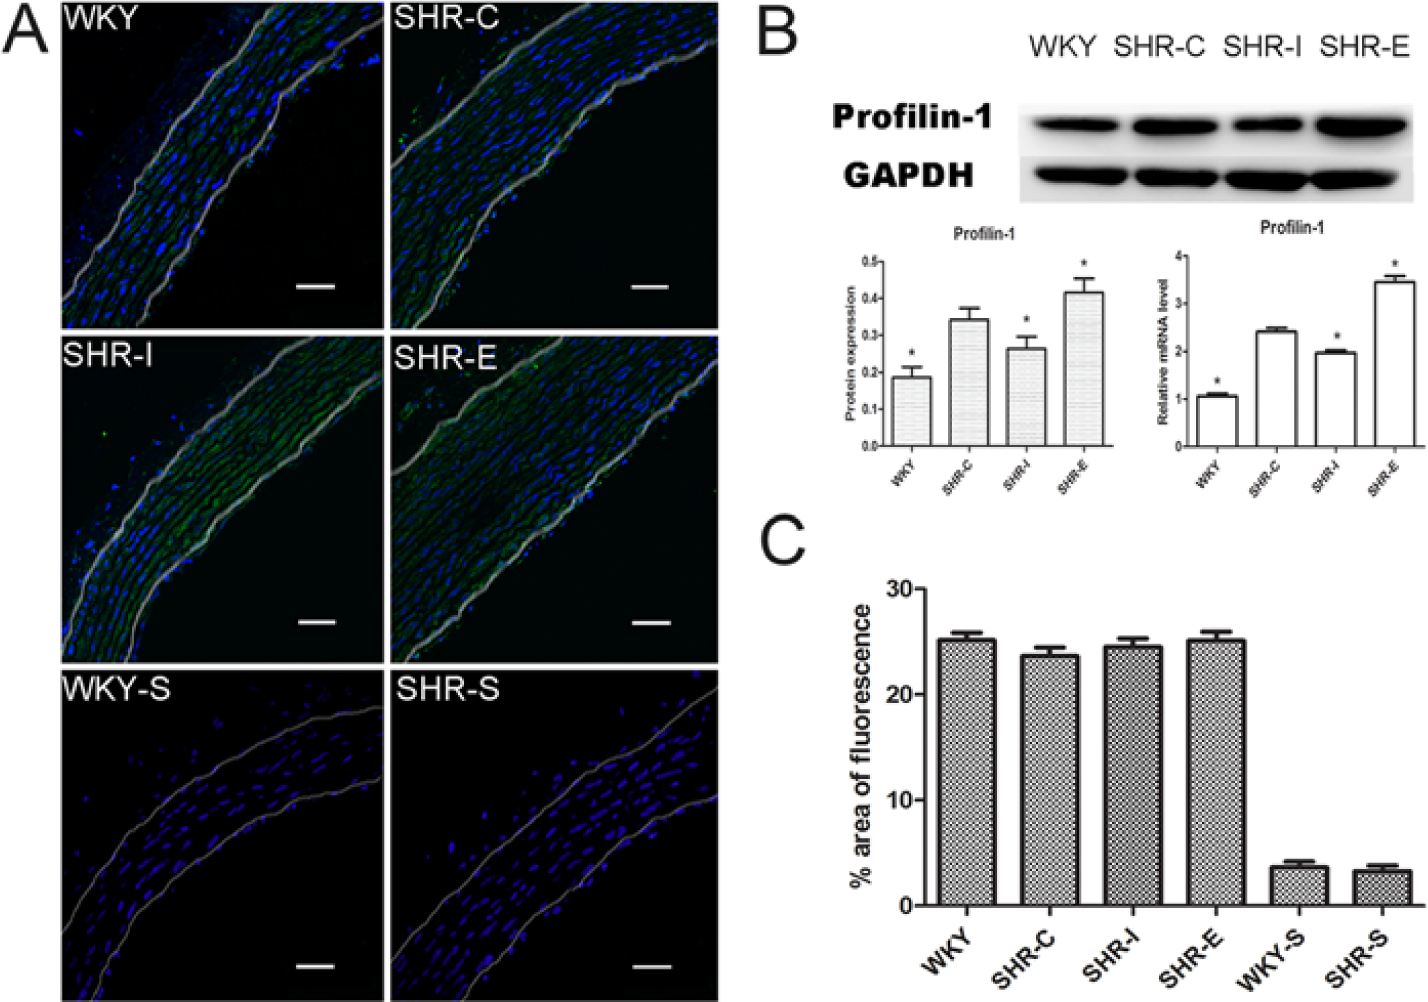
Effect of adenovirus injection on the expression of profilin-1 in aortic tissue. (A) The nuclei of the aortic cells after transfection were labeled with DAPI to monitor cell morphology. WKY-C: Wistar-Kyoto rats treated with negative control adenovirus; SHR-C: Spontaneous hypertensive rats (SHRs) treated with negative control adenovirus; SHR-I: SHRs treated with adenovirus vector to knock down profilin-1 expression; SHR-E: SHRs treated with adenovirus vector to overexpress profilin-1; WKY-S and SHR-S: WKYs and SHRs treated with saline. (B) Real-time PCR and western blot analyses to show profilin-1 expression in aortic tissue. GAPDH was used as a loading control. (C) Quantitative assessment of % area of fluorescence in the aforementioned conditions. Data are mean ± SEM, *p<0.05 vs. SHR-C. Bars, 50 μm.
Effect of Profilin-1 on Body Weight and SBP of SHRs
Body weight did not differ among the four groups during the 12 weeks of treatment (Fig. 3). SBP for the three SHR groups increased with age. SBP was higher for SHR-E than SHR-C, and SBP was slightly lower for SHR-I than SHE-C, with no significant difference between SHR-C and the other groups (p>0.05).
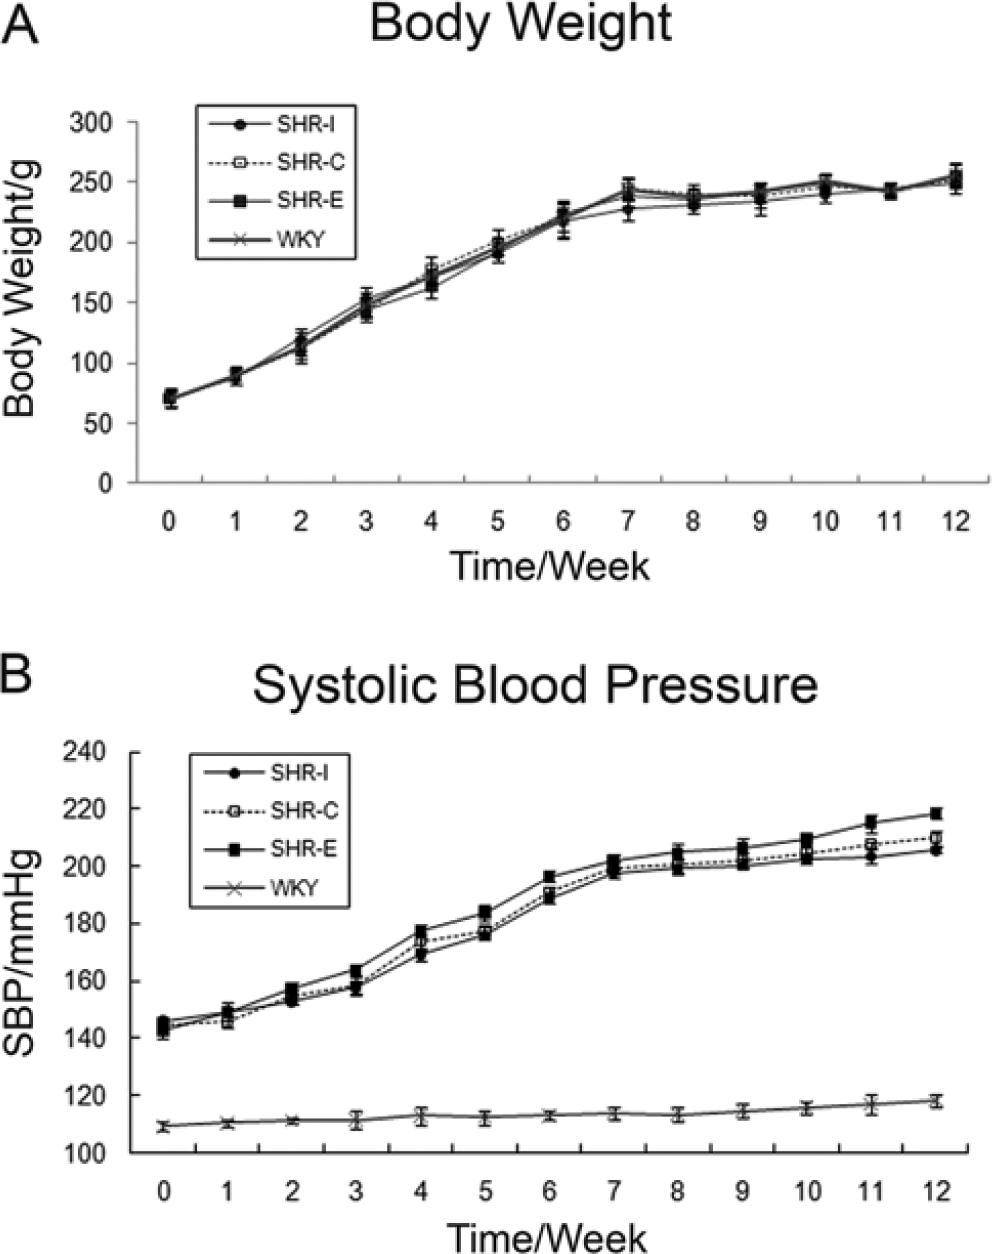
Effect of profilin-1 on body weight and systolic blood pressure (SBP). (A) Body weight (g) and (B) SBP (mmHg) were measured across the four rat groups at baseline and at weekly intervals. Data are mean ± SEM. WKY-C: Wistar-Kyoto rats treated with negative control adenovirus; SHR-C: Spontaneous hypertensive rats (SHRs) treated with negative control adenovirus; SHR-I: SHRs treated with adenovirus vector to knock down profilin-1 expression; SHR-E: SHRs treated with adenovirus vector to overexpress profilin-1.
Profilin-1 Promotes Vascular Hypertrophy, Fibrosis
As shown in Figure 2B, profilin-1 expression was higher in aortic tissues of SHRs than WKYs. This increased expression was accompanied by vascular remodeling in SHRs, as evidenced by a 36.8% increase in wall thickness, a 12% increase in wall-lumen ratio (the wall thickness:internal diameter) and increased vascular fibrosis (Figs. 4, 5). We further investigated the effects of profilin-1 on aortic remodeling. Compared with SHR-C, SHR-E showed significantly greater lumen size (internal circumference), wall thickness and wall-lumen ratio (wall thickness:internal diameter), accompanied by evidence of broken elastic membranes (Fig. 4).
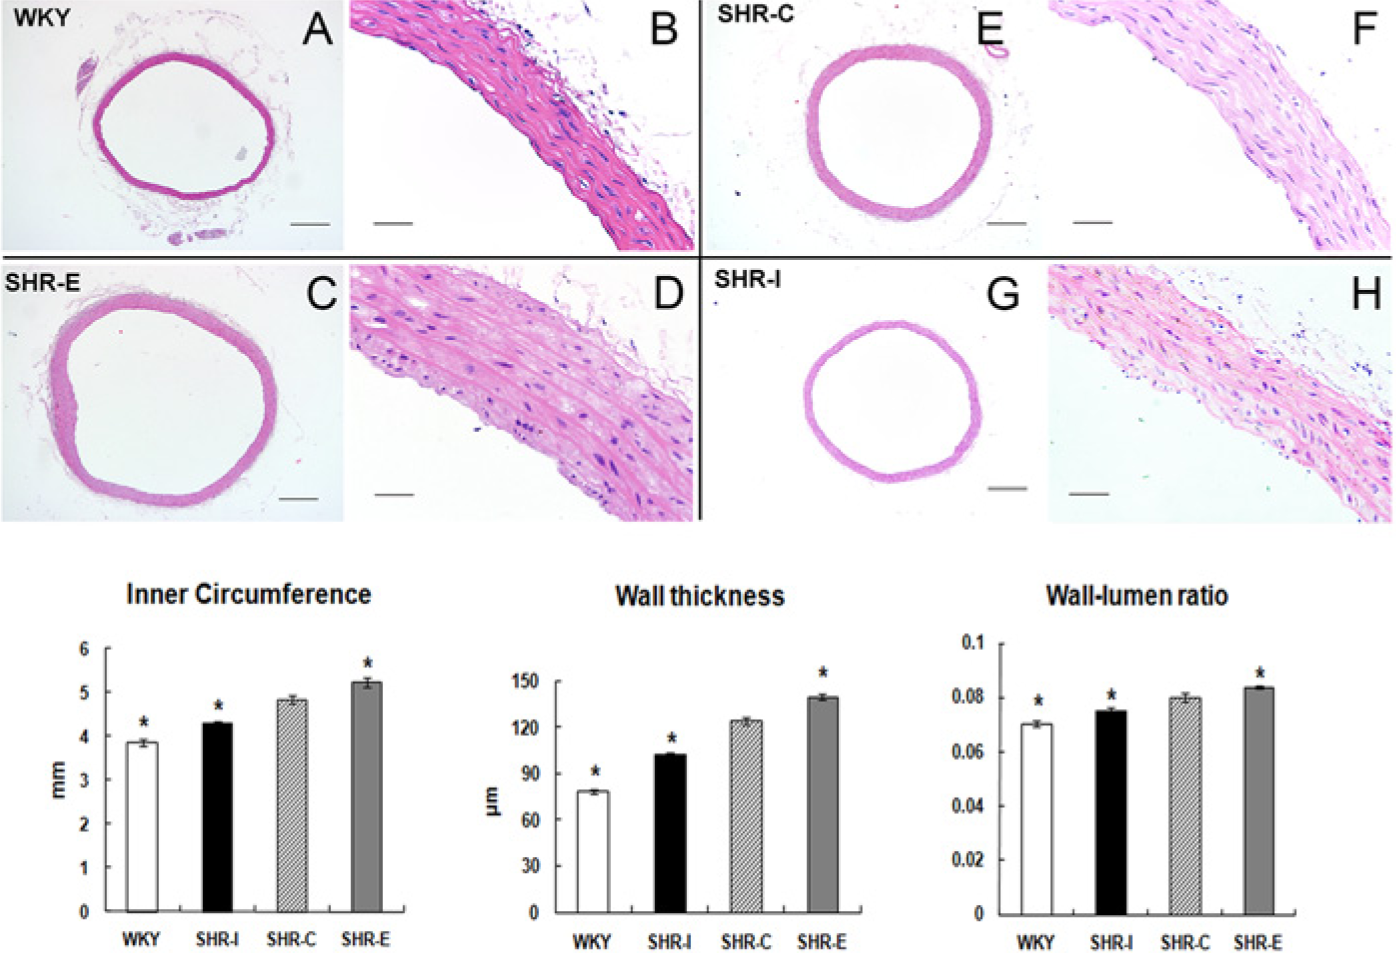
Aortic remodeling in spontaneous hypertensive rats (SHRs) and the effect of profilin-1. (A-H) Histological images of hematoxylin and eosin-stained transverse sections of thoracic aortas from the four groups. WKY-C: Wistar-Kyoto rats treated with negative control adenovirus; SHR-C: Spontaneous hypertensive rats (SHRs) treated with negative control adenovirus; SHR-I: SHRs treated with adenovirus vector to knock down profilin-1 expression; SHR-E: SHRs treated with adenovirus vector to overexpress profilin-1. Lower panel: Quantitative assessment of inner circumferences, wall thickness, and wall:lumen ratio. Data are mean ± SEM, n=10. *p<0.05 vs. SHR-C. Bars, 500 μm (A-D); 50 μm (E-H).
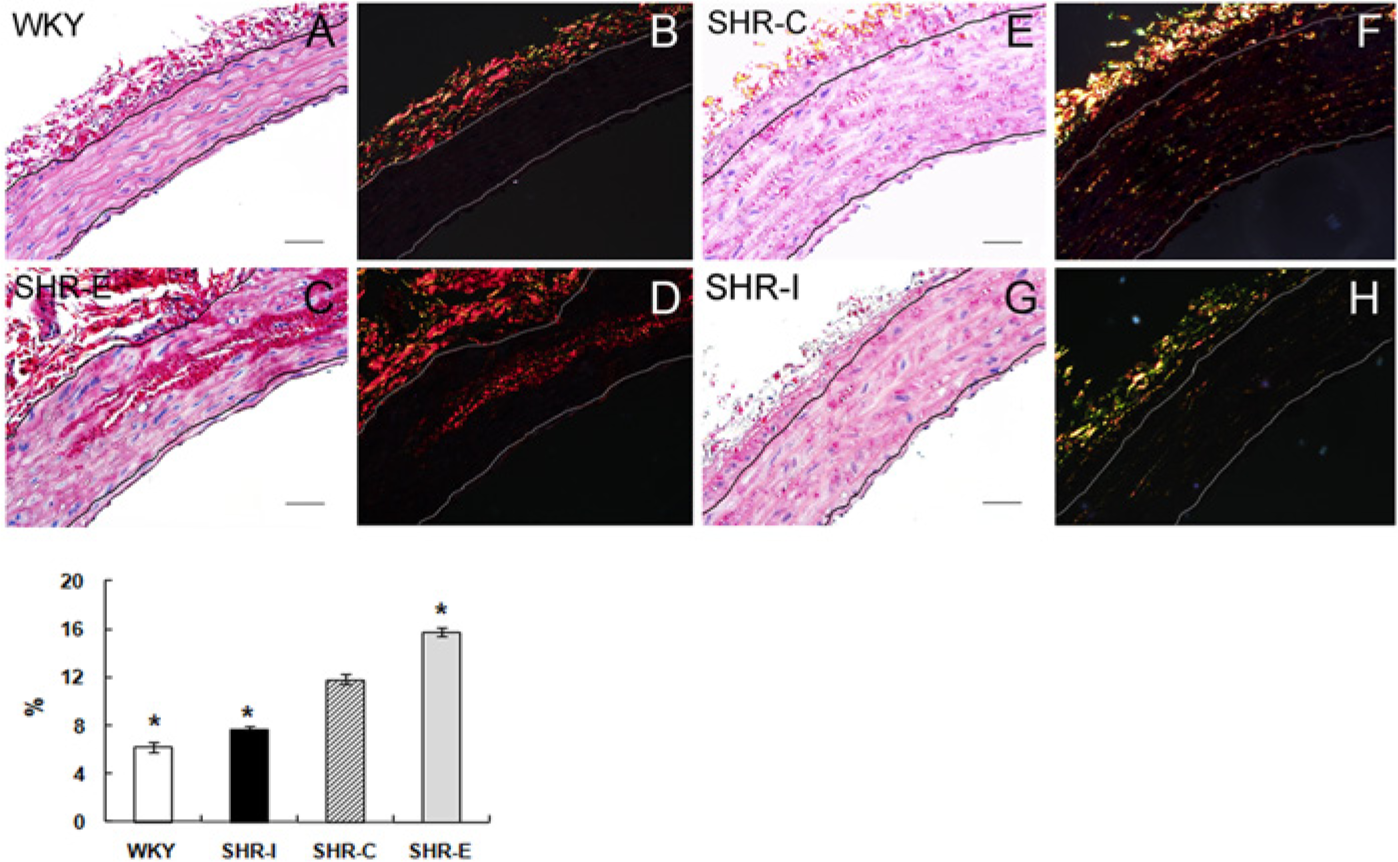
Effect of profilin-1 on aortic fibrosis. (A, C, E, G) Representative images of aortic tissues with hematoxylin and eosin staining. (B, D, F, H) Representative histological images of picrosirius-red-stained aortic tissues. Red and yellow fluorescence represent collagen I, whereas green fluorescence indicates collagen III.WKY-C: Wistar-Kyoto rats treated with negative control adenovirus; SHR-C: Spontaneous hypertensive rats (SHRs) treated with negative control adenovirus; SHR-I: SHRs treated with adenovirus vector to knock down profilin-1 expression; SHR-E: SHRs treated with adenovirus vector to overexpress profilin-1. Lower panel: Quantitative assessment of % area of fibrosis in the 4 groups shown in the lower panel. Data are mean ± SEM, n=10. *p<0.05 vs. SHR-C. Bars, 50 μm.
Aortic fibrosis was shown on histological pictures, where red and yellow fibers represent collagen I and green fibers show collagen III. Picrosirius red staining was observed by polarized light and measured by Image-Pro Plus to obtain the percentage of collagen per media area. Certain conditions, such as hypertension, atherosclerosis and intimal injury, stimulate vascular smooth muscle cells (VSMCs) to produce extra collagen in the vessel wall (Park et al. 1990; Wolinsky 1972). Previous studies revealed that arterial collagen content increased progressively when blood pressure rises (Fornieri et al. 1992; Safar et al. 2001, 2003). Our study supports this view by showing a 38% increase in total collagen content per media area of the aortic segment for SHRs over WKY rats. We found that profilin-1 can promote media fibration by increasing collagen deposition in the media, especially collagen type I, which was higher in SHR-E than in SHR-C tissues. Collagen content per media area was higher in SHR-E than in SHR-C tissues, indicating that profilin-1 promotes collagen deposition (Fig. 5).
Cell Type(s) Critical for Producing Profilin-1 during the Development of Vascular Hypertrophy
Immunohistochemical analysis in aortic tissues of SHRs and WKY rats showed that profilin-1 protein was expressed in the cytoplasm of vascular endothelial cells and vascular smooth muscle cells (Fig. 6), which agreed with our western blot findings.
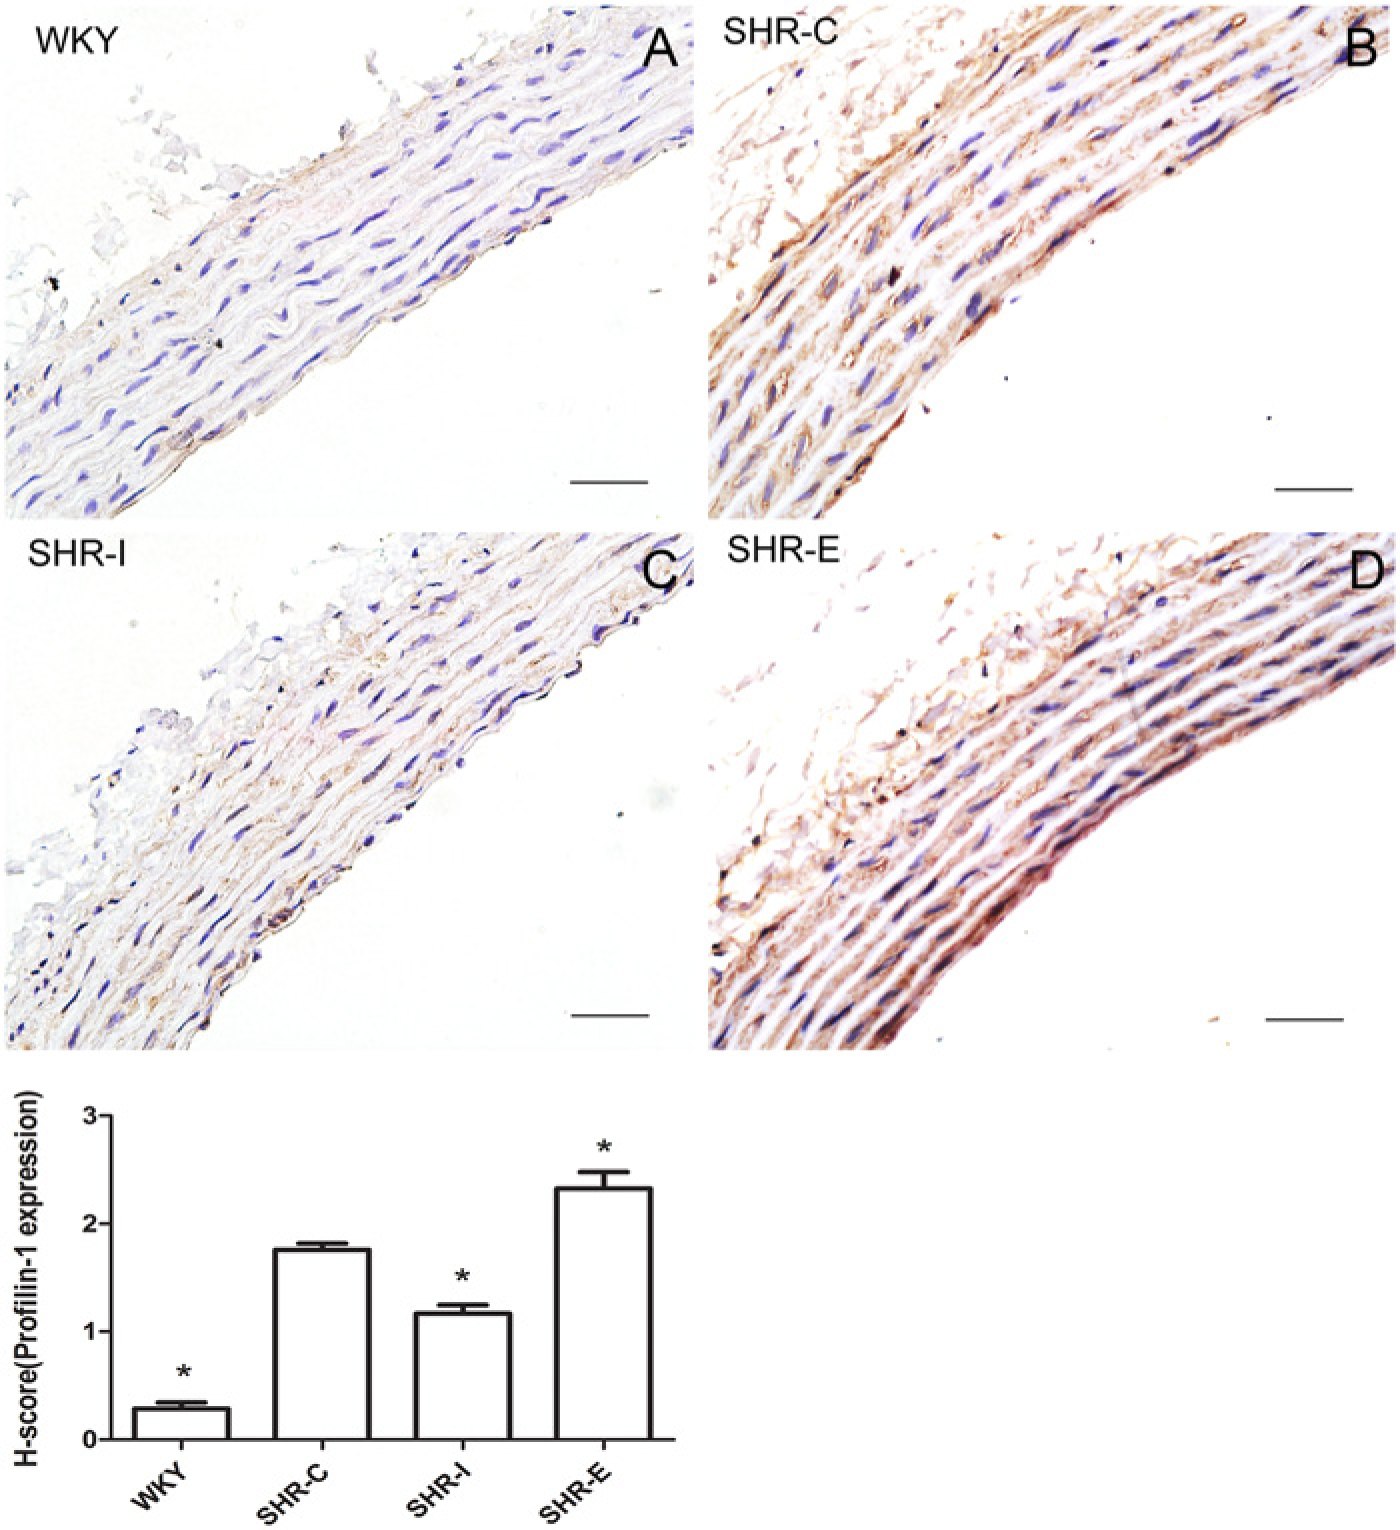
(A-D) Representative images of immunohistochemical staining for profilin-1 in the thoracic aorta among the four groups. Lower panel: Comparison of H-scores among the four treatment groups. WKY-C: Wistar-Kyoto rats treated with negative control adenovirus; SHR-C: Spontaneous hypertensive rats (SHRs) treated with negative control adenovirus; SHR-I: SHRs treated with adenovirus vector to knock down profilin-1 expression; SHR-E: SHRs treated with adenovirus vector to overexpress profilin-1. Data are mean ± SEM, n=10 rats. *p<0.05 vs. SHR-C. Bars, 50 μm.
Effect of Profilin-1 on Remodeling in SHR via the p38 iNOS and Peroxynitrite-dependent Mechanism
To investigate the molecular mechanism of profilin-1 on vascular remodeling, we examined the expression of p38, iNOS and peroxynitrite in rat thoracic aortas. Total p38 protein expression did not differ among the four treatment groups, but phosphorylation of p38 was higher in SHR-E than in SHR-C (Fig. 7). In contrast, phosphorylation of p38 was decreased by the knockdown of profilin-1. Thoracic aorta expression of iNOS showed a similar trend to that of p38 phosphorylation. Immunohistochemical analysis further confirmed the changes in iNOS expression, which was expressed in the cytoplasm of vascular endothelial cells and VSMCs (Fig. 8). Our results showed a significant increase in peroxynitrite expression (as determined by nitrotyrosine staining) in SHR-E tissues but a significant decrease in SHR-I tissues, as compared with SHR-C (p<0.05; Fig. 9). Next, we investigated the production of NO in aortic tissues and found a lower level of NO in SHR-E as compared with SHR-I (1.45 ± 0.15 vs. 2.34 ± 0.16 µmol/g protein nitrites, p<0.05) and as compared with SHR-C (1.88 ± 0.14 µmol/g protein nitrites; Fig. 10). We also tested the NO levels in the serum of rats and found no significant difference among the three SHR groups, indicating that changes in NO levels are a local phenomenon rather than a systemic reaction.
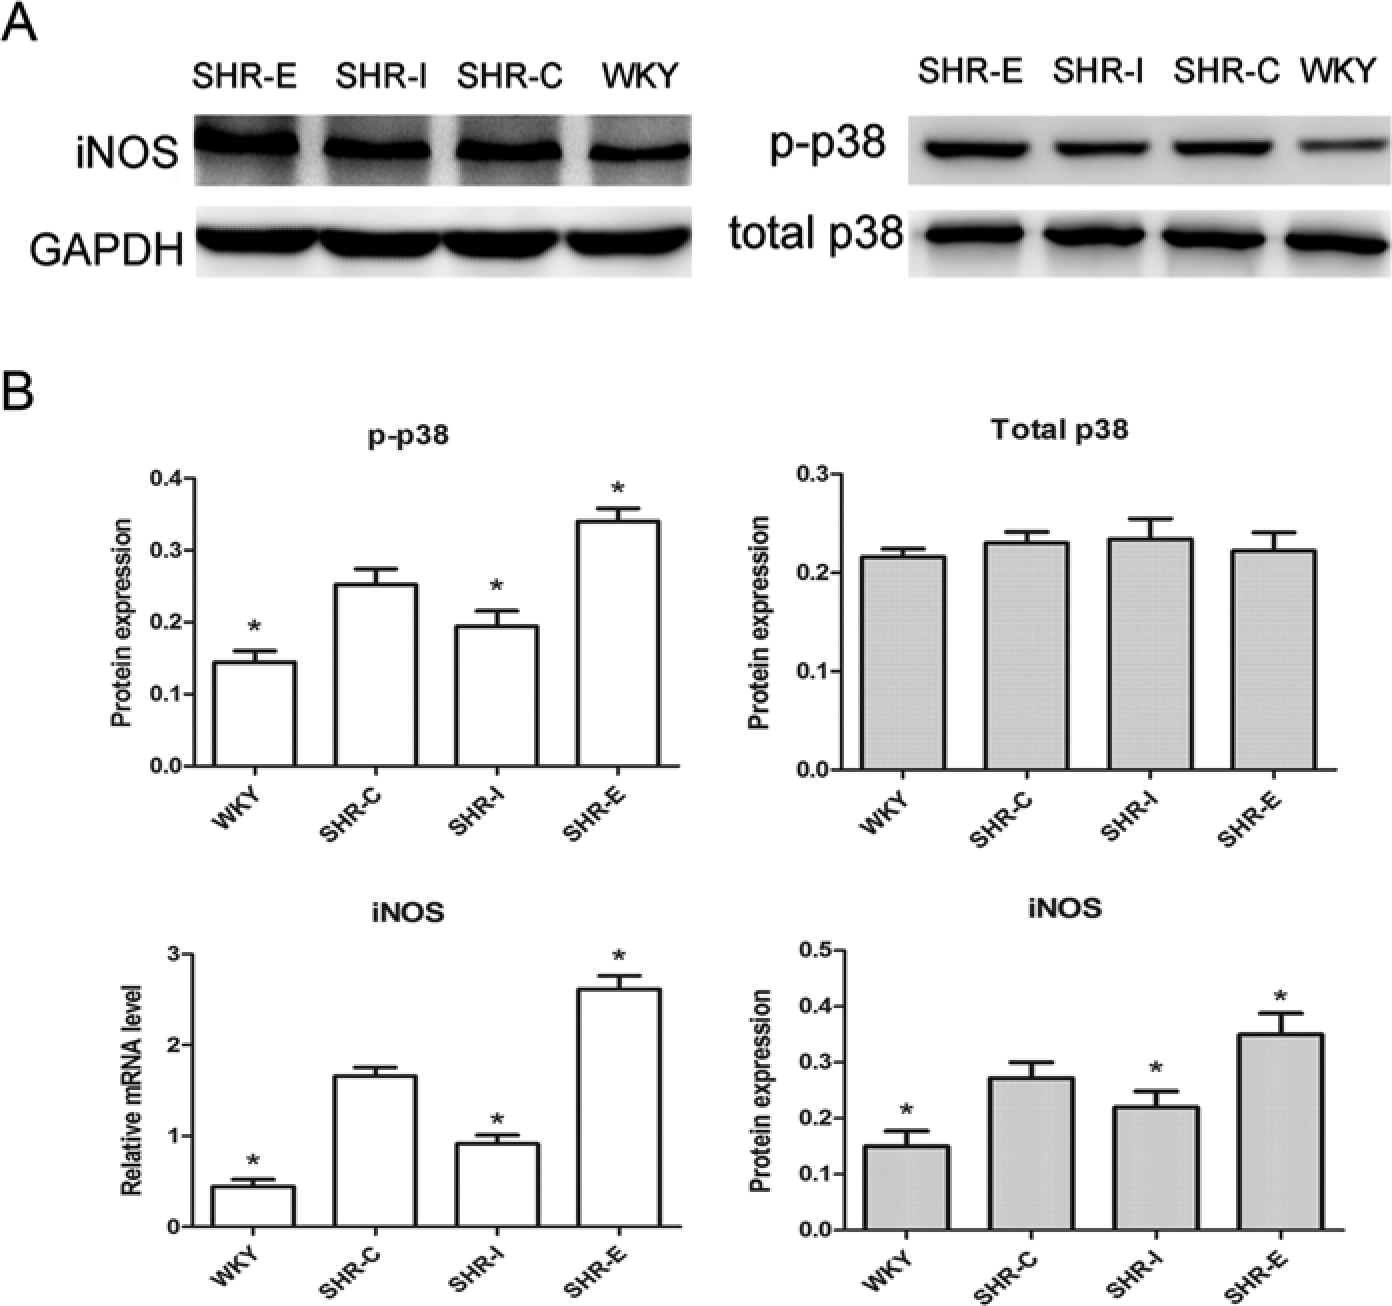
(A and B) Effect of profilin-1 on the expression of iNOS and p38 in aortic tissue. GAPDH was used as a loading control. WKY-C: Wistar-Kyoto rats treated with negative control adenovirus; SHR-C: Spontaneous hypertensive rats (SHRs) treated with negative control adenovirus; SHR-I: SHRs treated with adenovirus vector to knock down profilin-1 expression; SHR-E: SHRs treated with adenovirus vector to overexpress profilin-1. Data are mean ± SEM, *p<0.05 vs. the SHR-C. t-p38, total p38; p-p38, phosphorylation of p38.
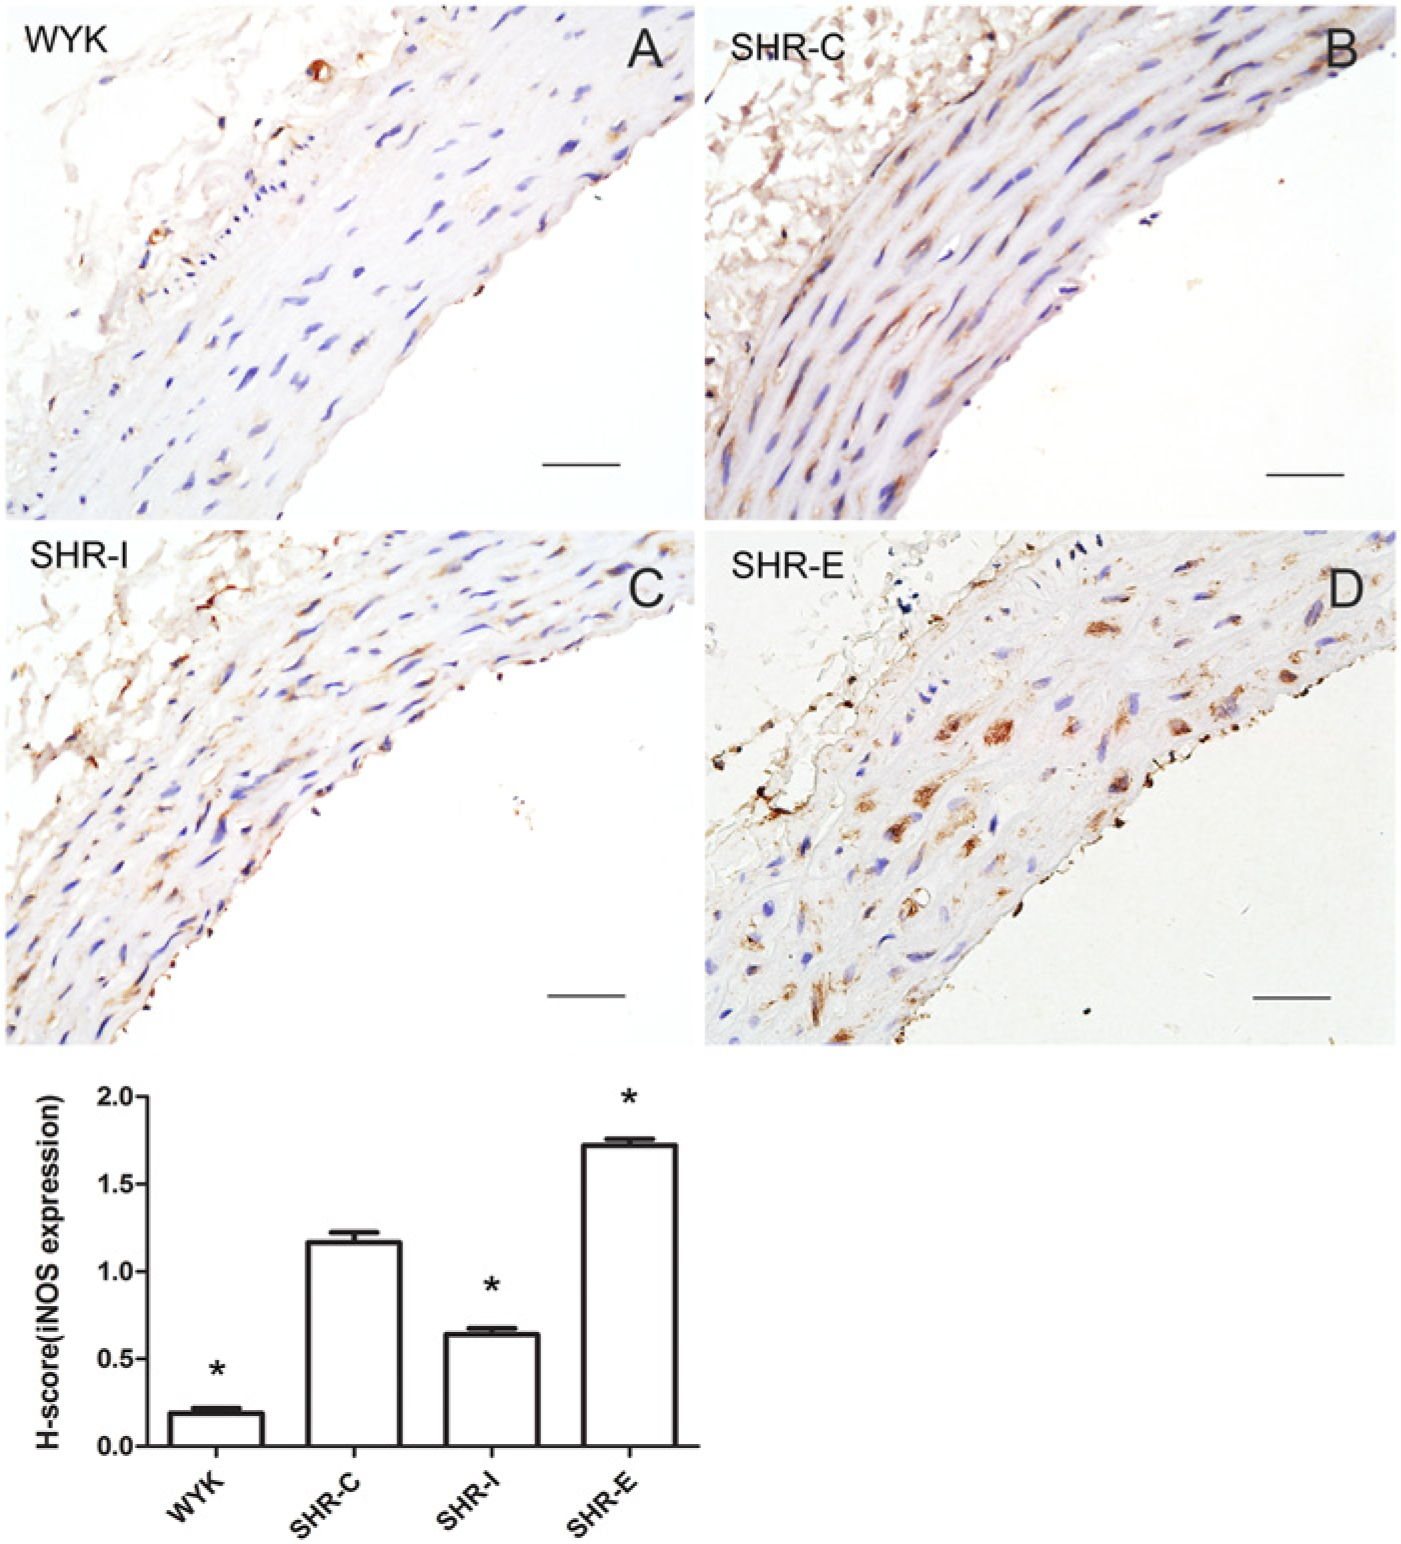
Representative images of immunohistochemical staining for inducible nitric oxide synthase (iNOS) in the thoracic aorta (A-D) and a comparison of H-scores (lower panel) among the four groups. WKY-C: Wistar-Kyoto rats treated with negative control adenovirus; SHR-C: Spontaneous hypertensive rats (SHRs) treated with negative control adenovirus; SHR-I: SHRs treated with adenovirus vector to knock down profilin-1 expression; SHR-E: SHRs treated with adenovirus vector to overexpress profilin-1. Data are mean ± SEM, n=10 rats. *p<0.05 vs. SHR-C. Bars, 50 μm.
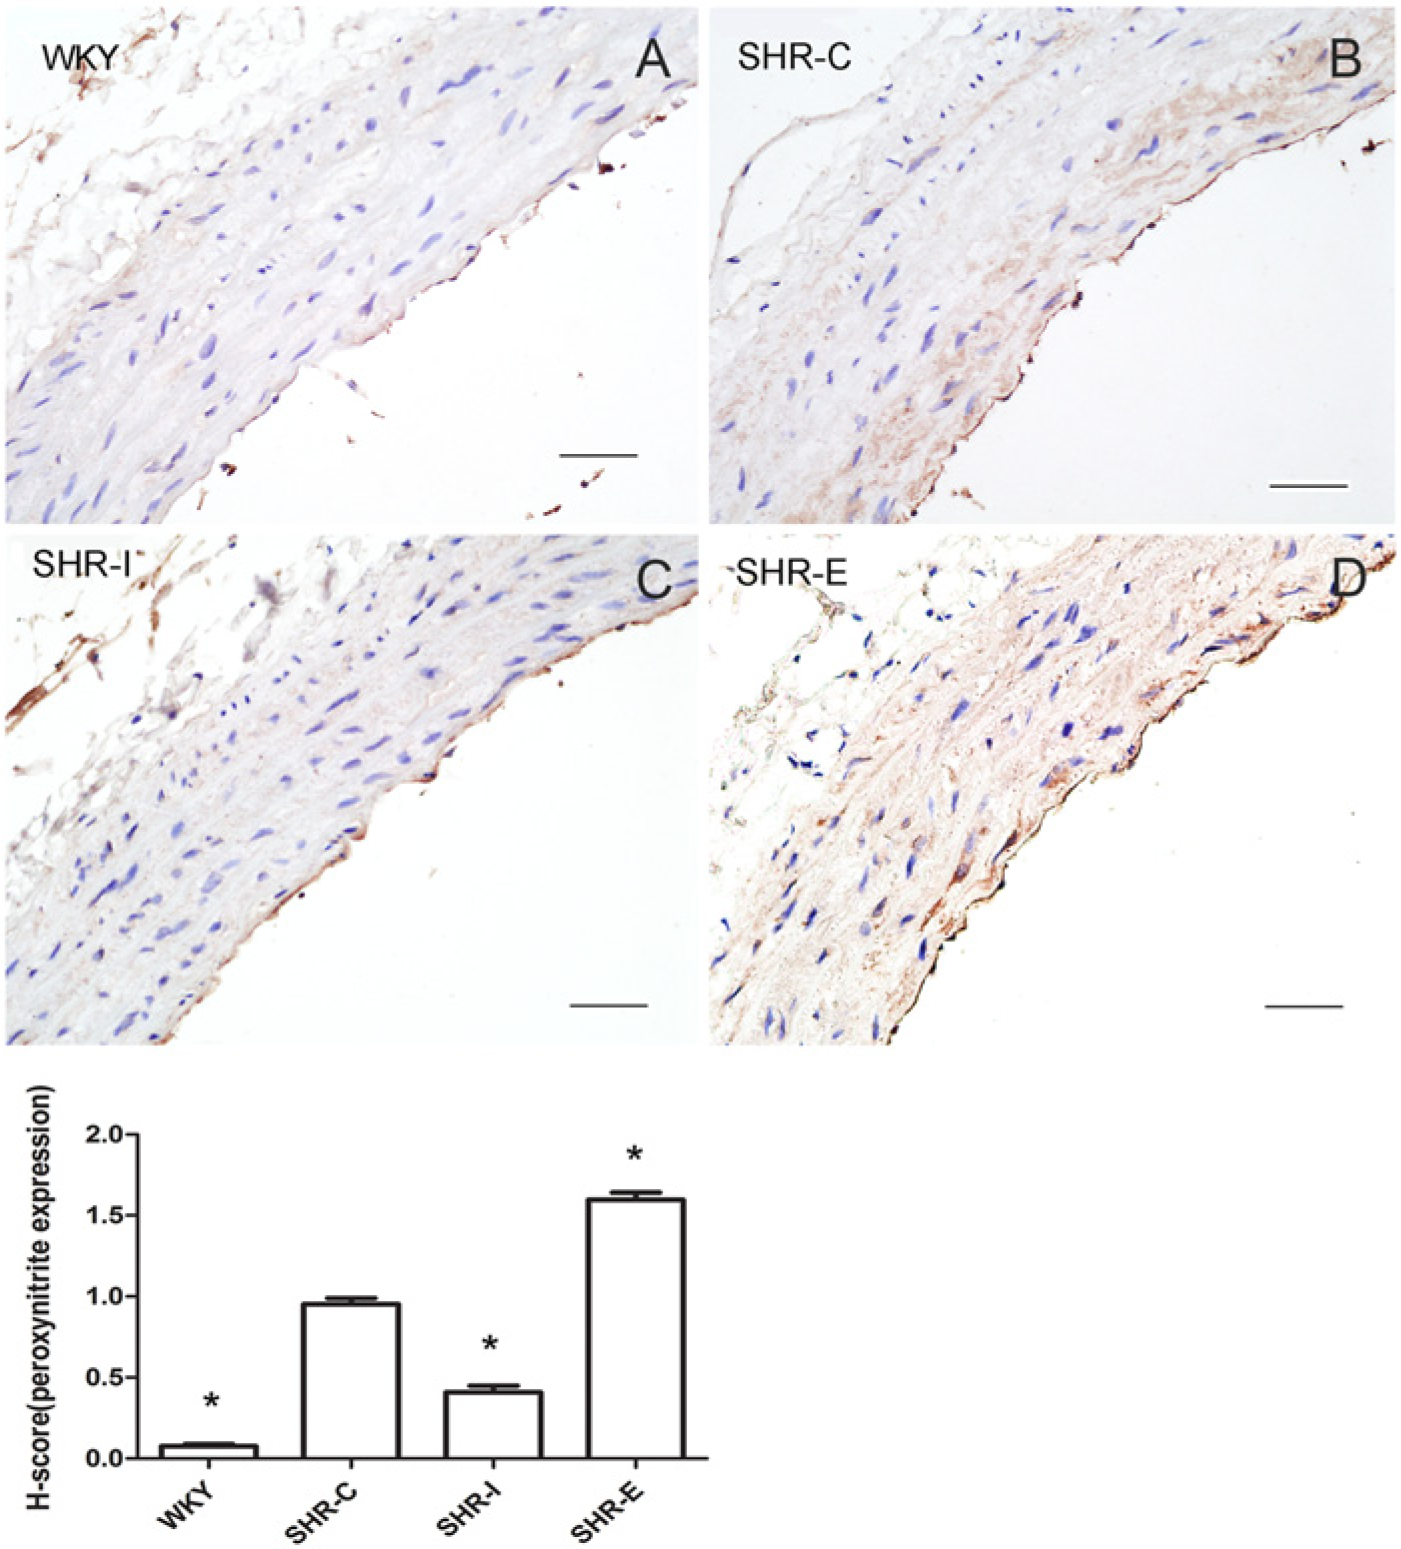
Representative images of immunohistochemical staining for peroxynitrite in the thoracic aorta (A-D) and a comparison of H-scores (lower panel) among the four groups. WKY-C: Wistar-Kyoto rats treated with negative control adenovirus; SHR-C: Spontaneous hypertensive rats (SHRs) treated with negative control adenovirus; SHR-I: SHRs treated with adenovirus vector to knock down profilin-1 expression; SHR-E: SHRs treated with adenovirus vector to overexpress profilin-1. Data are mean ± SEM, n=10 rats. *p<0.05 vs. SHR-C. Bars, 50 μm.
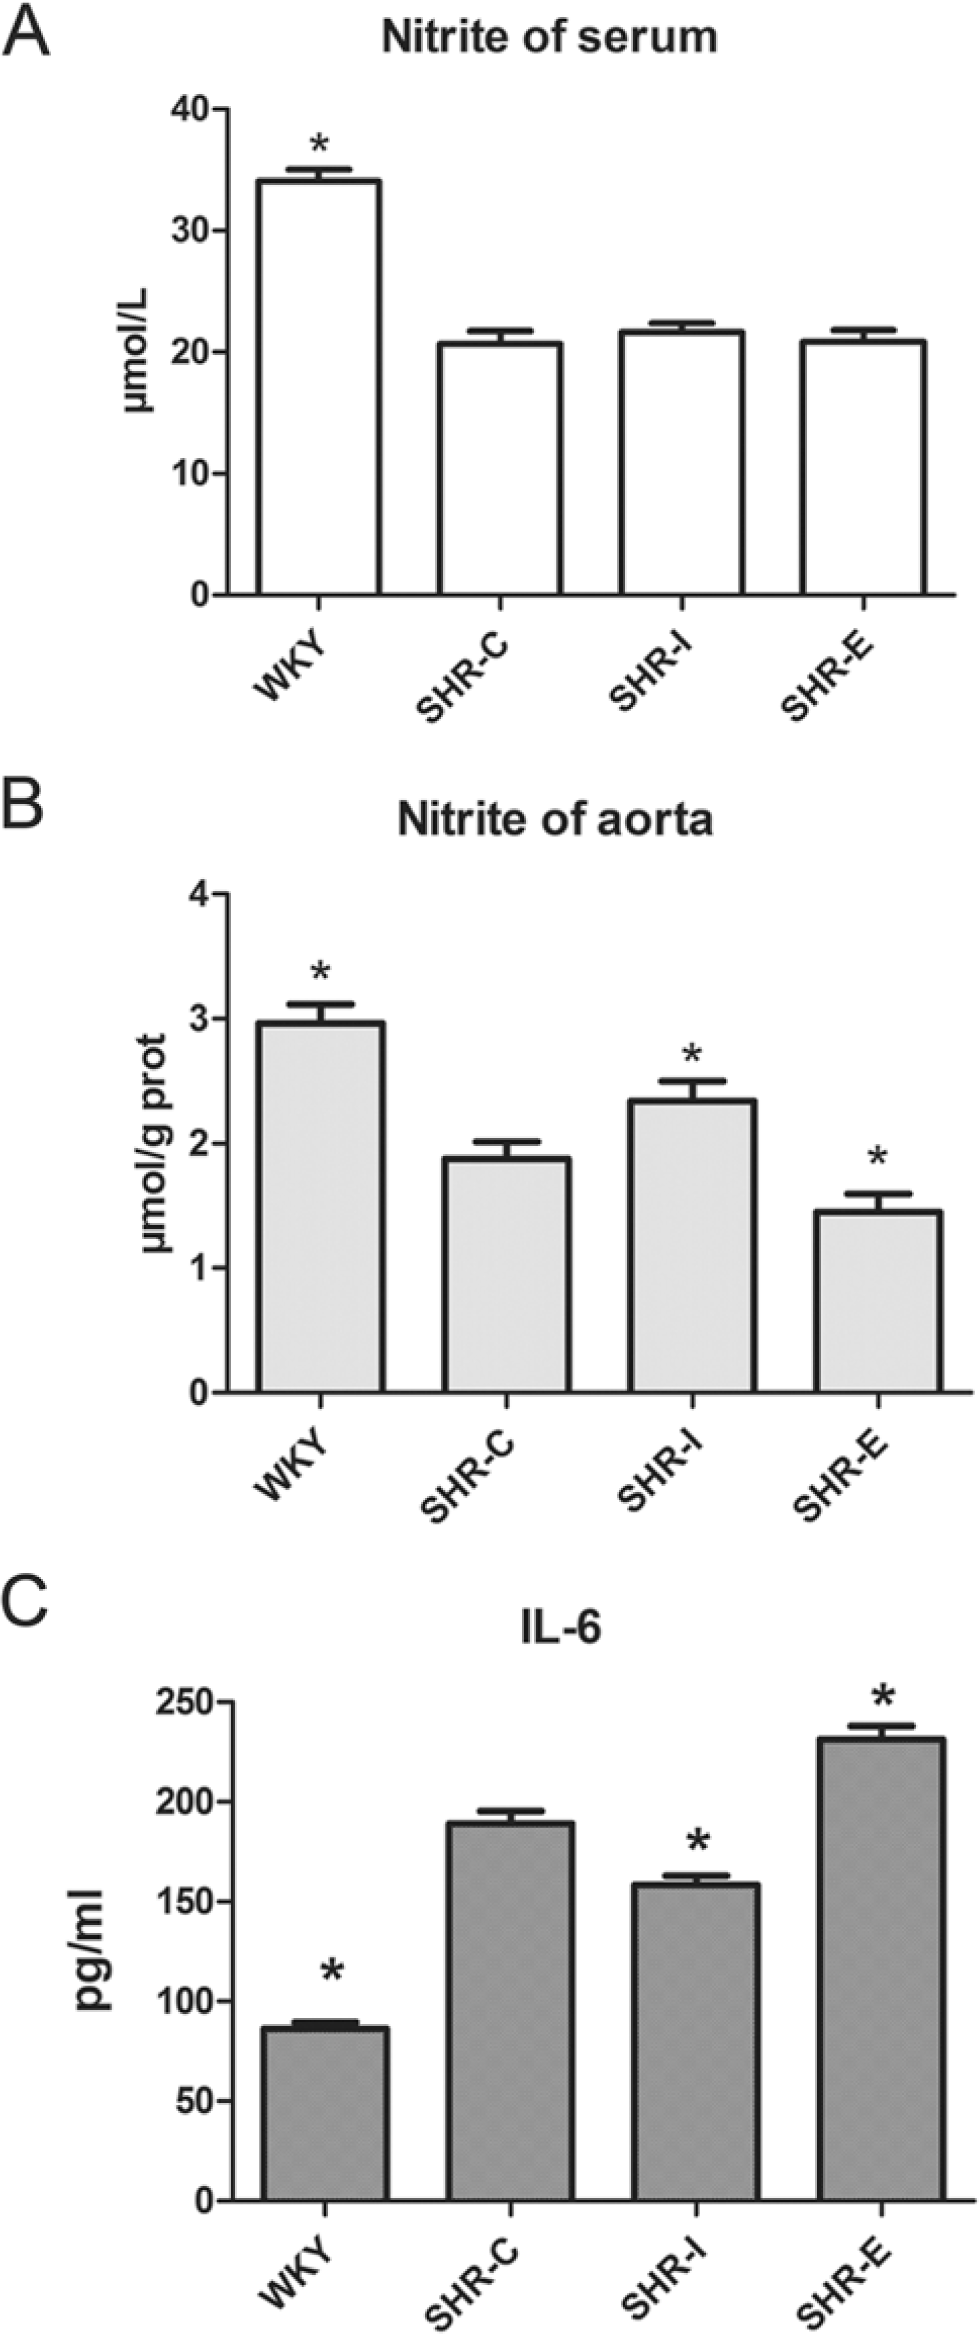
Effect of profilin-1 on NO production in (A) serum, (B) aortic tissue and (C) interleukin 6 (IL-6) serum levels. WKY-C: Wistar-Kyoto rats treated with negative control adenovirus; SHR-C: Spontaneous hypertensive rats (SHRs) treated with negative control adenovirus; SHR-I: SHRs treated with adenovirus vector to knock down profilin-1 expression; SHR-E: SHRs treated with adenovirus vector to overexpress profilin-1. Data are mean ± SEM, n=8. *p<0.05 vs. SHR-C.
Inflammatory markers, such as IL-6, have been long associated with an increased risk of cardiovascular diseases. IL-6 level was significantly higher in SHR-E (231.4 ± 6.548 μmol/L) as compared with SHR-I (158.5 ± 4.26 μmol/L) and SHR-C (189.0 ± 6.27 μmol/L) (Fig. 10). These results suggest that profilin-1 overexpression is involved in inflammatory reactions.
3.6. Effect of profilin-1 on 3-week-treatment SHRs
To support the conclusion that changes in iNOS and p38 precede morphological changes, data from 3-week-treatment SHRs were provided. At 3 weeks after the administration of the adenovirus, we found that the lumen size (internal circumference), wall thickness and wall to lumen ratio (wall thickness:internal diameter) did not differ among the three SHRs groups (Fig. 11A). Protein level of iNOS and phosphorylation of p38 were higher in SHR-E than in SHR-C tissues, but were decreased by the knockdown of profilin-1 (Fig. 11B, 11D, 11E). We also found an increase in peroxynitrite expression (as determined by nitrotyrosine staining) in SHR-E (0.530 ± 0.028) and a decrease in SHR-I (0.072 ± 0.016), as compared with SHR-C (0.312 ± 0.017, p<0.05) (Fig. 11C, 11D).
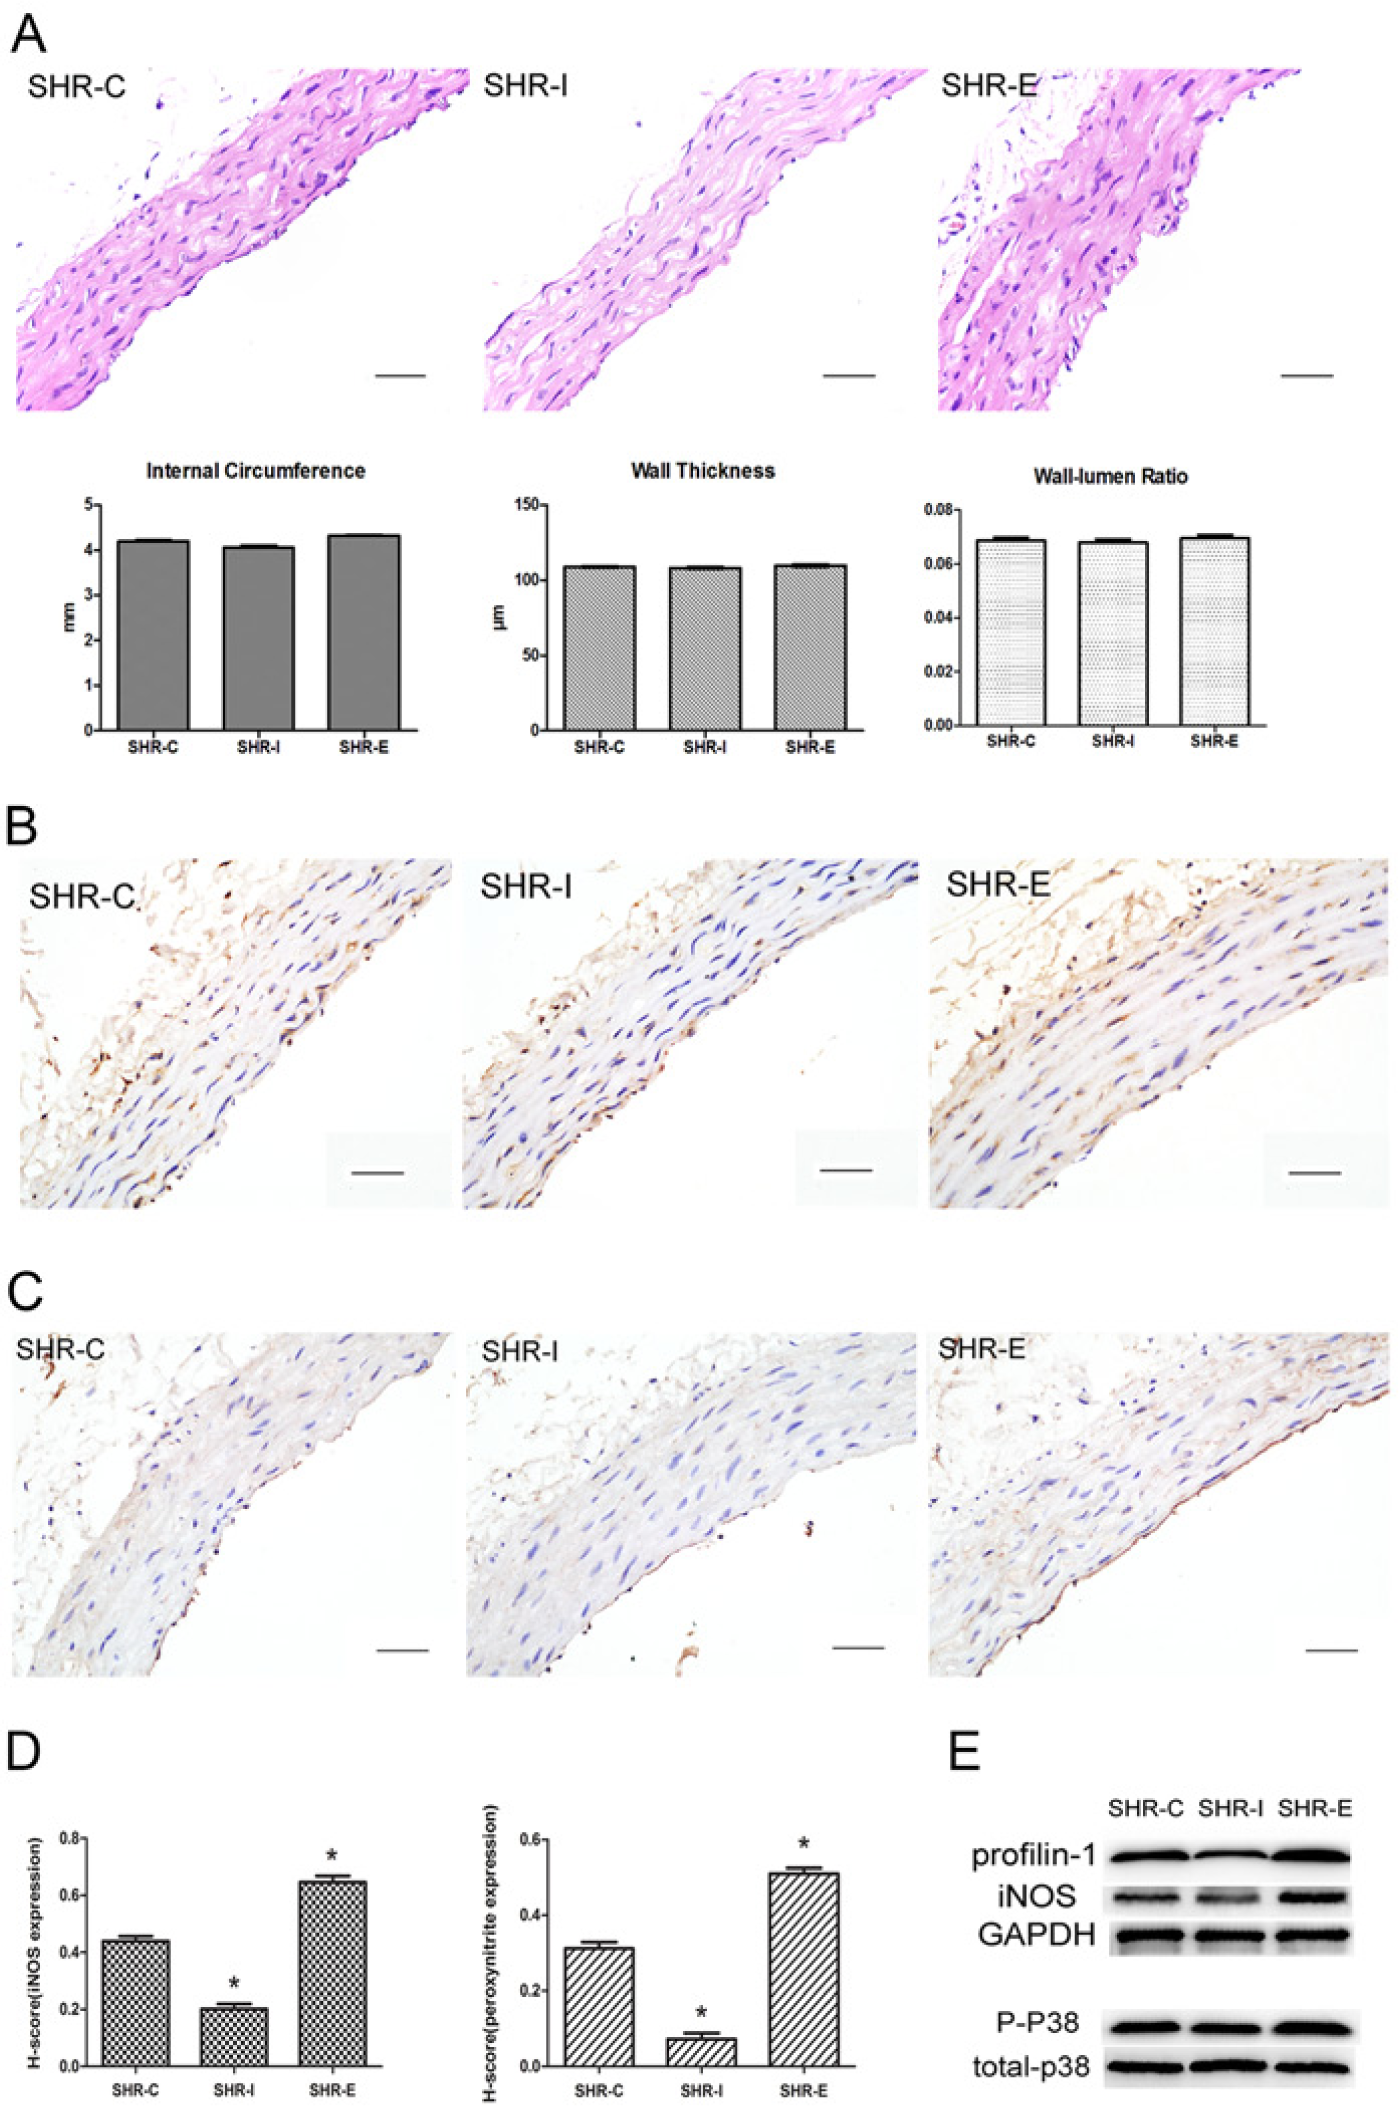
Effect of profilin-1 on 3-week treatment in spontaneous hypertensive rats (SHRs). (A) Histological images of hematoxylin and eosin-stained transverse sections of thoracic aortas from three treatment groups. SHR-C: SHRs treated with negative control adenovirus; SHR-I: SHRs treated with adenovirus vector to knock down profilin-1 expression; SHR-E: SHRs treated with adenovirus vector to overexpress profilin-1. Lower panel: Quantitative assessment of inner circumference, wall thickness, and wall:lumen ratio. Data are mean ± SEM, n=5. (B-C) Representative images of immunohistochemical staining for (B) inducible nitric oxide synthase (iNOS) and (C) peroxynitrite in the thoracic aorta of 3-week-treated SHRs. (D) Comparison of H-scores among the three groups for the immunohistochemical staining for iNOS (left) and peroxynitrite (right). Data are mean ± SEM, n=5 rats. * p<0.05 vs. SHR-C. (E) Effect of profilin-1 on the protein expression of iNOS and p38 in aortic tissue. GAPDH was used as a loading control. Bars, 50 μm (A-C).
Discussion
Hypertension changes the dimensions and properties of the arterial wall. These changes include proliferation of VSMCs and thickening of the arterial wall (Hayashi and Naiki 2009). Our study demonstrated that profilin-1 has important effects on hypertension-induced vascular remodeling by promoting phosphorylation of p38, vascular inflammation and oxidative stress.
Inflammation, even at a low level, might play a critical role in hypertension (Pauletto and Rattazzi 2006; Pietri et al. 2006), and inflammation and increased oxidative stress play a role in vascular remodeling in hypertension (Shekhonin et al. 1985). Romeo et al. (2007) provided the first in vivo evidence for the prominent role of profilin-1 in cardiovascular disease and linked the dynamic organization of the actin cytoskeleton directly to vascular inflammation. Several studies have linked profilin-1 to versatile inflammatory signaling pathways, including p38 MAPK, phospho-JNK and Rho-associated protein kinase II (ROCKII) pathways (Moustafa-Bayoumi et al. 2007; Romeo et al. 2007; Zhong et al. 2011). Profilin-1 may contribute to hypertension-induced vascular remodeling through its pro-inflammatory effect. In this study, the overexpression of profilin-1 caused a significant increase in vascular wall thickness, a severe inflammatory infiltration under the intima and a substantial increase of IL-6 levels. We focused on changes in IL-6, a member of the proinflammatory cytokine family. High blood pressure was previously shown to be associated with increased IL-6 levels in SHRs compared with WKY rats, which suggests that SHRs present a vascular inflammatory process (Zen et al. 2005). Our study also showed a positive association between profilin-1 and IL-6, which links profilin-1 to an inflammatory progress and explains hypertension-induced vascular remodeling in a new way.
P38 MAPK is typically activated by inflammatory stimuli and cellular stresses (Enslen et al. 1998; Sugden and Fuller 1991). It is also associated with cardiovascular diseases (Clerk et al. 1998; Han et al. 1997; Wang et al. 1998). Romeo et al. (2007) set the stage for a prominent role of p38 MAPK in modulating profilin-1-driven inflammatory process. Activation of p38 and its downstream target ATF-2 was reduced in profilin-1 heterozygote mice (Pfn+/-), although no further in vivo evidence for such a relationship between p38 MAPK and profilin-1 was supplied. Still, the potential links between them seem at hand. Stress fibers have been shown to alter the localization of important inflammatory members of the MAPK signaling network, including p38 and JNK (Yang et al. 2007). In this study, SHRs with profilin-1 overexpression showed an elevation in p38 phosphorylation even in 3-week-treated SHRs, whose aortas did not show any evidence of remodeling; this provides direct evidence for the critical role of p38 MAPK in profilin-1-associated inflammatory process.
How does profilin-1 improve vascular remodeling by inducing p38 phosphorylation? We investigated iNOS to answer this question. iNOS is a downstream target of p38 (Bhat et al. 2002). iNOS is important in the production of peroxynitrite in cardiovascular diseases (Buttery et al. 1996; Mungrue et al. 2002), and increased inflammation and peroxynitrite production in ACE2 knockout mice has been shown to be accompanied by an upregulation in profilin-1 (Jin et al. 2012). Working on iNOS-associated peroxynitrite activation in profilin-1 overexpression and knockdown SHRs is thus of great significance.
Hypertension is associated with increased activity and/or expression of iNOS (Chou et al. 1998; Vaziri et al. 1998; Wu et al. 1996). Hong et al. (2000) demonstrated that the iNOS inhibitor aminoguanidine decreased blood pressure in SHRs. Immunohistochemistry further showed that iNOS was increased in the vascular smooth muscle of the hypoxic lung and contributed to the development of hypoxic vascular remodeling (Xue and Johns 1996). iNOS was also implicated as a regulator of vascular remodeling via the production of large amounts of NO. However, in our study, NO production in SHR-Es was not increased concomitant with the elevation in iNOS. To explain this discrepancy, we detected peroxynitrite (as detected by nitrotyrosine staining), a short-lived and reactive oxidant produced from the reaction of nitric oxide with superoxide anion (Beckman et al. 1990). As reported, the parallel time course for the generation of superoxide anion and iNOS indicates an efficient simultaneous reaction: NO+O2→ONOO−(peroxynitrite) (Herce-Pagliai et al. 1998). This situation could directly damage vascular endothelium, impair NO production, and decrease normal endothelial-mediated vasorelaxation. As a result, the involvement of iNOS leads to an increased generation of ONOO−, then decreased NO bioavailability. Peroxynitrite also contributes to iNOS-associated vascular remodeling. Peroxynitrite has been linked to vascular remodeling through its activation of MAPKs (JNK, ERK1/2) (Bapat et al. 2001; Zhang et al. 2000). The production of ONOO− can activate matrix metalloproteinases by nitrating tyrosine residues (Radomski et al. 1998) and contributing to collagen deposition (Steed et al. 2010). Our data are consistent with the reports mentioned above, showing that, in SHR-E, the elevation of peroxynitrite was positively related to increased iNOS (Figs. 8, 9), and that changes in iNOS and peroxynitrite occurred before changes in wall remodeling (Fig. 11). Sirius red staining showed much more fibrillar collagen in arteries of SHR-E than SHR-C (Fig. 5). Moreover, the knockdown of profilin-1 reversed the aforementioned changes. We conclude that the pro-hypertrophic effects of profilin-1 are mediated, at least in part, by suppression of the p38–iNOS– peroxynitrite pathway.
In conclusion, our study showed that profilin-1 is a potent effector mediating hypertension-induced vascular remodeling, having a close relationship with p38 activation. Meanwhile, inhibition of profilin-1 can prevent the remodeling process in vascular tissues. Therefore, profilin-1 may represent an important therapeutic target to treat or prevent hypertension-induced vascular remodeling.
Footnotes
Declaration of Conflicting Interests
The author(s) declared no potential conflicts of interest with respect to the research, authorship, and/or publication of this article.
Funding
The author(s) disclosed receipt of the following financial support for the research, authorship, and/or publication of this article: This study was supported by grants from the National Nature Science Foundation of China (30700884), Shandong Science and Technology Research Plan (2010GGC10294), Shandong Science and Technology Project Plan (2012GB021817) and Shandong Outstanding Young and Middle-aged Scientists Research Award Fund (BS2009SW015) to Dr. Jie Qiu; and National Science and Technology Major Project: Technology Platform Construction for Clinical Evaluation of Cardiovascular New Drug (2012ZX09303016-003) to Dr. Haiqing Gao.