
Abstract
Human hepatocellular carcinoma (HCC) is the fifth most common cancer in the world. Currently, surgical resection is the only effective treatment for HCC if the tumor is resectable. Small molecule, biologics and siRNA anti-cancer drugs have been explored for the treatment of HCC. Selective targeting to tumor tissue rather than normal liver in HCC patients is still a challenge. Galactosamine-mediated targeting delivery of anti-cancer drugs in the liver has been tested because its receptor, asialoglycoprotein receptor 1 (ASGPR1), is expressed in the liver and not in other human tissues. We examined ASGPR1 expression levels by immunohistochemistry in HCC with different grades. Guidance for a targeting delivery strategy for anti-cancer drugs to HCC is suggested in this report.
Keywords
Introduction
The American Cancer Society estimates that a total of 1,660,290 new cancer cases and 580,350 cancer deaths are projected to occur in the United States in 2013(Siegel et al. 2013). One in four deaths in the United States is due to cancer. Worldwide, an estimated 7.6 million deaths from cancer occurred in 2008. Human hepatocellular carcinoma (HCC) is the fifth most common cancer in the world, with about 500,000 deaths annually (Packer 2004). Hepatitis B, Hepatitis C and aflatoxin B1 are the three agents responsible for approximately 80% of the human HCCs. Genetically, the molecular features of HCCs have been studied and a variety of genes are related to HCCs. These genes include Myc, E2f1(E2F transcription factor 1), HBV DNA, R249S TP53 (tumor suppressor protein 53) mutation, KRAS (a GTPase) mutations, HNF1a (hepatocyte nuclear factor 1a), APC (adenomatosis polyposis coli) germline mutations, WNT/b-catenin pathway mutations, AXIN (axis inhibition protein) mutations, inactivation of IGF2R (insulin-like growth factor 2), RB1 (retinoblastoma 1), and P16, FOXM1(Forkhead box M1), EZH2 (Enhancer of zeste homolog 2), c-Met (the same as HGFR, hepatocyte growth factor receptor), PLK1 (polo-like kinase 1) and microRNA-122 (Lee et al. 2004; Laurent-Puig and Zucman-Rossi 2006; Sun et al. 2011; Au et al. 2012; Ivanovska et al. 2011; Mok et al. 2012; and Burchard et al. 2010 ). Currently, surgical resection is the major treatment option for HCC if the tumor is resectable. Sorafenib (Nexavar®), a small molecular inhibitor of several tyrosine protein kinases, is approved for treatment of advanced HCC, but yields limited efficacy (Keating and Santoro 2009). Small molecule, biologics and siRNA anti-cancer drugs have also been explored for treatment of HCC (Huang et al. 2013; Skelton and O’Neil 2008; Hwang 2006; Xu et al. 2011).
Galactose-mediated delivery of anti-cancer drugs in the liver has been proposed because its receptor, asialoglycoprotein receptor (ASGPR), is expressed in the liver and not in other human tissues (Varshosaz et al. 2012; Mok et al. 2004; Terada et al. 2006). ASGPR was first identified by Morell and Ashwell (1974). ASGPR is a 40-50 kD noncovalent hetero-oligomer composed of two homologous polypeptides called HL-1 (Hepatic Lectin, or ASGPR1, ASGR1) and HL-2 (ASGPR2, ASGR2) in a 2-5:1 stoichiometry with HL-1 as the major subunit. The hepatic ASGPR1 is a transmembrane molecule specifically expressed on the sinusoidal and basolateral hepatocellular membranes, but not on the bile canalicular (also called apical) membrane. It plays a role in the clearance of desialylated proteins from the serum through endocytosis and lysosomal degradation. Mammalian hepatic ASGPRs mediate the binding, internalization, and degradation of extracellular glycoproteins with exposed terminal galactose, lactose or N-acetyl-galactosamine residues (Wall and Hubbard 1981; Matsuura et al. 1982; Geuze et al. 1982, 1983; Spiess 1990). Natural ligands of ASGPR consist of multiple galactoses (Gal) and/or galactosamines (GalNAc), including asialoorosomucoid (ASOR, high affinity ligand of ASGPR with Ki = 1.7 nM; 20 Gal), asialofetuin (17 nM; 12 Gal, 3 GalNAc), asialoceruloplasmin (86 nM; 12 Gal) and asialotransferrin (3300 nM; 5 Gal). HL-2 deletion in mice is aphenotypic (Ishibashi et al. 1994). Homozygous HL-1-deficient animals are superficially normal but unable to clear ASOR, and do not accumulate desialylated glycoproteins or lipoproteins in plasma (Tozawa et al. 2001). Proof-of-concept for ASGPR targeting has been achieved by demonstrating that GalNAc-conjugated siRNA agents appear to accumulate exclusively in hepatocytes (Rozema et al. 2007; Woodell et al. 2013).
Targeting HCC using ASGPR ligands has been the basis of at least two Phase I clinical trials (Julyan et al. 1999; Seymour 2002). While it is well established that ASGPR is highly expressed on normal hepatocytes, the expression pattern of this receptor in early and advanced HCC patients has only been investigated in very small sample sets thus far (Hyodo et al. 1993; Trere et al. 1999; Julyan et al. 1999; Seymour 2002). Therefore, we examined ASGPR1 expression pattern and levels in normal liver and different grades of HCC, taking advantage of tissue microarray technology to probe a relatively large sample size.
Materials and Methods
Tissue Microarrays (TMA)
Paraffin-embedded tissue microarray (TMA) slides were purchased from Biomax (US Biomax, Rockville, MD). We purchased four TMA slides: LV241, LV803, LV804 and LV2081. Each tissue dot on the slide is called a “core”, which represents the tissue transferred from the original paraffin block from one patient. There are a total of 380 cores, including 76 adjacent or normal human livers, 19 HCC grade I tumors, 107 HCC grade II tumors, 51 HCC grade III tumors, 40 intrahepatic cholangiocarcinomas, 18 hepatic cirrhosis, 16 chronic active hepatitis, 7cholangiocarcinomas, and some virus hepatitis, colon metastases, among others. Their quality control is routine anti-Cytokeratin immunohistochemistry, as performed by the manufacturer. The cores have been validated by the pathologist on H&E-stained slides and compared with the individual parental tissues, as claimed by the manufacturer (data not shown).
Pathologist Grading
The HCC grade 1-3 (or I-III) in the pathology diagnosis is equivalent to well-differentiated, moderately differentiated or poorly differentiated, respectively. For HCC Grade I or well-differentiated: Cells appear normal and are not growing rapidly. For Grade II or moderately differentiated: Cells appear slightly different than normal. For Grade III or poorly differentiated: Cells appear abnormal and tend to grow and spread more aggressively. For Grade IV or undifferentiated: features do not differ significantly from undifferentiated cancers that occur in other organs. In the TMA samples we tested in this report, we have HCC grade I-III but not grade IV HCC.
Immunohistochemical (IHC) Staining of Paraffin-Embedded Tissues
All slides were stained with anti-ASGPR1 IHC staining to address the pattern and expression levels of ASGPR1. IHC staining was performed according to the following standard procedure. Slides were deparaffinized and rehydrated with Xylene 2x, 100% 2x, 95% 2x, 70% ethanol and PBS (phosphate-buffered saline; 10 mM sodium phosphate-buffered, pH 7.2, isotonic 0.9% w/v saline solution). Rehydrated sections were antigen retrieved with citrate buffer (10 mM sodium citrate, 0.05% Tween 20, pH 6.0) at 103C for 10 min. The sections are then incubated with 3% H2O2 in methanol for 10 min at room temperature to block endogenous peroxidase, washed three times for 3 min each with PBS and then incubated for 30 min at room temperature in 10% BSA (bovine serum albumin) in a humidified chamber at room temperature. The primary antibody, anti-ASGPR1 (HPA011954; Sigma Life Sciences) at 5 μg/mL was applied to the sections, and incubated for 2 hr at room temperature. Sections were then rinsed three times for 3 min each in PBS and incubated with HRP-conjugated secondary antibody for 30 min at room temperature. Then, the samples were washed and incubated with diaminobenzidine substrate (DAB). Sections were further counterstained with Hematoxylin (BioCare, Birmingham, UK). Finally, sections were dehydrated and mounted with Permount.
Image Acquisition and Quantification
Stained sections were captured at 20x objective under bright light using ScanScope Aperio XT® (Aperio, Vista, CA). ASGPR1-positive membrane staining was measured by H-score using the equation listed below. Images of a fixed rectangle about 1/5 of the size of each tissue core, which contains tumor cells but not connective tissues, were randomly selected for ASGPR1 staining analysis. Aperio built-in Membrane Algorithm V9 was used for membrane staining analysis following manufacturer’s protocol.
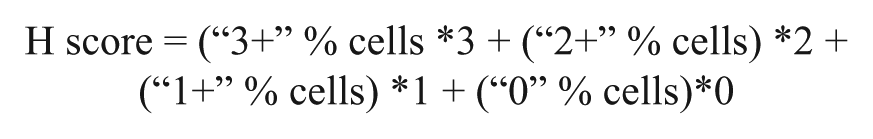
In the equation, “0” means no staining; “1+”, “2+” and “3+” mean weak, moderate, and strong IHC staining, respectively. H-score is calculated according to the above formula and it is a number between 0–300. A higher H-score represents higher ASGPR1 expression in hepatocytes or HCC tumor cells.
Tre-Met HCC Mouse Model and Immunofluorescence Staining
Tre-Met mice were acquired via licensing agreement and bred by Taconic (Hudson, NY). The transgenic mice developed HCC spontaneously and tumor penetrance occurred after about 14 weeks. All animal experiments were conducted in accordance with the standards established by the United States Animal Welfare Act and approved by Merck & Co., Inc.’s Institutional Animal Care and Use Committee. These mice overexpress human cMet transgene in liver, and acquire beta-catenin (CTNNB1) mutations in >95% of the HCC tumors. After developing tumors, mice were euthanized and liver/tumor tissues were collected and embedded in OCT. Frozen sections were made at 7 microns and immunofluorescence (IF) staining was performed as follows. Sections were fixed in 4% paraformaldehyde and blocked with DAKO blocking agent (Carpinteria, CA) for 30 min. Sections were then stained with ASGPR1 (R&D systems, AF2755) at 10 μg/mL for 1 hr and detected with Alexa 488-conjugated secondary antibody (Invitrogen, Carlsbad, CA). After washing in PBS buffer, the sections were counter-stained with Texas Red-conjugated Phalloidin (Invitrogen) for 30 min. Sections were last coverslipped and mounted with DAPI-containing Prolong (Invitrogen, P36935). Images were captured with an Olympus BX51 microscope and SlideBookTM software (version 4.2) (Olympus Optical Co. Ltd, Tokyo, Japan). Images were visualized using three channels: cell membranes were outlined by phalloidin staining in red; ASGPR1 immunofluorescence signal was green; and DAPI stained nuclei were blue.
Statistical Analysis
The H-scores of each category were plotted in dot plot and box-and-whisker plot using GraphPad Prism 5 (Graftware Software Inc., La Jolla, CA). In the box-and-whisker plot, we can visualize median, 25% and 75% percentiles and the minimum and maximum data of each category. Statistical evaluation was performed by Kruskal-Wallis test and Dunn’s multiple Comparison test. The H-score analysis of paired HCC tumors and their normal liver tissues was also compared using a Paired t-test. The values of p<0.05 were considered statistically significant.
Results
The Expression Pattern of ASGPR1 in Normal Liver and HCC Tumors
Mice engineered to conditionally overexpress the MET oncogene in the liver (TRE-MET model, Wang et al.) develop spontaneous tumors, and display several genetic and morphological features of human HCC, including a high incidence of mutations of the CTNNB1 gene (Ivanovska et al. 2011). To investigate the relative density and polarity of ASGPR in tumor vs. normal liver, we performed immunofluorescence in tissues collected from this preclinical model (Fig. 1). In normal mouse liver areas, ASGPR1 was expressed in the basolateral membranes of hepatocytes but not in the apical membrane (Fig. 1A), which is in agreement with published data (Matsuura et al. 1982). This expression polarity was not observed in HCC tumor areas (Fig. 1B, C, D), and the overall pattern of expression in tumor samples is markedly irregular compared with the adjacent normal tissue in this model.
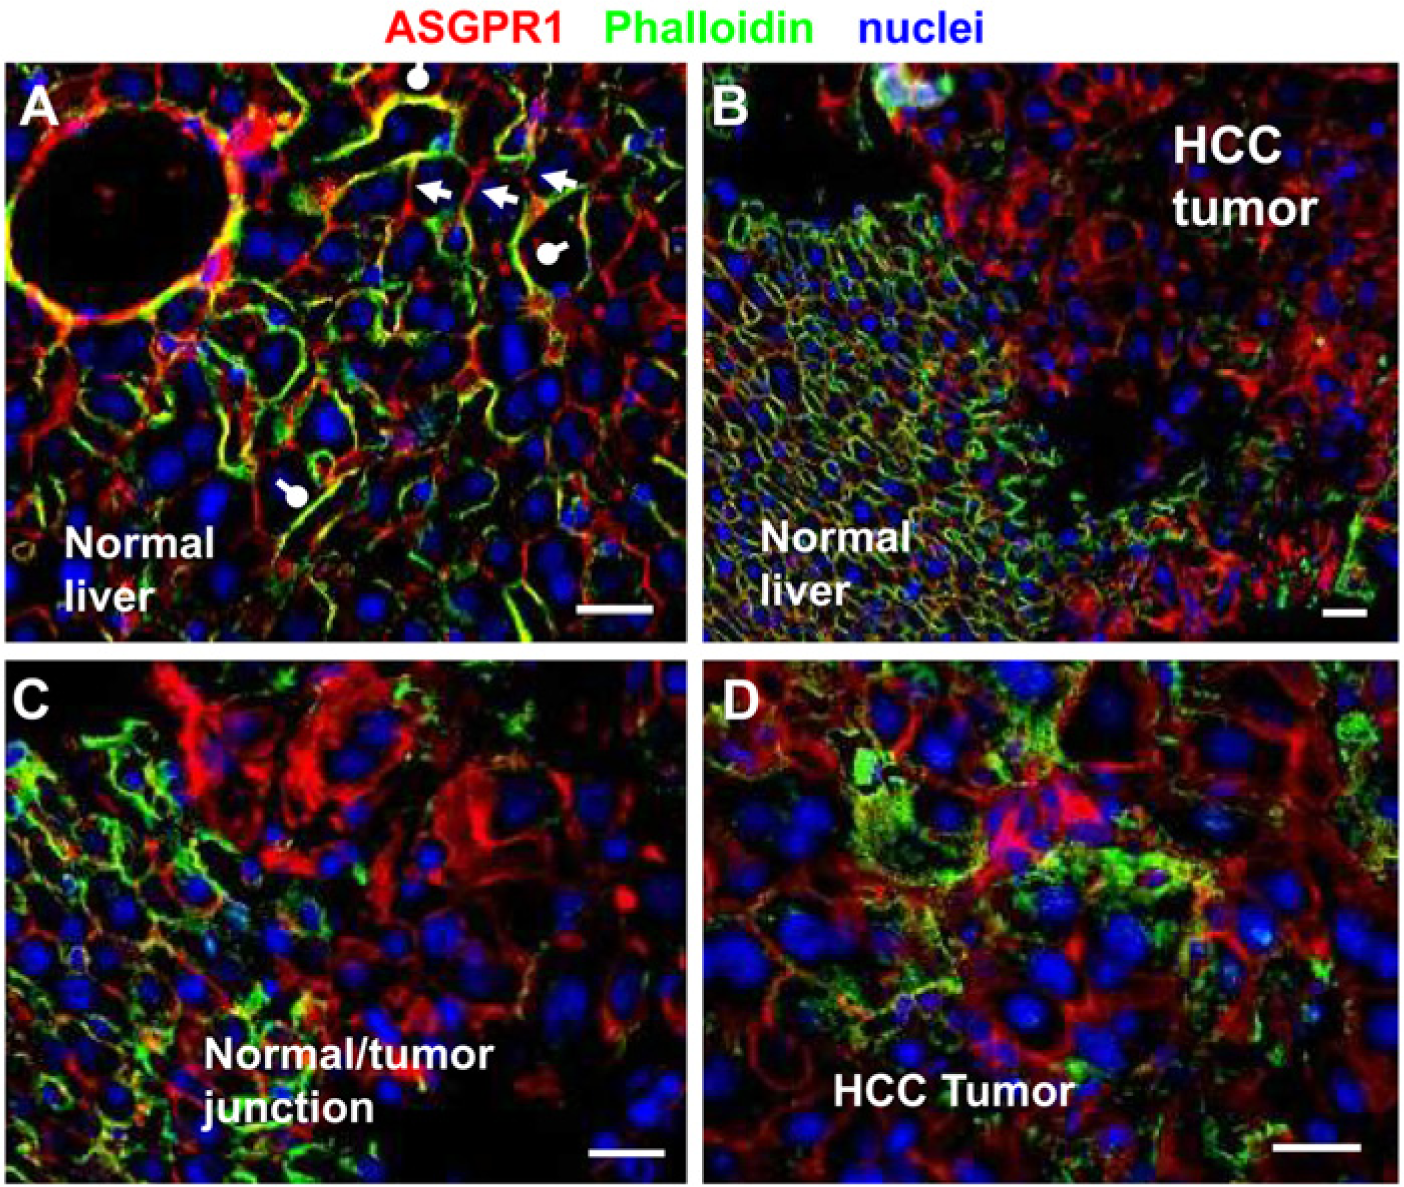
ASGPR1 expression pattern in normal mouse liver tissues vs. HCC tumor tissues in Tre-Met transgenic mouse model. Cell membranes are outlined by phalloidin staining in red. ASGPR1 immunofluorescence signal is green. DAPI counter-stain of the nuclei is blue. (A) ASGPR1 is stained strongly on basolateral membranes of hepatocytes (yellow-green) and indicated by white round-end bars. Apical membranes of hepatocytes are in red, suggesting no detectable ASGPR1 (white arrow heads). A normal liver to HCC tumor transition area is captured at 20x (B) and 40x (C). (D) Irregular distribution of ASGPR1 and loss of polarity are detected in HCC tumor cells. Scale bar is 20 µm.
The study of ASGPR levels in human HCC has thus far been limited. In this report, we evaluated human TMAs containing 177 HCC samples and 114 normal or non-cancerous diseased liver samples for ASGPR1 expression. In addition, 47 cholangiocarcinoma samples serve as a negative control, as they are a liver tumor tissue of non-hepatocyte origin. ASGPR1 immunostaining was strongly positive on basolateral membranes of hepatocytes in ASGPR1-positive normal human liver tissues. There was less staining observed on apical membrane of the hepatocytes (Fig. 2A, B). Cytoplasmic staining of ASGPR1 was also notable in the hepatocytes. Irregular, polar and non-polar distributions of ASGPR1 were observed in human HCC tumor cells (Fig. 2C, D, E). Out of 177 human HCC tumors, 44 (24.8 %) had no staining (H-score <50) of ASGPR1 (Fig. 2F). It is also noteworthy that 11.8% (9/76) of normal liver tissues included on the arrays were negative for ASGPR1 (Fig. 3A, adjacent or normal livers; and Fig. 4B, 4D). This was an unexpected finding for normal liver, and we cannot exclude the possibility that this could result from variations in the tissue collection and fixation procedures, patient histories, or sample storage among the clinical sites.
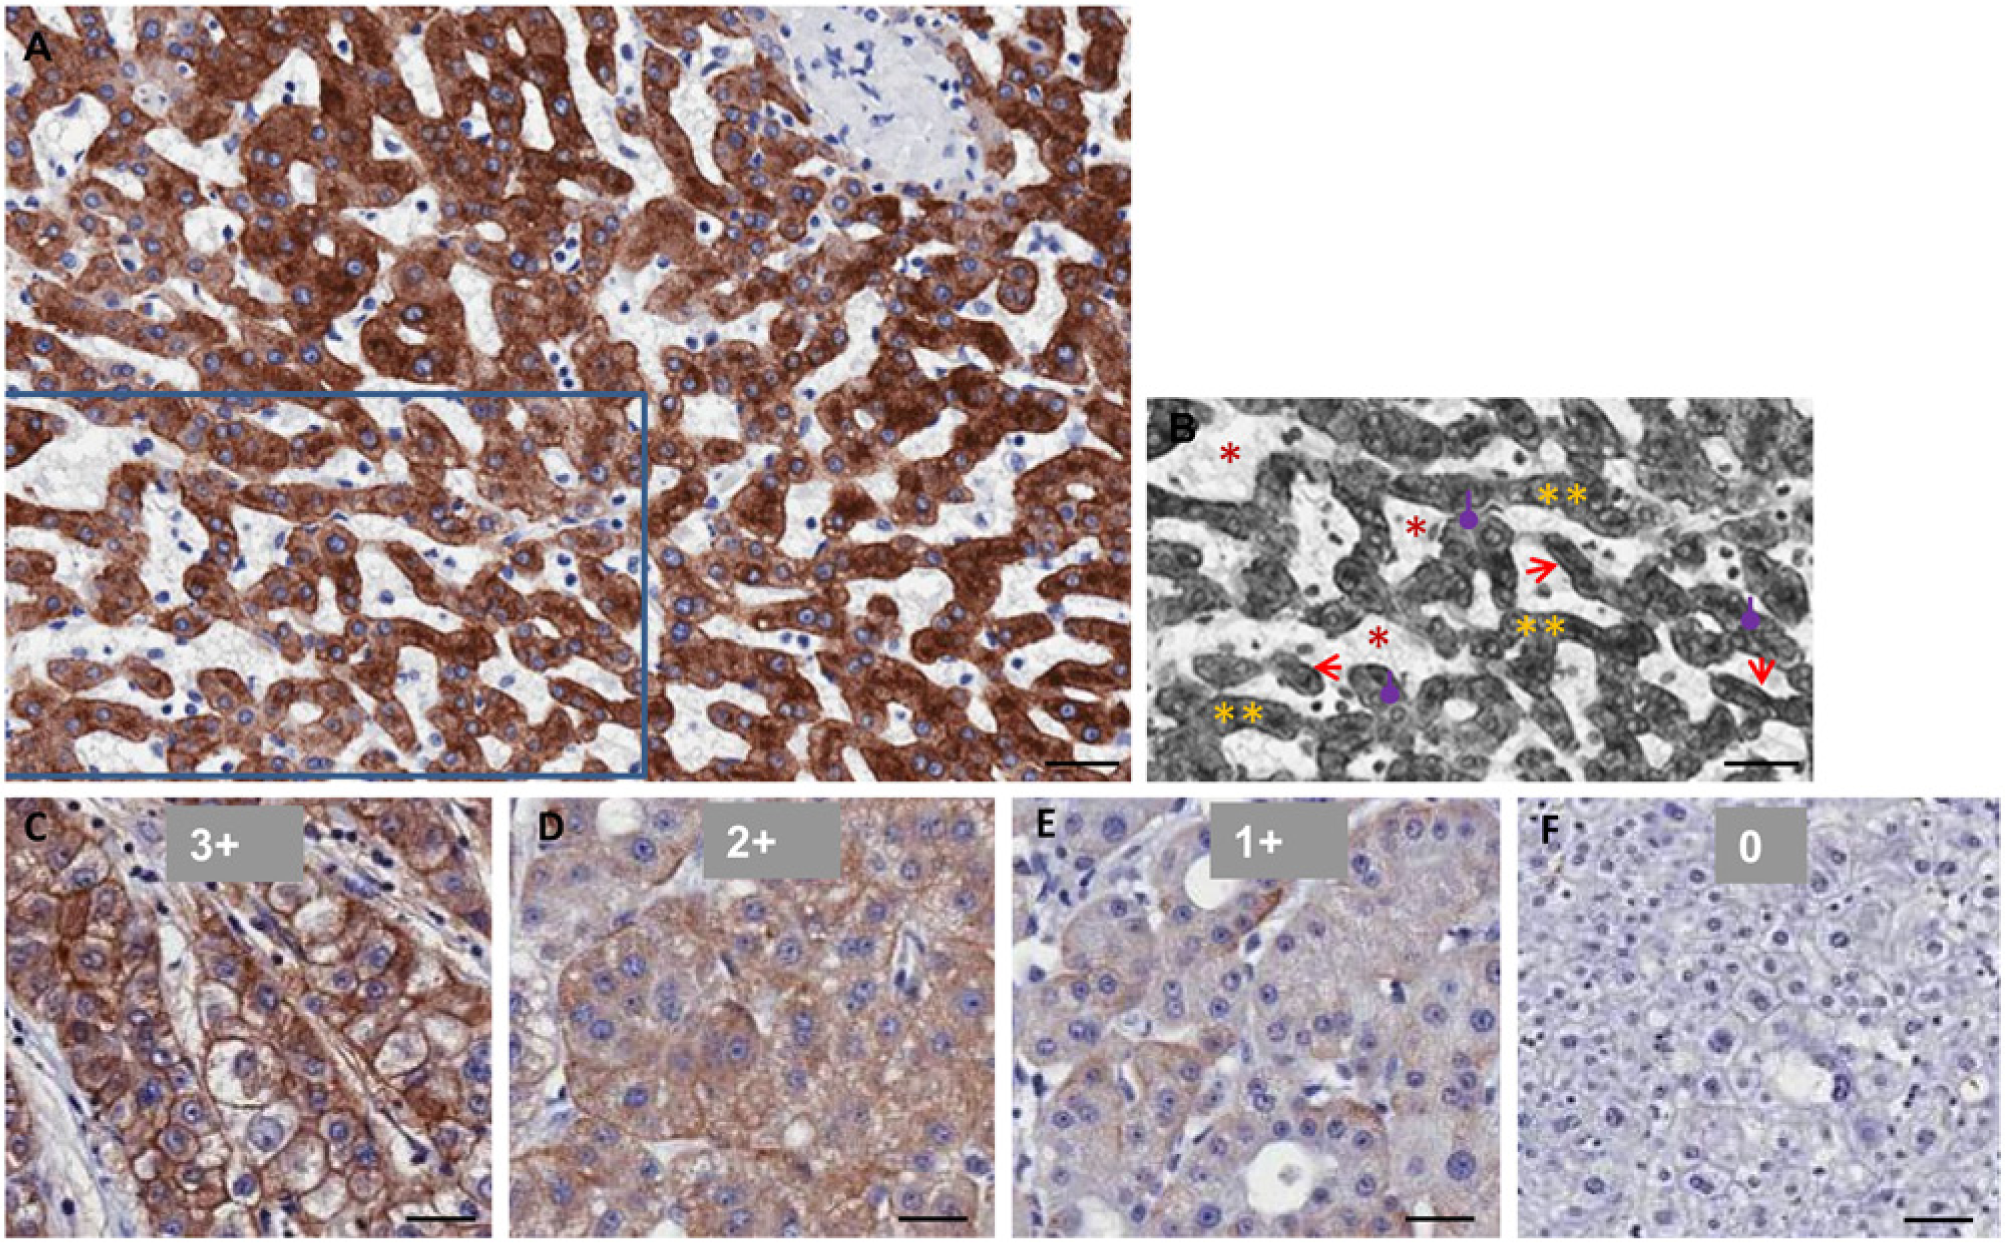
Immunohistochemical (IHC) staining of anti-ASGPR1 in formalin-fixed paraffin-embedded human normal liver and hepatocellular carcinoma (HCC) tissues. (A) Normal human liver tissue. (B) Grey false-color image of part of (A) to illustrate sinusoids (*, red), hepatocyte cords (**, yellow), basolateral membrane (sinusoidal membrane) of hepatocytes (arrows, red) and apical membrane of hepatocytes (round-end-arrows, purple). (C to F) Representative HCC tissues with ASGPR1 staining score of 3+, 2+, 1+ and 0. Scale bar = 40 µm.
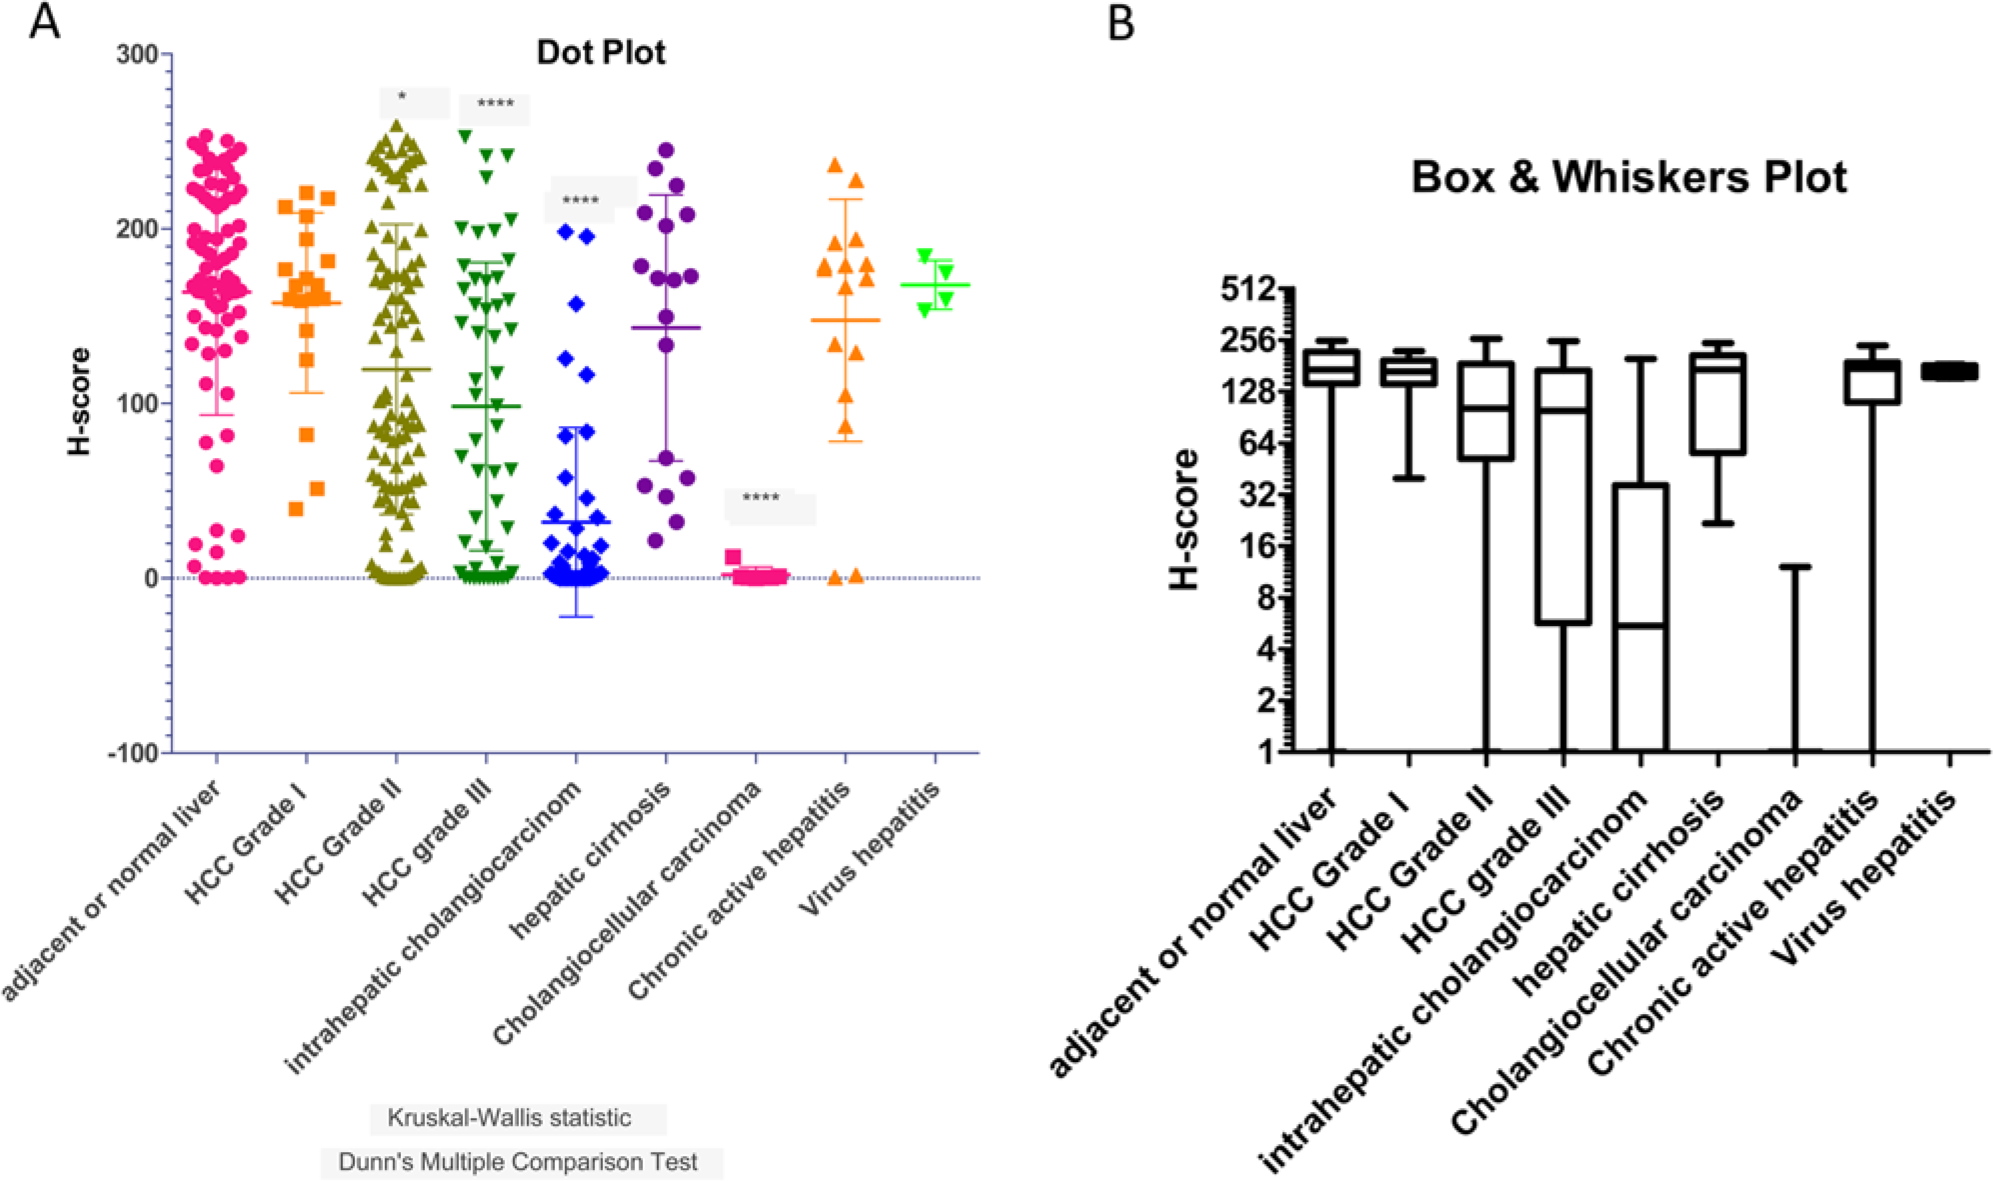
The H-score of ASGRP1 staining in dot plot (A) and box-and-whisker plot (B). (A) Dot plot to illustrate the scattering of H-scores for ASGPR1 expression in each category of adjacent normal liver, hepatocellular carcinoma (HCC) grade I, II, and III tumors, as well as in intrahepatic cholangiocarcinomas, hepatic cirrhosis, chronic active hepatitis, cholangiocellular carcinomas, and virus hepatitis. Mean and standard errors are illustrated. Kruskal-Wallis Statistic normality of data and Dunn’s multiple comparison tests are analyzed using Prism GraphPad. Statistical significance of H-scores of each category comparing to the adjacent normal liver group is marked with * (p<0.05) and **** (p<0.0001). (B) Box-and-whisker plot for the same data set to visualize median, 25% and 75% percentiles and the minimum and maximum data of each category.
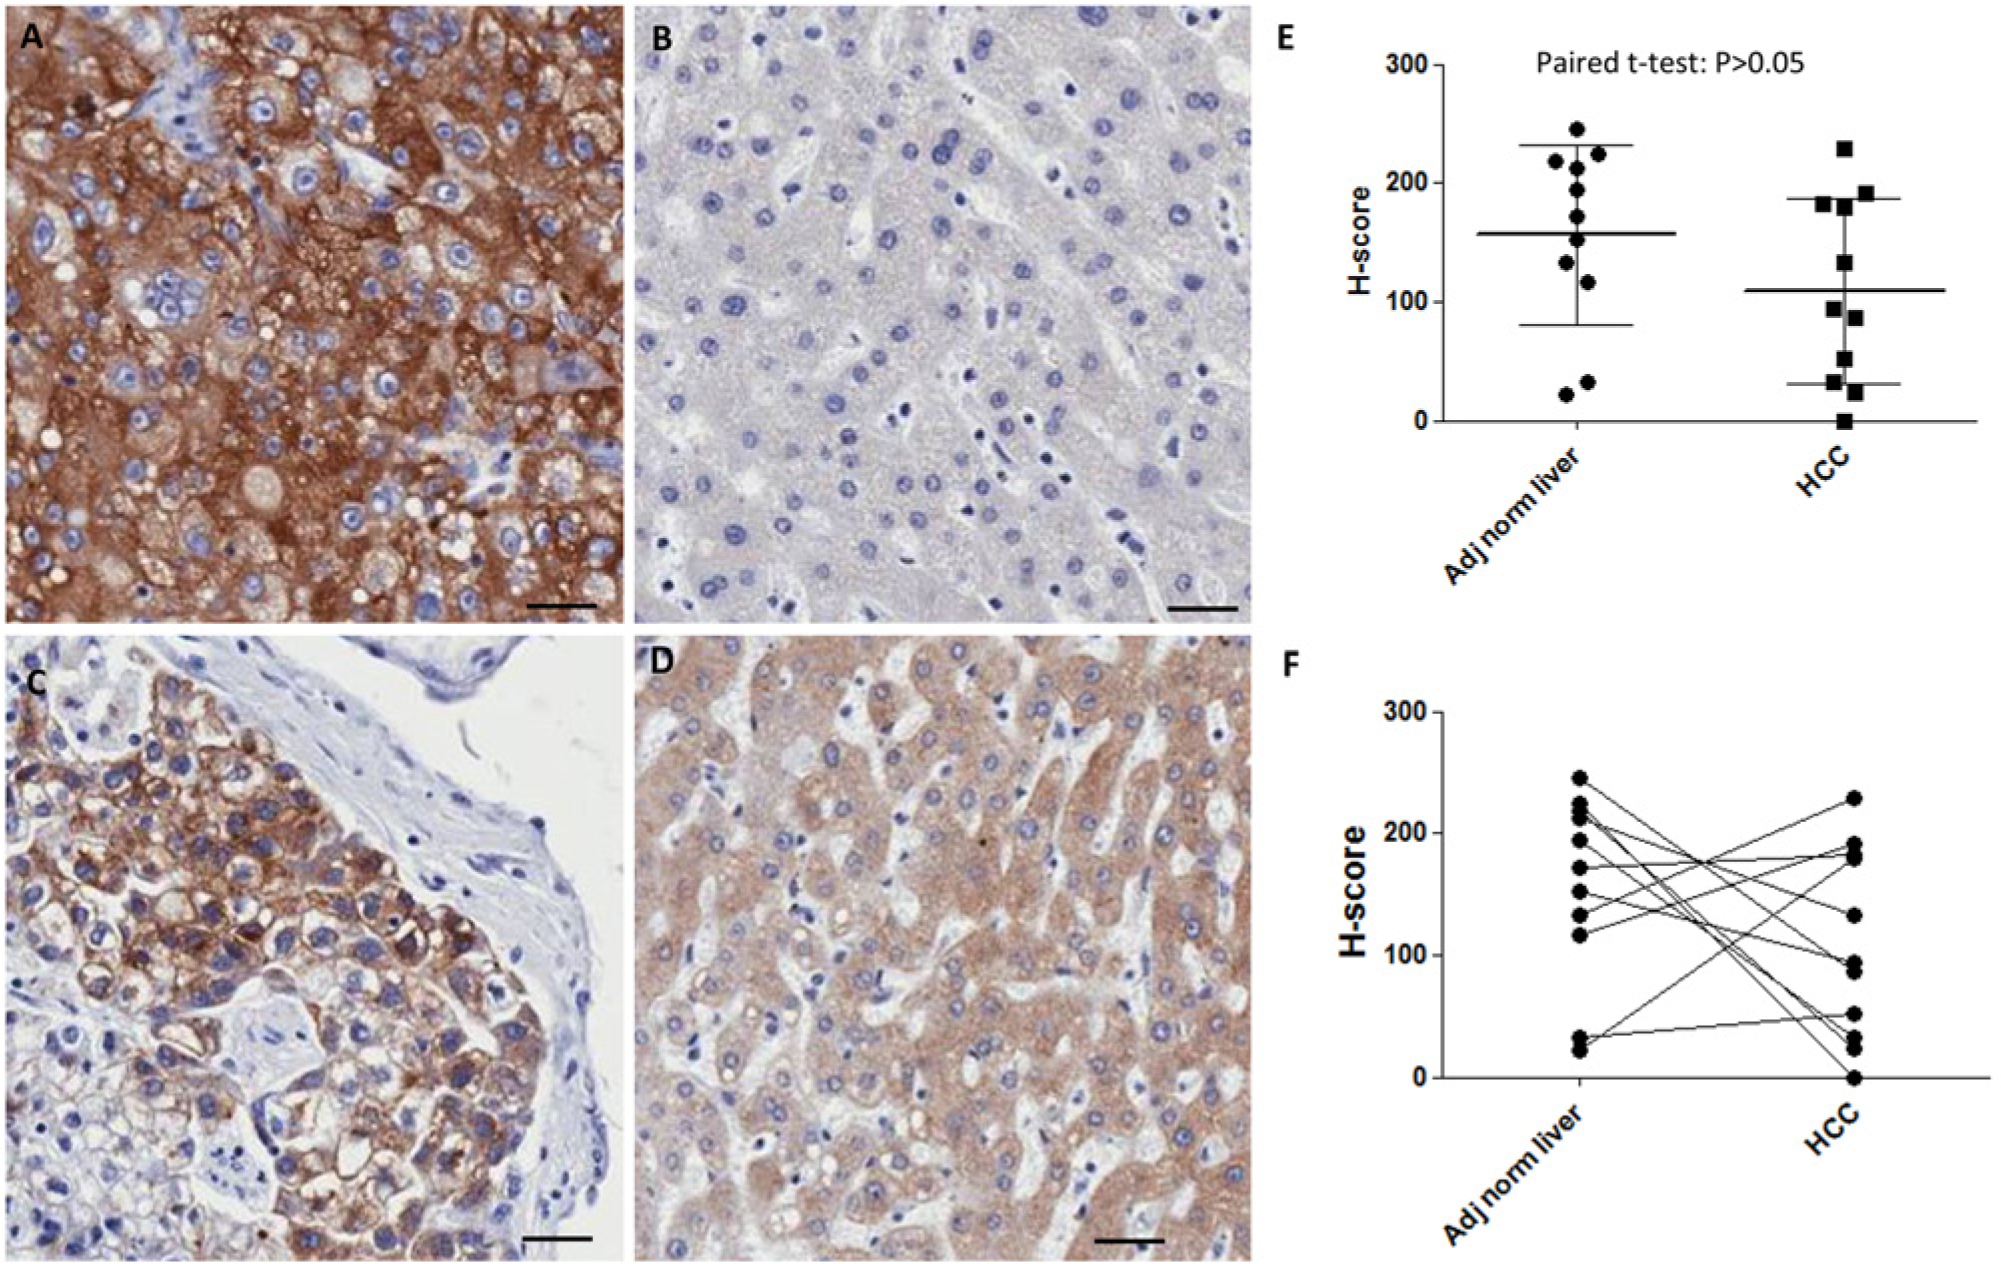
Comparison of the H-scores for ASGPR1 staining in hepatocellular carcinoma (HCC) tumor tissues with matched normal adjacent liver tissues. (A–D) Representative images of anti-ASGPR1 immunohistochemical staining in HCC tumors (A and C) and matched adjacent normal liver tissues (B and D), respectively. (E, F) H-score for ASGPR1 in the matched adjacent normal liver tissues and corresponding HCC tumors. Mean and standard errors are illustrated in E. Paired t-test (Prism) indicated no statistical significant difference for ASGPR1 in normal liver tissues vs. pair-matched HCC tumor tissues (p>0.05). Scale bar = 40 µm.
H-score for ASGPR1 Expression Levels
We calculated H-score using the built-in algorithm in the Aperio® software. The H-score method has been accepted by regulatory agencies for diagnostics in oncology, and the imaging software approach offers a major advance over other methods because it removes subjectivity from the quantitation. The most common application of H-scoring in practice is for the Her2 receptor in breast and gastric cancers to determine patient eligibility and response to Herceptin® (Vogel et al. 2001; Boers et al. 2011). The H-score calculation formula is listed in the Materials and Methods section. In the equation, “0” means no staining; “1+”, “2+” and “3+” mean weak, moderate, and strong IHC staining respectively.
The representative ASGPR1 staining and scores are listed in Fig. 2C to F. Out of the 380 cores analyzed in four MTAs, we had 177 HCC tumors (19 HCC grade I, 107 HCC grade II, and 51 HCC grade III), 76 adjacent normal human liver tissues, 40 intrahepatic cholangiocarcinomas, 18 hepatic cirrhosis, 16 chronic active hepatitis, 7 cholangiocarcinomas, 16 virus hepatitis, and 4 colon metastases. Well-differentiated HCC (grade I) had a similar level of ASGPR expression, whereas moderately and poorly differentiated HCC (Grade II and III) had statistically significantly less ASGPR expression compared with normal liver in humans (Fig. 3 and Table 1). From the dot plot and box-whiskers plot, the mean (Fig. 3A and Table 1) and median (Fig. 2B and Table 1) H-scores for HCC grade I tumors were similar to that of adjacent normal liver tissues (p>0.05). The H-scores of HCC grade II (*p<0.05) and HCC grade III (****p<0.0001) were significantly lower than the scores for the adjacent normal liver tissues (Table 1). For the tumor grades that were statistically different to that of normal liver (mean H-score of 163.8), the H-scores for Grade II and Grade III HCC, respectively, were 119.5 and 98.4. The diversity in ASGPR1 expression levels among HCC samples suggests strongly that the loss of ASGPR expression is not a hallmark of tumorigenesis or tumor maintenance, as others previously suggested using smaller sample sets (Trere et al. 1999).
H-score of ASGPR1 in Hepatocellular Carcinomas (HCC) and Adjacent/Normal Liver Tissues.
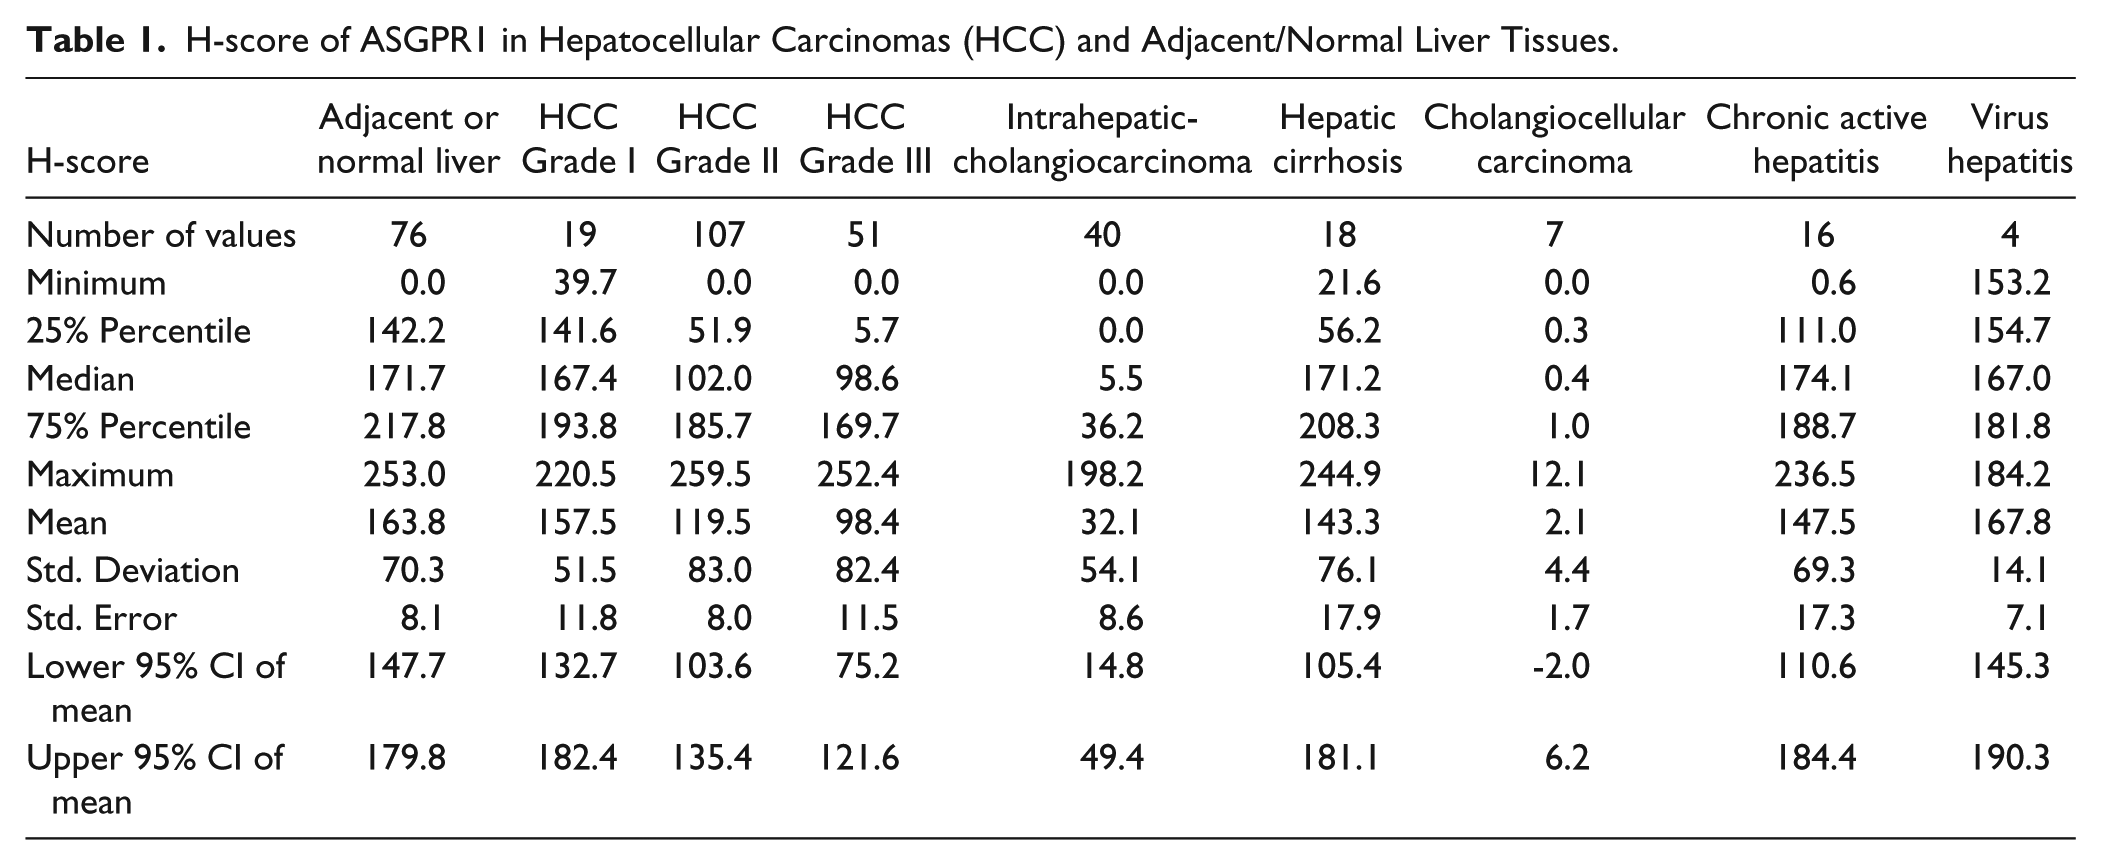
Included in the sample set were 11 matched-pair samples, where both tumor tissue and normal adjacent tissue were collected from the same patient (Fig. 4). Among these 11 matched-pair sets, seven are grade II HCC and four are grade III HCC. Overall, the normal liver tissues have an H-score with a mean value of 156.6 (Fig. 4E), indicating higher expression of ASGPR1 as compared with HCC tumors (mean of H-score = 109.3), but paired t-test indicated no statistical significance (Fig. 4E). A pairwise analysis of these samples showed that, in 8/11 matched-pairs (72%), ASGPR expression was either decreased or unchanged in tumor vs. normal tissue. However, there were three unexpected examples of matched pairs where expression was higher in tumor vs. normal liver, including one Grade III HCC sample (Fig. 4F). This analysis again demonstrates that, while the trend for decreased ASGPR expression in HCC is significant, ASGPR loss is not a fundamental hallmark of HCC.
Discussion
ASGPR1 is mainly expressed in the human liver but not in other organs; therefore, strategies that exploit this receptor for targeted therapy may have a lower risk of creating adverse effects in other tissues. The objective of this research was to inform on use of ASGPR targeting in HCC. The inclination from our study is that more advanced HCC biopsies trend statistically towards reduced ASGPR1 expression. Because of the scattering of the H-scores (Fig. 3A) in the tested HCC samples, especially some low H-score samples in the adjacent normal liver group, we would recommend that individual normal liver and HCC biopsies (when available) are evaluated for ASGPR expression before the application of galactose-mediated drug delivery.
Our studies are reasonably consistent with previous reports that used smaller sample sizes and qualitative approaches. Hyodo (Hyodo et al. 1993) studied ASGPR distribution in HCC using traditional IHC staining and immunoelectron microscopy techniques and found ASGPR was membrane-localized in four of six well-differentiated HCCs; there was no ASGPR surface expression in two well-differentiated and four of four poorly differentiated HCCs. Trere and colleagues (Trere et al. 1999) addressed the expression of ASGPR in human HCC, especially its expression on proliferating cells. They depicted ASGPR membrane localization in 28 of 35 grade I & II tumors (80%) but only 5 out of 25 grade III & IV tumors (20%). They also identified that ASGPR-expressing HCCs contain BrdU incorporation signals, indicating the proliferating property of the tumor cells. While our data are consistent with a trend towards an inverse correlation between expression and tumor differentiation, it is important to note that we observed very high H-scores (>200) for eight Grade III HCCs. Our perspective is that large sample sets must be evaluated before reaching generalizable conclusions.
Julyan (Julyan et al. 1999) and Leonard (Leonard 2002) reported phase I clinical trial results for a polymer based [N-(2-hydroxypropyl) methacrylamide (HPMA)] doxorubicin. One drug, PK2, contained N-linked galactosamine; the other drug, PK1, had no targeting ligand. Thirty-one patients with primary (n=25) and metastatic (n=6) liver cancers were included in the trial. The targeted derivative, PK2, yielded a higher exposure in both normal liver and HCC than the parental compound, PK1. Although the HCCs had less drug (doxorubicin) than normal hepatocytes (5-fold) overall, it is unclear to what extent ASGPR expression contributed to this differential. Numerous factors are known to affect tumor cell exposure to cytotoxic drugs, including interstitial pressure (Jain 1987), drug efflux pumps such as P-glycoprotein/MDR1 (Piddock 2006), and the rate of cell proliferation. Despite the moderately lower ASRPR in HCC, the functional consequence with respect to drug deposition in the tumor cell after administration of galactose-targeted therapeutics will require additional clinical data. Nevertheless, some cytotoxic anti-cancer drugs have a more profound effect on proliferating cells. HCC tumor cells are highly proliferating compared with normal quiescent hepatocytes. So, a targeting delivery strategy provides more beneficial effect to drug accumulation in liver organ than other extra-hepatic non-ASGPR1 expressing tissues and renders the cytotoxic effect toward proliferating HCC tumor cells in the liver. The targeting delivery strategy in this circumstance is drug dependent.
One important consideration for galactose-mediated targeting is that ASGPR1 expression exhibits polarity (Matsuura et al. 1982) and zonality (Ise et al. 2004). ASGPR1 is expressed high on the basolateral/sinusoidal membrane of rat hepatocytes and low in apical hepatocellular membrane (polarity); its expression is higher in the rat hepatocytes of centrolobular areas than in those of portalobular areas (zonality). Ise et al. also suggested that hepatocytes with low ASGPR expression are stem-like, which can result in a high repopulation capacity in vivo. In our study, we could not detect the zonal distribution of ASGPR1 in human tissue array samples. A major caveat is the small size of each biopsy sample in the human MTAs. In larger tissue sections, we observed a zonal distribution pattern for ASGPR1 in normal rat liver tissues consistent with previous observations (Ise et al. 2004). We also observed zonal distribution patterning in non-human primate and human samples (Supplemental Fig. 1), but the direction of zonality was not always consistent. Further study is needed to determine the functional implications of these observations, especially because of the potential for an uneven sub-organ drug biodistribution.
Overall, the increasing availability of TMAs reduces the need to rely on preclinical models to address important tissue expression questions. As demonstrated in this report, TMAs can be used to validate clinical relevance of potential biological targets in the development of diagnostics and therapeutics, and to study new protein markers and genes related to HCC. Each TMA slide includes tens to hundreds of tissue cores, providing high-throughput platforms for the rapid analysis of molecular markers associated with disease diagnosis, prognosis and therapeutics in patients. To our knowledge, our study is the first to adapt the built-in algorithm in the Aperio® software to quantitatively measure membrane ASGPR1 levels. From our ASGPR1 evaluation using human tissue microarrays, we would reiterate the aforementioned recommendation that galactose-mediated targeting should still be applicable for HCC, but that patients should be subjected to a companion diagnostic analysis to determine their eligibility based on tumor ASGPR expression.
Footnotes
Acknowledgements
The authors would like to thank Merck Research Laboratory biologist Bruce Ng and Joe Davide who provided Tre-Met mice for dissection of mouse hepatocellular tumors and adjacent normal mouse livers. Also thanks to Dr. Julja Burchard for critical suggestions on statistical analysis. Thanks to Drs Hans Huber and Jeremy Caldwell for the management support of this project.
Declaration of Conflicting Interests
The author(s) declared no potential conflicts of interest with respect to the research, authorship, and/or publication of this article.
Funding
The author(s) disclosed receipt of the following financial support for the research, authorship, and/or publication of this article: All authors are the employee of Merck Sharp & Dohme Corp. who received financial assistance toward this research and may hold stocks in the company.
References
Supplementary Material
Please find the following supplemental material available below.
For Open Access articles published under a Creative Commons License, all supplemental material carries the same license as the article it is associated with.
For non-Open Access articles published, all supplemental material carries a non-exclusive license, and permission requests for re-use of supplemental material or any part of supplemental material shall be sent directly to the copyright owner as specified in the copyright notice associated with the article.