
Abstract
Better knowledge of the distribution of iron in the brains of Alzheimer’s disease (AD) patients may facilitate the development of an in vivo magnetic resonance (MR) marker for AD and may cast light on the role of this potentially toxic molecule in the pathogenesis of AD. Several histological iron staining techniques have been used in the past but they have not been systematically tested for sensitivity and specificity. This article compares three histochemical techniques and ferritin immunohistochemistry to visualize iron in paraffin-embedded human AD brain tissue. The specificity of the histochemical techniques was tested by staining sections after iron extraction. Iron was demonstrated in the white matter, in layers IV/V of the frontal neocortex, in iron containing plaques, and in microglia. In our hands, these structures were best visualized using the Meguro iron stain, a method that has not been described for iron staining in human brain or AD in particular. Ferritin immunohistochemistry stained microglia and iron containing plaques similar to the Meguro method but was less intense in myelin-associated iron. The Meguro method is most suitable for identifying iron-positive structures in paraffin-embedded human AD brain tissue.
Introduction
There is growing evidence that iron plays an important role in the development of neurodegenerative diseases such as Alzheimer’s disease (AD). One of the reasons is an altered brain iron distribution, with iron accumulation in AD plaques (LeVine 1991; Smith et al. 1997; Crichton et al. 2002; Haacke et al. 2005; Meadowcroft et al. 2009; Bartzokis 2011). These disease-related changes in brain iron distribution are a potential marker for early in vivo diagnosis using magnetic resonance imaging (MRI), especially because recent advances in human MRI systems operating at an ultra-high magnetic field (7 Tesla and higher) show increased sensitivity to iron-based susceptibility contrast in the human brain that have not been observed before (Nabuurs et al. in press). A validated histological method to stain iron in brain tissue is required to correlate the MRI findings with histological changes in iron distribution and to study the role of iron in the development of neurodegenerative diseases like AD.
Iron (Fe) is essential for the proper functioning of many cellular processes. Due to its capability to catalyze oxidation-reduction reactions, iron serves as an active site in molecules with critical biological functions. However, this also requires a strict regulation to prevent uncontrolled spreading of catalytically active iron and its potential (neuro) toxicity (Meguro et al. 2007). This regulation is achieved by strong binding between iron and the proteins transferrin and ferritin. Transferrin, a transporter protein, can bind two Fe3+ ions. Ferritin serves as the principle iron storage protein capable of binding up to 4500 iron atoms in different mineral forms, predominantly as Fe3+ and small amounts of Fe2+ (Meguro et al. 2007). In organisms, iron can be categorized as heme or non-heme iron. Heme iron is a Fe2+ protoporphyrin complex found in, for instance, hemoglobin. Non-heme iron consists of Fe3+ bound to ferritin or transferrin and very small amounts of Fe3+ and Fe2+ loosely bound to organic bases, enzymes, iron sulphur proteins, and nucleotides. In general, nearly all non-heme iron found in the human body is bound to ferritin as Fe3+. The distribution of ferritin closely resembles the distribution of iron and therefore may act as a surrogate marker for iron (Grundke-Iqbal et al. 1990; Meguro et al. 2007).
In the normal brain, most iron is present in myelin and oligodendrocytes, which require iron-dependent enzymes to produce and maintain myelin. Myelin-rich areas such as white matter thus contain large amounts of iron. In the cerebral cortex, iron is also expected in the myelin-rich layers IV and V (Fatterpekar et al. 2002). In damaged brain tissue, microglial cells have been shown to accumulate iron (Schonberg et al. 2012).
Non-heme iron (predominantly in the Fe3+ form) can be visualized in paraffin-embedded tissue by the classic Perl’s iron stain, in which soluble ferrocyanide reacts with the tissue Fe3+ to form crystals that make an insoluble Prussian blue dye. Further enhancement can be obtained by allowing the Prussian blue crystal to catalyze the H2O2-dependent oxidation of diaminobenzidine (DAB) (Meguro et al. 2007). Several protocols for DAB-enhanced iron stains, using different pre-treatment, slide thickness, endogenous blocking, and reagent concentrations, have been published, but these different methodologies have never been directly compared with one another and only some staining patterns have been related to ferritin immunohistochemistry (IHC) (Barbeito et al. 2009; Butt et al. 2010; Fukunaga et al. 2010; Chen-Roetling et al. 2011; Shpyleva et al. 2011) or checked for false-positive results in iron-depleted sections (Smith et al. 2007). The DAB-enhanced histochemical iron stains described by Smith (Smith et al. 1997) and LeVine (LeVine 1991) have been reported to label AD plaques. The Meguro method (Meguro et al. 2007) has not been described in human brain tissue or animal models of AD but has been widely used in other organs in rats, mice, and monkeys (Meguro et al. 2005; Meguro et al. 2007; Freret et al. 2008; Iwatsuki et al. 2008; Meguro et al. 2008; Butt et al. 2010; Winter et al. 2010; Butt et al. 2011; Shpyleva et al. 2011).
The purpose of the present study is to compare the Meguro, Smith, and LeVine iron staining methods for the detection of non-heme iron in brain tissue with AD pathology. In addition, we investigated their correlation with the distribution of ferritin by IHC.
Materials & Methods
Brain Tissue Samples
One block of formalin-fixed, paraffin-embedded brain tissue of the frontal cortex of 4 AD patients (60-87 years; Braak 6: N=2; Braak 5: N=1; Braak 4: N=1) and 4 control patients without dementia or evidence of AD (62-76 years; Braak 0) was used. Samples were handled in a coded fashion to maintain anonymity according to Dutch national ethical guidelines. The brain tissue had been routinely immersed in buffered 10% formalin for a maximum of 6 months.
Iron Extraction
In the first experiment, the tissues of AD patients were used to examine the effect of iron extraction on the different stainings. For each patient sample, 7 serially cut 10-µm-thick sections were mounted onto slides. Of each of these series, sections 1, 3, and 5 were incubated with 250 μl 0.1 M Na-citrate/HCL pH 1.0 buffer (Boom BV; Meppel, The Netherlands). After overnight incubation, the buffer was aspirated from the section and its iron concentration was measured using the Cobas Integra 400/800 method (Roche Diagnostics; Mannheim, Germany). As a control, the iron concentration was tested in the native buffer, in buffer incubated on a glass slide without tissue, and in buffer with Fe3+ (Menck BV; Amsterdam, The Netherlands) added as a positive control. The limits of sensitivity of the Fe elution assay are 0.9-179 µmol/L (Roche Diagnostics).
As a control experiment, the tissues of AD patients were used to test the iron extraction capability of Na-citrate/HCL buffer. For each patient sample, a section was incubated with 250 µl 0.05 M TRIS/HCL pH 1.0 buffer (Menck BV) and an adjacent section was incubated with 250 µl 0.1 M Na-citrate pH 1.0 buffer to extract iron. After overnight incubation, the buffer was aspirated from the section and its iron concentration was measured as described above.
Histological Procedures for Iron Staining
For the first experiment, the sections of AD tissue as described above were used. Of each patient, sections 1 and 2 were stained as described by Meguro et al. (2007), with an increase in incubation times of 25%: after de-waxing/rehydration, the paraffin sections were incubated for 40 min in 1% potassium ferrocyanide, washed, and treated in methanol containing 0.01 M NaN3 and 0.3% H2O2 for 75 min. Then, the sections were treated in 0.1 M phosphate buffer, followed by a solution containing 0.025% 3,3’-DAB-4HCL (DAB; Sigma, St Louis, MO) and 0.005% H2O2 in a 0.1 M phosphate buffer for 40 min. The reaction was stopped by washing.
The third and fourth sections were stained according to Smith et al. (1997). In short, after deparaffinization in xylene and rehydration through graded ethanol, sections were incubated for 15 hr in 7% potassium ferrocyanide in aqueous hydrochloric acid (3%) and subsequently incubated in 0.075% 3,3’-DAB and 0.015% H2O2 for 5 to 10 min.
The fifth and sixth sections were stained according to LeVine (1991) but with an increased DAB incubation time of 1 hr and 45 min. Briefly, after deparaffinization and rehydration, the sections were incubated in 10 mg NaBH4/ml phosphate-buffered saline (PBS), 30 min, washed in PBS, and incubated in 30 µg proteinase K/ml PBS with 0.1% Triton X-100 for 20 min at room temperature. Sections were washed in PBS and incubated in 1% potassium ferrocyanide/1% Triton X-100/0.125 N HCL for 30 min. Sections were washed in PBS and incubated in a mixture of 1 mg DAB: 5 ml 0.01 M Tris HCl pH 7.6: 10 µl 30% H2O2 for 2 hr in the dark followed by washing in PBS.
The seventh section was stained immunohistochemically for ferritin using polyclonal anti-ferritin rabbit antibody at 1:10000 (Bethyl; Montgomery, TX) overnight, followed by a swine anti-rabbit biotin (Dako, Glostrup, Denmark) at 1:600 for 1 hr at room temperature. After washing with PBS, immunolabeling was identified using an ABC kit (VECTASTAIN; Vector Laboratories, Burlingame, CA) according to the manufacturer’s instructions and visualized with DAB (3’3 diaminobenzidine; Sigma). The concentration of 1:10000 for the ferritin rabbit antibody was chosen after testing a series of seven different concentrations: 1:100, 1:500, 1:1000, 1:5000, 1:10000, 1:20000, 1:40000. The dilution of 1:10000 gave the most optimal signal compared with the higher and lower concentrations.
In the second experiment, the three different methods and ferritin IHC were performed on tissue samples of AD patients and on tissue samples of control patients. The tissue was cut in 10-µm-thick sections and mounted onto slides. Adjacent sections were stained with the Meguro, Smith, and LeVine methods and the ferritin IHC, as described above.
Scoring
All sections were scored for iron/ferritin labeling of plaques, microglia, white matter, and cortical layers IV and V. Microglial cells were defined as iron-positive cells with dilated cell bodies and dilated cellular processes. We and others have shown that iron-positive cells with this morphology label positively for microglial immunohistochemical markers (Nabuurs et al. 2011; Schonberg et al. 2012). The intensity of iron and ferritin staining in plaques and microglia was scored as no staining (-), intermediate staining (+), or strong staining (++). Labeling of myelin-associated iron in the white matter and in the myelin rich cortical layers IV and V was scored as no contrast (-), intermediate contrast (+), and strong contrast (++) versus the rest of the cortex. Scoring was performed independently by the authors (SVD, SGVD, RN).
Results
Iron Histochemistry
The Meguro method showed the strongest contrast between gray and white matter in AD and control tissue (Figs. 1 and 2, table 1). This contrast was also seen using the Smith and LeVine staining methods, however, it was less pronounced. Cortical layers IV and V showed the most intense labeling by the Meguro stain, and labeling of these layers was more pronounced in AD than in controls. These layers were also seen to a lesser extent in the Smith staining but not in the LeVine staining. Iron-containing plaques and microglia in AD tissues were most frequently and most intensely labeled by the Meguro stain. The Smith method detected less microglia and fewer iron-containing plaques in the cortices of AD patients. The LeVine method was clearly the least sensitive, showing no enhanced labeling of the cortical layers IV/V, only a few plaques, and no microglia. No iron-positive plaques or microglia were found, with any of the iron staining methods in control tissue.
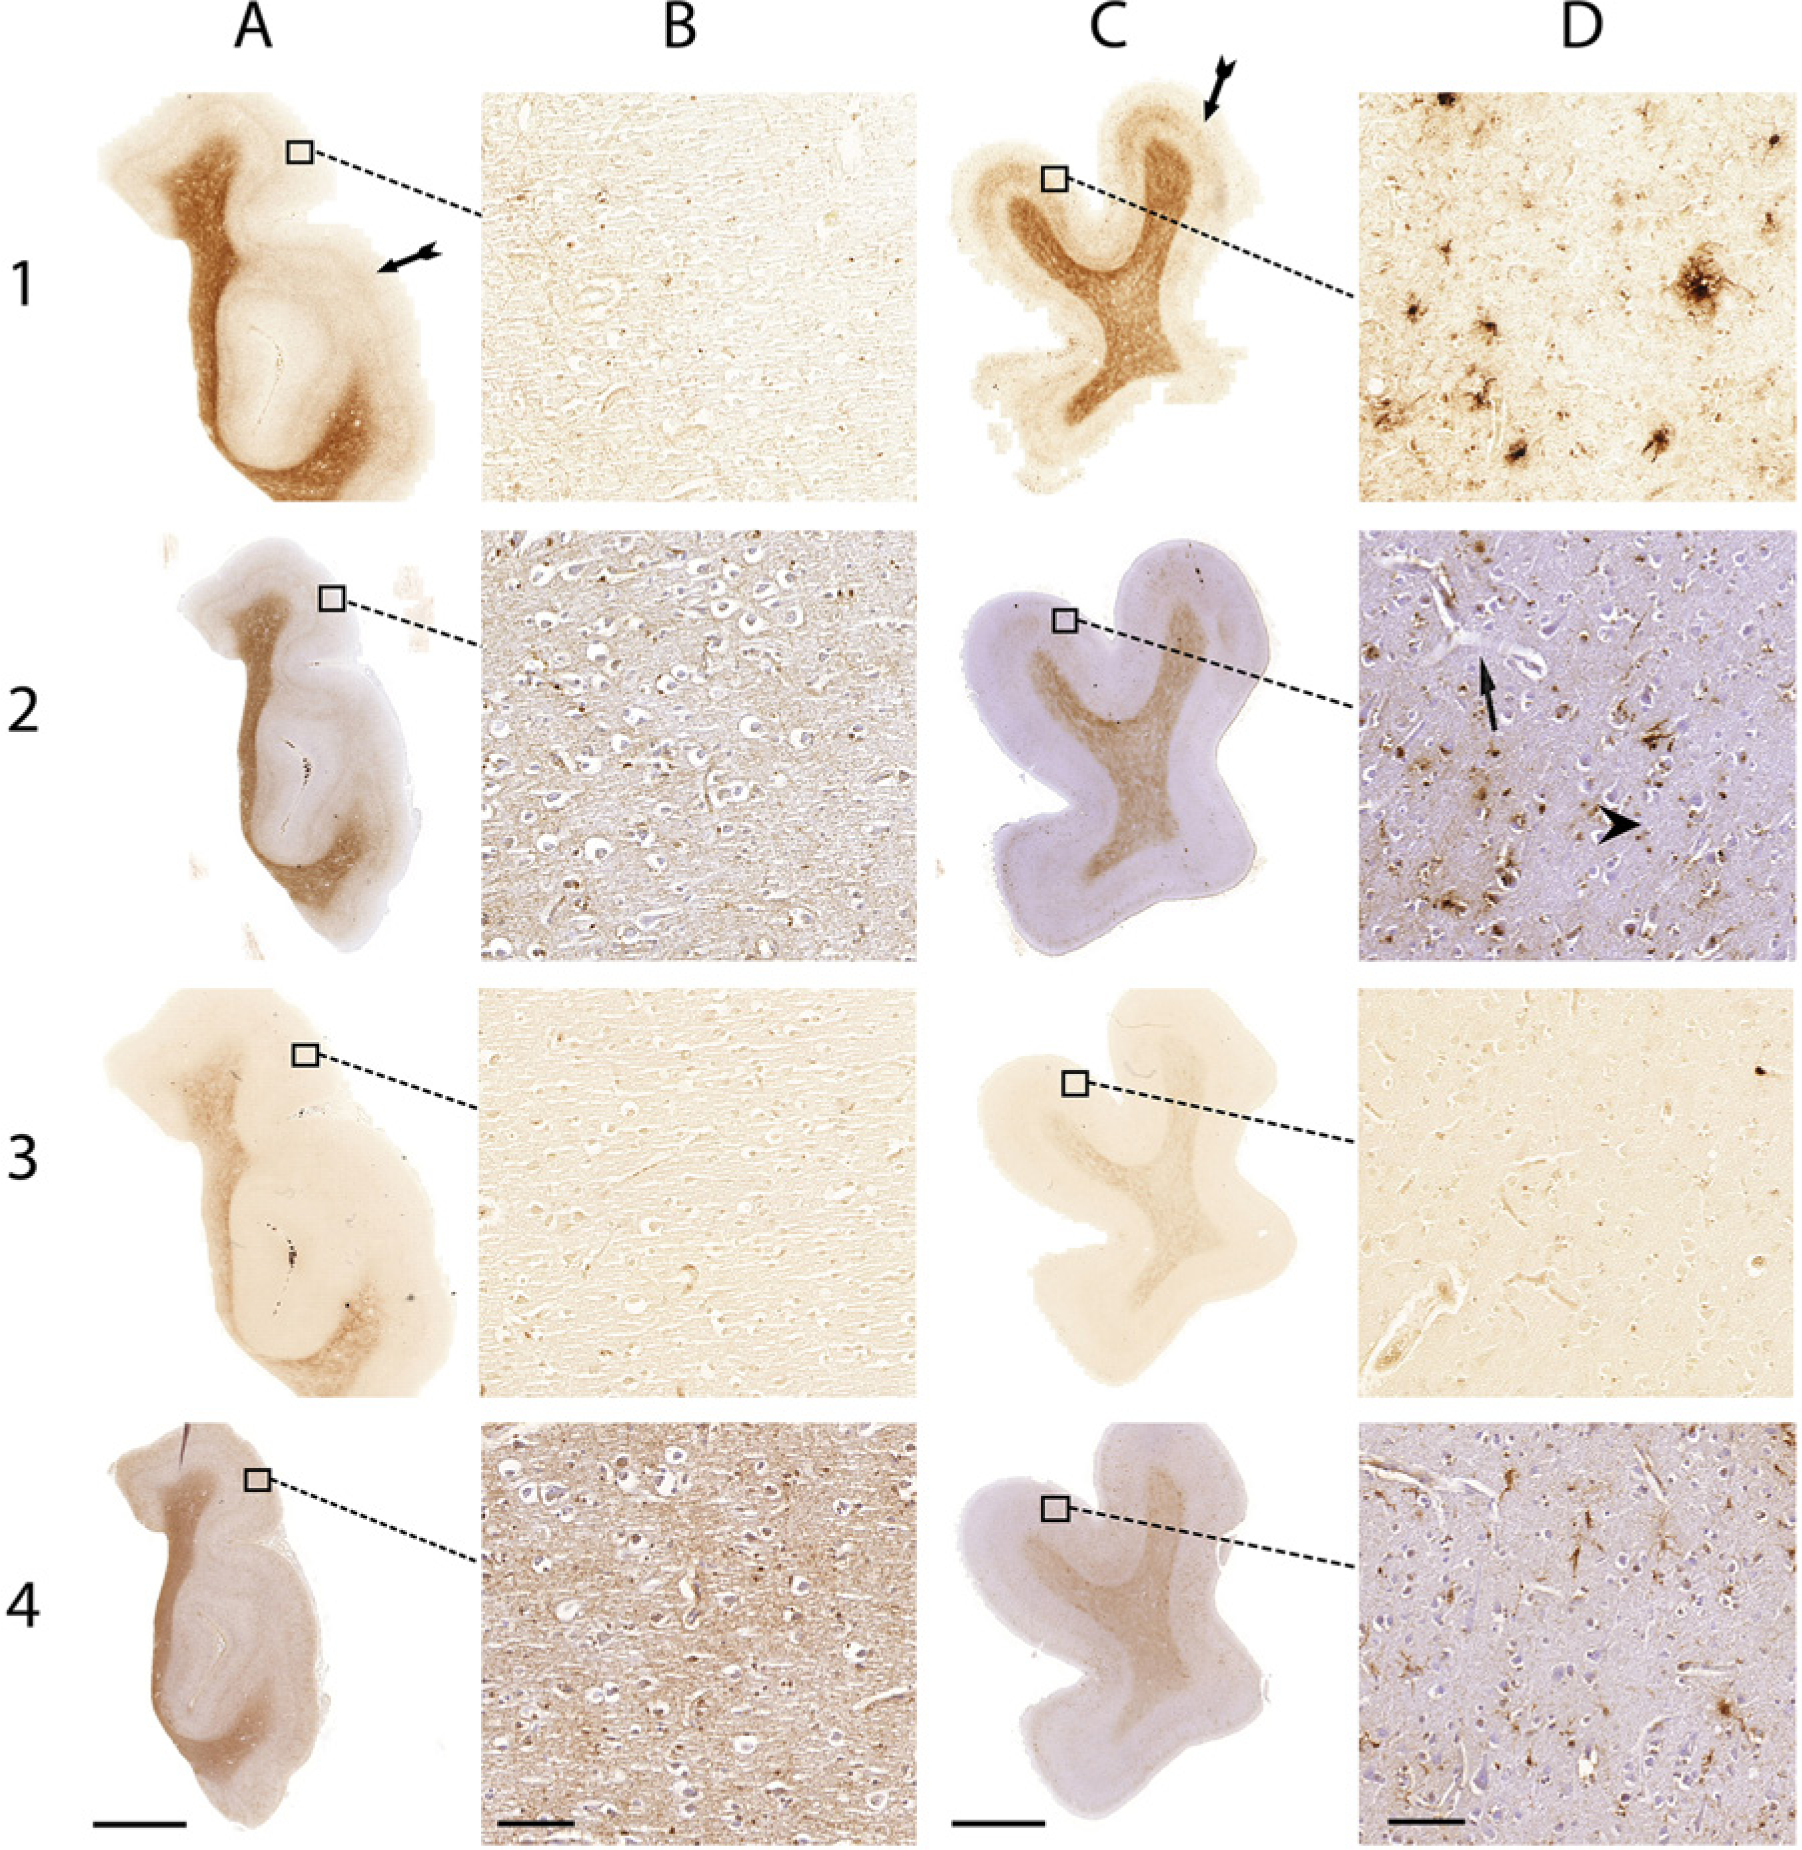
Comparison of the Meguro (1), Smith (2), LeVine (3) method and ferritin IHC (4) in control patients (A and B) and AD patients (C and D). (A) Whole section of a control patient; (B) 20× magnification of A; (C) whole section of an AD patient; (D) 20× magnification of C. Arrows indicate examples of iron-positive plaques; arrowheads indicate examples of microglia; double arrows show layers IV/V of the cortex. Bars A, C = 5000 µm; bars B, D = 100 µm.
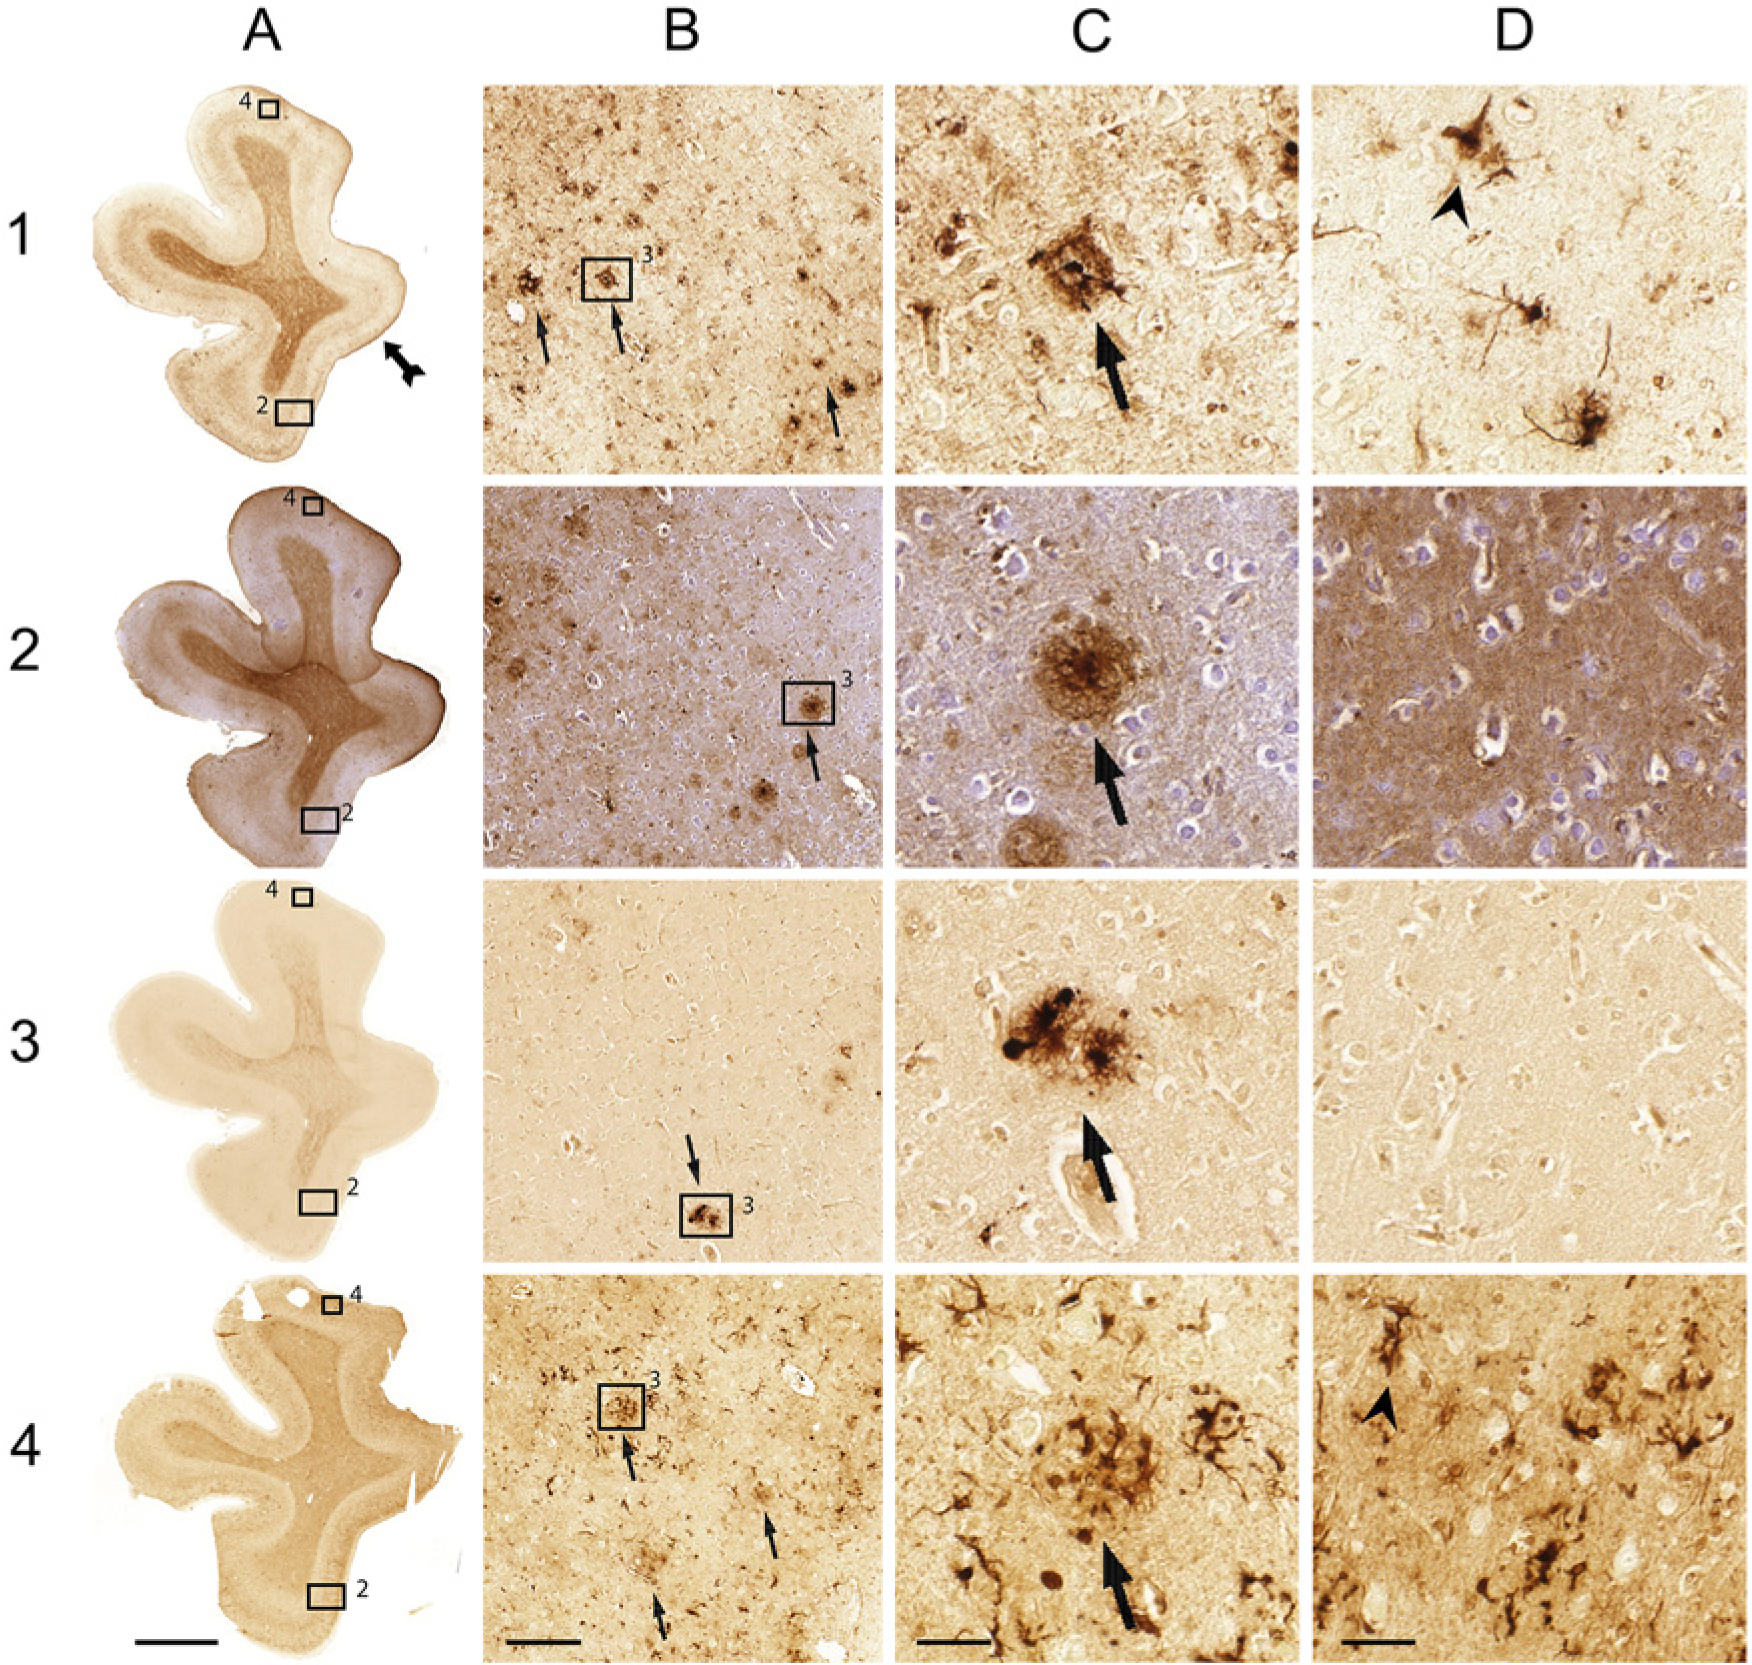
Comparison of the Meguro (1), Smith (2), LeVine (3) method and ferritin IHC (4) on AD tissue. (A) Whole section; (B) 10× magnification; (C) 40× magnification of 2; (D) 40× magnification. Arrows indicate examples of iron-positive plaques; arrowheads indicate examples of microglia; double arrows show layers IV/V of the cortex. Bar A = 5000 µm; bar B = 200 µm; bars C, D = 50 µm.
Comparison of LeVine, Smith, Meguro Iron Staining Methods and Ferritin Immunohistochemistry.
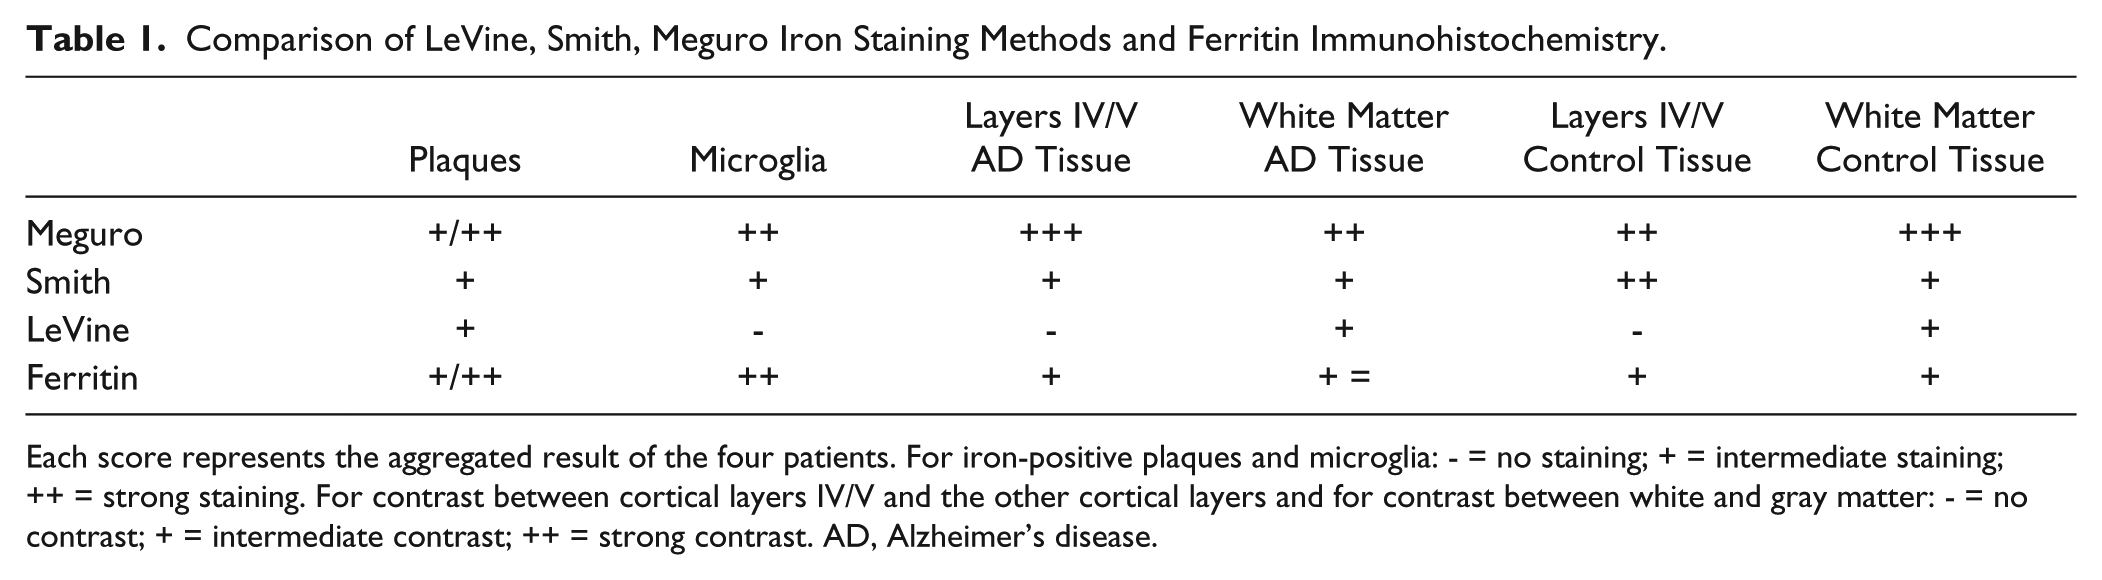
Each score represents the aggregated result of the four patients. For iron-positive plaques and microglia: - = no staining; + = intermediate staining; ++ = strong staining. For contrast between cortical layers IV/V and the other cortical layers and for contrast between white and gray matter: - = no contrast; + = intermediate contrast; ++ = strong contrast. AD, Alzheimer’s disease.
Comparison with Ferritin IHC
The Meguro method and ferritin IHC showed a comparable distribution and frequency of iron-positive plaques and microglia in AD tissue but the plaques looked different. Both methods showed plaques with clustered iron-positive microglia, but the extracellular parenchymal plaque deposits were labeled differently. The Meguro method showed intense and sharply circumscribed labeling of extracellular plaque deposits, whereas ferritin IHC showed weak, diffuse labeling of these deposits (Fig. 2). The contrast between white matter and cortex and the visibility of cortical layers IV/V was better using the Meguro iron stain than using ferritin IHC in both AD and control tissues. Higher concentrations of the antibody gave more background with less contrast between the different layers in the cortex and between the white matter and gray matter.
Iron Extraction
None of the three investigated procedures showed staining of any cell or structure in tissue after iron extraction (Fig. 3), but all showed their usual staining pattern in the parallel section without iron extraction as a pre-treatment. Only the LeVine method showed a light background staining and lacked contrast between white matter and gray matter.
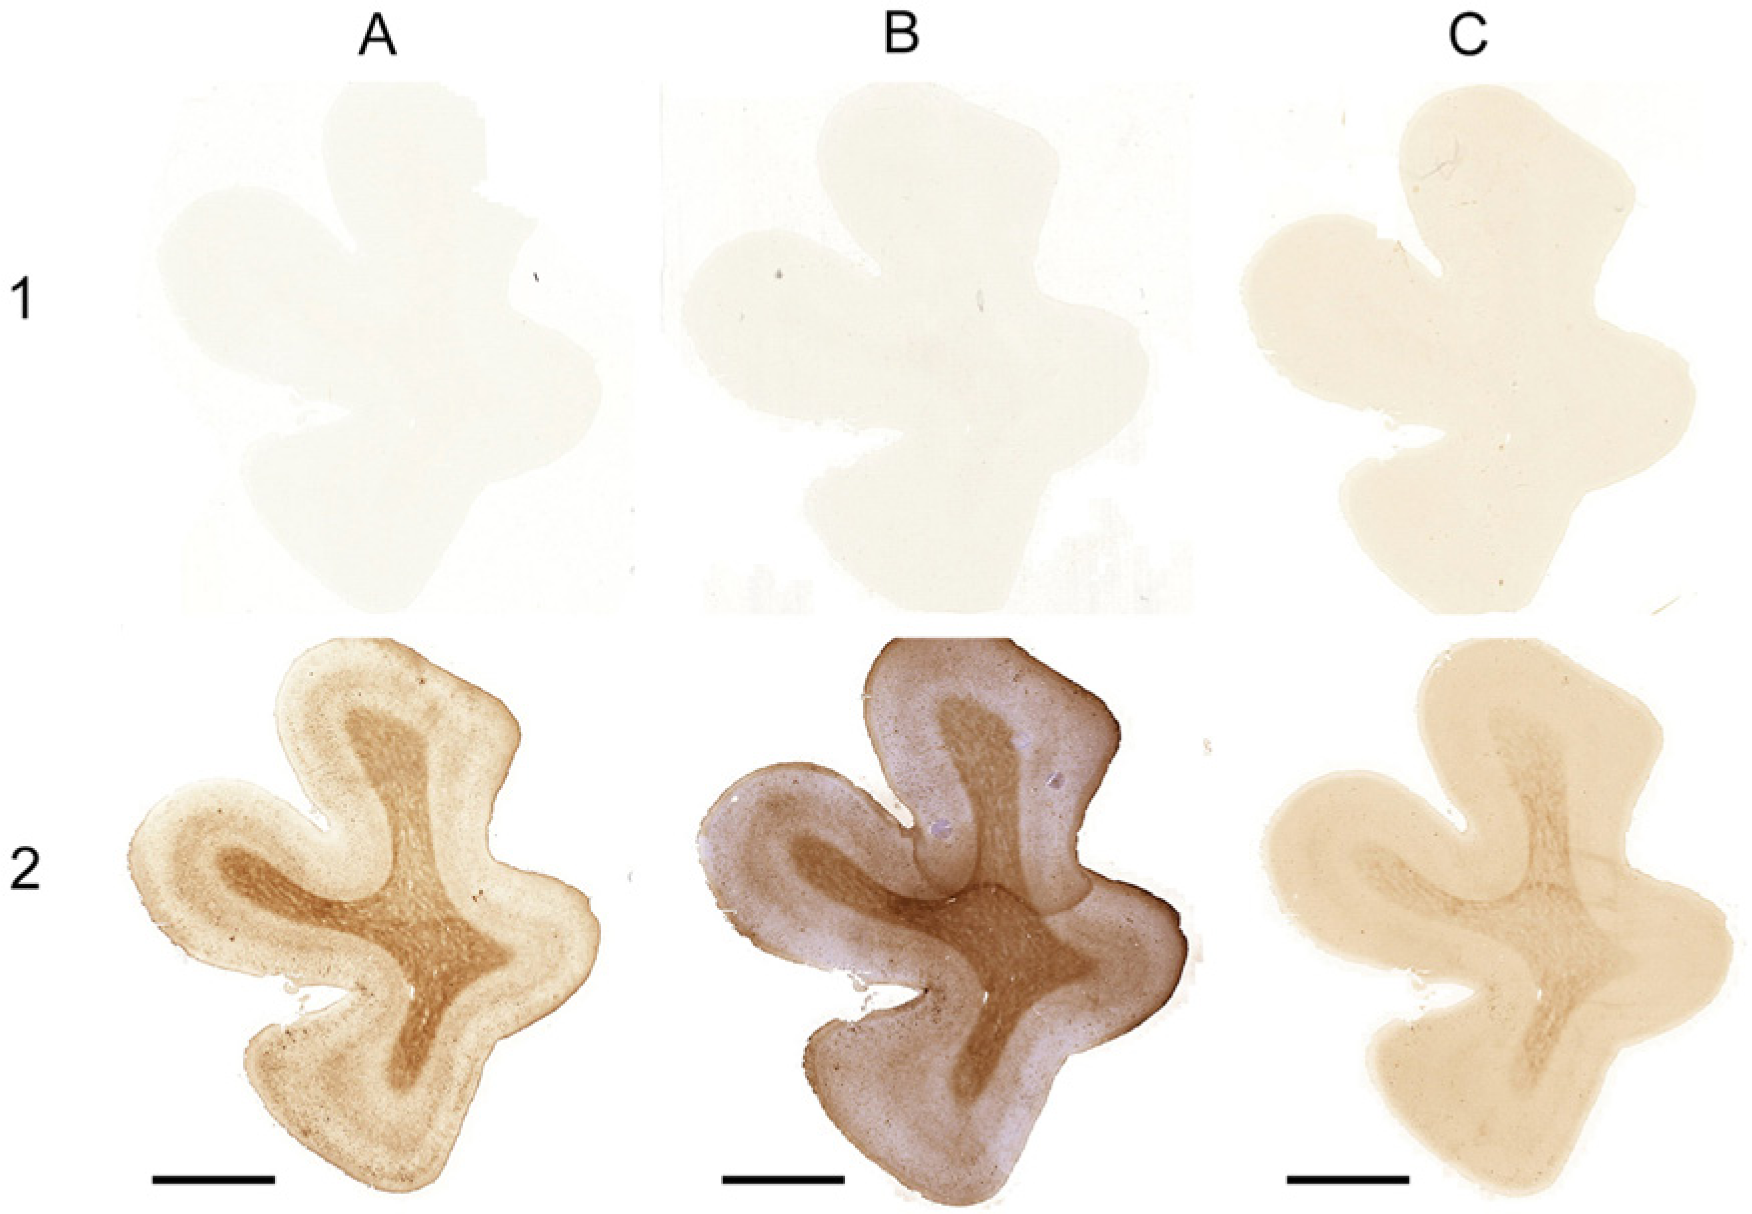
The Meguro (A), Smith (B), LeVine (C) methods with iron extraction as a pre-treatment (1) and without iron extraction as a pre-treatment (2) on AD tissue. Bars A–C = 5000 µm.
The buffer incubated with tissue showed much higher iron concentrations than buffer incubated on a glass slide without tissue, confirming iron extraction (Table 2).
Quantification of Iron Present in the Extraction Buffer after Incubation.
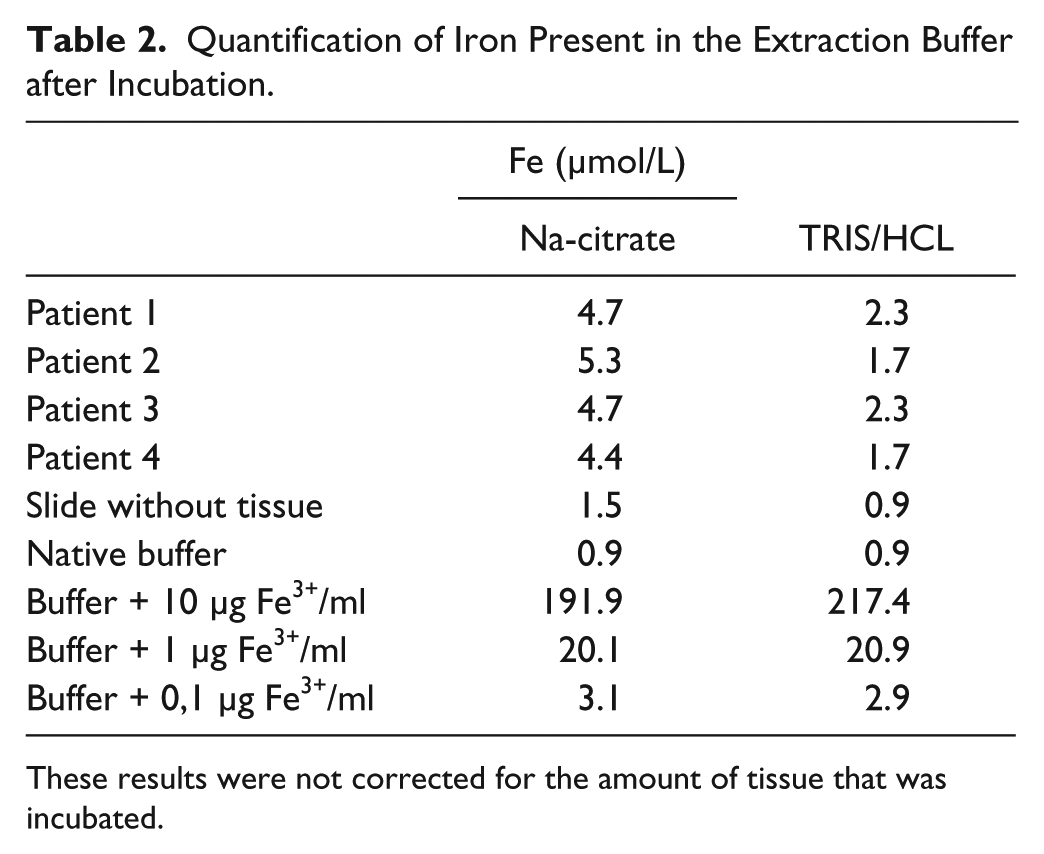
These results were not corrected for the amount of tissue that was incubated.
Iron extraction with Na-citrate/HCL buffer gave better results compared with the TRIS/HCL buffer on the tissue. However, after adding Fe3+ to the buffer, the results were better using TRIS/HCL as a buffer.
Discussion
To our knowledge, this is the first study to provide a direct comparison of three frequently used histochemical iron stains on human paraffin-embedded AD brain tissue and simultaneously investigate changes in the distribution of ferritin. We evaluated their ability to stain iron-containing plaques and microglia as well as myelin-associated iron. The method according to Meguro et al. (2007) resulted in the most robust and intense labeling of these iron-containing structures.
We are not aware of earlier studies using the Meguro method to visualize iron in human brain tissue, but it has been described for the detection of iron in paraffin-embedded tissue of rats, mice, monkeys, and guinea pigs (Meguro et al. 2005; Freret et al. 2008; Iwatsuki et al. 2008; Meguro et al. 2008; Butt et al. 2010; Winter et al. 2010; Butt et al. 2011; Shpyleva et al. 2011).
The Smith method (Smith et al. 1997) showed moderate amounts of microglia and plaques with less intensity than the Meguro stain. The staining of cortical layers IV and V was weak. With this method, plaques have been demonstrated on 6- to 8-µm paraffin sections (Smith et al. 1997; van Duijn et al. 2011). Labeling of iron in microglia has not been described in earlier reports. This method differs to that described by Meguro et al. in its exclusion of the methanol-NaN3-H2O2 treatment step between the ferrocyanide and DAB amplification step as well as the much longer (overnight vs. 30 min) incubation time, with a 7-fold higher concentration of ferrocyanide, and a shorter incubation with DAB at a 3× higher concentration. How these differences result in a less intense labeling of iron-positive structures than that by the Meguro method remains unclear. For the protocol used by Smith et al., methacarn fixation has been described to result in better iron labeling than formalin fixation. We performed the Smith protocol on formalin-fixed tissue because in our and most other laboratories, tissue is routinely fixed by formalin; thus, a general iron staining method should be optimized preferably for formalin fixed tissue.
The last technique, published by LeVine (1991), showed the least intense staining of the scored characteristics or no staining at all. Earlier studies showed plaques using this method on 60- to 100-µm free-floating sections (LeVine 1997; Meadowcroft et al. 2009) and iron-containing microglia in multiple sclerosis brains (LeVine 1997). No results of iron in layers IV/V have been reported using this method. The most likely explanation for the inferior labeling of plaques in the LeVine method compared to the other stains is our use of 10-µm de-paraffinized sections on glass slides, whereas the LeVine method has been developed for 60- to 100-µm free-floating sections (LeVine 1991; LeVine and Torres 1992; LeVine and Torres 1993). The absence of labeling of cortical layers IV and V may be due to the aggressive pre-treatment releasing iron from the myelin, which is slightly increased compared to the other layers.
Using the Meguro technique, the contrast between white and gray matter and between cortical layers IV/V and the other cortical layers was more intense than using ferritin IHC. This may be due to problems with antigen retrieval in myelin-containing tissue. A problem of antibody sensitivity seems unlikely because intracellular microglial staining is very strong and frequent in ferritin IHC, similar to that observed with the Meguro iron stain. The differences between the Meguro iron stain and the ferritin IHC remained when higher or lower ferritin antibody concentrations were used. Alternatively, there may be a true difference between the presence of iron and ferritin in myelin due to a relatively high non-ferritin-bound iron pool in the white matter and in cortical layers IV/V. Oligodendrocyte differentiation from oligodendrocyte precursor cells and myelin synthesis requires high iron concentrations, presumably because high amounts of enzymes with iron at their active sites are necessary (Todorich et al. 2009). The different labeling of plaques by the Meguro method and ferritin IHC is possibly caused by binding of iron to some of the many molecules other than ferritin in the extracellular compartment of plaques (Grundke-Iqbal et al. 1990; Connor et al. 1995).
The specificity of the tested histochemical iron stains was checked by using sections depleted of iron in acid buffer as a negative control. The absence of iron staining in these iron-depleted sections confirms the results of another study using the Smith protocol on iron-depleted sections (Smith et al. 2007). Staining of other metals in brain is not completely excluded by these experiments, but other studies report the absence of DAB oxidation in reaction products of ferrocyanide with copper, zinc, or magnesium (Meguro et al. 2003; Meguro et al. 2007; Roschzttardtz et al. 2009). All this information supports that the modified, DAB-enhanced Perl’s stainings used in this study are specific for iron ions.
Detailed knowledge of iron distribution in brain tissue may be of value for improving in vivo (MRI) diagnostics in AD and for a more complete picture of the pathogenesis of AD. In addition, it may also reflect normal brain aging (Bartzokis, Tishler, et al. 2007; Pfefferbaum et al. 2010) and the presence of other neurodegenerative diseases such as Parkinson’s disease (Loeffler et al. 1995; Brar et al. 2009), Lewy body disease (Tuite et al. 1996; Golts et al. 2002), and Huntington’s disease (Bartzokis, Lu, et al. 2007; Rosas et al. 2012). Although the present study was done on AD brain tissue, the results may be of use for the choice of iron stain in these other neurodegenerative diseases.
In conclusion, the results of this study suggest that the Meguro method is the best technique to stain iron in 10-mm formalin-fixed paraffin sections of human brain tissue. Ferritin IHC is a good alternative for demonstrating iron in microglia and, to a lesser amount, plaques but is somewhat less suitable for staining myelin-associated iron.
Footnotes
Acknowledgements
The authors thank I. Hegeman-Kleinn for her excellent technical assistance.
Declaration of Conflicting Interests
The author(s) declared no potential conflicts of interest with respect to the research, authorship, and/or publication of this article.
Funding
The author(s) received no financial support for the research, authorship, and/or publication of this article.